20110923 mankiw economics chap22 frontiers of microeconomics
Upload
edmund-bruceCategory
view
220download
0
CFA LEVEL II ECONOMICSStudy Session 4: Economics for Valuation
June 2014
New Frontiers Learning Center
Lagos
2
Coverage
• Reading 14: Currency Exchange Rate: Determination and Forecasting
• Reading 15: Economic Growth and the Investment Decision
• Reading 16: Economics of Regulation
Topic Level Learning OutcomesThe candidate should be able to explain and demonstrate the use of economic
concepts and methods in the determination and forecasting of currency exchange rates, the analysis of economic growth, the analysis of business and financial
market regulation, and the evaluation of investment markets.
4
3
Reading 14Currency Exchange Rates: Determination and Forecasting
Learning Outcomes
a. Calculate and interpret the bid-ask spread on a spot or forward foreign currency and describe the factors that affect the bid-offer spread
b. Identify a triangular arbitrage opportunity and calculate its profits, given the bid-offer quotations for three currencies
c. Distinguish between spot and forward rates and calculate the forward premium/discount for a given currency
d. Calculate the mark-to-market value of a forward contract
e. Explain international parity relations (covered and uncovered interest rate parity, purchasing power parity and international Fishers effect
f. Describe relations among the international parity conditions
g. Evaluate the use of current spot rate, the forward rate, purchasing power parity, and uncovered interest rate parity to forecast future spot exchange rates
h. Explain approaches to assessing the long-run fair value of exchange rates
i. Describe the carry trade and its relation to uncovered interest rate parity and calculate the profit from a carry trade
j. Explain how flows in the balance of payment accounts affect currency exchange rates
k. Describe the Mundell-Fleming model, the monetary approach, and the asset market (portfolio balance) approach to exchange rate determination
l. Forecast the direction of expected change in an exchange rate based on balance of payment, Mundell-Fleming, monetary, and asset market approaches to exchange rate determination
m. Explain the potential effects of monetary and fiscal policy on exchange rates
4
Reading 14Currency Exchange Rates: Determination and Forecasting
Learning Outcomes (cont…)
n. Describe objectives of central bank intervention and capital controls and describe the effectiveness of intervention and capital controls
o. Describe warning signs of a currency crisis
p. Describe uses of technical analysis in forecasting exchange rate
5
Introduction
Alan Greenspan, former U.S Federal Reserve
chairman
“Having endeavored to forecast exchange rates
for more than half a century, I have understandably
developed significant humility about my ability
in this area”
“If you think writing about the fortunes of the stock
market is tricky, try getting your arms around
currencies”
Bill Gross, Co-founder and co-chief investment officer
at PIMCO
6
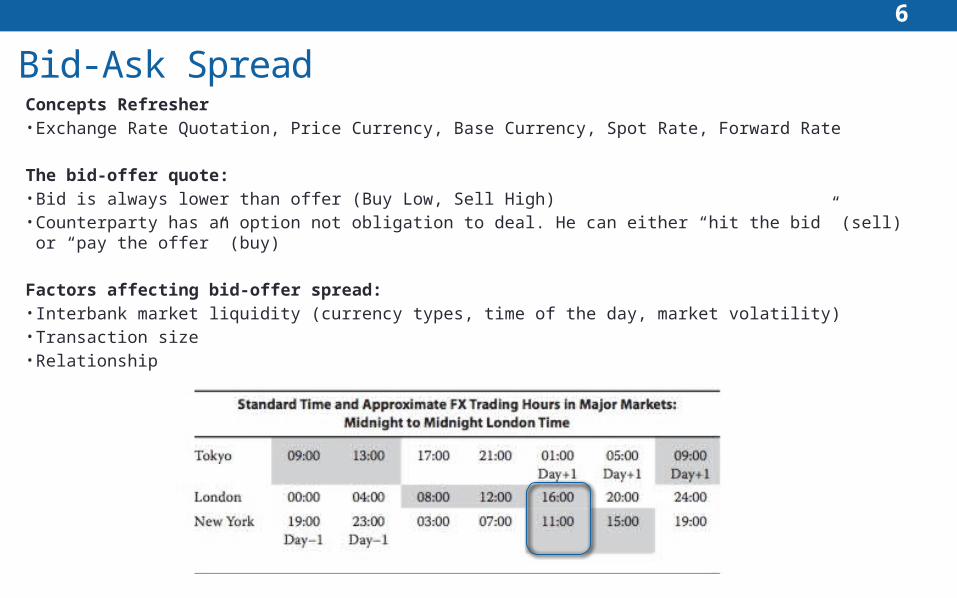
Bid-Ask SpreadConcepts Refresher• Exchange Rate Quotation, Price Currency, Base Currency, Spot Rate, Forward Rate
The bid-offer quote:• Bid is always lower than offer (Buy Low, Sell High)• Counterparty has an option not obligation to deal. He can either “hit the bid” (sell) or “pay the offer” (buy)
Factors affecting bid-offer spread: • Interbank market liquidity (currency types, time of the day, market volatility)• Transaction size • Relationship
7
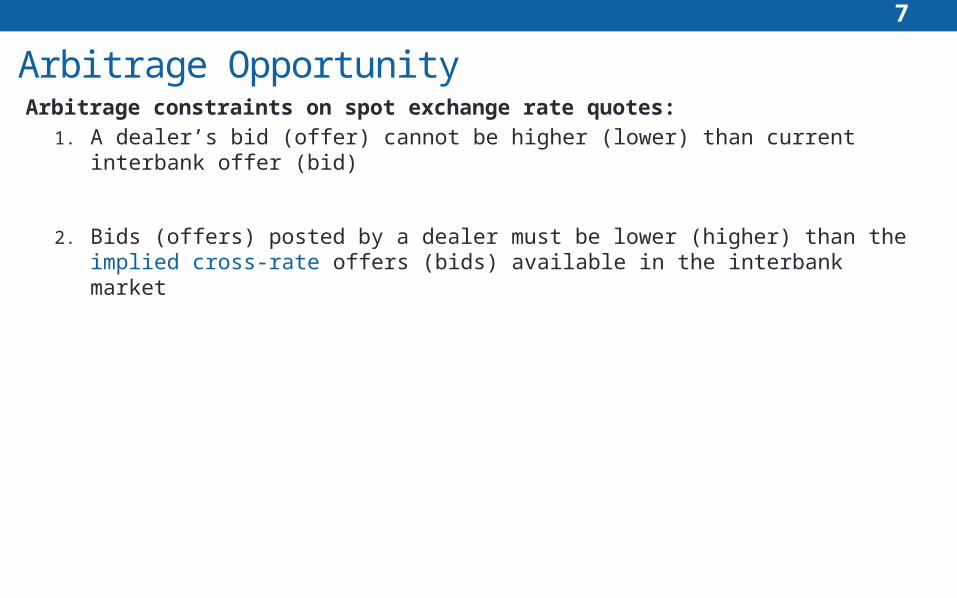
Arbitrage OpportunityArbitrage constraints on spot exchange rate quotes:
1. A dealer’s bid (offer) cannot be higher (lower) than current interbank offer (bid)
2. Bids (offers) posted by a dealer must be lower (higher) than the implied cross-rate offers (bids) available in the interbank market
8
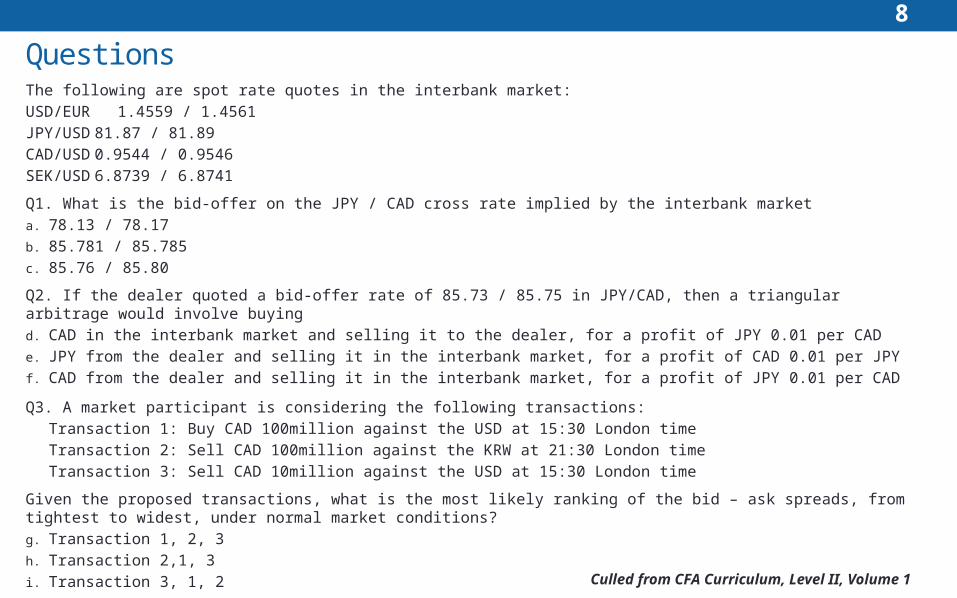
QuestionsThe following are spot rate quotes in the interbank market:
USD/EUR 1.4559 / 1.4561
JPY/USD 81.87 / 81.89
CAD/USD 0.9544 / 0.9546
SEK/USD 6.8739 / 6.8741
Q1. What is the bid-offer on the JPY / CAD cross rate implied by the interbank market
a. 78.13 / 78.17
b. 85.781 / 85.785
c. 85.76 / 85.80
Q2. If the dealer quoted a bid-offer rate of 85.73 / 85.75 in JPY/CAD, then a triangular arbitrage would involve buying
d. CAD in the interbank market and selling it to the dealer, for a profit of JPY 0.01 per CAD
e. JPY from the dealer and selling it in the interbank market, for a profit of CAD 0.01 per JPY
f. CAD from the dealer and selling it in the interbank market, for a profit of JPY 0.01 per CAD
Q3. A market participant is considering the following transactions:
Transaction 1: Buy CAD 100million against the USD at 15:30 London time
Transaction 2: Sell CAD 100million against the KRW at 21:30 London time
Transaction 3: Sell CAD 10million against the USD at 15:30 London time
Given the proposed transactions, what is the most likely ranking of the bid – ask spreads, from tightest to widest, under normal market conditions?
g. Transaction 1, 2, 3
h. Transaction 2,1, 3
i. Transaction 3, 1, 2
Culled from CFA Curriculum, Level II, Volume 1
9
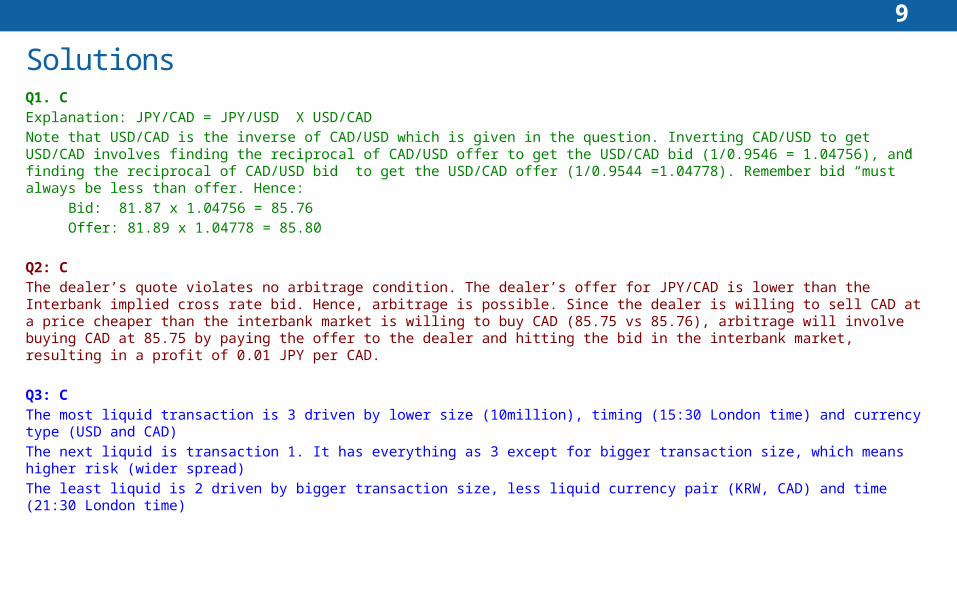
SolutionsQ1. C
Explanation: JPY/CAD = JPY/USD X USD/CAD
Note that USD/CAD is the inverse of CAD/USD which is given in the question. Inverting CAD/USD to get USD/CAD involves finding the reciprocal of CAD/USD offer to get the USD/CAD bid (1/0.9546 = 1.04756), and finding the reciprocal of CAD/USD bid to get the USD/CAD offer (1/0.9544 =1.04778). Remember bid “must” always be less than offer. Hence:
Bid: 81.87 x 1.04756 = 85.76
Offer: 81.89 x 1.04778 = 85.80
Q2: C
The dealer’s quote violates no arbitrage condition. The dealer’s offer for JPY/CAD is lower than the Interbank implied cross rate bid. Hence, arbitrage is possible. Since the dealer is willing to sell CAD at a price cheaper than the interbank market is willing to buy CAD (85.75 vs 85.76), arbitrage will involve buying CAD at 85.75 by paying the offer to the dealer and hitting the bid in the interbank market, resulting in a profit of 0.01 JPY per CAD.
Q3: C
The most liquid transaction is 3 driven by lower size (10million), timing (15:30 London time) and currency type (USD and CAD)
The next liquid is transaction 1. It has everything as 3 except for bigger transaction size, which means higher risk (wider spread)
The least liquid is 2 driven by bigger transaction size, less liquid currency pair (KRW, CAD) and time (21:30 London time)
10
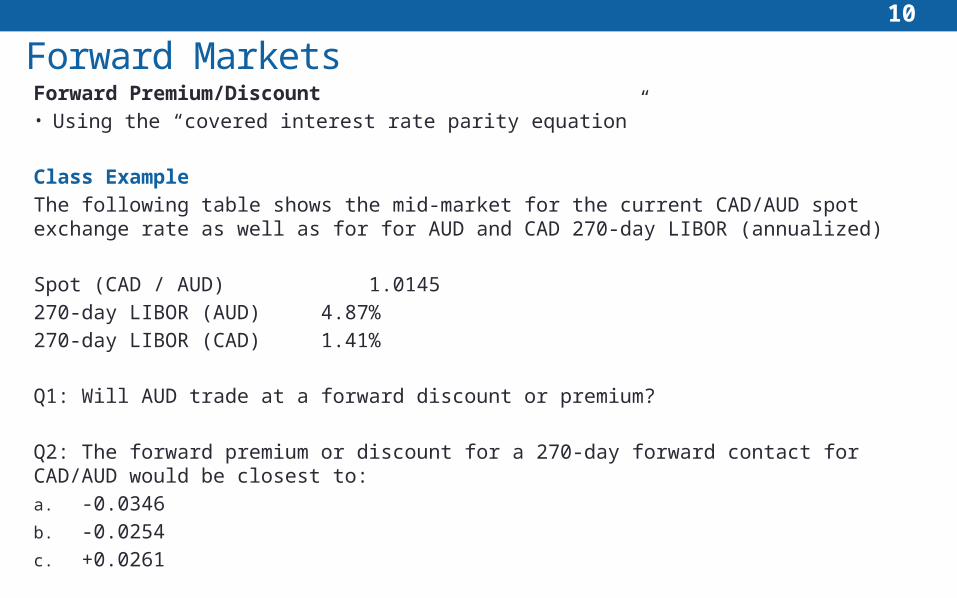
Forward MarketsForward Premium/Discount • Using the “covered interest rate parity equation”
Class Example
The following table shows the mid-market for the current CAD/AUD spot exchange rate as well as for for AUD and CAD 270-day LIBOR (annualized)
Spot (CAD / AUD) 1.0145
270-day LIBOR (AUD) 4.87%
270-day LIBOR (CAD) 1.41%
Q1: Will AUD trade at a forward discount or premium?
Q2: The forward premium or discount for a 270-day forward contact for CAD/AUD would be closest to:
a. -0.0346
b. -0.0254
c. +0.0261
11
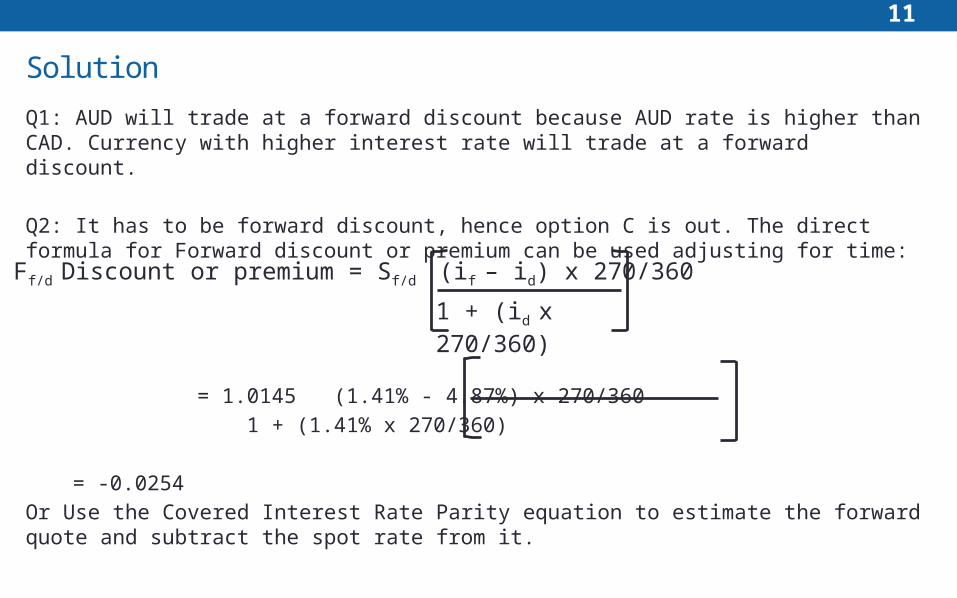
Solution
Q1: AUD will trade at a forward discount because AUD rate is higher than CAD. Currency with higher interest rate will trade at a forward discount.
Q2: It has to be forward discount, hence option C is out. The direct formula for Forward discount or premium can be used adjusting for time:
= 1.0145 (1.41% - 4.87%) x 270/360
1 + (1.41% x 270/360)
= -0.0254
Or Use the Covered Interest Rate Parity equation to estimate the forward quote and subtract the spot rate from it.
Ff/d Discount or premium = Sf/d (if – id) x 270/360
1 + (id x 270/360)
12
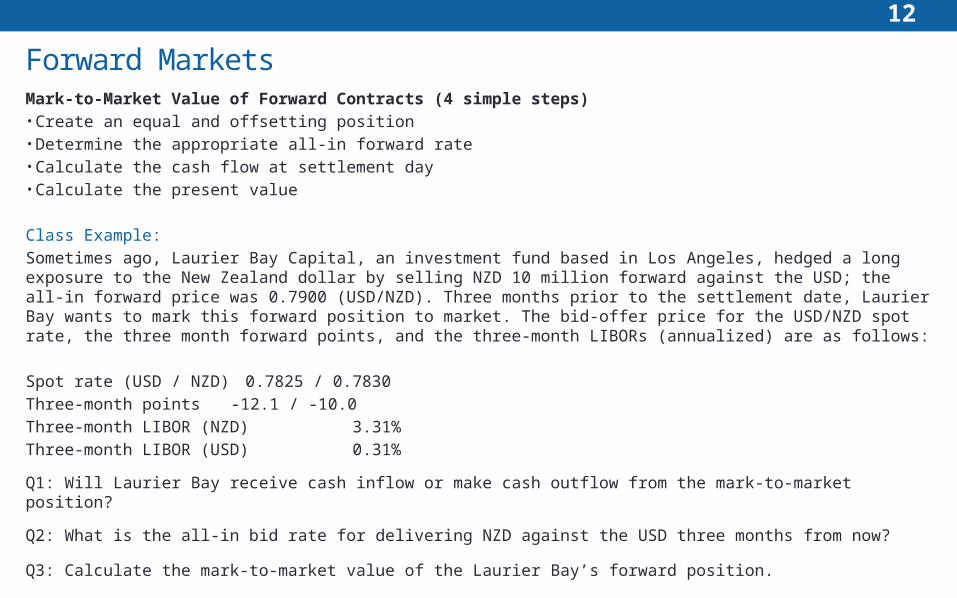
Forward MarketsMark-to-Market Value of Forward Contracts (4 simple steps)• Create an equal and offsetting position• Determine the appropriate all-in forward rate• Calculate the cash flow at settlement day• Calculate the present value
Class Example:
Sometimes ago, Laurier Bay Capital, an investment fund based in Los Angeles, hedged a long exposure to the New Zealand dollar by selling NZD 10 million forward against the USD; the all-in forward price was 0.7900 (USD/NZD). Three months prior to the settlement date, Laurier Bay wants to mark this forward position to market. The bid-offer price for the USD/NZD spot rate, the three month forward points, and the three-month LIBORs (annualized) are as follows:
Spot rate (USD / NZD) 0.7825 / 0.7830
Three-month points -12.1 / -10.0
Three-month LIBOR (NZD) 3.31%
Three-month LIBOR (USD) 0.31%
Q1: Will Laurier Bay receive cash inflow or make cash outflow from the mark-to-market position?
Q2: What is the all-in bid rate for delivering NZD against the USD three months from now?
Q3: Calculate the mark-to-market value of the Laurier Bay’s forward position.
13
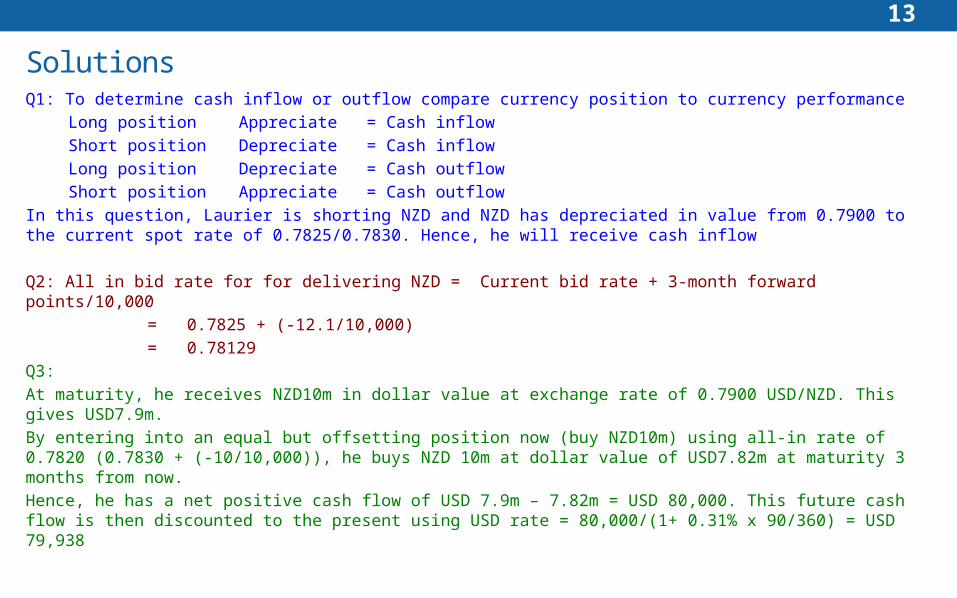
SolutionsQ1: To determine cash inflow or outflow compare currency position to currency performance
Long position Appreciate = Cash inflow
Short position Depreciate = Cash inflow
Long position Depreciate = Cash outflow
Short position Appreciate = Cash outflow
In this question, Laurier is shorting NZD and NZD has depreciated in value from 0.7900 to the current spot rate of 0.7825/0.7830. Hence, he will receive cash inflow
Q2: All in bid rate for for delivering NZD = Current bid rate + 3-month forward points/10,000
= 0.7825 + (-12.1/10,000)
= 0.78129
Q3:
At maturity, he receives NZD10m in dollar value at exchange rate of 0.7900 USD/NZD. This gives USD7.9m.
By entering into an equal but offsetting position now (buy NZD10m) using all-in rate of 0.7820 (0.7830 + (-10/10,000)), he buys NZD 10m at dollar value of USD7.82m at maturity 3 months from now.
Hence, he has a net positive cash flow of USD 7.9m – 7.82m = USD 80,000. This future cash flow is then discounted to the present using USD rate = 80,000/(1+ 0.31% x 90/360) = USD 79,938
14
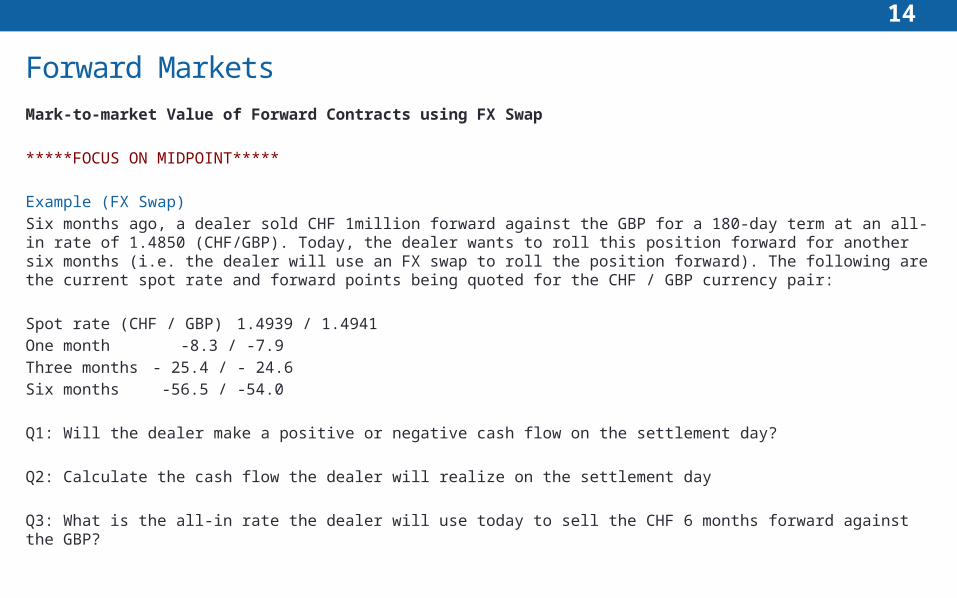
Forward Markets
Mark-to-market Value of Forward Contracts using FX Swap
*****FOCUS ON MIDPOINT*****
Example (FX Swap)Six months ago, a dealer sold CHF 1million forward against the GBP for a 180-day term at an all-in rate of 1.4850 (CHF/GBP). Today, the dealer wants to roll this position forward for another six months (i.e. the dealer will use an FX swap to roll the position forward). The following are the current spot rate and forward points being quoted for the CHF / GBP currency pair:
Spot rate (CHF / GBP) 1.4939 / 1.4941One month -8.3 / -7.9Three months - 25.4 / - 24.6Six months -56.5 / -54.0
Q1: Will the dealer make a positive or negative cash flow on the settlement day?
Q2: Calculate the cash flow the dealer will realize on the settlement day
Q3: What is the all-in rate the dealer will use today to sell the CHF 6 months forward against the GBP?
15
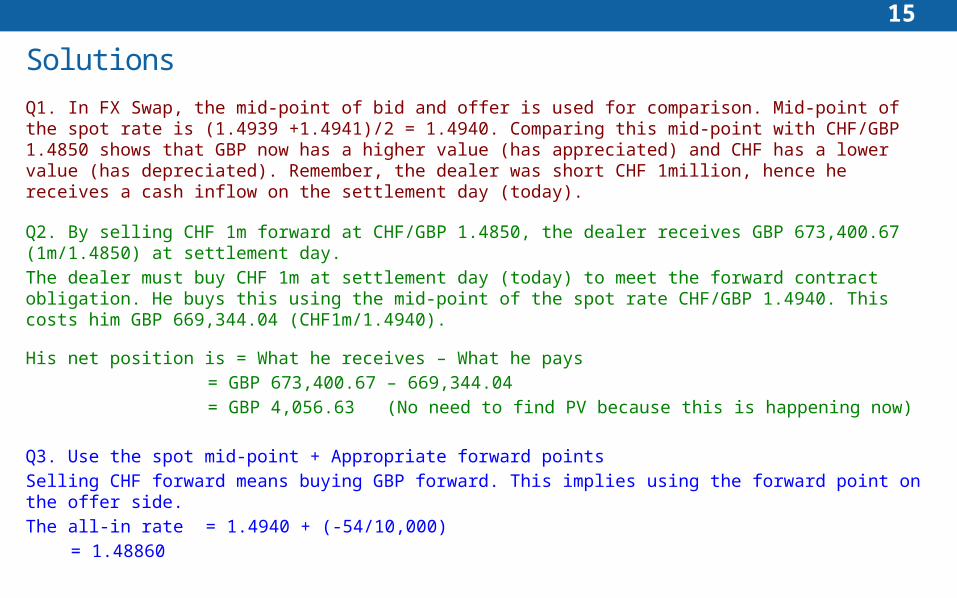
Solutions
Q1. In FX Swap, the mid-point of bid and offer is used for comparison. Mid-point of the spot rate is (1.4939 +1.4941)/2 = 1.4940. Comparing this mid-point with CHF/GBP 1.4850 shows that GBP now has a higher value (has appreciated) and CHF has a lower value (has depreciated). Remember, the dealer was short CHF 1million, hence he receives a cash inflow on the settlement day (today).
Q2. By selling CHF 1m forward at CHF/GBP 1.4850, the dealer receives GBP 673,400.67 (1m/1.4850) at settlement day.
The dealer must buy CHF 1m at settlement day (today) to meet the forward contract obligation. He buys this using the mid-point of the spot rate CHF/GBP 1.4940. This costs him GBP 669,344.04 (CHF1m/1.4940).
His net position is = What he receives – What he pays
= GBP 673,400.67 – 669,344.04
= GBP 4,056.63 (No need to find PV because this is happening now)
Q3. Use the spot mid-point + Appropriate forward points
Selling CHF forward means buying GBP forward. This implies using the forward point on the offer side.
The all-in rate = 1.4940 + (-54/10,000)
= 1.48860
16
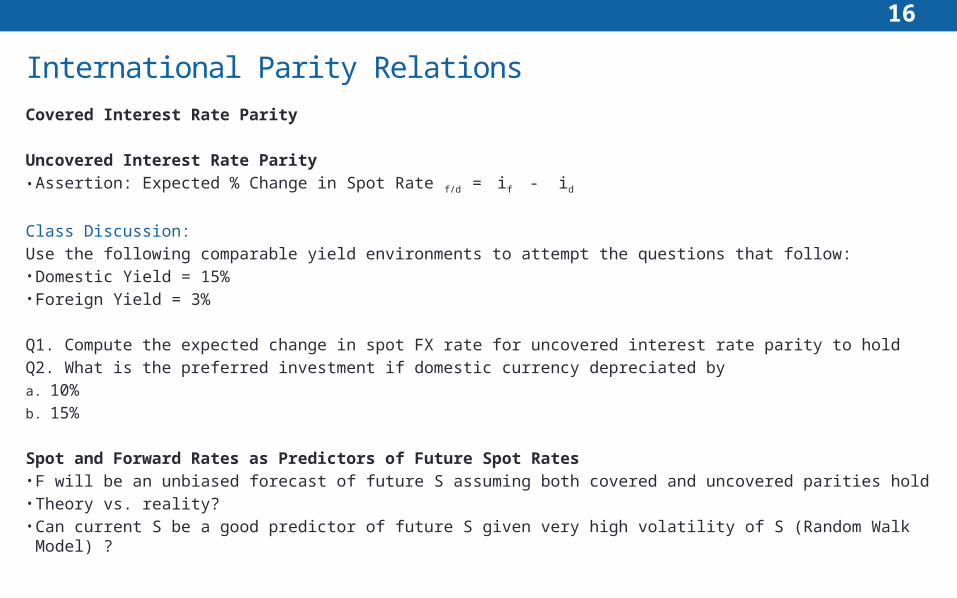
International Parity Relations
Covered Interest Rate Parity
Uncovered Interest Rate Parity • Assertion: Expected % Change in Spot Rate f/d = if - id
Class Discussion:
Use the following comparable yield environments to attempt the questions that follow:• Domestic Yield = 15%• Foreign Yield = 3%
Q1. Compute the expected change in spot FX rate for uncovered interest rate parity to hold
Q2. What is the preferred investment if domestic currency depreciated by
a. 10%
b. 15%
Spot and Forward Rates as Predictors of Future Spot Rates• F will be an unbiased forecast of future S assuming both covered and uncovered parities hold• Theory vs. reality?• Can current S be a good predictor of future S given very high volatility of S (Random Walk Model) ?
17
International Parity RelationsQuestions
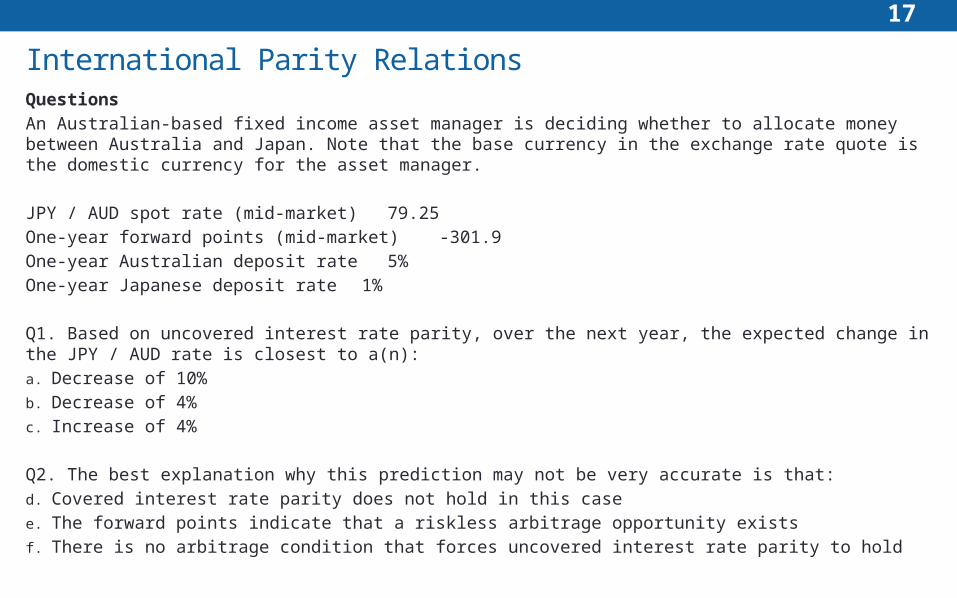
An Australian-based fixed income asset manager is deciding whether to allocate money between Australia and Japan. Note that the base currency in the exchange rate quote is the domestic currency for the asset manager.
JPY / AUD spot rate (mid-market) 79.25
One-year forward points (mid-market) -301.9
One-year Australian deposit rate 5%
One-year Japanese deposit rate 1%
Q1. Based on uncovered interest rate parity, over the next year, the expected change in the JPY / AUD rate is closest to a(n):
a. Decrease of 10%
b. Decrease of 4%
c. Increase of 4%
Q2. The best explanation why this prediction may not be very accurate is that:
d. Covered interest rate parity does not hold in this case
e. The forward points indicate that a riskless arbitrage opportunity exists
f. There is no arbitrage condition that forces uncovered interest rate parity to hold
18
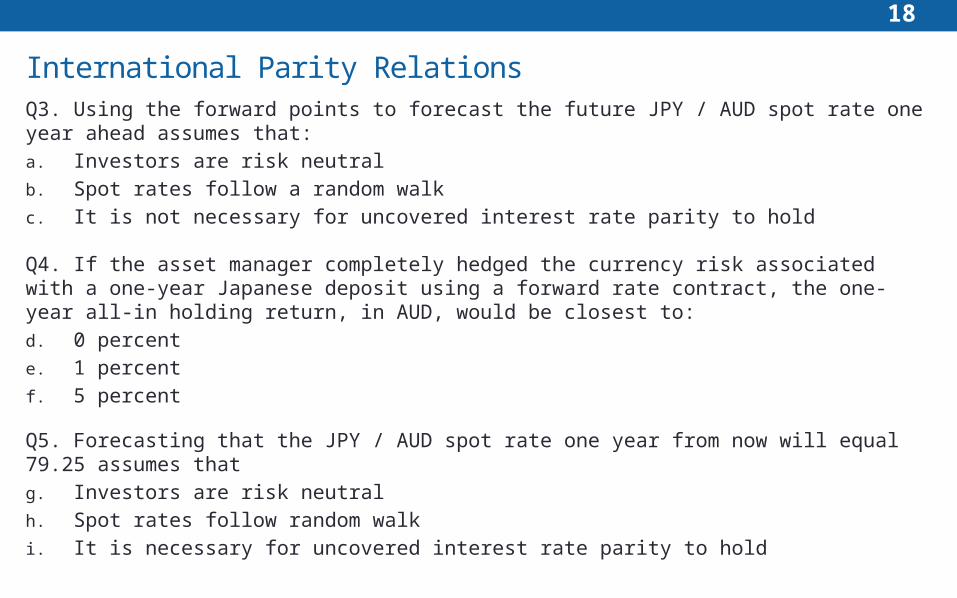
International Parity RelationsQ3. Using the forward points to forecast the future JPY / AUD spot rate one year ahead assumes that:
a. Investors are risk neutral
b. Spot rates follow a random walk
c. It is not necessary for uncovered interest rate parity to hold
Q4. If the asset manager completely hedged the currency risk associated with a one-year Japanese deposit using a forward rate contract, the one-year all-in holding return, in AUD, would be closest to:
d. 0 percent
e. 1 percent
f. 5 percent
Q5. Forecasting that the JPY / AUD spot rate one year from now will equal 79.25 assumes that
g. Investors are risk neutral
h. Spot rates follow random walk
i. It is necessary for uncovered interest rate parity to hold
19
International Parity Relations
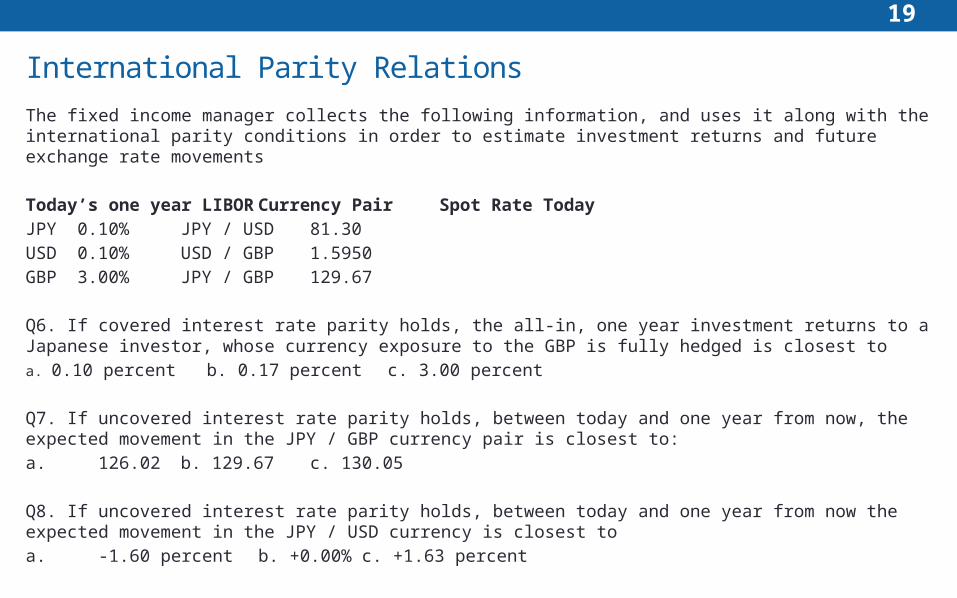
The fixed income manager collects the following information, and uses it along with the international parity conditions in order to estimate investment returns and future exchange rate movements
Today’s one year LIBOR Currency Pair Spot Rate Today
JPY 0.10% JPY / USD 81.30
USD 0.10% USD / GBP 1.5950
GBP 3.00% JPY / GBP 129.67
Q6. If covered interest rate parity holds, the all-in, one year investment returns to a Japanese investor, whose currency exposure to the GBP is fully hedged is closest to
a. 0.10 percent b. 0.17 percent c. 3.00 percent
Q7. If uncovered interest rate parity holds, between today and one year from now, the expected movement in the JPY / GBP currency pair is closest to:
a. 126.02 b. 129.67 c. 130.05
Q8. If uncovered interest rate parity holds, between today and one year from now the expected movement in the JPY / USD currency is closest to
a. -1.60 percent b. +0.00% c. +1.63 percent
20
International Parity Relations
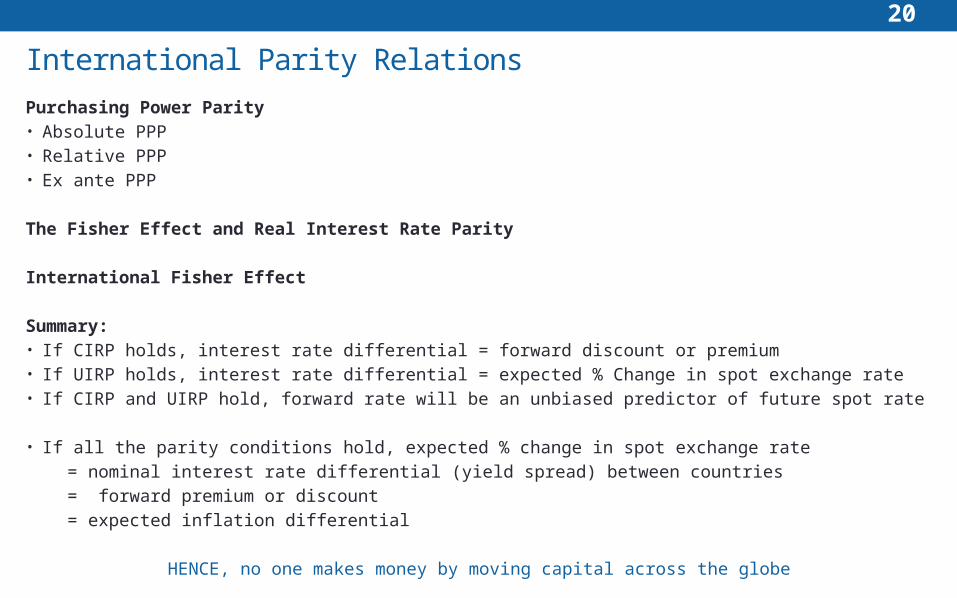
Purchasing Power Parity• Absolute PPP• Relative PPP• Ex ante PPP
The Fisher Effect and Real Interest Rate Parity
International Fisher Effect
Summary: • If CIRP holds, interest rate differential = forward discount or premium• If UIRP holds, interest rate differential = expected % Change in spot exchange rate• If CIRP and UIRP hold, forward rate will be an unbiased predictor of future spot rate
• If all the parity conditions hold, expected % change in spot exchange rate
= nominal interest rate differential (yield spread) between countries
= forward premium or discount
= expected inflation differential
HENCE, no one makes money by moving capital across the globe
21
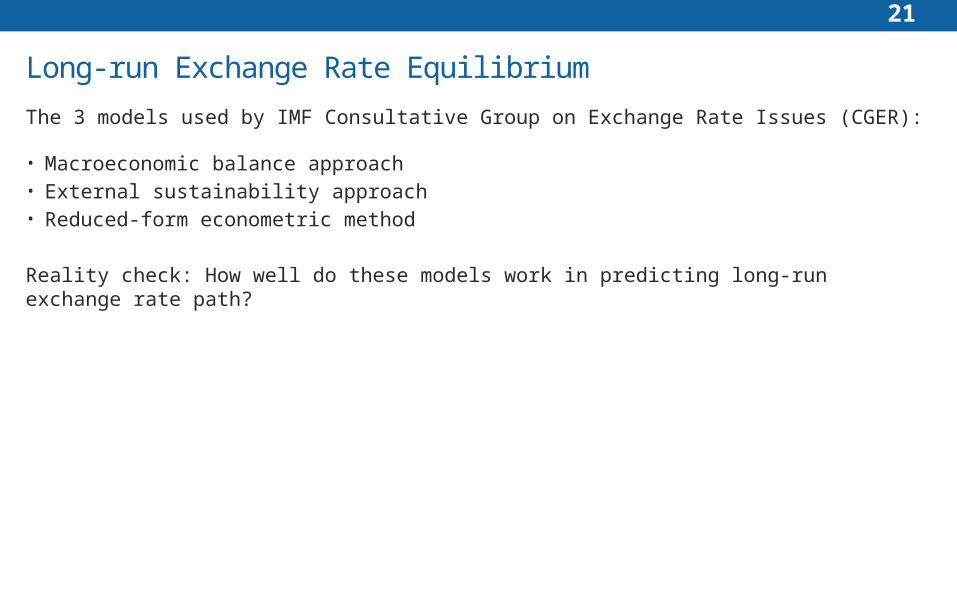
Long-run Exchange Rate Equilibrium
The 3 models used by IMF Consultative Group on Exchange Rate Issues (CGER):
• Macroeconomic balance approach• External sustainability approach• Reduced-form econometric method
Reality check: How well do these models work in predicting long-run exchange rate path?
22
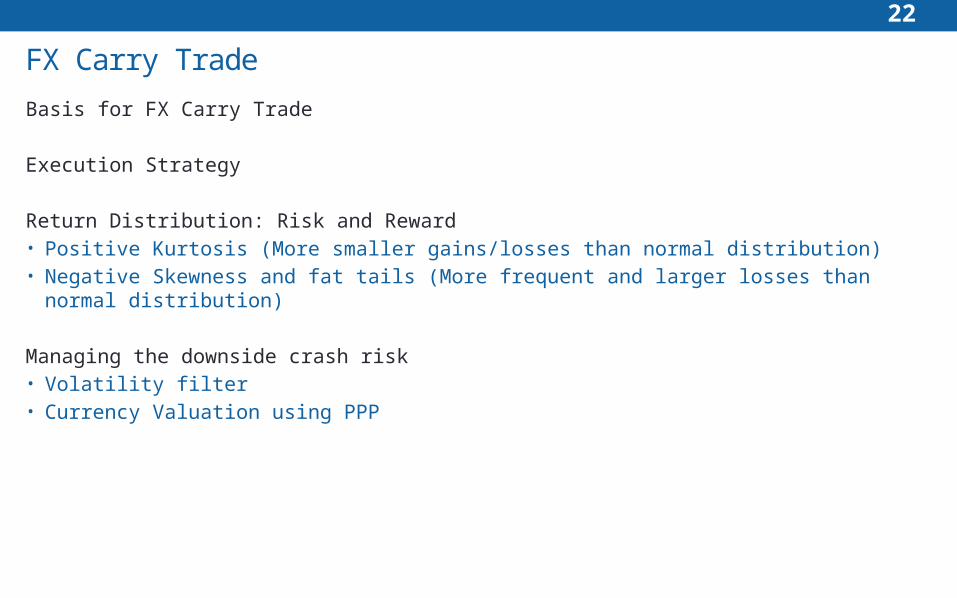
FX Carry Trade
Basis for FX Carry Trade
Execution Strategy
Return Distribution: Risk and Reward• Positive Kurtosis (More smaller gains/losses than normal distribution)• Negative Skewness and fat tails (More frequent and larger losses than normal distribution)
Managing the downside crash risk• Volatility filter• Currency Valuation using PPP

23
QuestionsQ1. Carry trade can be profitable when
a. Covered interest rate parity does not hold
b. Uncovered interest rate parity does not hold
c. The international Fisher effect does not hold
Q2. Overtime, the return distribution of the FX carry trades is most likely to resemble:
d. Normal distribution with fat tails
e. Distribution with fat tails and a negative skew
f. Distribution with thin tails and a positive skew
Q3. The volatility of returns of funds using FX carry trade relative to equity base is best explained by:
g. Leverage
h. Low deposit rates in the funding currency
i. The yield spread between the high – and low-yielding currencies
Q4. Which of these risk management strategies is most likely to reduce some of the negative tail risk associated with FX carry trades:
j. Use forward contracts to sell the funding currency
k. Exit the carry trade position when the implied FX volatility drops below a certain threshold
l. Exit the carry trade when the funding currency drops below its PPP Level
24
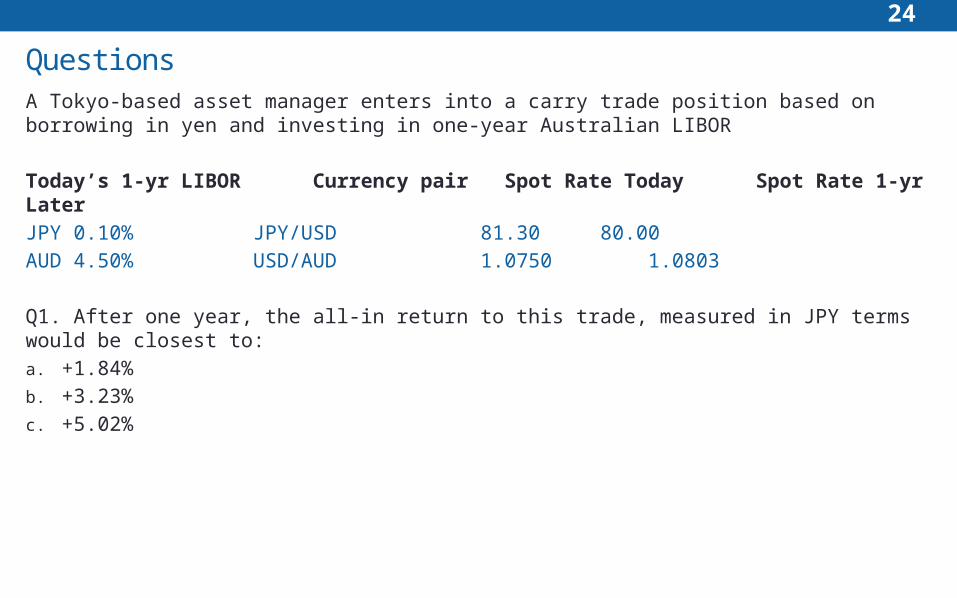
QuestionsA Tokyo-based asset manager enters into a carry trade position based on borrowing in yen and investing in one-year Australian LIBOR
Today’s 1-yr LIBOR Currency pair Spot Rate Today Spot Rate 1-yr Later
JPY 0.10% JPY/USD 81.30 80.00
AUD 4.50% USD/AUD 1.0750 1.0803
Q1. After one year, the all-in return to this trade, measured in JPY terms would be closest to:
a. +1.84%
b. +3.23%
c. +5.02%
25
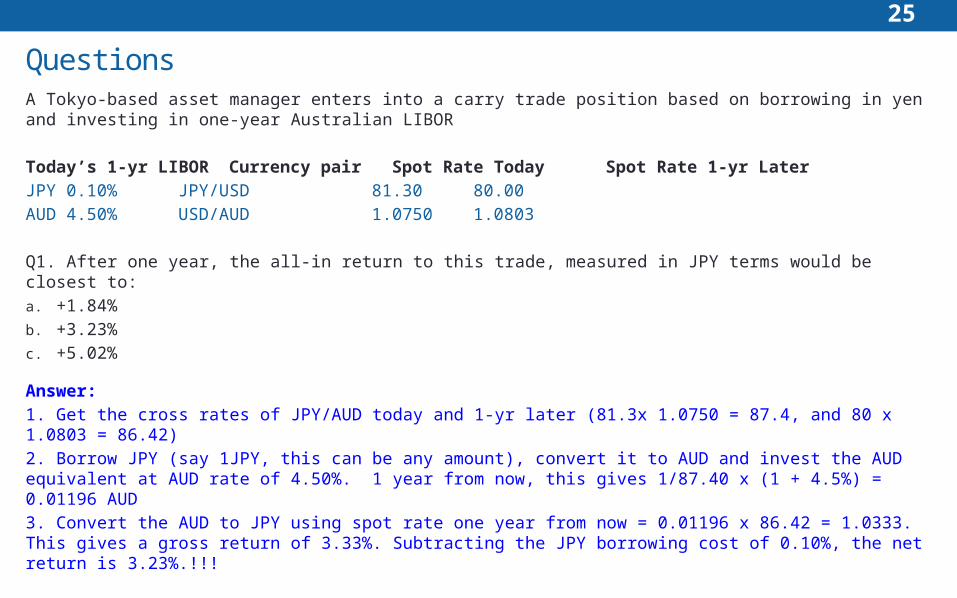
QuestionsA Tokyo-based asset manager enters into a carry trade position based on borrowing in yen and investing in one-year Australian LIBOR
Today’s 1-yr LIBOR Currency pair Spot Rate Today Spot Rate 1-yr Later
JPY 0.10% JPY/USD 81.30 80.00
AUD 4.50% USD/AUD 1.0750 1.0803
Q1. After one year, the all-in return to this trade, measured in JPY terms would be closest to:
a. +1.84%
b. +3.23%
c. +5.02%
Answer:
1. Get the cross rates of JPY/AUD today and 1-yr later (81.3x 1.0750 = 87.4, and 80 x 1.0803 = 86.42)
2. Borrow JPY (say 1JPY, this can be any amount), convert it to AUD and invest the AUD equivalent at AUD rate of 4.50%. 1 year from now, this gives 1/87.40 x (1 + 4.5%) = 0.01196 AUD
3. Convert the AUD to JPY using spot rate one year from now = 0.01196 x 86.42 = 1.0333. This gives a gross return of 3.33%. Subtracting the JPY borrowing cost of 0.10%, the net return is 3.23%.!!!
26
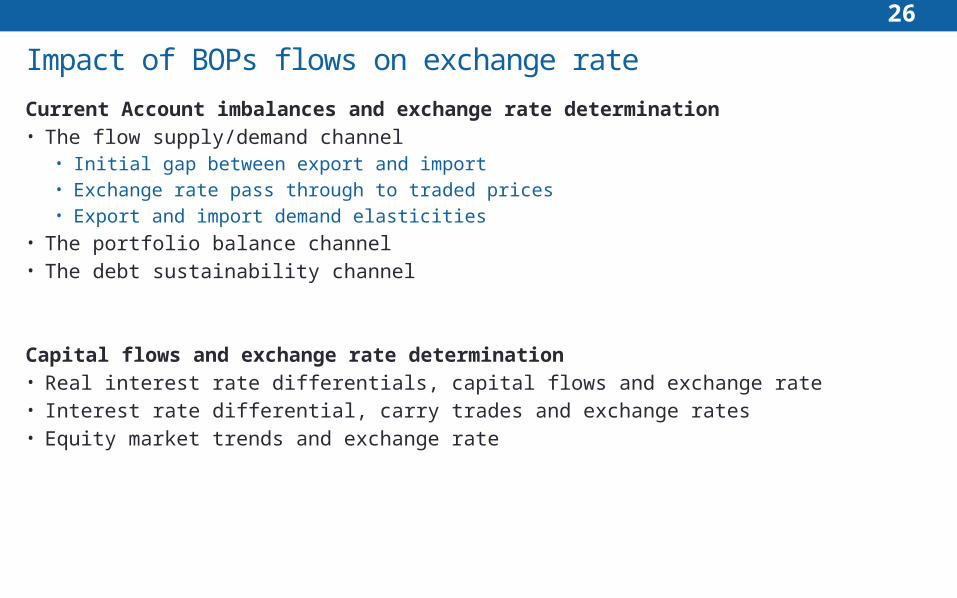
Impact of BOPs flows on exchange rate
Current Account imbalances and exchange rate determination• The flow supply/demand channel
• Initial gap between export and import• Exchange rate pass through to traded prices• Export and import demand elasticities
• The portfolio balance channel• The debt sustainability channel
Capital flows and exchange rate determination• Real interest rate differentials, capital flows and exchange rate• Interest rate differential, carry trades and exchange rates• Equity market trends and exchange rate
27
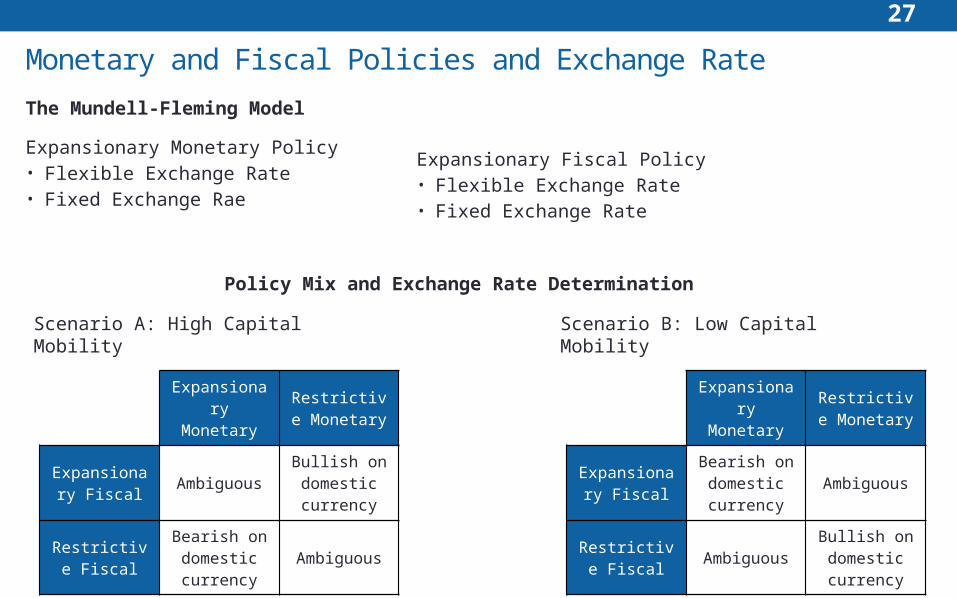
Monetary and Fiscal Policies and Exchange Rate
The Mundell-Fleming Model
Expansionary Monetary Policy• Flexible Exchange Rate• Fixed Exchange Rae
Expansionary Fiscal Policy• Flexible Exchange Rate• Fixed Exchange Rate
Policy Mix and Exchange Rate Determination
Expansionary Monetary
Restrictive Monetary
Expansionary Fiscal
AmbiguousBullish on domestic currency
Restrictive Fiscal
Bearish on domestic currency
Ambiguous
Scenario A: High Capital Mobility Scenario B: Low Capital Mobility
Expansionary Monetary
Restrictive Monetary
Expansionary Fiscal
Bearish on domestic currency
Ambiguous
Restrictive Fiscal
AmbiguousBullish on domestic currency
28
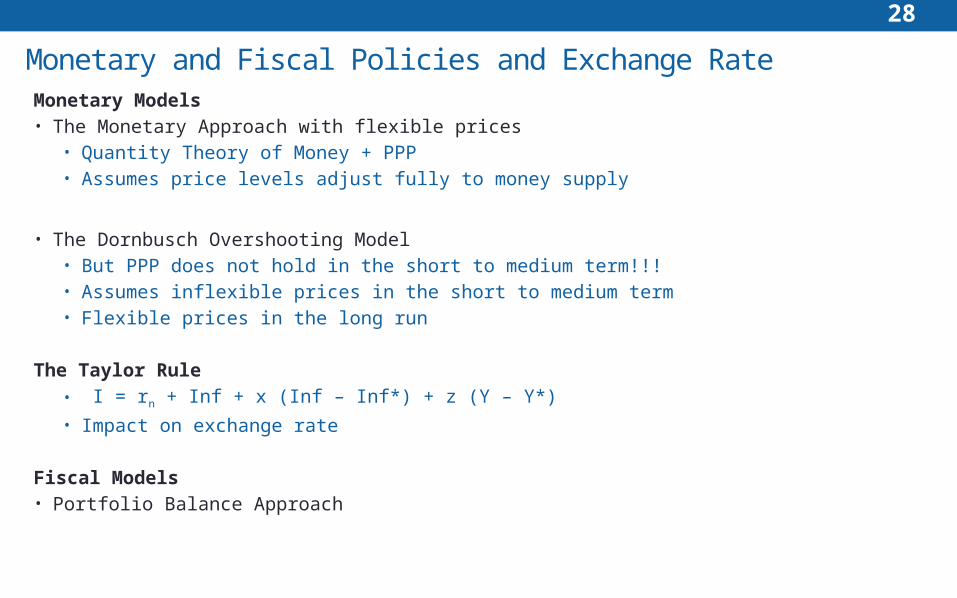
Monetary Models• The Monetary Approach with flexible prices
• Quantity Theory of Money + PPP• Assumes price levels adjust fully to money supply
• The Dornbusch Overshooting Model• But PPP does not hold in the short to medium term!!!• Assumes inflexible prices in the short to medium term• Flexible prices in the long run
The Taylor Rule• I = rn + Inf + x (Inf – Inf*) + z (Y – Y*)
• Impact on exchange rate
Fiscal Models• Portfolio Balance Approach
Monetary and Fiscal Policies and Exchange Rate
29
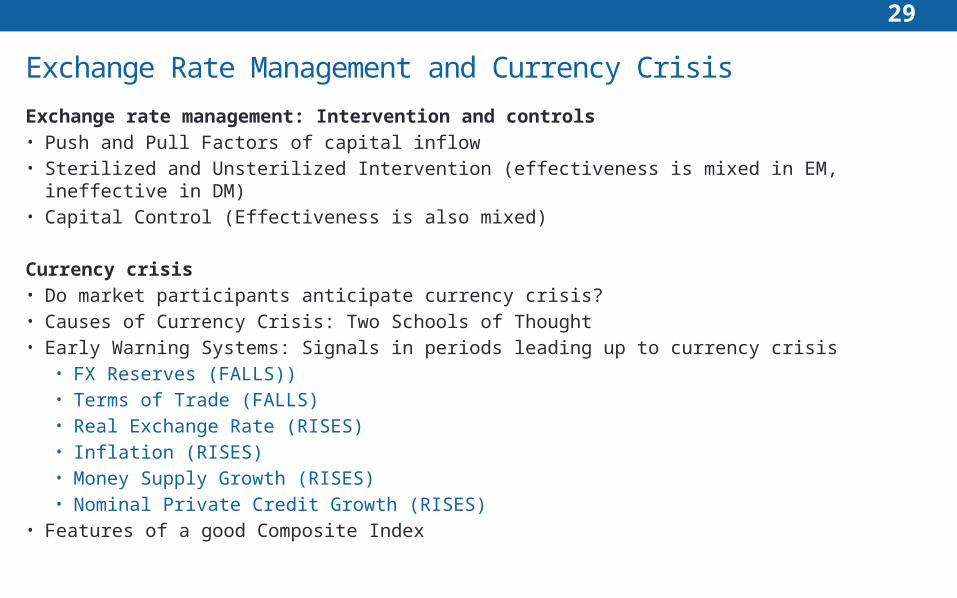
Exchange Rate Management and Currency Crisis
Exchange rate management: Intervention and controls• Push and Pull Factors of capital inflow• Sterilized and Unsterilized Intervention (effectiveness is mixed in EM, ineffective in DM)• Capital Control (Effectiveness is also mixed)
Currency crisis• Do market participants anticipate currency crisis?• Causes of Currency Crisis: Two Schools of Thought• Early Warning Systems: Signals in periods leading up to currency crisis
• FX Reserves (FALLS))• Terms of Trade (FALLS)• Real Exchange Rate (RISES)• Inflation (RISES)• Money Supply Growth (RISES)• Nominal Private Credit Growth (RISES)
• Features of a good Composite Index
30
FX Rate Short term Forecasting Tools
Technical Analysis• Can technical analysis provide superior return?• Technical tools are useful in reducing portfolio risk
Order flow, Sentiments and Net Speculative Positionings• Positive contemporaneous correlation• Results are mixed on predictive ability of the indicators
31
Reading 15Economic Growth and the Investment Decision
Learning Outcomes
a. Describe and compare factors favoring and limiting economic growth in developed and developing economies
b. Describe the relation between the long run rate of stock market appreciation and the sustainable growth rate of the economy
c. Explain the importance of potential GDP and its growth rate in the investment decisions of equity and fixed income investors
d. Distinguish between capital deepening investment and technological progress and explain the impact of each on economic growth and labor productivity
e. Forecast potential GDP based on growth accounting relations
f. Explain the impact of natural resources on economic growth and evaluate the argument that limited availability of natural resources constrains economic growth
g. Explain the effect of demographics, immigration, and labor force participation on the rate and sustainability of economic growth
h. Explain how investment in physical capital, human capital, and technological development affects economic growth
i. Explain and evaluate convergence hypotheses
j. Explain the economic rationale for govt to provide incentives to private investment in technology and knowledge
k. Describe the expected impact of removing trade barriers on capital investment and profits, employment and wages, and growth in the economies involved
32
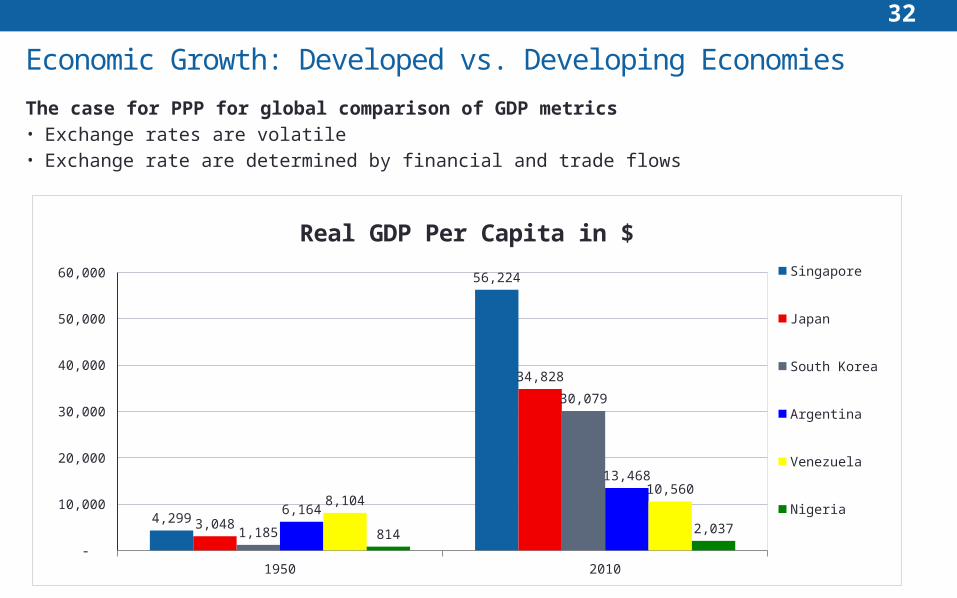
Economic Growth: Developed vs. Developing Economies
The case for PPP for global comparison of GDP metrics• Exchange rates are volatile• Exchange rate are determined by financial and trade flows
1950 2010 -
10,000
20,000
30,000
40,000
50,000
60,000
4,299
56,224
3,048
34,828
1,185
30,079
6,164
13,468
8,104 10,560
814 2,037
Real GDP Per Capita in $
Singapore
Japan
South Korea
Argentina
Venezuela
Nigeria
33
Factors Limiting Growth in Developing Countries
Low Savings and Investment• Low level of capital per worker• Vicious cycle of poverty• Foreign investment
Poor Financial Markets and Intermediaries
Political Instability, Weak Legal System and Weak Property Rights
Education and Health Care Systems• Allocation of spending among primary, secondary and tertiary education
Discouraging Tax and Regulatory System
Restriction on Free Trade and Capital Flows
34
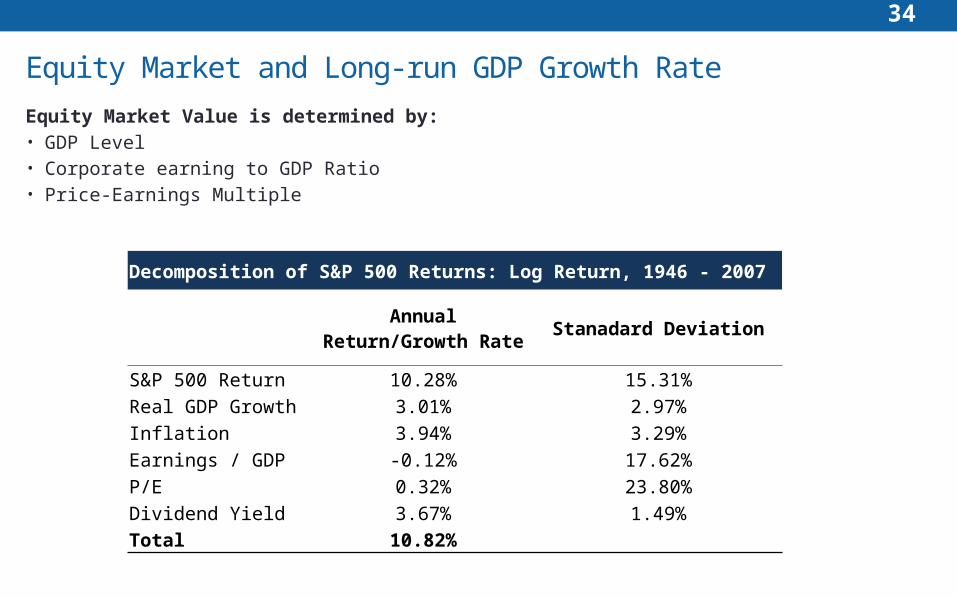
Equity Market and Long-run GDP Growth Rate
Equity Market Value is determined by:• GDP Level• Corporate earning to GDP Ratio• Price-Earnings Multiple
Decomposition of S&P 500 Returns: Log Return, 1946 - 2007
Annual Return/Growth
RateStanadard Deviation
S&P 500 Return 10.28% 15.31%Real GDP Growth 3.01% 2.97%Inflation 3.94% 3.29%Earnings / GDP -0.12% 17.62%P/E 0.32% 23.80%Dividend Yield 3.67% 1.49%Total 10.82%