
CFA Institute Research Challenge - cfasociety.org IRC Documents/IRC 2018... · Pernod Ricard -...
30
CFA Institute Research Challenge Hosted by CFA Society France Team P 1
Transcript of CFA Institute Research Challenge - cfasociety.org IRC Documents/IRC 2018... · Pernod Ricard -...

CFA Institute Research Challenge Hosted by
CFA Society France Team P
1

Pernod Ricard - Student Research. Target Price: €153.7 Recommandation: BUY
2
Pernod Ricard is ranked number 2 in the wine and spirits market since 2005 and its
acquisition of Allied Domecq (Ballantine’s , Beefeater and Malibu among iconic brands). The
group produces and distributes a large range of spirits such as Vodka, Whiskey, Gin, Tequila
and Cognac but also wine. Given its geographic positioning, its wide range of brands and a
dynamic market in the spirits premium segment, we initiate coverage with a BUY rating on
Pernod Ricard supported by target price of €153.7 and a potential upside of 17% over a 1
year period.
The main drivers that bring us to stand with this recommendation are as follows:
A significant rebound in Asian markets: the group is market leader in China and
India, which are the two most significant spirits markets. Pernod Ricard will benefit
from the sharp improvement in these countries that mainly consume whiskey, boosted
by a notable increase in volume and a positive pricing/mix.
An upward perspective in the high margin Whiskey and Cognac markets:
underlying trends on these markets are strongly positive, fuelling growth for its
whiskey and cognac brands, whose exposure in the total group revenues has been
continuously growing since 2012. Whiskey and Cognac will contribute to improve the
EBITDA margin, especially in China, India and the US.
Targeted acquisitions of ultra-premium brands: the group achieved strategic local
spirits acquisitions over the past years in ultra-premium brands. These type of
alcohols (Mezcal, Gin, Bourbon) are forecasted to grow at a high CAGR. Hereby, we
expect the group to create value thanks to its recent acquisitions at sensible multiples.
December 20th 2017: Fitch Ratings decided to upgrade Pernod Ricard’s rating to
BBB. This decision reflects the strong efforts made by the company to deleverage over
the past two years as well as solid operating performances and improving profitability.
November 15th 2017: the UK Supreme court decided to implement a minimum price
for alcohol in Scotland. As of May, a 70cl Whiskey bottle will be sold at a min. GBP14.
June 7th 2017: Pernod announced the purchase of a majority stake of the Mexican Del
Maguey Single Village, which is ranked n°1 in Mezcal spirits production in the US. This
investment is consistent with its vision of selling ultra-premium spirits.
January 31th 2017: NBV Investment, a subsidiary of Pernod, acquired American
spirits producer Smooth Ambler. The portfolio embraces Contradiction Bourbon and
Old Scout Single Barrel Bourbons in addition to Gins and Vodkas.
Figure 1: Company data
STUDENT RESEARCH – TEAM P Agro-Food Industry
Euronext Paris
This report is published for educational purposes only by students competing in The CFA Institute Research Challenge.
Summary
Recent news:
Figure 2: Share price 3y
70
80
90
100
110
120
130
140
150
j-1
5
a-1
5
j-1
5
o-1
5
j-1
6
a-1
6
j-1
6
o-1
6
j-1
7
a-1
7
j-1
7
o-1
7
Pernod Ricard CAC 40 Base 100
Figure 3: Share price data
Ticker Bloomberg RI.FP
Ticker Reuters PERP.PA
Ticker S&P Capital IQ ENXTPA:RI
Shares O/S (m) 265.42
Float % 45.8%
Closing Price 130.95
Avg 3M Dly Vlm (mm) 0.41
52-wk High / Low 133.60 / 103.85
Gap (% Low) 128.6%
Market Cap (bn€) 34 578
Net debt 2017 (m€) 7 853
Price Earning Ratio 25.05
Price to Book Ratio 2.55
Earnings Per Share 5.28
Dividend yield 2016 % 1.53%
Market Data (12/01/2018)
Source: S&P Capital IQ
Source: S&P Capital IQ
Source: S&P Capital IQ
Valuation date January 12th 2018 Current Price €130.95 Target Price €153.7
Sector Beverages Upside 17% Recommandation BUY
Pernod Ricard
% change 1m 3m 1y 3y
Pernod Ricard 1.1% 7.6% 25.7% 35.3%
Eurostoxx 50 0.3% 0.2% 9.9% 17.1%
CAC 40 1.7% 2.9% 13.4% 30.5%
Diageo -0.3% 2.8% 21.3% 44.1%
Share price data
FY 2015 FY 2016 FY 2017 FY 2018 FY 2019 FY 2020 FY 2021 FY 2022 FY 2023
Revenue (in m€) 8 558.0 8 682.0 9 010.0 9 195.9 9 530.0 9 873.4 10 202.1 10 518.3 10 833.9Revenue growth 7.7% 1.4% 3.8% 2.1% 3.6% 3.6% 3.3% 3.1% 3.0%
EBITDA (in m€) 2 433.0 2 481.0 2 599.0 2 644.4 2 792.4 2 955.5 3 133.9 3 309.4 3 433.2EBITDA margin (in %) 28.4% 28.6% 28.8% 28.8% 29.3% 29.9% 30.7% 31.5% 31.7%
Net income (in m€) 880.0 1 255.0 1 421.0 1 492.7 1 600.5 1 757.8 1 890.5 2 021.2 2 111.8Net margin (in %) 10.28% 14.5% 15.8% 16.2% 16.8% 17.8% 18.5% 19.2% 19.5%
Free Cash Flow (in m€) 1 475.0 1 826.0 1 786.0 1 797.4 1 788.3 1 898.4 2 053.2 2 185.5 2 216.9FCF yield (in %) 4.3% 5.3% 5.1% 5.2% 5.2% 5.5% 5.9% 6.3% 6.4%
Net debt (in m€) 9 086.0 8 793.0 7 870.0 7 709.5 7 082.1 6 515.2 5 749.6 5 013.2 4 290.0Net debt / EBITDA 3.7x 3.5x 3.0x 2.9x 2.5x 2.2x 1.8x 1.5x 1.2xEV / EBITDA 13.5x 14.8x 14.9x 17.7x 16.8x 15.9x 15.0x 14.2x 13.7xDividend yield 1.3% 1.4% 1.4% 1.6% 1.7% 1.8% 2.0% 2.1% 2.2%
Key financialsHistorical Projected

Pernod Ricard - Student Research. Target Price: €153.7 Recommandation: BUY
The group was created in 1975 following the merger of two French anise-based spirits
producers Pernod and Ricard. Pernod Ricard, world’s second largest producer of wines and
spirits after Diageo, enjoyed a turnover of €9.01bn as of June 2017 (+3.8% YoY). Specialized
in spirits, the group is present in a large range of alcohols from white alcohols, whiskeys,
cognac and other liqueurs to champagne and wines (although minor as of today).
The following three well-timed acquisitions performed in the first decade of the 2000’s led
the group to become the second market leader in wine and spirits:
• In 2001, it acquired, jointly with Diageo, in a complex deal, the wine and spirits division
of Canadian group “Seagram”, with mostly whiskeys and cognacs, for €3.7bn.
• In 2005, the group purchased the British “Allied Domecq” which produced premium
international spirits brands and premium wines for €10.7bn.
• In 2008, the group made its latest large acquisition by purchasing “Vin&Spirits”, owner
of the Absolut Vodka brand, for €5.6bn.
An international and decentralized group:
• Pernod Ricard is well implanted internationally with a presence in three major
geographical regions (Europe, Americas and Asia). However, its main markets remain
Asia and the United States. The group owns more than 85 affiliates, 18,000 employees
and 100 production plants worldwide.
• The group has adopted a decentralized organization. All subsidiaries respond to one
holding, each of them being specialized in a given brand (eg. development, specific
strategy and the production of each brand of alcohol) or in a specific market (eg. handle
the development and distribution of the products at a local level).
The group has split its products and strategies into four main poles:
• Strategic International Brands: gathers the 14 most prestigious and internationally
renowned brands of the group (12 spirits and 2 champagnes). This division is the main
contributor to the group’s growth for last fiscal year (+4%), mostly driven by whiskey
brands such as Jameson, the Martell cognac and the Perrier-Jouët champagne.
• Strategic Local Brands: embraces the 15 local brands, mainly exploited to penetrate
emerging markets. This segment is strongly decelerating with a 1% growth in 2016/17
compared to 5% last year. This slowdown is mainly due to the negative impact of
regulations in India.
• Premium Wines: an expanding pole composed of 4 premium wines. Last year was the
second consecutive year of solid performance for the segment (+4% and +5%
respectively).
• Other: this diversified segment gathers all products innovation (from innovative
products to the by-products of Strategic International Brands) but also accounts for the
resulting growth from new acquisitions, synergies and the premiumization strategy.
The group’s business model:
Pernod Ricard is continuously focusing its portfolio on strategic local and international
brands by withdrawing from non-key assets. Last divestitures included non-strategic local
assets such as the Vodka Frïs or Distillery Glenallachie. Alongside with the development of
its premium wines, Pernod Ricard is also surfing on the strong growth of Whiskey
consumption worldwide (especially in the US and India) with 50% of its strategic portfolio
being Whiskeys. Additionally, the group is specialized in premium brands which account for
76% of SIB (Strategic International Brands) volume sales.
The group leans on a premiumization strategy that is evidenced by:
(1) Organic Growth through innovation and development of new premium products
(2) External Growth through acquisitions of premium trendy alcohols
(3) A strong presence with a top-quality image worldwide through heavy R&D investments
3 This report is published for educational purposes only by students competing in The CFA Institute Research Challenge.
1 Business description
62%19%
6%
13%
Sales breakdown by strategic poles
Strategic International Brands
Strategic Local Brands
Premium Wines
Others
Figure 4 : Sales breakdown by strategic poles (2017)
Figure 6: Spirits brands portfolio
Strategic
International
Brands
Strategic
Local Brands
Vodka AbsolutPolish
Wyborowa
Cognac Martell
Jameson Blenders Pride
Chivas JP Whisers
The Glenlivet Royal Stag
Ballantine's Imperial Blue
Royal Salute 100 Pipers
Imperial
Passport Scotch
Clan Campbell
Anisee Ricard Pastis 51
Gin Beefeater Seagream's Gin
Rum Havana Club
Ready-to-drink Malibu
Perrier-Jouet
Mumm
Armenian
Ararat
Koffee Liqueur
Kahlua
Amaro
Ramazzoti
Tequila Olmeca
Local alcohols
Champagne
Wiskeys
Source: Annual report
Source: Annual report
Source: Annual report
Figure 5 : Geographic breakdown (2017)
39.6%
29.5%
30.9%
Asia/ROW
Americas
Europe

Pernod Ricard - Student Research. Target Price: €153.7 Recommandation: BUY
4 This report is published for educational purposes only by students competing in The CFA Institute Research Challenge.
2 Industry overview and competitive positioning
Industry overview:
From a macroeconomic point of view, the main demand drivers in the alcoholic beverages
industry are: 1/ an increasing GDP, which often translates into higher consumption
expenditures; 2/ income class redistribution, leading to rising purchasing power of
consumers; and 3/ global population growth (predominantly in emerging countries),
ultimately meaning an increasing consumer base.
Regional growth dynamics for Pernod Ricard are therefore obviously specific for each of its
geographical groups: Americas, Europe and Asia/Rest of the World.
GDP growth:
We notice positive trends for the overall economic health of Pernod Ricard key strategic markets. China remains one of the fastest growing economies around the world, having its GDP growth at a still remarkable 6.5%/7% in 2016 and 2017e. India’s economy is also confidently growing at attractive rates of ca. 7%. The US. is expanding gradually with the latest figures for Q2-Q3 2017 reaching 3.2%, the fastest pace over the last couple of years. Michigan consumer sentiment index (MCSI), as a result, is very high, hitting a 95.9 estimate. Thus, people are expecting favorable economic conditions, leading to an increase in real personal consumption expenditures, which certainly stimulates demand for the group’s products.
Income class redistribution:
The key driving force of future growth for Pernod Ricard is an emerging middle class in China and an increasing high income class in group largest market - US In China, the upper middle class, i.e. people earning $15,000 to $35,000 per year, is projected to expand from 20% in 2012 to 33% of total population in 2021. Those are the people who can now afford a bottle priced between €15 and €20. Thus, due to emerging middle class, Pernod Ricard has now an opportunity to expand its premium route to market in the region. In the US we observe an increasing number of high income population, that is people earning more than $100,000 and comprising the upper middle and affluent classes. If in 2012, these two income classes combined represented 38.3% of population, Bloomberg projections suggest that by 2021 this figure will increase to 42.5% of total population. Thus, group ultra-premiumization across whiskey, tequila and cognac categories is a sensible strategy in the region in our eyes.
Population growth:
Emerging markets are characterized by rapid population growths that ultimately will lead to an expanding consumer base target and an expansion of future demand for Pernod Ricard. Asia/Rest of the World is therefore a leading region as far as population growth indicators are concerned, with India and Africa being at the forefront. Each year the population of drinking age in India increases by 15 to 20 million people. In Africa, on the other hand, according to United Nations estimates, the change in population from 2015 to 2050 will be 112%, which is strongly exceeding growth indicators in any other region.
Competitive positioning:
The wine and spirits market is characterized by a moderate competition (Herfindahl
index of 451), represented by large multinational groups. We have determined the four
Pernod Ricard’s main competitors in accordance with several criteria:
• Diageo plc [D]: the market leader in the wine and spirits market; Diversified brands.
• Brown-Forman [BF]: corporation manufactures; Specialized in whiskey.
• Constellation Brands [CB]: specifically focused on the American market, a wine and spirits segment.
• Rémy Cointreau [RC]: specialized in cognac; international presence.
-2,0%
0,0%
2,0%
4,0%
6,0%
8,0%
2011 2012 2013 2014 2015 2016
India USA China Eurozone
Figure 7: GDP per year (%)
Figure 8: Income class distribution in China (%)
Figure 9: Income class distribution in the US (%)
Source: OECD
Source: Bloomberg
Source: Bloomberg
4432
25
30
30
28
20
2933
5 9 13
0%
10%
20%
30%
40%
50%
60%
70%
80%
90%
100%
2012 2017 2021
Poor Mass middle class
Upper middle class Affluent
23.7 21.8 20.7
38 37.6 36.9
25 25.8 26.4
13.3 14.9 16
0%
10%
20%
30%
40%
50%
60%
70%
80%
90%
100%
2012 2017 2021
Poor Middle class Upper middle class Affluent
Figure 10: estimated change in population (2015 – 2050)
19%
112%
-3%
23%
-20%
0%
20%
40%
60%
80%
100%
120%
Asia & Oceania
Africa Europe Americas
Source: The United Nations, Department of Economics and Social Affairs: The 2017 revision
Pernod Ricard - Student Research. Target Price: €153.7 Recommandation: BUY
5 This report is published for educational purposes only by students competing in The CFA Institute Research Challenge.
Figure 11: Positioning matrix
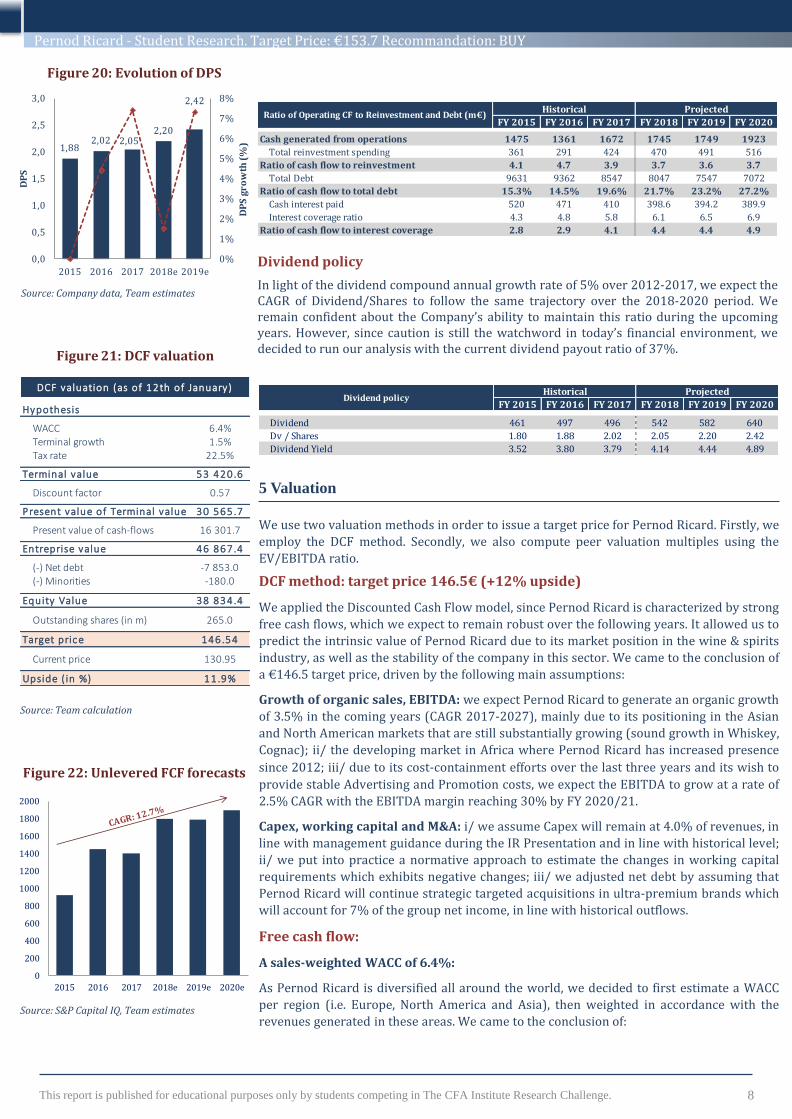
Figure 12: Spirits market share in 2017
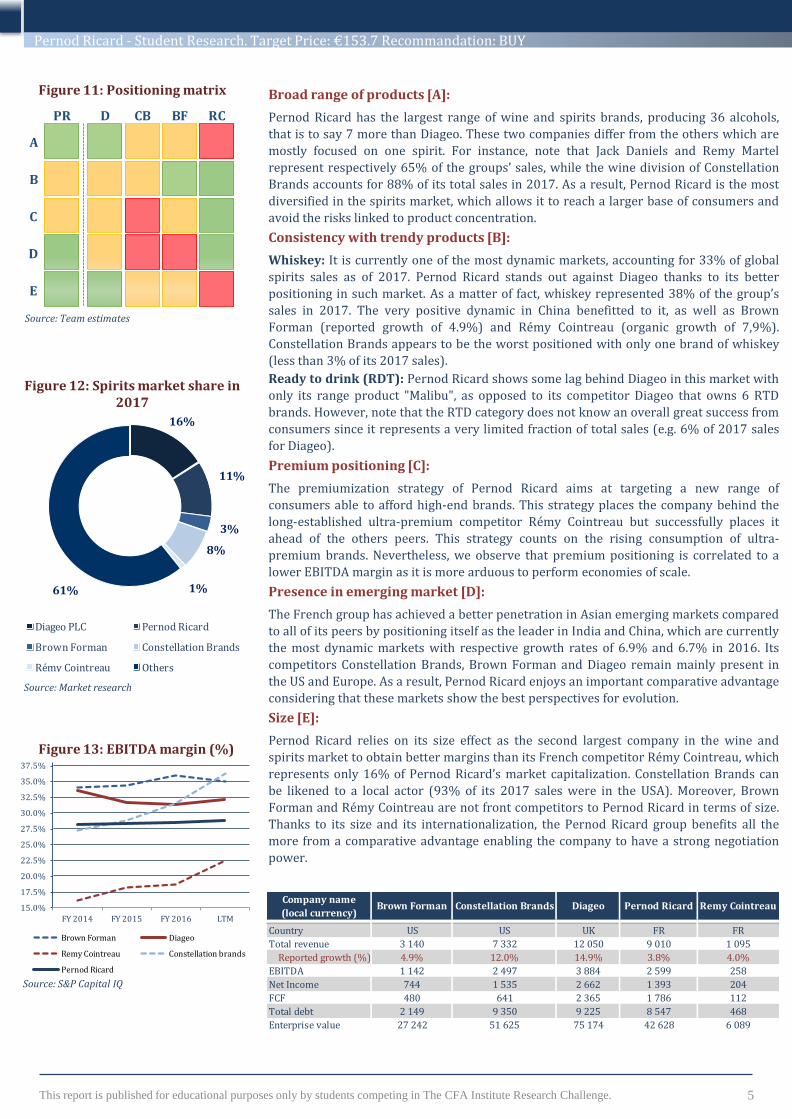
Broad range of products [A]:
Pernod Ricard has the largest range of wine and spirits brands, producing 36 alcohols,
that is to say 7 more than Diageo. These two companies differ from the others which are
mostly focused on one spirit. For instance, note that Jack Daniels and Remy Martel
represent respectively 65% of the groups’ sales, while the wine division of Constellation
Brands accounts for 88% of its total sales in 2017. As a result, Pernod Ricard is the most
diversified in the spirits market, which allows it to reach a larger base of consumers and
avoid the risks linked to product concentration.
Consistency with trendy products [B]:
Whiskey: It is currently one of the most dynamic markets, accounting for 33% of global
spirits sales as of 2017. Pernod Ricard stands out against Diageo thanks to its better
positioning in such market. As a matter of fact, whiskey represented 38% of the group’s
sales in 2017. The very positive dynamic in China benefitted to it, as well as Brown
Forman (reported growth of 4.9%) and Rémy Cointreau (organic growth of 7,9%).
Constellation Brands appears to be the worst positioned with only one brand of whiskey
(less than 3% of its 2017 sales).
Ready to drink (RDT): Pernod Ricard shows some lag behind Diageo in this market with
only its range product "Malibu", as opposed to its competitor Diageo that owns 6 RTD
brands. However, note that the RTD category does not know an overall great success from
consumers since it represents a very limited fraction of total sales (e.g. 6% of 2017 sales
for Diageo).
Premium positioning [C]:
The premiumization strategy of Pernod Ricard aims at targeting a new range of
consumers able to afford high-end brands. This strategy places the company behind the
long-established ultra-premium competitor Rémy Cointreau but successfully places it
ahead of the others peers. This strategy counts on the rising consumption of ultra-
premium brands. Nevertheless, we observe that premium positioning is correlated to a
lower EBITDA margin as it is more arduous to perform economies of scale.
Presence in emerging market [D]:
The French group has achieved a better penetration in Asian emerging markets compared
to all of its peers by positioning itself as the leader in India and China, which are currently
the most dynamic markets with respective growth rates of 6.9% and 6.7% in 2016. Its
competitors Constellation Brands, Brown Forman and Diageo remain mainly present in
the US and Europe. As a result, Pernod Ricard enjoys an important comparative advantage
considering that these markets show the best perspectives for evolution.
Size [E]:
Pernod Ricard relies on its size effect as the second largest company in the wine and
spirits market to obtain better margins than its French competitor Rémy Cointreau, which
represents only 16% of Pernod Ricard’s market capitalization. Constellation Brands can
be likened to a local actor (93% of its 2017 sales were in the USA). Moreover, Brown
Forman and Rémy Cointreau are not front competitors to Pernod Ricard in terms of size.
Thanks to its size and its internationalization, the Pernod Ricard group benefits all the
more from a comparative advantage enabling the company to have a strong negotiation
power.
D CB BFPR RC
A
B
C
D
E
Source: Team estimates
16%
11%
3%
8%
1%61%
Diageo PLC Pernod Ricard
Brown Forman Constellation Brands
Rémy Cointreau Others
Source: Market research
Figure 13: EBITDA margin (%)
Source: S&P Capital IQ
15.0%
17.5%
20.0%
22.5%
25.0%
27.5%
30.0%
32.5%
35.0%
37.5%
FY 2014 FY 2015 FY 2016 LTM
Brown Forman Diageo
Remy Cointreau Constellation brands
Pernod Ricard
Company name
(local currency)Brown Forman Constellation Brands Diageo Pernod Ricard Remy Cointreau
Country US US UK FR FR
Total revenue 3 140 7 332 12 050 9 010 1 095
Reported growth (%) 4.9% 12.0% 14.9% 3.8% 4.0%
EBITDA 1 142 2 497 3 884 2 599 258
Net Income 744 1 535 2 662 1 393 204
FCF 480 641 2 365 1 786 112
Total debt 2 149 9 350 9 225 8 547 468
Enterprise value 27 242 51 625 75 174 42 628 6 089

Pernod Ricard - Student Research. Target Price: €153.7 Recommandation: BUY
6 This report is published for educational purposes only by students competing in The CFA Institute Research Challenge.
We issue a BUY recommendation on Pernod Ricard with a target price of €153.7 and a
potential upside of 17%. Our valuation is computed by using a combination of the
Discounted Cash-Flow model and relative multiple analysis. Our recommendation is
underpinned by the following key drivers:
Drivers of the investment case
Growing market in Asia (China/India): strong growth has made a come-back in the
region, with China gaining momentum in FY 2016/17 (+2% vs. -9% last year), as well
as overall in Asia in Q1 2017/18 (+7% in Asia/ROW). The Asian market accounts for
30% of group total revenues, China and India being the two most important division
markets. Strong growth in these markets will necessary support Pernod Ricard’s sales,
due to its premium positioning that will allow it to catch the emergence of a middle-
class and the increasing per capita consumption.
Strong upward perspective in the whiskey market: we expect Pernod Ricard to benefit
from the very positive dynamic of whiskey production, according to IWSR reports that
predict volumes should increase by 52.6m 9-litre cases over the next five years,
especially in India and China, where the group is the market leader, and in the US. Note
that Indian local whiskey is the most consumed alcoholic beverage in the country, fully
in line with the Pernod Ricard portfolio which includes three major ones. In addition,
we observe that the whiskey exposure of Pernod Ricard has substantially grown, from
35.2% in FY 2015 to 38.3% for FY 2017 and we expect such exposure to be at 40% at
the end of this year. Volume sales skyrocketed in FY 2017 by +15% for Jameson, +3%
for Ballantine’s and that the group is increasing its advertising costs in China for
Chivas Regal. As a result, we do think Pernod Ricard will remain able to outperform
the industry over the coming years.
Strategic acquisitions in Ultra-premium brands and innovation: we observe that
Pernod Ricard is slowly shifting its strategy upmarket by acquiring ultra-premium
local brands (42$ - 84$ for a 75cl bottle) with great potential, such as Del Maguey
(Mezcal, which is expected to grow at +17.8% CAGR 2017-2022 – Future Market
Insights), Smooth Ambler (Bourbon) and Ungava (Gin). Group’s growth is also driven
by Innovations brands, which accounted for 1/3 of the top line growth last year. These
strategies aim at targeting the rise of the upper-class in the US, whose income trends
an upward evolution allowing them to afford ultra-premium spirits. Such a strategic
positioning is corroborated by data on consumption evolution like the CAGR 2006-
2016, which stands at 9% for ultra-premium brands, as opposed to 3.4% for premium
brands.
Limits of the investment case
Low organic growth in Western Europe: Pernod Ricard is impacted by the slight
positive environment in Western Europe, with an average organic growth of 1.6% the
last three years in Europe, which includes the positive dynamic in Eastern Europe. For
instance, the group only achieved a 1% growth in France last year. The Western
Europe market is mature and pricing remains challenging in the region. Hereby, the
group will necessary have to increase its advertising and promotion expenses to
remain the market leader in Europe.
The vodka market is shrinking: Absolut is the most important brand of Pernod
Ricard , accounting for 23.1% of its international brands sales. Still, the brand is facing
difficulties as the vodka market shrank by 4.3% last year. The US is the Absolut’s most
important market, which is challenging (+0.4% LTM), partly due to the negative
pricing effect on the brand and changing consumer preferences.
3 Investment summary
Figure 14: Global spirits consumption (2017)
Figure 15: Price range in 2017 (growth %)
43%
33%
8%
7%
9%
White alcohols Whiskey Liqueur
Cognac Others
Source: Company data
Source: Company data
Figure 16: Whiskey vs. other SIB (growth %)
Source: Company data
PrestigeUltra-
premium
Super-
premiumPremium Standard
> $84 $42-84 $26-$42 $17-$26 $10-$17
4 Financial Analysis
We forecast total revenue of €9,196m in the course of 2018, with organic sales growth of 4.2% driven by the awakening of growth market in Asia and its strong market position. Furthermore, margins and earnings should continue in the years ahead thanks to costs containments efforts and a better control of non-recurring items.
5.3%
-1.3%
3.8% 4.3%3.5%
5.1%
2.6%
-1.3% -1.3%
1.0%
-6.8%
4.5%1.90%
2012 2013 2014 2015 2016 2017Whiskey sales
Other Strategic brands sales
7.40%
9%
6.80%
3.40%
1.20%

Pernod Ricard - Student Research. Target Price: €153.7 Recommandation: BUY
7
Analysis overview
Regarding many of Pernod Ricard’s operational and financial characteristics, we believe the group has the financial ability to both foster value creation in its existing operations and continue to grow through an acquisition strategy. The group benefits from a more than adequate liquidity and cash flows for future investments. The company should be able to reduce its leverage, and the capital structure is solid enough to support future strategic plans.
Performance measurement
We used the DuPont analysis to separate the components affecting the return on common equity, as it leads to assess the drivers of Pernod Ricard’s performance. Our projections highlight a progressive improvement in the ROE over the next three years through enhancements in the company’s profitability (driven by organic and external growth). The significance of the investment in associates is limited (associates’ contribution to ROE is weak).
Capital structure analysis
The Company has sought to secure its capital structure over the last three years. As of September 2017, Pernod’s total debt amounted to €8,547 million, representing 38.1% of the capital structure, as opposed to 42% in 2015, while the proportion of equity financing increased. Furthermore, we notice that the liquidity ratios improved more than modestly, providing a cushion to the cash generation that has been decreasing.
Cash flow relationships
Since Pernod Ricard has made a number of acquisitions, we analyzed the relationship between operating cash flow and its resource allocation over time. Cash flows cover reinvestment needs by a factor of 3.9x, and the trend should improve in the next years. The cash flow relationship with debt and interest indicates that the group should be able to handle more debt should profitable investment opportunities arise.
Figure 17: ROE vs. ROCE forecasts
Source: Company data, Team estimates
Figure 18: Evolution of EPS
Source: Company data, Team estimates
Figure 19: Net debt forecasts
Source: Company data, Team estimates
6.5%
9.1%
10.0% 10.0% 10.1%
8.8% 8.8%
9.2% 9.2%
9.6%
5.5%
6.5%
7.5%
8.5%
9.5%
10.5%
2015 2016 2017 2018e 2019e
ROE ROCE
0.0
0.5
1.0
1.5
2.0
2.5
3.0
3.5
4.0
0
1 000
2 000
3 000
4 000
5 000
6 000
7 000
8 000
9 000
10 000
2015 2016 2017 2018e 2019e 2020e
Ne
t D
eb
t/E
BIT
DA
FY 2015 FY 2016 FY 2017 FY 2018 FY 2019 FY 2020
Current Ratio 1.44 1.47 1.77 1.77 1.78 1.81
Quick Ratio 0.37 0.38 0.49 0.50 0.50 0.52
Defensive Interval Ratio 111.21 108.20 115.91 117.00 115.90 120.67
Days sales outstanding (DSO) 58.69 55.66 57.44 57.00 57.00 57.00
Days on hand of inventory (DOH) 598.75 583.60 568.34 560.00 560.00 560.00
Number of days payables 189.77 186.08 195.62 184.00 184.00 184.00
Cash conversion cycle 467.66 453.18 430.16 433.00 433.00 433.00
Working Capital Accounts and RatiosHistorical Projected
FY 2015 FY 2016 FY 2017 FY 2018 FY 2019 FY 2020
Tax Burden 78.2% 74.3% 74.9% 76.0% 76.1% 76.3%
Interest Burden 49.6% 73.5% 78.1% 79.8% 80.9% 83.7%
EBIT Margin 25.9% 26.1% 26.4% 26.3% 26.8% 27.4%
Net Profit Margin 10.1% 14.2% 15.5% 15.9% 16.5% 17.5%
Total asset turnover 29.5% 28.5% 29.7% 30.4% 31.1% 31.6%
Leverage 2.31 2.28 2.22 2.12 2.03 1.95
Return on equity (ROE) 6.9% 9.2% 10.2% 10.3% 10.4% 10.8%
Expanded Dupont AnalysisHistorical Projected
This report is published for educational purposes only by students competing in The CFA Institute Research Challenge.
4.68
5.27 5.545.95
6.55
0%
2%
4%
6%
8%
10%
12%
0.0
1.0
2.0
3.0
4.0
5.0
6.0
7.0
2015 2016 2017 2018e 2019e
EP
S gr
ow
th (
%)
EP
S
FY 2015 FY 2016 FY 2017 FY 2018 FY 2019 FY 2020
Revenue Growth 7.7% 1.4% 3.8% 2.1% 3.6% 3.6%
EBITDA Margin 28.4% 28.6% 28.8% 28.8% 29.3% 29.9%
EBIT Margin 25.9% 26.1% 26.4% 26.3% 26.8% 27.4%
ROCE 8.8% 8.8% 9.2% 9.2% 9.2% 9.6%
ROE 6.5% 9.1% 10.0% 10.0% 10.1% 10.5%
ROA 3.0% 4.0% 4.6% 4.8% 5.1% 5.5%
Net Debt / Equity 94.3% 93.9% 92.1% 91.0% 90.5% 88.5%
EPS 3.26 4.68 5.27 5.54 5.95 6.55
DPS 1.80 1.88 2.02 2.05 2.20 2.42
Historical ProjectedKey Metrics
Pernod Ricard - Student Research. Target Price: €153.7 Recommandation: BUY
8 This report is published for educational purposes only by students competing in The CFA Institute Research Challenge.
Dividend policy
In light of the dividend compound annual growth rate of 5% over 2012-2017, we expect the CAGR of Dividend/Shares to follow the same trajectory over the 2018-2020 period. We remain confident about the Company’s ability to maintain this ratio during the upcoming years. However, since caution is still the watchword in today’s financial environment, we decided to run our analysis with the current dividend payout ratio of 37%.
Figure 20: Evolution of DPS
1,882,02 2,05
2,20
2,42
0%
1%
2%
3%
4%
5%
6%
7%
8%
0,0
0,5
1,0
1,5
2,0
2,5
3,0
2015 2016 2017 2018e 2019e
DP
S g
ro
wth
(%
)
DP
S
Source: Company data, Team estimates
We use two valuation methods in order to issue a target price for Pernod Ricard. Firstly, we
employ the DCF method. Secondly, we also compute peer valuation multiples using the
EV/EBITDA ratio.
DCF method: target price 146.5€ (+12% upside)
We applied the Discounted Cash Flow model, since Pernod Ricard is characterized by strong
free cash flows, which we expect to remain robust over the following years. It allowed us to
predict the intrinsic value of Pernod Ricard due to its market position in the wine & spirits
industry, as well as the stability of the company in this sector. We came to the conclusion of
a €146.5 target price, driven by the following main assumptions:
Growth of organic sales, EBITDA: we expect Pernod Ricard to generate an organic growth
of 3.5% in the coming years (CAGR 2017-2027), mainly due to its positioning in the Asian
and North American markets that are still substantially growing (sound growth in Whiskey,
Cognac); ii/ the developing market in Africa where Pernod Ricard has increased presence
since 2012; iii/ due to its cost-containment efforts over the last three years and its wish to
provide stable Advertising and Promotion costs, we expect the EBITDA to grow at a rate of
2.5% CAGR with the EBITDA margin reaching 30% by FY 2020/21.
Capex, working capital and M&A: i/ we assume Capex will remain at 4.0% of revenues, in
line with management guidance during the IR Presentation and in line with historical level;
ii/ we put into practice a normative approach to estimate the changes in working capital
requirements which exhibits negative changes; iii/ we adjusted net debt by assuming that
Pernod Ricard will continue strategic targeted acquisitions in ultra-premium brands which
will account for 7% of the group net income, in line with historical outflows.
Free cash flow:
A sales-weighted WACC of 6.4%:
As Pernod Ricard is diversified all around the world, we decided to first estimate a WACC
per region (i.e. Europe, North America and Asia), then weighted in accordance with the
revenues generated in these areas. We came to the conclusion of:
5 Valuation
Figure 21: DCF valuation
Source: Team calculation
0
200
400
600
800
1000
1200
1400
1600
1800
2000
2015 2016 2017 2018e 2019e 2020e
Source: S&P Capital IQ, Team estimates
Figure 22: Unlevered FCF forecasts
FY 2015 FY 2016 FY 2017 FY 2018 FY 2019 FY 2020Ratio of Operating CF to Reinvestment and Debt
Cash generated from operations 1475 1361 1672 1745 1749 1923
Total reinvestment spending 361 291 424 470 491 516
Ratio of cash flow to reinvestment 4.1 4.7 3.9 3.7 3.6 3.7
Total Debt 9631 9362 8547 8047 7547 7072
Ratio of cash flow to total debt 15.3% 14.5% 19.6% 21.7% 23.2% 27.2%
Cash interest paid 520 471 410 398.6 394.2 389.9
Interest coverage ratio 4.3 4.8 5.8 6.1 6.5 6.9
Ratio of cash flow to interest coverage 2.8 2.9 4.1 4.4 4.4 4.9
Ratio of Operating CF to Reinvestment and Debt (m€)Historical Projected
FY 2015 FY 2016 FY 2017 FY 2018 FY 2019 FY 2020Dividend policy
Dividend 461 497 496 542 582 640
Dv / Shares 1.80 1.88 2.02 2.05 2.20 2.42
Dividend Yield 3.52 3.80 3.79 4.14 4.44 4.89
Dividend policyHistorical Projected
Hypothesis
WACC 6.4%Terminal growth 1.5%Tax rate 22.5%
Terminal value 53 420.6
Discount factor 0.57
Present value of Terminal value 30 565.7
Present value of cash-flows 16 301.7
Entreprise value 46 867.4
(-) Net debt -7 853.0(-) Minorities -180.0
Equity Value 38 834.4
Outstanding shares (in m) 265.0
Target pric e 146.54
Current price 130.95
Upside ( in %) 11.9%
DCF valuation (as of 12th of January)

Pernod Ricard - Student Research. Target Price: €153.7 Recommandation: BUY
9 This report is published for educational purposes only by students competing in The CFA Institute Research Challenge.
Figure 23: Sensitivity analysis
Figure 24: Monte-Carlo simulation
Beta: a weighted average beta of 0.8. We used a one-year regression between the firm’s
stock return and a European market index, which is the most consistent market index.
Damodaran public data have been used to determine betas in Asia/RoW and Americas.
Risk free rate: for Europe, we decided to adopt the Euro area yield curves delivered by the
ECB, that indicate a 10 years risk free rate of 1.10%. North American risk free rate has been
implemented by using the 10 years US Bill (2.5%) and we decided to equally weigh the 10
years free rate of China and India for RoW, which gave a rate of 5.5%.
Expected return: expected return has been computed by using: i/ the S&P 500 Beverages
10-year average return of 9.5% in North America; ii/ the CAC 40 5-year average return of
8.2% in Europe; iii/ the STOXX Asia/Pacific 600 Food & Beverage 3-year average return of
11% in Asia/RoW.
Cost of debt: we relied on the average cost of debt expected by Pernod Ricard (3.8%) for
this year and decided to apply it to all areas.
Source: Team calculation
Sensitivity analysis:
We took care to check that our result was not too sensitive to the growth rate at perpetuity and the WACC. We came to the conclusion that our DCF model was more sensitive to the WACC than the terminal growth for a 0.25% change. This result is consistent because mature companies are logically less sensitive to the terminal growth.
Monte Carlo Simulation:
We implemented a Monte Carlo simulation to see if our result is realistic with our DCF
valuation. We started a draw of 50,000 iterations to assure the relevancy of the results. The
Monte Carlo simulation supports our result, affirming there is more than a 50% probability
that the company achieve more than a 12% upside.
Relative valuation methods: Target price €160.9 (+22.9% upside)
We decided to focus on all listed sector companies that could be compared to Pernod
Ricard. But we didn’t equally weigh the companies because of strong differences with
Pernod Ricard portfolio, their geographical positioning and their size. Indeed, all these
characteristics have an impact on the EV/EBITDA multiple and led us to determine a
synthetic multiple.
We use an EV/EBITDA multiple, driven by the assumptions that EBITDA is less sensitive
than EBIT to accounting manipulations regarding the D&A, and that EBITDA is the most
reliable metric to compare companies’ operating income. The set of comparables chosen
drive us to an average synthetic EV/EBITDA of 19.5x that we applied to Pernod Ricard
without taking into account any drop in value that the group has been experiencing since
2014. We obtain an implied share price of €160.9 and a 22.9% upside.
Source: Team calculation
Diageo UK 65 449 75 174 17,7x 100%
Brown Forman US 25 250 27 242 20,3x 60%
Constellation Brands US 42 414 51 625 17,6x 50%
Remy Cointreau France 5 659 6 089 23,9x 50%
Davide Campari Italia 7 324 8 261 20,0x 40%
Average / Weighted average 19,9x 19,5x
EV / EBITDA
2017 LTM
Likeness to
Pernod Ricard
weighting
Company Country
Market cap.
local currency
(in m)
Enterprise value
local currency
(in m)
Source: Team calculation
Source: S&P Capital IQ, Team estimates
Figure 25: EV/EBITDA valuation
28,0%
28,5%
29,0%
29,5%
30,0%
30,5%
31,0%
1 000
1 500
2 000
2 500
3 000
3 500
EB
ITD
A M
argi
n (
%)
Figure 26: EBITDA forecasts
1.00% 1.25% 1.50% 1.75% 2.00%
5.90% 152.2 159.0 166.5 174.9 184.4
6.15% 143.4 149.4 156.0 163.4 171.6
6.40% 135.3 140.7 146.5 153.0 160.3
6.65% 128.0 132.8 138.0 143.8 150.2
6.90% 121.4 125.6 130.3 135.4 141.1
Sensivity analysis
Growth in perpetuity
WA
CC
Areas% of
total sales
E /
(E+D)
D /
(E+D)β Rf
Cost of
equity
Cost of
debt
Corporate
tax rate
Regional
WACC
Asia / ROW 39.6% 62.6% 37.4% 0.80 5.5% 9.9% 3.8% 22.0% 7.3%
Europe 30.9% 62.6% 37.4% 0.54 1.2% 5.0% 3.8% 23.0% 4.2%
Americas 29.5% 62.6% 37.4% 1.12 2.6% 10.3% 3.8% 22.5% 7.6%
Total 100.0% - - 0 .81 3.3% 8.5% 3.8% 22.9% 6.4%
WACC estimation break-down
Metrics 2599.0
Multiple applied 19.5x
Enterprise Value 50 755
(-) Net Debt -7853
(-) Minorities -180
(=) Equity Value 42 722
Average shares out. (m) 265
Implied share price (€) 160.93
Current Share price 130.95
Upside (in %) 22.9%
EBITDA 2017/18e

Pernod Ricard - Student Research. Target Price: €153.7 Recommandation: BUY
10
6 Management and Corporate Governance
Management Team:
The General Management of the group is carried out by Alexandre Ricard, CEO and
Chairman of the Group since the 29th of August 2012, following the passing of Patrick
Ricard, and Gilles Bogaert, Managing Director, Financial & Operations. Both have been
working for Pernod Ricard for a cumulative total of 37 years.
Executive Board:
The Executive Board prepares and approves all decisions related to the functioning of
Pernod Ricard and submits these decisions to the Board of Directors.
Board of directors:
The Pernod Ricard Board of Directors is composed of 14 members, whom half are
independent members and 42% are female directors, while the attendance rate is at 97%.
The governance consists of the following committees: the strategic committee directed by
Alexandre Ricard; the audit committee directed by Wolfgang Colberg; the nominations,
governance and CSR committee directed by Nicole Bouton; the compensation committee
also directed by Nicole Bouton. Each of these committees is at least composed of 50%
independent members and 100% attendance is required.
Shareholder rights:
We decided to split the shareholding structure into six blocks. The “Société Paul Ricard”
(family holding co) remains the main investor in the company with a total of 16%,
increasing by 7% in two years its holding in the group. The free-float is currently
accounting for around 46% of the company shares while it accounted for 41.5% two years
ago. Voting rights did not change very much in the recent years. “The Société Paul Ricard”
has a total of 22.4% of voting rights while the free-float is at 41.8%. Thus, the company is
becoming more sensitive to changes in financial markets while remaining stable over the
time, allowing to perfectly employ its strategy as decided by the board of directors.
Social responsibility:
The group has renownedly built a strong social responsibility in the past years. According
to an inquiry launched by independent survey company Towers Watson, 85% of its
employees declare that they are encouraged to act responsibly. The group committed in
2010 to following a roadmap to 2020 under which Pernod Ricard aims to reduce by 30% its
CO2 emissions by 2020. The group almost fulfilled this goal as it has already reduced its
carbon emissions by 27%.
Results: Target price €153.7 (+17.4% upside)
We equally weighted the DCF and relative valuation methods. The DCF method allowed us
to analyze the group’s capacity to create value through its brands portfolio shift and
geographic positioning. The relative valuation method helped us understand that Pernod
Ricard currently suffers from an undervaluation compared to its peers that should
disappear thanks to the significant EBITDA increase we predict in the coming years. As a
result, we set a BUY recommendation with a target price of €153.7 (+17.4% upside).
Figure 27: Final valuation
Figure 28: Shareholding structure (2017)
Valuation
conclusionDCF
Relative
multiple
Weighting (in %) 50% 50%
Target price 146,5 160,9
Weighted targ. price
Current share price
Upside
Equity value (in m€)
(+) Minorities (in m€)
(+) Net debt (in m€)
Entreprise value
7 853
48 773
153,7
131,0
17,4%
40 740
180
Societe Paul
Ricard + board16%
Floating46%
Groupe Bruxelles Lambert
7%
CGC10%
MFS IM10%
Inst. Inv.11%
Source: Registration document
Source: Team calculation
Societe Paul
Ricard + board16%
Floating42%
Groupe Bruxelles Lambert
11%
CGC9%
MFS IM7%
Inst. Inv.11%
Figure 29: Voting rights (2017)
Source: Registration document
7 Investment risks
Operational risks:
Digital (OR1): the group is trying to surf on the digital trend with, for example, the through
the « lesnouveauxcavistes.com » e-commerce website initiative. However, group is timid
compared to competitors like Diageo, that have partnerships with Amazon Prime to make
cocktails tutorials or Deliveroo that can home deliver Diageo’s alcohols at all times of the
day.
This report is published for educational purposes only by students competing in The CFA Institute Research Challenge.

Pernod Ricard - Student Research. Target Price: €153.7 Recommandation: BUY
11 This report is published for educational purposes only by students competing in The CFA Institute Research Challenge.
How to mitigate: Develop partnerships, especially in China where e-commerce is booming.
Online sales only represent 8% of the group’s turnover.
Severe competition and absence from essential markets (OR2): entry barriers in the
beverage market are high but there is already unrelenting competition between the
international and local actors. Consumers can easily substitute brands, which forces the
group to anticipate the consumer’s future needs to remain among market leaders. For
example, Pernod Ricard is not present in the beer nor RTD segments, which are thriving
and may favor the penetration in emerging markets.
How to mitigate: acquire a local beer or baijiu brand in China, India or Africa but we do
think this is not consistent with the group’s premiumization strategy. Continue expanding
in the wine industry is also an option, more likely.
Raw material pricing (OR3): the group is threatened by several external matters
regarding the fluctuation of raw material prices, such as wheat, potatoes (used is the
production of Vodka), corn or rye (used in the production of whiskey), etc. Climate change
and pricing pressure could negatively impact the COGS so that the margin would
significantly affect EBITDA margin.
How to mitigate: by hedging (short term) or partnering with suppliers if necessary (long
term). If raw materials were to increase, the group would not be able to increase prices in
developed countries where pricing remains challenging due to suppliers control. However,
to compensate for the decreasing margin, it should increase prices in emerging countries
(supposed to generate organic growth).
Financial Risks
Exchange rate risk (FR1): as the group has an important international activity (70% of the
TO is not European) and produces 72% of its alcohols in Europe, it is strongly exposed to
exchange rates fluctuations (both transaction and conversion risk). For instance, a 5%
appreciation of the Euro vs. the Dollar would have a negative impact of ca. €130m on
turnover. A 5% appreciation of the Euro VS the Yuan would have a less negative, which
remains nonetheless significant (- €55m).
How to mitigate: the group hedges with currency swaps but not consequently enough
compared to the risk. Plus, as we mentioned, the group cannot easily increase the prices.
Indebtedness and interest rate (FR2): Pernod Ricard remains consequently indebted
even if it is quickly deleveraging. As indebted companies are more sensitive to interest rate
changes, the group is dependent to the changes in the interest rate when rolling its debt or
re-leveraging. In terms of target price, it increases the WACC and reduces the enterprise
value.
How to mitigate: increase the cash or improve the management of debt issuances to
decrease the net debt and increase debt average duration. Short term, group could also
hedge with an interest rate swap for the variable part of its leverage.
Context and External Risks
Decreasing global alcoholic consumption (ER1): the alcoholic global consumption is
declining at a faster rate this past years (e.g. -1.3% in 2016). This slowdown is mainly due
to the decreasing consumption in China, Russia and Brazil caused by economic or political
issues. Awareness campaigns also tend to lower the consumption in Western Europe.
How to mitigate: Pernod Ricard should concentrate in the economic and social
environments where consumption is booming and margins are more favorable.
Government or tax policy risk (ER2): a change in the government policy or a new law
against alcohol consumption would affect the group’s growth. For example, the “Highway
Ban” in India dragged the group growth in country to 1% vs. 12% in 2015/16. Another
example is the anti-extravaganza campaign in China.
How to mitigate: focus on neighbor’s countries and travel retail.
Figure 30: Risks matrix
Source: Team estimates
-15%
-10%
-5%
0%
5%
10%
15%
20%
2013 2014 2015 2016 2017 2018e2019e2020e
FX change External growth Organic growth
Figure 31: Growth breakdown (%)
Source: Company data, Team estimates
ER2
ER1 OR2
OR1
OR3
FR2
FR1
Impact
Pro
bab
ilit
y
Impact on net
sales (in €m)+1% +2% +3% +4% +5% +6%
EUR/USD -26.6 -53.2 -79.8 -106.4 -133.1 -159.7
EUR/CNY -11.3 -22.6 -33.9 -45.3 -56.6 -67.9
EUR/GBP -4.5 -8.6 -13.4 -17.9 -22.3 -26.8
Figure 32: Appreciation of € vs. other currencies (€m)
Source: Team estimates

Pernod Ricard - Student Research. Target Price: €153.7 Recommandation: BUY
This report is published for educational purposes only by students competing in The CFA Institute Research Challenge.
APPENDIX
12

Pernod Ricard - Student Research. Target Price: €153.7 Recommandation: BUY
1993Creation of Havana Club International’s
joint-venture
2005Acquisition of Allied Domecq to become n°2
worldwide
2012Asia becomes the n°1 region for the
group
2008Acquisition of
Vin&Sprit
(Absolut)
2011Launch of the
Responsib’ALL day (for societal
responsability
2014Majority interest in
ultra-premium tequila « Avión »
1975Merger of
Pernod&Ricard
2001Acquisition of
the W&S division of Seagream
1988Acquisition
of Irish Distillers
1989Acquisition of
Orlando Wyndham
2015Alexandre Ricard
appointed CEO
2017Acquisition of
Del Maguey Single Village, n°1
Mezcal in the US
2016Majoritary interests in:
Premium Gin Monkey 47 and Smooth Ambler
2013The group fastens its position in
Africa
Source: Company data
Source: Company data
Appendix 1 Business description - History
Appendix 2 Brand positioning
For a 75cl bottle Standard ($10 - $17) Premium ($26 - $42) Super-premium ($26 - $42) Ultra-premium ($42 - 84) Prestige (> $84)
Absolut
Polish Wyborowa
100 pipers Jameson Chivas Chivas Chivas
Blenders Pride Ballantine's The Glenlivet The Glenlivet Royal Salute
Royal Stag JP Wiser"s Imperial
Imperial Blue Passport Scotch
Clan Campbell
Cognac Martell Martell Martell
Anisee Pastis 51 Ricard
Gin Seagram's Gin Beefeater
Rum Havana Club Havana Club
Ready-to-drink Malibu
Perrier-Jouet Perrier-Jouet
Mumm
Tequila Olmeca Mum
Kahlua Armenia
Amarro Ramazzotti Ararat
Strategic International Brands
Strategic Local Brands
Perrier-Jouet
Whiskey
Vodka
Champagne
Other spirits
Mumm
19.75% 19.66%20.24%
19.34% 18.98%
18.83%
18.30%
27.29% 27.59% 27.57%28.57% 28.98%
30.57% 30.56%
18.1% 18.6% 18.7% 18.5%19.0%
20.0% 20.6%
2011 2012 2013 2014 2015 2016 2017
Dis
trib
uti
on
of P
ern
od
Ric
ard
in
win
e a
nd
sp
irit
s (
%)
Vodka Whiskey Wine
Source: Annual reports
This report is published for educational purposes only by students competing in The CFA Institute Research Challenge. 13

Pernod Ricard - Student Research. Target Price: €153.7 Recommandation: BUY
14
Main
markets
Market
type
Sales
growth
FY17
Main brands GDP
growth
rate
Population
growth
rate
Market
obstacles
General comments
USA Mature 5%
Jameson,
Malibu,
Martell,
Glenlivet,
Olmeca Altos,
Avion
1,8% 0,69%
Largest market both in Americas and globally
Continued strong performance of whiskey, tequila and cognac categories
Value growth mainly driven by mix and operational excellence initiatives
Growth drivers: a) Rising spending power of population, b) Spirits is the fastest growing alcohol beverage segment in U.S. and it continues to take share from other alcohol beverage categories.
France Mature 1%
Jameson,
Absolut,
Chivas,
Ballantine’s,
Ricard,
Havana Club,
Mumm,
Perrier-Jouet
0,8% 0,41%
Technical impact
of back-office
mutualisation
between Ricard
and Pernod on 1
July 2015
Pernod Ricard maintains its leadership position in France with 30% market share (Nielson).
UK Mature 7%
Absolut,
Jameson, The
Glenlivet,
Mumm,Chiva
s, Perrier-
Jouet,
Plymouth
Gin, Campo
Viejo
1,02% 0,78% -
Dynamic growth for strategic international brands as well as strategic wine portfolio
Concentration on prestige part of the market, particularly in London as the number of high-worth individuals is growing.
Germany Mature 4%
Lillet, Chivas,
Absolut,
Jameson,
Ballantine’s,
Malibu,
Monkey 47,
Havana Club,
Ramazzoti,
Aperitivo
Rosato
0,7% 1,19% -
Market leadership position of the Group
Increased focus on prestige categories as Germany is one of the markets with the largest number of high-net worth individuals
Key drivers of the growth are prestige portfolio (+19%) and innovation (+12%).
Growth of imported brands for international categories; decline of local brands for brandies, schnapps and Colon categories.
Success in the aperitif segment
Spain Mature 5%
Seagram’s
Gin and
Beefeater,
Chivas,
Ballantine’s,
The Glenlivet,
Campo Viejo
3,2% -0,008% -
Market leadership with 24% market share
Pernod Ricard is #1 in gin category with the most complete portfolio: Beefeater Dry, Seagram’s Gin, Beefeater 24, Plymouth Gin, Burrough’s Reserve,
This report is published for educational purposes only by students competing in The CFA Institute Research Challenge.
Appendix 3 Market analysis (1/2)

Pernod Ricard - Student Research. Target Price: €153.7 Recommandation: BUY
15
Appendix 3 Market analysis (2/2)
Poland Emerging 10%
Chivas,
Ballantine’s,
Jameson,
Absolut,
Wyborowa,
Ostoya, Pan
tadeusz.
2,8% -0,1% -
Quickly growing market in Eastern Europe
Price-sensitive consumer base, very competitive commercial environment
Russia Emerging 16%
Ararat,
Jameson,
Ballantine’s,
Chivas,
Absolut
-0,4% 0,18%
Difficult
environment
linked to
currency
volatility
Very dynamic and promising market
Penetration of imported Western style spirits is still low – 4-5%
China Emerging 2%
Martell,
Absolut,
Glenlivet,
Ballantine’s
6,7% 0,54%
Anti-
extravaganza
campaign, which
has seen a
crackdown on
conspicuous
spending and
gifting
Return to growth for the first time from FY13
From 2000 to 2010 the growth was driven by the Absolut Chinese consumer and Prestige portfolio. Due to emerging middle class, today Pernod Ricard in China has 2 different routes to market: premium and prestige
India Emerging 1%
Blender’s
Pride, Royal
Stag, Imperial
Blue
6,9% 1,15%
Demonetisation
(impact on Q1
and Q2);
Highway ban
(Impact on Q4
and Q1 FY18);
GST (margin
pressure on
FY18)
Market leadership with 45% value market share
Temporary deceleration of growth in FY17 due to regulatory changes
Leadership position in premium, local and international whiskey
South
Africa Emerging 15,7%
Jameson,
Martell,
Chivas,
Ballantine’s,
Absolut
-1,3% 1,62%
Economic
difficulties
across the
continent
related to petrol
and commodity
prices
#1 market in Africa At the group level, the region
is small, but it continues to grow double digits year by year.
Growth drivers: a) fast growing consumer base; b) emerging middle class; c) fast urbanization.
Source: Company data, S&P Capital IQ, team analysis
This report is published for educational purposes only by students competing in The CFA Institute Research Challenge.

Pernod Ricard - Student Research. Target Price: €153.7 Recommandation: BUY
22%
23%
23%
24%
24%
25%
25%
26%
6
7
8
9
10
11
12
2012 2013 2014 2015 2016 2017
Shar
e o
f to
tal
net
sal
es
In m
illi
on
of
9 li
ters
bo
x so
ld
Absolute
0%
2%
4%
6%
8%
10%
12%
14%
16%
0
1
2
3
4
5
6
7
2012 2013 2014 2015 2016 2017
Shar
e o
f to
tal n
et s
ales
In m
illi
on
of
9 li
ters
bo
x so
ld
Jameson
7.6%
7.8%
8.0%
8.2%
8.4%
8.6%
8.8%
9.0%
0
1
2
3
4
5
2012 2013 2014 2015 2016 2017
Shar
e of
tot
al n
et s
ales
In m
illi
on o
f 9
lite
rs b
ox s
old
Havana Club
0%
1%
2%
3%
4%
5%
6%
7%
8%
9%
1.0
1.5
2.0
2.5
3.0
3.5
4.0
2012 2013 2014 2015 2016 2017
Shar
e o
f to
tal n
et s
ales
In m
illi
on
of
9 li
ters
bo
x so
ld
Malibu
3.7%
3.8%
3.9%
4.0%
4.1%
4.2%
4.3%
4.4%
4.5%
4.6%
1.8
1.9
1.9
2.0
2.0
2.1
2.1
2.2
2012 2013 2014 2015 2016 2017
Shar
e of
tot
al n
et s
ales
In m
illi
on o
f 9
lite
rs b
ox s
old
Martell
0.0%
0.5%
1.0%
1.5%
2.0%
2.5%
0.0
0.2
0.4
0.6
0.8
1.0
1.2
2012 2013 2014 2015 2016 2017
Shar
e o
f to
tal n
et s
ales
In m
illi
on
of
9 li
ters
bo
x so
ld
The Glenlivet
0.0%
0.1%
0.2%
0.3%
0.4%
0.5%
0.6%
0.7%
0.0
0.1
0.1
0.2
0.2
0.3
0.3
0.4
2012 2013 2014 2015 2016 2017
Shar
e of
tot
al n
et s
ales
In m
illi
on o
f 9
lite
rs b
ox s
old
Perrier-Jouet
11.5%
12.0%
12.5%
13.0%
13.5%
14.0%
14.5%
0.0
1.0
2.0
3.0
4.0
5.0
6.0
7.0
8.0
201220132014201520162017
Shar
e o
f to
tal
net
sale
s
In m
illi
on
of
9 li
ters
bo
x so
ld
Ballantine's
9.0%
9.5%
10.0%
10.5%
11.0%
11.5%
4.0
4.2
4.4
4.6
4.8
5.0
5.2
5.4
201220132014201520162017
Shar
e of
tot
al n
et s
ales
In m
illi
on o
f 9
lite
rs b
ox s
old
Ricard
This report is published for educational purposes only by students competing in The CFA Institute Research Challenge.
Appendix 4 Evolution of Strategic International Brands
Source: Annual reports Source: Annual reports Source: Annual reports
Source: Annual reports Source: Annual reports Source: Annual reports
Source: Annual reports Source: Annual reports Source: Annual reports
16

Pernod Ricard - Student Research. Target Price: €153.7 Recommandation: BUY
0
1
2
3
4
5Total Strenghts
Total Weakenesses
Total Opportunities
Total Threats
Appendix 5 SWOT analysis
This report is published for educational purposes only by students competing in The CFA Institute Research Challenge.
Source: Team analysis
17
S W
O T
• Leading brands in each main category ofalcohol• Improving financials thanks to high-margin
brands• Suitable acquisitions at sensible multiples• Sales diversified by region and type ofalcohol• « Brand Builder »: the group is strongly
invested in the development of its newacquisitions
• Commitment to an environmental andsocially responsible chart• Strong advertising and branding of its
portfolio• « Drink less but drink better » trend
• Major international player inmature markets and in high-growth potential markets
• Robust distribution network andnegociation power due to its size
• Not present in the beer segment• Lack of presence in the market in the RTD(Malibu)
• Low digital presence despite efforts• Rising free-float, increasing the risk of
loosing control• Still important indebtedness -> sensitive toincreasing interest rates
• Negative price/mix effect (0% on the 4 firstbrands)
• Vodka and Aniseed are not trendy anymore• No customer loyalty
• North american market is growing durablyand steadily• GDP, Medium class and population growthin the emergeant regions (China, India,Africa, Eastern Europe)
• Premiumization policy: weak priceelasticity on the demand on top-of-the-rangeproducts• Increasing of the aerian international traficand so of the travel retail sales• Growth of the market for RTD and punchs• Low presence in digital that can only beimproved (latest to arrive = weakest)• Penetration in emergent markets is notsaturated yet
• Slowing growth rate of the industry due toa slightly decreasing global consumption• Counterfeiting of alcoholic beverages in
China• Competition, especially in india
• Stiffening regulations and taxation on theliqueur industry that can play on theconsumption and the margins
• Consumer health concerns andsensibilisation campaingns mostly in
Western countries lead to a maturization ofthe european liqueur market• Being perceived as sin stocks and non-ISRinvestments• Increasing price of raw materials
• Production centralized ineurope (transaction andconversion risks)
• International group dependent oneconomical and political fluctuation(FX risk)
• Strong lobby (alcoholic beverages)
•Diminishing custom taxes in India

Pernod Ricard - Student Research. Target Price: €153.7 Recommandation: BUY
Appendix 6 Porter’s five forces analysis
This report is published for educational purposes only by students competing in The CFA Institute Research Challenge. 18
0 No threat
1 Insignificant threat
2 Low threat
3 Moderate
4 Significant threat
5 High threat
Legend
1 4
2
3
4
Threat of new entrants
Bargaining power of buyers
Bargaining power of suppliers
Industry rivalry
Threat of substitute products
Rivalry among competitors: Moderate
• The competitors are mostly specialized in a region, brands or price range.
• Margins in the sector are high, meaning that the competition is not severe (Herfindahl Hirschman index of 451).
• Nevertheless, there is a direct competition from leading groups on the wine and whiskey segments.
Threat of new entrants: Low
• The industry is composed by a significant share of local actors and a few main actors, holding most of the market
share.
• Highly profitable markets tend to attract new actors. However, the strong barriers at the entry make it roughly
likely.
• Note that local actors are continuously growing in emerging countries on specific products (Indian whiskey).
Bargaining power of buyers: Significant
• Buyers are the final consumer, restaurants/ bars/nightclubs or distributors.
• They are sensitive to price changes and reputation. Therefore, they might easily redirect themselves to
competition.
• However, as Pernod Ricard is focused on high income per capita consumers and offers premium products, the
power of buyers is not that significant.
Bargaining power of suppliers: Low
• The company produces all its alcohols. Hereby, it is sensitive to raw materials prices (corn, wheat, potatoes)
• To mitigate that risk, the company buys in high quantity and from several suppliers to generate economies of scale
Threat of substitute products: Significant
• Substitutes are an non negligible threat. Water can go from indirect substitution to direct substitution (Other
brands, RTD, supplier’s brands, local alcohols, other types of alcohols like beer…)

Pernod Ricard - Student Research. Target Price: €153.7 Recommandation: BUY
19
Appendix 7 PESTEL analysis
This report is published for educational purposes only by students competing in The CFA Institute Research Challenge.
PPolitics
EEconomy
SSocio-
cultural
• Influence of the politics on the alcohol distribution and taxation policies (Highway ban, Anti-extravaganza campaign) • Actions from public Authorities to sensibilize to alcohol’s dangers (Sensibilization campaigns)• Political instability in countries where PR is implemented (Africa, Asia, South-America…)
• Inflationary environments can affect the mix-price of the group• Unexpected and strong appreciation of € vs. $ (Production in euro and sales mainly in dollars)• Increasing interest rates (US 10Y and tensions in european bonds) • General context of economic recovery worldwide • Increasing GDP and income per capita in emerging countries -> benefiting premium products • Increasing wine demand worldwide for the second consecutive year
• Trend to consume less but better, especially in spirits: « Drink less and drink better »• Youth’s alcoholic consumption increasing• Growing « home consumption », to savour the moment and less consumption in bars, especially among young people
(PR’s target)• Productssubstitution: shifting from vodka to wines, whiskeys and tequila• Booming population in emergings countries and especially youth -> increasing possible consumer base
TTechnology
EEnvironment
LLegal
• Innovation and new lauch of products are essentials in the industry to retain and attract the consumer, leading to significant R&D investments. Example: Fast-growing RTDs
• Rise of e-commerce, especially in China• Manufacturing techniques, reducing costs
• Increasing environmental responsability in Western countries• Obligation to comply with environmental laws and contraints (could increase costs)• Consumers tend to buy ethical brands and companies
• Publi-promotional restrictions (Evin Law for example)• Sales restrictions for under-age people• Quality control of wines in some countries. • Restrictions in terms of origins designation blocking actors of the liqueur industry to expend as they wish (Irish
wiskeys, champagne…)• Alcohol and alcohol production is banned from certain regions of the world (some indian regions for example)
Source: Team analysis

Pernod Ricard - Student Research. Target Price: €153.7 Recommandation: BUY
Profitability Analysis
Company FY 2014 FY 2015 FY 2016 LTM FY 2014 FY 2015 FY 2016 LTM
Brown Forman 34.1% 34.4% 35.9% 35.0% 22.0% 21.8% 34.5% 23.0%
Diageo 33.6% 31.7% 31.5% 32.2% 21.9% 22.0% 21.4% 22.1%
Remy Cointreau 16.2% 18.1% 18.8% 22.5% 6.0% 9.6% 9.7% 17.4%
Constellation brands 27.3% 28.8% 31.4% 36.3% 39.9% 13.9% 16.1% 23.6%
Davide Campari 21.6% 23.2% 22.8% 22.5% 8.3% 10.6% 9.6% 11.4%
Lanson-BCC 14.0% 12.6% 10.9% 10.1% 5.8% 4.6% 4.3% 4.0%
Pernod Ricard 28.2% 28.4% 28.6% 28.8% 12.8% 10.1% 14.2% 15.5%
Mean 25.0% 25.3% 25.7% 26.8% 16.7% 13.2% 15.7% 16.7%
Median 27.3% 28.4% 28.6% 28.8% 12.8% 10.6% 14.2% 17.4%
EBITDA Margin Net Income Margin
Solvency Analysis
Company 2014 2015 2016 LTM 2014 2015 2016 LTM
Brown Forman 44.30x 36.55x 22.47x 16.50x 0.47x 0.79x 1.14x 1.84x
Diageo 4.89x 4.17x 5.13x 6.82x 2.85x 3.52x 2.95x 2.09x
Remy Cointreau 5.76x 5.91x 8.34x 11.96x 2.51x 2.68x 2.32x 1.58x
Constellation brands 5.79x 5.62x 5.16x 6.66x 4.45x 4.32x 4.18x 3.20x
Davide Campari 4.92x 5.24x 5.07x 7.19x 3.01x 2.26x 3.19x 3.15x
Lanson-BCC 4.31x 4.21x 3.73x 4.00x 12.25x 14.80x 17.69x 20.46x
Pernod Ricard 4.09x 4.50x 4.89x 5.91x 3.77x 3.73x 3.54x 3.03x
Mean 10.58x 9.46x 7.83x 8.43x 4.19x 4.59x 5.00x 5.05x
Median 4.92x 5.24x 5.13x 6.82x 3.01x 3.52x 3.19x 3.03x
EBIT/Interest Exp Net Debt / EBITDA
EV multiples
Company 2014 2015 2016 LTM 2014 2015 2016 LTM
Brown Forman 17.69x 21.33x 19.89x 22.86x 6.04x 7.34x 7.14x 8.00x
Diageo 17.23x 20.64x 20.76x 18.64x 5.79x 6.54x 6.53x 6.01x
Remy Cointreau 21.40x 20.75x 20.20x 22.78x 3.48x 3.51x 3.79x 5.13x
Constellation brands 14.19x 18.40x 20.00x 18.15x 3.87x 5.30x 6.28x 6.59x
Davide Campari 14.14x 15.37x 17.77x 20.38x 3.06x 3.57x 4.06x 4.59x
Lanson-BCC 18.79x 21.23x 25.17x 29.80x 2.63x 2.68x 2.75x 3.01x
Pernod Ricard 14.58x 13.49x 14.81x 14.95x 4.11x 3.84x 4.23x 4.31x
Mean 16.86x 18.74x 19.80x 21.08x 4.14x 4.68x 4.97x 5.38x
Median 17.23x 20.64x 20.00x 20.38x 3.87x 3.84x 4.23x 5.13x
EV / EBITDA EV/Revenue
Per Share Analysis
Company 2014 2015 2016 LTM 2014 2015 2016 LTM
Brown Forman 10.34x 10.83x 12.66x 15.74x 27.08x 32.48x 19.55x 32.19x
Diageo 6.41x 5.82x 6.28x 5.99x 21.03x 24.03x 25.54x 23.13x
Remy Cointreau 3.21x 2.94x 3.17x 4.01x 52.94x 34.00x 34.35x 43.53x
Constellation brands 3.06x 4.04x 4.60x 5.23x 6.85x 29.83x 31.33x 23.92x
Davide Campari 2.38x 2.88x 3.02x 3.89x 29.45x 29.00x 35.43x 35.94x
Lanson-BCC 1.02x 0.85x 0.80x 0.90x 14.27x 17.73x 18.98x 23.76x
Pernod Ricard 2.07x 1.80x 2.08x 2.25x 23.88x 27.62x 22.60x 22.22x
Mean 4.07x 4.16x 4.66x 5.43x 25.07x 27.81x 26.83x 29.24x
Median 3.06x 2.94x 3.17x 4.01x 23.88x 29.00x 25.54x 23.92x
P/BV P/E (Diluted)
This report is published for educational purposes only by students competing in The CFA Institute Research Challenge.
Appendix 8 Comparable companies analysis
20
Source: S&P Capital IQ

Pernod Ricard - Student Research. Target Price: €153.7 Recommandation: BUY
Appendix 9 Share price performance
0
1 000
2 000
3 000
4 000
5 000
6 000
7 000
70
80
90
100
110
120
130
140
150
jan
v.-
15
fév
r.-1
5
mar
s-1
5
avr.
-15
mai
-15
juin
-15
juil
.-1
5
aoû
t-1
5
sep
t.-1
5
oct
.-1
5
no
v.-
15
déc
.-1
5
jan
v.-
16
fév
r.-1
6
mar
s-1
6
avr.
-16
mai
-16
juin
-16
juil
.-1
6
aoû
t-1
6
sep
t.-1
6
oct
.-1
6
no
v.-
16
déc
.-1
6
jan
v.-
17
fév
r.-1
7
mar
s-1
7
avr.
-17
mai
-17
juin
-17
juil
.-1
7
aoû
t-1
7
sep
t.-1
7
oct
.-1
7
no
v.-
17
déc
.-1
7
Vo
ulm
e in
k t
ran
sact
ion
s (P
ern
od
Ric
ard
)
R²: 0.87
CAC 40
Pernod Ricard
Appendix 10 Performance positioning (Pernod Ricard vs. peers)
-8%
-3%
2%
7%
12%
17%
22%
10% 15% 20% 25% 30% 35% 40%
Re
po
rte
d g
row
th i
n 2
01
6/
17
(%)
Operating margin in 2016/17 (%)
Diageo
Rémy Cointreau
Pernod Ricard Constellation Brands
Brown Forman
This report is published for educational purposes only by students competing in The CFA Institute Research Challenge. 21
Source: S&P Capital IQ, Bloomberg
Source: S&P Capital IQ,

Pernod Ricard - Student Research. Target Price: €153.7 Recommandation: BUY
Appendix 11 Key financials
Appendix 12 M-Score
This report is published for educational purposes only by students competing in The CFA Institute Research Challenge.
𝑀 − 𝑠𝑐𝑜𝑟𝑒 = −4.84 + 0.92 × 𝐷𝑆𝑅𝐼 + 0.528 × 𝐺𝑀𝐼 + 0.404 × 𝐴𝑄𝐼 + 0.892 × 𝑆𝐺𝐼 + 0.115 × 𝐷𝐸𝑃𝐼 − 0.172 × 𝑆𝐺𝐴𝐼 + 4.679 × 𝑇𝐴𝑇𝐴 − (0.327 ∗ 𝐿𝑉𝐺𝐼)
Inputs Variables 2013 2014 2015 2016 2017
Net Sales 8 575 7 945 8 558 8 682 9 010
Costs of Goods Sold 3 224 2 958 3 262 3 311 3 407
Net Receivables 1 257 1 147 1 307 1 258 1 347
Current Assets 6 507 6 648 7 420 7 288 7 531
Property Plant and Equiptment 1 940 2 012 2 194 2 360 2 298
Depreciation 185 203 214 219 219
Total Assets 27 537 27 616 30 398 30 598 30 088
Selling general and Administrative Expenses 3 146 2 948 3 077 3 109 3 223
Net Income 1 172 1 016 861 1 235 1 393
Cash Flow from Operations 1 085 940 1 035 1 336 1 642
Current Liabilities 4 418 3 905 5 138 4 956 4 256
Long-term Debt 7 712 7 674 7 458 7 335 7 380
Derivated Variables
Day's Sales Receivables Index (DSRI) 0.98 1.06 0.95 1.03
Gross Margin Index (GMI) 0.99 1.01 1.00 0.99
Asset Quality Index (AQI) 1.02 0.94 1.02 1.02
Sales Growth Index (SGI) 0.93 1.08 1.01 1.04
Depreciation Index (DEPI) 0.95 1.03 1.05 0.98
SG&A expenses Index (SGAI) 1.01 0.97 1.00 1.00
Leverage Index (LVGI) 0.95 0.99 0.97 0.96
Total Accuals to total assets (TATA) 0.00 -0.01 0.00 -0.01
M-score -2.5326 -2.3864 -2.5074 -2.4416
Result: We observe that the company is unlikely to manipulate its earnings as its M-score is always < -2.22
Source: S&P Capital IQ, Team estimates
Source: S&P Capital IQ, Team estimates
22
Key financial ratio 2015 2016 2017 2018e 2019e 2020e
Liquidity Ratio
Current Ratio 1.44x 1.47x 1.77x 1.77x 1.80x 1.83x
Quick Ratio 0.37x 0.38x 0.49x 0.42x 0.46x 0.48x
Cash Ratio 0.11x 0.11x 0.16x 0.07x 0.12x 0.13x
Efficiency Ratio
Total Asset Turnover 0.30x 0.28x 0.30x 0.30x 0.31x 0.32x
Fixed Asset Turnover 4.07x 3.81x 3.87x 3.80x 3.58x 3.37x
Acc Receivable Turnover 6.63x 6.43x 6.57x 6.33x 6.41x 6.52x
Inventory Turnover 1.68x 1.63x 1.70x 1.68x 1.68x 1.70x
Payables Period (days) 190 186 196 180 180 180
Operating Cycle (days) 273 281 270 275 275 271
Cash conversion Cycle (days) 468 453 430 469 457 457
Profitability Ratio
Gross Profit Margin 61.9% 61.9% 62.2% 62.0% 62.2% 62.5%
EBITDA Margin 28.4% 28.6% 28.8% 28.8% 29.3% 29.9%
EBIT Margin 25.9% 26.1% 26.4% 26.3% 26.8% 27.4%
Net Income Margin 10.1% 14.2% 15.5% 15.9% 16.5% 17.5%
ROA 3.0% 4.0% 4.6% 4.8% 5.1% 5.5%
ROE 6.5% 9.1% 10.0% 10.0% 10.1% 10.5%
ROCE 8.8% 8.8% 9.2% 9.2% 9.2% 9.6%
SG&A/Sale 36.0% 35.8% 35.8% 35.7% 35.4% 35.1%
Solvency Ratio
Debt Ratio 56% 56% 54% 52% 50% 48%
Debt to Equity Ratio 1.29x 1.27x 1.17x 1.07x 0.99x 0.91x
Equity Multiplier 2.29x 2.27x 2.17x 2.07x 1.99x 1.91x
Long Term Debt Ratio 94.8% 94.7% 94.7% 94.3% 94.0% 93.5%
Interest Coverage Ratio 4.50x 4.89x 5.91x 6.06x 6.48x 6.95x

Pernod Ricard - Student Research. Target Price: €153.7 Recommandation: BUY
2015 2016 2017 2018e 2019e 2020e 2021e 2022e 2023e 2024e 2025e 2026e 2027e
Total Revenue 8 558 8 682 9 010 9 196 9 530 9 873 10 202 10 518 10 834 11 159 11 494 11 838 12 194
COGS 3 262 3 311 3 407 3 494 3 602 3 703 3 775 3 839 3 954 4 073 4 195 4 321 4 451
Advertising and Promotion costs 1 625 1 646 1 691 1 747 1 811 1 876 1 938 1 998 2 058 2 120 2 184 2 249 2 317
Structuring costs 1 433 1 448 1 517 1 540 1 563 1 586 1 610 1 634 1 659 1 684 1 709 1 735 1 761
EBITDA 2 433 2 481 2 599 2 644 2 792 2 955 3 134 3 309 3 433 3 561 3 693 3 830 3 970
EBITDA Margin (in %) 28.4% 28.6% 28.8% 28.8% 29.3% 29.9% 30.7% 31.5% 31.7% 31.9% 32.1% 32.3% 32.6%
D&A 248 253 252 264 273 283 292 301 311 320 329 339 350
EBIT 2 219 2 262 2 380 2 414 2 554 2 709 2 879 3 046 3 162 3 282 3 406 3 534 3 666
EBIT Margin (in %) 25.9% 26.1% 26.4% 26.3% 26.8% 27.4% 28.2% 29.0% 29.2% 29.4% 29.6% 29.8% 30.1%
Net financial income -428 -400 -357 -350 -346 -342 -337 -333 -329 -325 -321 -317 -313
Net non current income -649 -182 -163 -138 -143 -99 -102 -105 -108 -112 -115 -118 -122
Pretax Income 1 101 1 663 1 859 1 926 2 065 2 268 2 439 2 608 2 725 2 846 2 970 3 098 3 231
in % of Total Revenue 12.9% 19.2% 20.6% 20.9% 21.7% 23.0% 23.9% 24.8% 25.2% 25.5% 25.8% 26.2% 26.5%
Income Taxes 221 408 438 433 465 510 549 587 613 640 668 697 713
Total Net Income 880 1 255 1 421 1 493 1 600 1 758 1 891 2 021 2 112 2 205 2 302 2 401 2 518
In % of Total Revenue 10.3% 14.5% 15.8% 16.2% 16.8% 17.8% 18.5% 19.2% 19.5% 19.8% 20.0% 20.3% 20.7%
Minority Interests -19 -20 -28 -28 -28 -28 -28 -28 -28 -28 -28 -28 -28
Group Net Income 861 1 235 1 393 1 465 1 572 1 730 1 863 1 993 2 084 2 177 2 274 2 373 2 490
In % of Total Revenue 10.1% 14.2% 15.5% 15.9% 16.5% 17.5% 18.3% 18.9% 19.2% 19.5% 19.8% 20.0% 20.4%
Historical ProjectedIncome statement (€m)
2015 2016 2017 2018e 2019e 2020e 2021e 2022e 2023e 2024e 2025e 2026e 2027e
Sales (% YoY growth) 7.7% 1.4% 3.8% 2.1% 3.6% 3.6% 3.3% 3.1% 3.0% 3.0% 3.0% 3.0% 3.0%
Organic growth (%YoY) 3.3% 1.8% 3.6% 4.2% 3.7% 3.6% 3.3% 3.1% 3.0% 3.0% 3.0% 3.0% 3.0%
Cost of Goods Sold (% margin) 38.1% 38.1% 37.8% 38.0% 37.8% 37.5% 37.0% 36.5% 36.5% 36.5% 36.5% 36.5% 36.5%
Advertising and promotion expenses (% margin) 19.0% 19.0% 18.8% 19.0% 19.0% 19.0% 19.0% 19.0% 19.0% 19.0% 19.0% 19.0% 19.0%
Structuring costs (% YoY growth) 0.4% 1.0% 4.8% 1.5% 1.5% 1.5% 1.5% 1.5% 1.5% 1.5% 1.5% 1.5% 1.5%
Depreciation & Amortization (% sales) 2.5% 2.5% 2.4% 2.5% 2.5% 2.5% 2.5% 2.5% 2.5% 2.5% 2.5% 2.5% 2.5%
Amort. of Goodwill and Intangible Assets (% sales) 0.4% 0.4% 0.4% 0.4% 0.4% 0.4% 0.4% 0.4% 0.4% 0.4% 0.4% 0.4% 0.4%
Unusual items (% sales) 7.6% 2.1% 1.8% 1.5% 1.5% 1.0% 1.0% 1.0% 1.0% 1.0% 1.0% 1.0% 1.0%
Tax rate (% EBT) 20.1% 24.5% 23.6% 22.5% 22.5% 22.5% 22.5% 22.5% 22.5% 22.5% 22.5% 22.5% 22.1%
Historical ProjectedIncome statement inputs
Top line growth 2015 2016 2017 2018e 2019e 2020e 2021e
Americas
Group structure (%) 0.6% -2.1% -0.3% 0.0% 0.0% 0.0% 0.0%
FX change (%) 8.2% -2.0% 0.9% -3.0% 0.0% 0.0% 0.0%
Organic growth (%) 5.6% 4.0% 6.9% 5.5% 4.5% 4.0% 3.5%
Reported growth (%) 14.4% -0.1% 7.5% 2.5% 4.5% 4.0% 3.5%
Asia/ROW
Group structure (%) -0.2% -0.3% 0.0% 0.0% 0.0% 0.0% 0.0%
FX change (%) 9.9% 0.8% 0.7% -2.8% 0.0% 0.0% 0.0%
Organic growth (%) 4.0% 0.8% 1.4% 5.6% 5.0% 5.0% 4.5%
Reported growth (%) 13.7% 1.3% 2.1% 2.8% 5.0% 5.0% 4.5%
Europe
Group structure (%) -0.4% 0.0% 0.3% 0.0% 0.0% 0.0% 0.0%
FX change (%) -1.4% -1.9% -0.9% -0.5% 0.0% 0.0% 0.0%
Organic growth (%) 0.3% 1.1% 3.4% 1.2% 1.0% 1.3% 1.5%
Reported growth (%) -1.5% -0.8% 2.8% 0.7% 1.0% 1.3% 1.5%
Appendix 13 Income statement
This report is published for educational purposes only by students competing in The CFA Institute Research Challenge. 23
Source: Company data, team estimates
Source: Company data, team estimates
Source: Company data, team estimates

Pernod Ricard - Student Research. Target Price: €153.7 Recommandation: BUY
This report is published for educational purposes only by students competing in The CFA Institute Research Challenge.
Assets
Intangible assets 12 212 12 085 11 755 11 755 11 755 11 755 11 755 11 755 11 755 11 755 11 755 11 755 11 755
Goodwill 5 494 5 486 5 397 5 397 5 397 5 397 5 397 5 397 5 397 5 397 5 397 5 397 5 397
PPE 2 194 2 360 2 298 2 538 2 791 3 061 3 344 3 641 3 950 4 270 4 601 4 945 5 302
Other LT Assets + LT Inv 739 874 730 730 730 730 730 730 730 730 730 730 730
Deferred Tax Assets 2 339 2 505 2 377 2 377 2 377 2 377 2 377 2 377 2 377 2 377 2 377 2 377 2 377
Total non-current assets 22 978 23 310 22 557 22 797 23 050 23 320 23 603 23 900 24 209 24 529 24 860 25 204 25 561
Inventory 5 351 5 294 5 305 5 361 5 527 5 681 5 791 5 890 6 067 6 249 6 436 6 630 6 828
Total Receivables 1 376 1 324 1 418 1 436 1 488 1 542 1 593 1 643 1 692 1 743 1 795 1 849 1 904
Other 148 101 131 134 138 143 148 153 157 162 167 172 177
Cash 545 569 677 727 716 815 1 032 1 347 1 675 2 141 2 647 3 195 3 792
Total current assets 7 420 7 288 7 531 7 658 7 869 8 181 8 565 9 032 9 591 10 295 11 046 11 845 12 702
Total assets 30 398 30 598 30 088 30 455 30 920 31 500 32 168 32 933 33 800 34 823 35 906 37 049 38 263
Equity and liabilities 2015 2016 2017 2018e 2019e 2020e 2021e 2022e 2023e 2024e 2025e 2026e 2027e
Total equity 13 288 13 506 13 886 14 689 15 554 16 513 17 550 18 664 19 831 21 051 22 327 23 660 25 061
LT Debt 7 458 7 335 7 380 6 880 6 380 5 905 5 455 5 030 4 630 4 330 4 030 3 730 3 430
Deferred tax liabilities 3 373 3 556 3 421 3 421 3 421 3 421 3 421 3 421 3 421 3 421 3 421 3 421 3 421
Other non current assets 1 141 1 245 1 145 1 145 1 145 1 145 1 145 1 145 1 145 1 145 1 145 1 145 1 145
Total non-current liabilities 11 972 12 136 11 946 11 446 10 946 10 471 10 021 9 596 9 196 8 896 8 596 8 296 7 996
Accounts payable 1 696 1 688 1 826 1 762 1 816 1 866 1 903 1 935 1 993 2 053 2 115 2 178 2 244
Accrued expenses 604 583 611 648 671 695 719 741 763 786 810 834 859
Other current liabilities 2 838 2 685 1 819 1 912 1 933 1 955 1 976 1 996 2 016 2 037 2 059 2 081 2 103
Total current liabilities 5 138 4 956 4 256 4 321 4 420 4 517 4 597 4 672 4 773 4 876 4 983 5 093 5 206
Total equity and liabilities 30 398 30 598 30 088 30 455 30 920 31 500 32 168 32 933 33 800 34 823 35 906 37 049 38 263
2022e 2023e 2024e 2025e 2026e 2027e
Historical ProjectedBalance sheet statement (€m)
2015 2016 2017 2018e 2019e 2020e 2021e
2015 2016 2017 2018e 2019e 2020e 2021e 2022e 2023e 2024e 2025e 2026e 2027e
Days Payable Outstanding 189.8 186.1 195.6 184.0 184.0 184.0 184.0 184.0 184.0 184.0 184.0 184.0 184.0
Days Sales Outstanding 58.7 55.7 57.4 57.0 57.0 57.0 57.0 57.0 57.0 57.0 57.0 57.0 57.0
Days Inventory Held 598.7 583.6 568.3 560.0 560.0 560.0 560.0 560.0 560.0 560.0 560.0 560.0 560.0
Prepaid and other current assets 1.7% 1.2% 1.5% 1.5% 1.5% 1.5% 1.5% 1.5% 1.5% 1.5% 1.5% 1.5% 1.5%
Accrued Liabilities 7.1% 6.7% 6.8% 7.0% 7.0% 7.0% 7.0% 7.0% 7.0% 7.0% 7.0% 7.0% 7.0%
Other current liabilities 6.4% 6.4% 5.5% 6.4% 6.4% 6.4% 6.4% 6.4% 6.4% 6.4% 6.4% 6.4% 6.4%
Balance sheet inputsHistorical Projected
0
500
1 000
1 500
2 000
2 500
3 000
juin 20 avr-21 janv-22 juil-22 sept-23 sept-24 mai-26 juin-26 janv-42
To
tal
am
ou
nt
of
corp
ora
te b
on
d i
ssu
ed
Maturity
Appendix 14 Balance sheet statement
Appendix 15 Corporate bonds
24
Source: Team estimates
Source: Company data, team estimates
Source: Bloomberg

Pernod Ricard - Student Research. Target Price: €153.7 Recommandation: BUY
2015 2016 2017 2018e 2019e 2020e 2021e 2022e 2023e 2024e 2025e 2026e 2027e
Net Income 861 1 235 1 393 1 465 1 572 1 730 1 863 1 993 2 084 2 177 2 274 2 373 2 490
D&A 214 219 219 230 238 247 255 263 271 279 287 296 305
Net change in WCR 529 -26 -835 -12 -123 -116 -86 -78 -130 -134 -138 -142 -146
Other operating items 153 60 109 -84 -90 -95 -100 -105 -110 -115 -121 -126 -132
Cash flow from Ops. 1 757 1 488 886 1 598 1 598 1 766 1 931 2 073 2 114 2 207 2 302 2 401 2 517
CAPEX -323 -333 -367 -368 -381 -395 -408 -421 -433 -446 -460 -474 -488
Other investing items 38 -42 57 -103 -110 -121 -130 -140 -146 -152 -159 -166 -174
Cash flow from Inv. -285 -375 -310 -470 -491 -516 -538 -560 -579 -599 -619 -640 -662
FCF 1 472 1 113 576 1 128 1 107 1 250 1 393 1 513 1 535 1 608 1 683 1 761 1 855
Dividends paid -461 -497 -496 -542 -582 -640 -689 -737 -771 -806 -841 -878 -921
Debt issuance / (rep.) -260 -413 -609 -500 -500 -475 -450 -425 -400 -300 -300 -300 -300
issuance / (rep.) -13 -18 -36 -36 -36 -36 -36 -36 -36 -36 -36 -36 -36
Cash flow from fin. -734 -928 -1 141 -1 078 -1 118 -1 151 -1 175 -1 198 -1 207 -1 142 -1 177 -1 214 -1 257
Net change in cash flow 738 185 -565 50 -11 99 217 314 328 467 506 547 597
Beginning cash balance 477 545 569 677 727 716 815 1 032 1 347 1 675 2 141 2 647 3 195
Ending cash balance 545 569 677 727 716 815 1 032 1 347 1 675 2 141 2 647 3 195 3 792
ProjectedHistoricalCash flow statement (€m)
Cash flow inputs 2015 2016 2017 2018e 2019e 2020e 2021e 2022e 2023e 2024e 2025e 2026e 2027e
CAPEX (% sales) -3.8% -3.8% -4.1% -4.0% -4.0% -4.0% -4.0% -4.0% -4.0% -4.0% -4.0% -4.0% -4.0%
Dividends (% earnings) -53.5% -40.2% -35.6% -37.0% -37.0% -37.0% -37.0% -37.0% -37.0% -37.0% -37.0% -37.0% -37.0%
Other Operating activities (% Dep.) 0.3% 0.3% 1.6% 1.6% 1.6% 1.6% 1.6% 1.6% 1.6% 1.6% 1.6% 1.6% 0.0%
Purchase of financial assets (% Net Income) 9.2% 8.7% 2.5% 7.0% 7.0% 7.0% 7.0% 7.0% 7.0% 7.0% 7.0% 7.0% 7.0%
Net Debt (€ m) 2015 2016 2017 2018e 2019e 2020e
LT Debt 7 458 7 335 7 380 6 880 6 380 5 905
(+) ST Debt 2 173 2 027 1 167 1 167 1 167 1 167
(=) Total Debt 9 631 9 362 8 547 8 047 7 547 7 072
(-) Cash 545 569 677 727 716 815
(=) Net Debt 9 086 8 793 7 870 7 320 6 831 6 257
Net Debt/EBITDA 3.7 3.5 3.0 2.8 2.4 2.1
46 867 - 7 853
- 18038 834
20 000
25 000
30 000
35 000
40 000
45 000
50 000
Enterprise Value Net debt Minorities Equity Value
Appendix 16 Cash flow statement
Appendix 17 Reconciliation of Equity Value
This report is published for educational purposes only by students competing in The CFA Institute Research Challenge. 25
Source: Company data, team estimates
Source: team estimates
Source: Company data, team estimates
Source: Company data, team estimates

Pernod Ricard - Student Research. Target Price: €153.7 Recommandation: BUY
DCF (In €million) 2018e 2019e 2020e 2021e 2022e 2023e 2024e 2025e 2026e 2027e
Sales 9 196 9 530 9 873 10 202 10 518 10 834 11 159 11 494 11 838 12 194
% growth 2.1% 3.6% 3.6% 3.3% 3.1% 3.0% 3.0% 3.0% 3.0% 3.0%
EBITDA 2 644 2 792 2 955 3 134 3 309 3 433 3 561 3 693 3 830 3 970
% margin 28.8% 29.3% 29.9% 30.7% 31.5% 31.7% 31.9% 32.1% 32.3% 32.6%
EBIT 2 414 2 554 2 709 2 879 3 046 3 162 3 282 3 406 3 534 3 666
% margin 26.3% 26.8% 27.4% 28.2% 29.0% 29.2% 29.4% 29.6% 29.8% 30.1%
Taxes 433 465 510 549 587 613 640 668 697 713
EBIAT 1 981 2 089 2 198 2 330 2 460 2 549 2 642 2 738 2 836 2 953
(+) Depreciation & Amortization 196 203 211 218 224 231 238 245 253 260
(-) Capital Expenditures -368 -381 -395 -408 -421 -433 -446 -460 -474 -488
(-) Increase in Net Working Capital -12 -123 -116 -86 -78 -130 -134 -138 -142 -146
Unlevered Free Cash Flow 1 797 1 788 1 898 2 053 2 185 2 217 2 300 2 385 2 473 2 579
Discount Factor 1.00 0.94 0.88 0.83 0.78 0.73 0.69 0.65 0.61 0.57
Present Value of Free Cash Flow 1 797 1 681 1 677 1 705 1 705 1 626 1 585 1 545 1 506 1 476
WACC by
geographic
area
E/(E+D) D/(E+D) β Rf E(Rm)Cost of
equity
Cost of
Debt
Corporate
tax rateWACC
Asia / ROW 62.6% 37.4% 0.8 5.5% 11% 9.9% 3.80% 22% 7.3%
Europe 62.6% 37.4% 0.54 1.20% 8.2% 5.0% 3.80% 23% 4.2%
Americas 62.6% 37.4% 1.12 2.55% 10% 10.3% 3.80% 23% 7.6%
Total 62.6% 37.4% 0.81 3.3% 9.7% 8.5% 3.8% 22.5% 6.40%
DCF: €146.5
EV/EBITDA:€160.9
Appendix 18 Valuation
Appendix 19 Monte Carlo simulation
This report is published for educational purposes only by students competing in The CFA Institute Research Challenge. 26
Source: team estimates
Source: team estimates
Source: team estimates
Stock price at T0 130.95
Wacc 6.40%
Period 1 year
Volatility 10%
Trials 50 000
Monte Carlo simulation Inputs
Statistics Gross
Mean 144.81
Median 144.09
Standard Deviation 14.54
Variance 211.47
Kustosis 0.19
Skewness 0.30
Coeff of Variation 0.10
Minimum 95.39
25% Percentile 134.74
75% Percentile 154.16
Maximum 220.23
Monte Carlo simulation outputs
Recommendation Range Frequency
SELL < 131.5 8972
HOLD 131.5-143.5 15233
BUY > 143.5 25795
Monte Carlo simulation outputs

Pernod Ricard - Student Research. Target Price: €153.7 Recommandation: BUY
Board of directors Independent Female/MalePosition at Pernod
RicardCommittee
Nb of years
on the Board
Compensation
(in EUR)
Number of
shares
End of
the term
Anne Lange Yes Female - Strategic 1 68 000 100 2021
Manousos Charkoft No Male Employee Director Compensation 4 15 000 50 2017
Wolfgang Colberg Yes Male -
Strategic, Audit,
Nomination,
Governance, CSR
9 113 500 1 076 2020
Kory Sorenson Yes Female -Compensation,
Audit2 97 500 1 000 2019
Gilles Samyn Yes Male - Audit 3 78 500 1 000 2018
Veronica Vargas No Female - - 2 54 000 6 820 2021
Pierre Pringuet No MaleChairman of Board of
Directors
Compensation,
Strategic13 113 500 380 088 2020
Nicole Bouton Yes Female -
Compensation,
Nominations,
Governance, CSR
10 83 500 1 150 2019
César Giron No Male -
Strategic,
Nominations,
Governance, CSR
9 69 500 5 587 2020
Sylvain Carré No Male Employee Director - 4 15 000 - 2017
Martina Gonzales-Gallarza No Female - - 5 44 500 1 100 2018
Paul-Charles Ricard No MaleRepresentative of
Société Paul Ricard- 34 39 500 24 579 562 2021
Ian Gallienne Yes Male - Compensation 5 87 000 100 2018
Alexandre Ricard No Male CEO and Chairman Strategic 5 1 868 000 57 556 2020
Composition of the board
50.2%
97.0%
45.8%
83.7%
45.7%
49.8%3.0%
54.2% 16.3% 54.3%
0%
10%
20%
30%
40%
50%
60%
70%
80%
90%
100%
Brown Forman Diageo Pernod Ricard Constellation Brands Rémy Cointreau
Free-float Non-float
Appendix 20 Governance (1/2)
This report is published for educational purposes only by students competing in The CFA Institute Research Challenge. 27
Source: registration document
Source: S&P Capital IQ, registration document

Pernod Ricard - Student Research. Target Price: €153.7 Recommandation: BUY
Appendix 21 Governance (2/2)
Based on ISS Governance methodology: a decile score of 1 indicates lower governance risk
This report is published for educational purposes only by students competing in The CFA Institute Research Challenge.
• Board structure: the AFEP-MEDEF code had considered the possibility that Ian Galienne and GillesSamyn, administrators at Groupe Bruxelles Lambert (GBL) could be not independent when GBL crossedthe 10% voting rights threshold. Note that the independency rate is at only 50%
• Shareholder rights: double voting rights are accorded to registered shareholder owning share since atleast ten years. According to us, only 5 major shareholders own double voting rights (« Société PaulRicard », « Mr Rafaël Gonzalez-Gallarza », « Directors and Management of Pernod Ricard », « Shares heldby Pernod Ricard employees », « Groupe Bruxelles Lambert »)
• Compensation: the group is transparent concerning compensation as it provides Administrators’ andExecutive Directors’ compensations. Note that 2016/17 granted compensation established at €3.6bn(+33% vs 2015/16), mostly due to gaining value of group’s shares.
• Audit and oversight: as far as we know, neither of Pernod Ricard’s auditors (KPMG S.A and Deloitte &Associés) restated financials or issued adverse opinions over the past two years
28
Source: team analysis
Board structure: 7/10
- Independency
Compensation: 2/10
- Transparency
Shareholder rights: 5/10
- Double voting rights
Audit and risk oversight: 2/10
- Adverse opinion
- Restated financials
Total score: 4/10

Pernod Ricard - Student Research. Target Price: €153.7 Recommandation: BUY
29 This report is published for educational purposes only by students competing in The CFA Institute Research Challenge.
Term Meaning
EUR; € Euro
USD; $ Dollar
CNY; RMB Yuan
GBP; £ Pound Sterling
m millions
bn billions
k thousands
EBITDA Earnings before interest, taxes, depreciation and amortization
EBIT Earnings before interest and taxes
CAGR Compound annual growth rate
ST Short term
LT Long term
GDP Growth domestic product
Capex Capital expenditures
EPS Earnings per share
DPS Dividends per share
FCF Free cash flow
M&A Mergers and Acquisitions
LTM Last twelve months
ROE Return on equity
ROCE Return on capital employed
EV Enterprise value
WACC Weighted average cost of capital
IR presentation Investor relation presentation
DCF Discounted cash flow
CEO Chief Executive Officer
vs versus
SIB Strategic International Brands
SLB Strategic Local Brands
MCSI Michigan Consumer Sentiment Index
loc. cur. Local currency
ROW Rest of the World
2017 Fiscal year 2016/17
2018 Fiscal year 2017/18
GBL Groupe Bruxelles Lambert
SIB Strategic International Brands
SLB Strategic Local Brands
CSR Corporate Social Responsability
Glossary
Appendix 22 Glossary

Disclosures: Ownership and material conflicts of interest: The author(s), or a member of their household, of this report does not hold a financial interest in the securities of this company. The author(s), or a member of their household, of this report does not know of the existence of any conflicts of interest that might bias the content or publication of this report.
Receipt of compensation: Compensation of the author(s) of this report is not based on investment banking revenue.
Position as a officer or director: The author(s), or a member of their household, does not serve as an officer, director or advisory board member of the subject company.
Market making: The author(s) does not act as a market maker in the subject company’s securities.
Disclaimer: The information set forth herein has been obtained or derived from sources generally available to the public and believed by the author(s) to be reliable, but the author(s) does not make any representation or warranty, express or implied, as to its accuracy or completeness. The information is not intended to be used as the basis of any investment decisions by any person or entity. This information does not constitute investment advice, nor is it an offer or a solicitation of an offer to buy or sell any security. This report should not be considered to be a recommendation by any individual affiliated with CFA Society France, CFA Institute or the CFA Institute Research Challenge with regard to this company’s stock.
CFA Institute Research Challenge
30


![[International Business] Pernod Ricard](https://static.fdocuments.net/doc/165x107/58a0754c1a28ab19098b4a5b/international-business-pernod-ricard.jpg)