CERTIFICATIONresearch-serc.org/t_d/AMOUR MSc -DISERTATION.pdf · Instart 3 Trial version and...
114
i CERTIFICATION The undersigned certifies that she has read and hereby recommends for acceptance by the University of Dodoma dissertation entitled Anthropogenic Impacts on Mangrove and their associated macrofauna in Wesha and Ngezi Pemba Islands, Tanzania in fulfillment of the requirements for the degree of Master of Science in Biodiversity Conservation of the University of Dodoma. ……………………………… Dr. Mariam Hamisi (SUPERVISOR) Date……………………………
Transcript of CERTIFICATIONresearch-serc.org/t_d/AMOUR MSc -DISERTATION.pdf · Instart 3 Trial version and...
i
CERTIFICATION
The undersigned certifies that she has read and hereby recommends for acceptance by
the University of Dodoma dissertation entitled Anthropogenic Impacts on Mangrove
and their associated macrofauna in Wesha and Ngezi Pemba Islands, Tanzania in
fulfillment of the requirements for the degree of Master of Science in Biodiversity
Conservation of the University of Dodoma.
………………………………
Dr. Mariam Hamisi
(SUPERVISOR)
Date……………………………
ii
DECLARATION AND COPYRIGHT
I Amour Hamad Saleh, do here by declare that this dissertation is my own original
work and that it has not been presented and will not be presented to any other University
or other academic institution for a similar degree award.
Signature…………………………………
No part of this study may be reproduced, stored in any retrieval system or transmitted in
any form with out permission of the author or the University of Dodoma.

iii
ACKNOWLEDGEMENT
On top of each and every one, appreciation and honour is to ALLAH MASSIVE for
giving me the strength, tolerance and get-up-and-go to complete this dissertation.
However, a number of people contributed in one way or another to make this study
successful. I would like to mention some of them. It is my pleasure to express my
sincere thanks and gratitude to my supervisor Dr. Mariam Hamisi, who devoted her
time and energy to firmly and adeptly supervise this dissertation. Her guidance,
encouragement and constructive ideas throughout the entire research period made it
possible to successfully complete this report.
I would like to express my sincere appreciations to my family for granting me funds,
support and encouragement which assisted me to carry out this degree. Special thanks
go to Dr. Islam Salum of the first Vice President office Zanzibar for his constructive
criticism and support which shaped this work. I also thank the Ministry of Education
and Vocational Training of Zanzibar for grating me an opportunity for further study at
the University of Dodoma. Furthermore, I am gratefully indebted to my friend Abdalla
Rashid Ali for supporting me during whole period of data collection identification and
storage of samples.
I also wish to extent my sincere gratitude to the Ministry of Agriculture and Natural
resources Pemba for providing authority to conduct this study in both Wesha as well as
Ngezi natural forest reserve. Moreover I would like to thanks all Lecturers from the
department of Biological Science for encourage me for providing moral and challenges
during the class session.

iv
DEDICATION
This work is dedicated to:-
My parents
My wife
My children
v
ABSTRACT
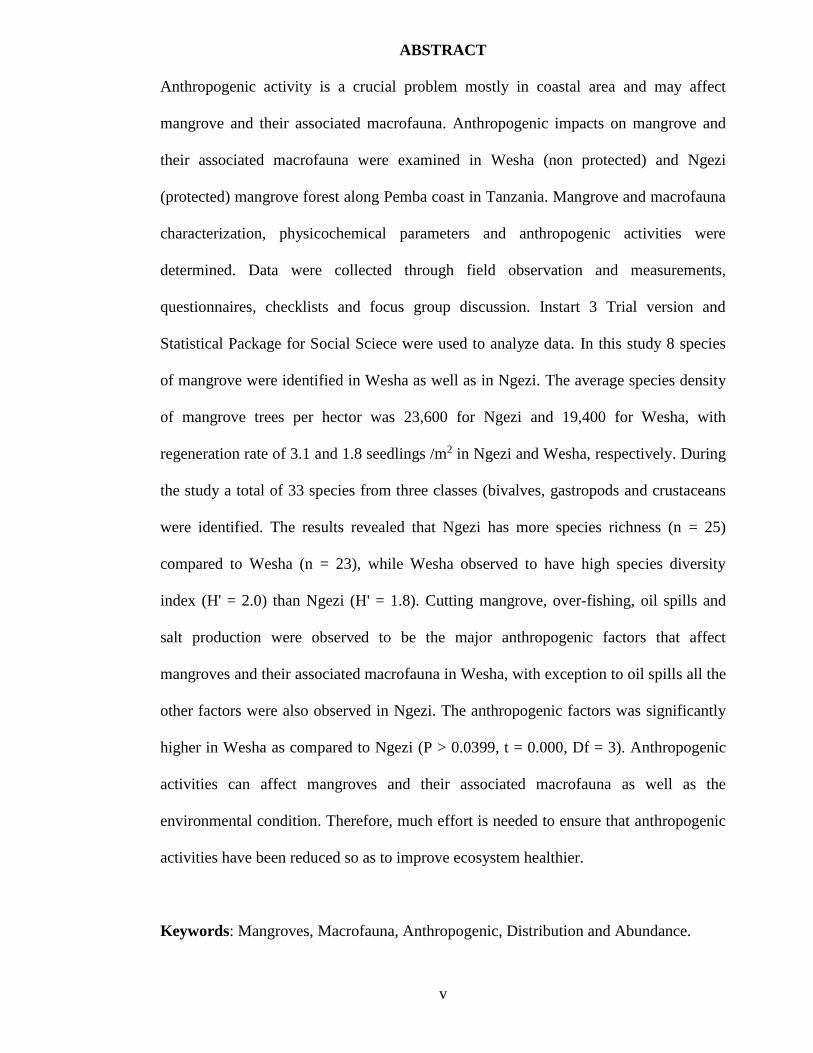
Anthropogenic activity is a crucial problem mostly in coastal area and may affect
mangrove and their associated macrofauna. Anthropogenic impacts on mangrove and
their associated macrofauna were examined in Wesha (non protected) and Ngezi
(protected) mangrove forest along Pemba coast in Tanzania. Mangrove and macrofauna
characterization, physicochemical parameters and anthropogenic activities were
determined. Data were collected through field observation and measurements,
questionnaires, checklists and focus group discussion. Instart 3 Trial version and
Statistical Package for Social Sciece were used to analyze data. In this study 8 species
of mangrove were identified in Wesha as well as in Ngezi. The average species density
of mangrove trees per hector was 23,600 for Ngezi and 19,400 for Wesha, with
regeneration rate of 3.1 and 1.8 seedlings /m2 in Ngezi and Wesha, respectively. During
the study a total of 33 species from three classes (bivalves, gastropods and crustaceans
were identified. The results revealed that Ngezi has more species richness (n = 25)
compared to Wesha (n = 23), while Wesha observed to have high species diversity
index (H' = 2.0) than Ngezi (H' = 1.8). Cutting mangrove, over-fishing, oil spills and
salt production were observed to be the major anthropogenic factors that affect
mangroves and their associated macrofauna in Wesha, with exception to oil spills all the
other factors were also observed in Ngezi. The anthropogenic factors was significantly
higher in Wesha as compared to Ngezi (P > 0.0399, t = 0.000, Df = 3). Anthropogenic
activities can affect mangroves and their associated macrofauna as well as the
environmental condition. Therefore, much effort is needed to ensure that anthropogenic
activities have been reduced so as to improve ecosystem healthier.
Keywords: Mangroves, Macrofauna, Anthropogenic, Distribution and Abundance.
vi
TABLE OF CONTENTS
CERTIFICATION ............................................................................................................. i
DECLARATION AND COPYRIGHT ............................................................................ ii
ACKNOWLEDGEMENT ............................................................................................... iii
DEDICATION ................................................................................................................. iv
ABSTRACT ..................................................................................................................... v
TABLE OF CONTENTS ................................................................................................ vi
LIST OF TABLES ............................................................................................................ x
LIST OF FIGURES ......................................................................................................... xi
LIST OF PLATE ............................................................................................................ xii
LIST OF ACRONOMY ................................................................................................ xiii
CHAPTER ONE ............................................................................................................... 1
INTRODUCTION ............................................................................................................ 1
1.1 Background to research problem ................................................................................. 1
1.2 Statement of the problem ............................................................................................. 2
1.3 General Objective ........................................................................................................ 3
1.3.1 Specific objectives. .................................................................................................. 3
1.3.2 Hypotheses. .............................................................................................................. 4
1.4 Significance of the study ............................................................................................. 4
CHAPTER TWO .............................................................................................................. 5
LITERATURE REVIEW ................................................................................................. 5
2.1 Mangrove and associated macrofauna ......................................................................... 5
vii
2.2 Socio-economic importance of macrofauna ................................................................ 6
2.3 Environmental factors affecting the distribution of macrofauna ................................. 8
2.4 Threats of mangrove and their associated macrofauna .............................................. 10
2.5 Conceptual Framework .............................................................................................. 13
CHAPTER THREE ...................................................................................................... 15
METHODOLOGY ....................................................................................................... 15
3.1 Study area .................................................................................................................. 15
3.2 Population and Climate .............................................................................................. 16
3.3 Research design ......................................................................................................... 17
3.4 Sample Design and Sample Size. .............................................................................. 17
3.5 Data collection method .............................................................................................. 18
3.5.1 Primary Data. ......................................................................................................... 18
3.5.1.1 Preliminary Survey. ............................................................................................ 18
3.5.1.2 Fauna and mangrove characterization ................................................................ 18
3.5.1.3 Physicochemical parameters ............................................................................... 19
3.5.1.4 Assessment of anthropogenic activities .............................................................. 19
3.5.2 Materials used ........................................................................................................ 20
3.6 Data analysis .............................................................................................................. 20
3.7 Data validity and reliability ....................................................................................... 21
CHAPTER FOUR .......................................................................................................... 22
RESULTS AND DISCUSSION .................................................................................... 22

viii
4. 1 Objective one: To examine mangrove distribution and regeneration rate along the
study area. ............................................................................................................... 22
4.1.1 Mangrove zonation ................................................................................................ 22
4.1.2 Mangrove diversity ................................................................................................ 24
4.1.3 Mangrove species density ...................................................................................... 26
4.1.4 Mangrove regeneration rate ............................................................................... 30
4.1.5 Factors affecting mangrove regeneration .............................................................. 33
4.2 Objective two: To examine the distribution and abundance of macrofauna ............. 35
4.2.1 Distribution of Macrofauna ................................................................................... 36
4.2.2 Abundance of macrofauna ..................................................................................... 41
4.2.2.1 Crustacean (Crabs) .............................................................................................. 44
4.2.2.2 Gastropods .......................................................................................................... 46
4.2.2.3 Bivalves .............................................................................................................. 49
4.3 Objective three: To assess the association between environmental conditions
(salinity, temperature and pH) to the distribution of macrofauna. ......................... 54
4.3.1 Salinity ................................................................................................................... 54
4.3.2 Pore water pH ........................................................................................................ 57
4.3.3 Pore water temperature .......................................................................................... 58
4.4 Objective four: To investigate anthropogenic activities affecting the distribution and
abundance of macrofauna ....................................................................................... 61
4.4.1 Respondents profile ............................................................................................... 61
4.4.2 Anthropogenic activities ........................................................................................ 62
4.4.2.1 Clear cutting of mangroves ................................................................................. 63
4.4.2.2 Over-fishing and illegal fishing gears ................................................................. 66

ix
4.4.2.3 Oil spills .............................................................................................................. 68
4.4.2.4 Salt Production ..................................................................................................... 71
CHAPTER FIVE .......................................................................................................... 74
CONCLUSION AND RECOMMENDATIONS ........................................................... 74
5.1 Conclusion ................................................................................................................. 74
5.2 Recommendations ...................................................................................................... 75
5.3 Limitation of the study ............................................................................................... 76
5.4 Area for further study ................................................................................................ 76
REFERENCES ............................................................................................................... 78
APPENDEX I- QUESTIONNAIRE FOR LOCAL COMMUNITY ............................. 98
APPENDEX 11-CHEK LIST FOR GOVERNMENT OFFICERS ............................. 101
x
LIST OF TABLES
Table 1: Distribution of mangrove species in three zone of Ngezi and Wesha forest .... 23
Table 2: Mangrove species & and their percentage in Ngezi and Wesha. ..................... 24
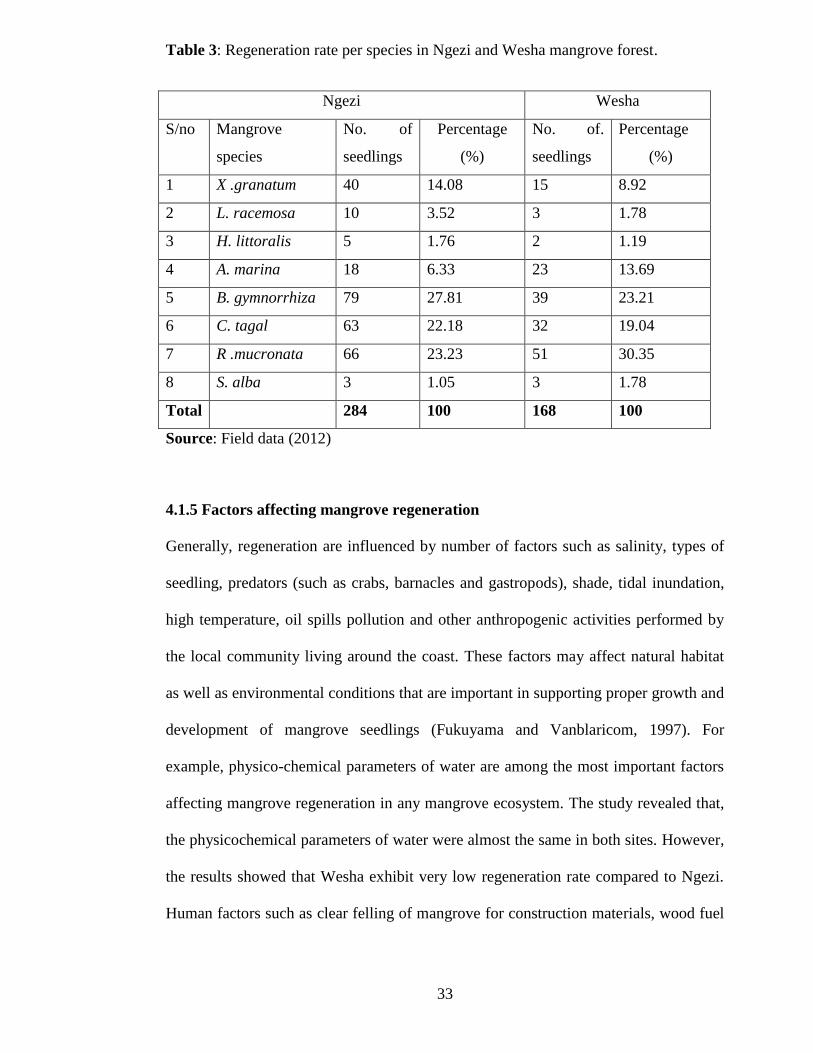
Table 3: Regeneration rate per species in Ngezi and Wesha mangrove forest. .............. 33
Table 4: Distribution of macrofauna in the study sites (+ found, - not found) ............... 37
Table 5: Abundance of macrofauna species identified in Ngezi and Wesha.................. 42
Table 6: Percentage of tree dwelling animals in different heights in Ngezi and Wesha. 53
Table 7: Percentage of macrofauna per zone in Ngezi and Wesha mangrove forest. .... 56
Table 8: Respondent profile ............................................................................................ 62
Table 9: Percentage of anthropogenic factors in Wesha and Ngezi ............................... 63
xi
LIST OF FIGURES
Figure 1: Conceptual Framework on anthropogenic impacts on mangrove and their
associated macrofauna .................................................................................................... 14
Figure 2: Map of Pemba Island showing the study areas (Modified by Bentje, 1990) .. 16
Figure 3: The mangrove species diversity in three zones of Ngezi and Wesha. ............ 26
Figure 4: Mangrove species density in Ngezi and Wesha mangrove forest. .................. 27
Figure 5: Number of mangroves trees per zone in Ngezi and Wesha. ........................... 29
Figure 6: Regeneration rate per zone in Ngeazi and Wesha mangrove forest. ............... 32
Figure 7: Diversity index (H') of macrofauna in three zones of Ngezi and Wesha ........ 41
Figure 8: Number of crabs per zone in Ngezi and Wesha mangrove forest ................... 45
Figure 9: Number of gastropods per zone in Ngezi and Wesha mangrove forest. ......... 48
Figure 10: Showing number of bivalves per zone in Ngezi and Wesha. ........................ 51
Figure 11: Variation of salinity in Ngezi and Wesha mangrove forest. ......................... 55
Figure 12: Variation of pH per zone in Ngezi and Wesha mangrove forest. ................. 58
Figure 13: Variation of temperature per zone in Ngezi and Wesha mangrove forest. ... 60
Figure 14: Common anthropogenic factors in Ngezi and Wesha mangrove forests ...... 71

xii
LIST OF PLATE
Plate 1: Determination of physico-chemical parameters of pore water in Ngezi forest . 19
Plate 2: Dead mangroves and planting of seedlings near the power plant at Wesha. ..... 30
Plate 3: Showing Wesha port where storage tanks of petroleum are located ................. 35
Plate 4: Showing (bivalve) Isognomon ephippium attached to the mangrove trunks ..... 52
Plate 5: Local peoples in utilization of mangrove trees for boat making along Wesha . 65
Plate 6: Crude oil generated by power plant along Wesha costal area. .......................... 69
Plate 7: Showing dead mangroves near the power plant at Wesha coastal area. ............ 70
.

xiii
LIST OF ACRONOMY
D O Dissolved oxygen
C B Community base conservation
PAH Poly aromatic hydrocarbons
RGoZ Revolutionary Government of Zanzibar.
1
CHAPTER ONE
INTRODUCTION
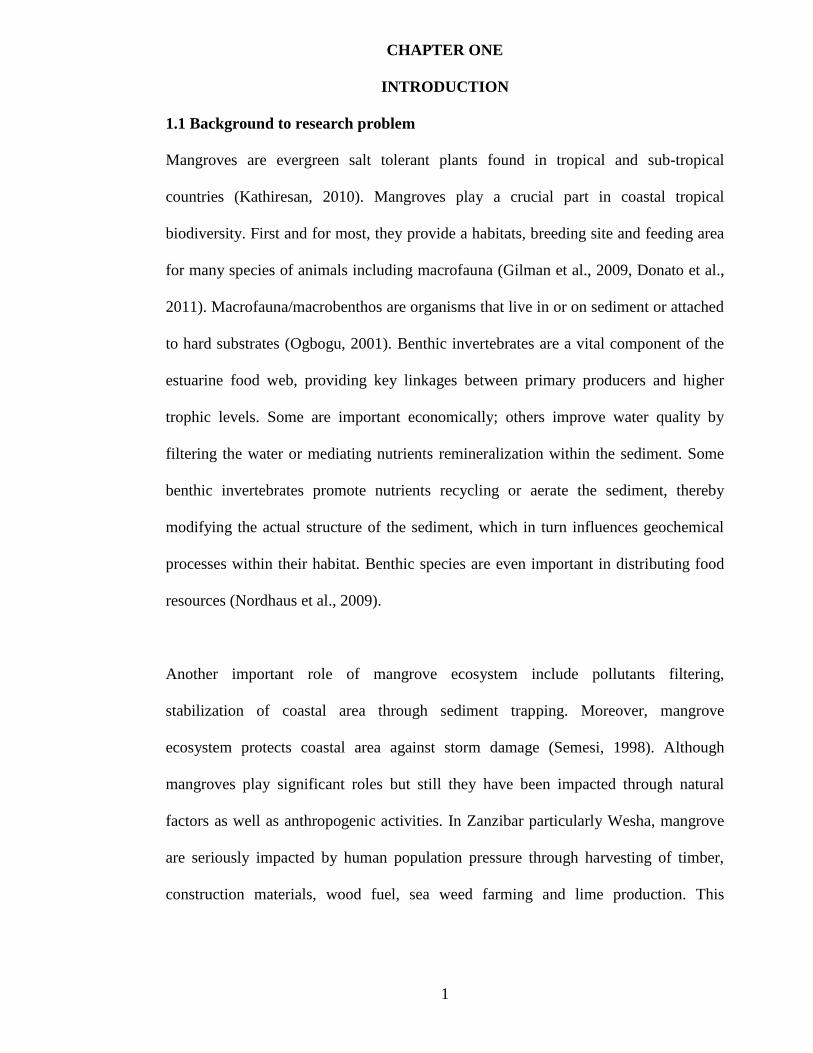
1.1 Background to research problem
Mangroves are evergreen salt tolerant plants found in tropical and sub-tropical
countries (Kathiresan, 2010). Mangroves play a crucial part in coastal tropical
biodiversity. First and for most, they provide a habitats, breeding site and feeding area
for many species of animals including macrofauna (Gilman et al., 2009, Donato et al.,
2011). Macrofauna/macrobenthos are organisms that live in or on sediment or attached
to hard substrates (Ogbogu, 2001). Benthic invertebrates are a vital component of the
estuarine food web, providing key linkages between primary producers and higher
trophic levels. Some are important economically; others improve water quality by
filtering the water or mediating nutrients remineralization within the sediment. Some
benthic invertebrates promote nutrients recycling or aerate the sediment, thereby
modifying the actual structure of the sediment, which in turn influences geochemical
processes within their habitat. Benthic species are even important in distributing food
resources (Nordhaus et al., 2009).
Another important role of mangrove ecosystem include pollutants filtering,
stabilization of coastal area through sediment trapping. Moreover, mangrove
ecosystem protects coastal area against storm damage (Semesi, 1998). Although
mangroves play significant roles but still they have been impacted through natural
factors as well as anthropogenic activities. In Zanzibar particularly Wesha, mangrove
are seriously impacted by human population pressure through harvesting of timber,
construction materials, wood fuel, sea weed farming and lime production. This
2
situation result ecological damage in such away biological diversity particularly
macrofauna are threatening through habitat destruction and fragmentation.
Apart from that, mangroves are also threatened by oil spills pollution and crude oil
generated by power plant. Oil spillage heavily contaminates marine shorelines, causing
severe localized ecological damage to the near shore community (Dauvin, 2000). So
the life in this region increasingly becoming unbearable due to the ugly effects of oil
spills and many communities continue to grown under the degraded impact of spill
(Gesteira, 2000). Oil spills involve the release of dangerous hydrocarbons such as
benzene and Polynuclic Aromatic Hydrocarbons (PAH) into the soil and water sources.
These spillages affect vast stretches of land and waterways thus polluting not only
crops but also the distribution of marine life (Ewa-oboho, 1994). However, physico-
chemical properties such as salinity, temperature, sediments, dissolved oxygen and pH,
have been reported to affect the distribution of these marine life (Ansa, 2005).
Oil and chemical pollution has been reported in various districts of both Unguja and
Pemba (ICMZ, 2009). The great concern is also Wesha, Chake Chake district in Pemba
where major petroleum storage facilities are located. The present study will focus to
assess the impacts of anthropogenic activities including oil spills pollution on
mangrove and its associated macrofauna, in Wesha mangrove forest Pemba.
1.2 Statement of the problem
Anthropogenic activities are the potential threats that may have considerable impacts
along Wesha mangrove forest and to their associated macrofauna. This is due to the
fact that, number of activities such as cutting mangrove, salt production and over-
3
fishing are conducted by the local community and large numbers of mangrove have
been impacted.
Hence, the magnitude of anthropogenic activities including oil pollution on mangrove
and their associated macrofauna along the coastal area of Zanzibar is not well
understood. Some studies have been conducted on marine coastal areas including
social- ecological resilience of mangrove (Othman, 2005), mangrove and crabs
ecosystem engineers (Nicholson, 2009). But, there is no adequate information about
anthropogenic impacts on mangroves and their associated macrofauna to the study
area. Therefore comprehensive scientific study of anthropogenic impacts on mangrove
and its associated macrofauna is needed so as to generate information for proper
protection and good management of coastal resources in Pemba mangrove forest and to
fill the existence knowledge gap.
1.3 General Objective
The general objective of this study was to examine the anthropogenic impacts on
mangroves and their associated macrofauna along selected Pemba mangrove forests.
1.3.1 Specific objectives.
i. To examine mangrove distribution and regeneration rate in Ngezi and Wesha
mangrove forests.
ii. To examine the distribution and abundance of macrofauna in mangrove forest
of Wesha and Ngezi natural forest in relation to anthropogenic sources.
iii. To assess the association between environmental conditions (salinity,
temperature and pH) to the distribution of macrofauna along the study areas.
4
iv. To investigate anthropogenic activities affecting the distribution and abundance
of macrofauna along the study areas.
1.3.2 Hypotheses.
i. There is higher distribution of mangroves and regeneration rate in Ngezi than
Wesha.
ii. There is higher distribution and abundance of macrofauna in Ngezi than Wesha
mangrove forest.
iii. There is possible relationship between environmental conditions (salinity,
temperature and pH) and distribution of macrofauna along the study areas.
iv. Higher anthropogenic activities affect negatively the distribution and
abundance of macrofauna in Wesha than Ngezi.
1.4 Significance of the study
The results of the present study will provide basic information about the impacts of
anthropogenic activities to the mangrove and their associated macrofauna which will
be useful for managers and policy makers. Apart from that, the recommendations given
by the study will be used to provide appropriate measures to be taken so as to minimize
anthropogenic factors that could affect coastal resources not only in Wesha but also in
other areas having similar problems. Moreover, the recommendations given by the
study will be also used to sensitize local community living around the coast, the
importance of sustainable use of coastal resources.
5
CHAPTER TWO
LITERATURE REVIEW
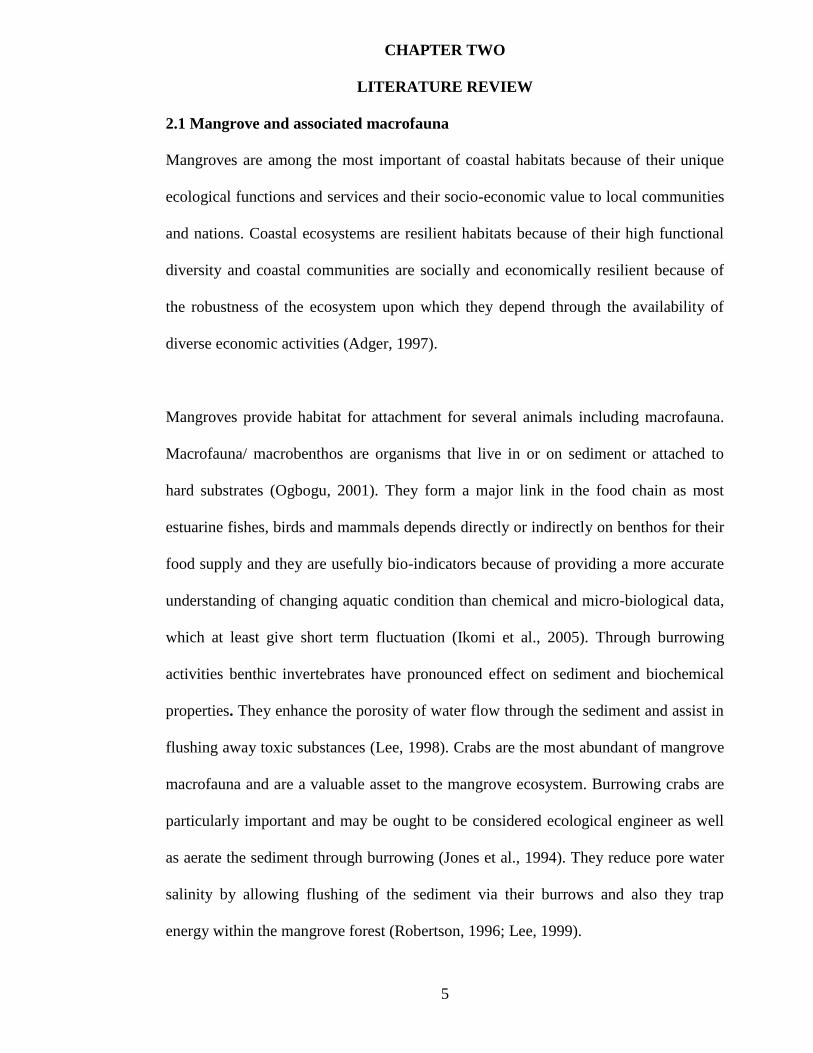
2.1 Mangrove and associated macrofauna
Mangroves are among the most important of coastal habitats because of their unique
ecological functions and services and their socio-economic value to local communities
and nations. Coastal ecosystems are resilient habitats because of their high functional
diversity and coastal communities are socially and economically resilient because of
the robustness of the ecosystem upon which they depend through the availability of
diverse economic activities (Adger, 1997).
Mangroves provide habitat for attachment for several animals including macrofauna.
Macrofauna/ macrobenthos are organisms that live in or on sediment or attached to
hard substrates (Ogbogu, 2001). They form a major link in the food chain as most
estuarine fishes, birds and mammals depends directly or indirectly on benthos for their
food supply and they are usefully bio-indicators because of providing a more accurate
understanding of changing aquatic condition than chemical and micro-biological data,
which at least give short term fluctuation (Ikomi et al., 2005). Through burrowing
activities benthic invertebrates have pronounced effect on sediment and biochemical
properties. They enhance the porosity of water flow through the sediment and assist in
flushing away toxic substances (Lee, 1998). Crabs are the most abundant of mangrove
macrofauna and are a valuable asset to the mangrove ecosystem. Burrowing crabs are
particularly important and may be ought to be considered ecological engineer as well
as aerate the sediment through burrowing (Jones et al., 1994). They reduce pore water
salinity by allowing flushing of the sediment via their burrows and also they trap
energy within the mangrove forest (Robertson, 1996; Lee, 1999).

6
Burrowing crabs create microhabitat for other fauna and also important in contributing
secondary production and increase the amount of nutrients and decrease the sulfide
concentration in the sediment due to their burrowing activities (Smith et al., 1991).
Macrofauna such as crustaceans that feed on a vast number of other animals in the
marine ecosystem are important links between producers and large consumers in
aquatic food webs (GAFRD, 2006). Krill and copepods are extremely abundant in the
worlds oceans may be the animals with the greatest biomass on the planet so, without
crustaceans, animal populations in aquatic ecosystems would collapse (Jones et al.,
1994).
Some macrofauna act as a key stone species for example mangrove crabs, that play a
critical role in maintaining the structure of an ecological community and whose impact
on community is greater than would be expected (Power et al., 1996). Also they have
significant impact on the bioturbation of the habitat and on nutrients recycling within
the system (Smith et al., 1991; Lee, 1998). It follows that key stone dependent
combines are perhaps more vulnerable and potentially unstable than communities
where key stone are absent (Navarrete & Menge, 1996). The reviewed literature
indicate that, there is a strong relationship between the mangroves and macrofauna
living in this ecosystem, so, this study will emphasize proper ways of conserving these
unique ecosystem that support large number of macrofauna which play an important
role in supporting local community in their livelihood needs worldwide.
2.2 Socio-economic importance of macrofauna
Macrofauna are among the major resources found in mangrove forest. These resources
have both socio and economic importance to the local communities living near the
7
coastal area as well as to those living away from the coast. They are very important in
supporting the livelihood to the respective Communities (Benabo et al., 1999). Most
people around the coastal areas rely on macrofauna such as crabs, lobsters, crayfish
and shrimps as a food which are mainly chief source of protein for people of low
income (Vijayalakshmi et al., 1993). According to Alfred et al., (1997), in Asia more
than ten million tons of Crustaceans are harvested for food each year. Crustaceans and
mollusks are two common invertebrate groups which are exploited by aborigines as a
food source (Kathirvel, 1992). Most of the hunting in the mangroves for those animals
is done by women, often with children in tow (Kathirvel, 1992). The mud crabs which
are an important food source and is eagerly hunted using sticks to extract the crabs
from their hole (Alfred et al., 1997).
The annual economic value of mangrove macrofauna estimated by the cost of the
products and services they provide. For example in Indonesia the cost of products and
services they produce has been estimated to be $200,000 - $900,000 /hectare (Wells et
al., 2006). The income is derived from the collection of the mollusks, crustaceans, and
fish that live in mangrove ecosystem (McLeod, 2006). This situation corresponds to
Tanzania whereby the collection of sea cucumber is significance source of cash income
for coastal communities; especially in rural areas on solid them at the local market
(Semesi et al., 1998; Canand, 1997a) reported that for the period of three months,
Tanzania export 73.8 metric tones of beche-de-mer (Sea cucumber) worth H K$
1,679,000 to Hong Kong. The total annual world catch is around 120,000 tones (wet
weight). According to Canand, (1997 b), Hong Kong is the largest world market for
these resources followed by Singer pore and Taiwan.
8
Besides their role in human diet, benthos especially mussels and clams are also used as
an important sentinel organisms for pollution monitoring studies and are being used as
indicators of pollution (Coccioni, 2000). The main reason of choice of benthic
organisms for pollution monitoring is that, they have the ability to bio-accumulate
many pollutants like heavy metals, hydrocarbons and pesticides (Gesteira and Dauvin,
2000). Their ability to metabolize pollutant is very low, so it is easy to measure the
body load of pollutants and also the amount that is depurated (Ajao and Fagade, 1990).
They are tolerant to wide ranges of temperature and salinity, and can be easily grown
in captivity for experimental studies. Moreover, these animals can be easily sampled
from inshore areas due to their sedentary habit (Ajao and Fagade, 1990). Different
studies conducted in various parts of the world shows that macrofauna are used as a
food for most people living near the coastal area and also as a source of income.
Therefore this study will promote different measures to be taken so as to avoid
improper use of these valuable resources in order to make them more sustainable since
they are still needed for future generation.
2.3 Environmental factors affecting the distribution of macrofauna
The distribution and relative abundance of macrofauna is not uniform, it depends upon
the physico-chemical properties (Odiete, 1999). Aggregations may occur at scales from
a few millimeters to many kilometers. Differences in physico-chemical properties such
as temperature, depth, pH, mean grain size, water currents, salinity, food and oxygen
tension are known to be associated with differences in density of marine benthic
populations between localities (Gibson, 1982).
9
Salinity and moisture or pore water content in mangrove ecosystem vary much
between seasons and on a diel basis as a result of dilutions during rainfall and day-time
evaporation (Kathiresan, 2006). The condition is accompanied by high temperature
variations during ebb and in windy conditions (Jansson, 1994). It has been reported
that, fresh water runoff has also been found to influence other environmental
parameters like temperature and it lowers the salinity and thus increase stratification,
which may affect the primary production (Nyandwi and Dubi, 2001). Such
environmental changes could have negative effects on the biodiversity of the coastal
zone if they persist for a long time. Further study show that the distribution of the
mollusks were found to be relatively high in area with high saline compared to the
other areas recorded with low salinity (Ajao and Fagade, 2002).
Changes in temperature have been found to influence the metabolism and can alter
ecological processes such as productivity and species interactions (Kennedy et al.,
2002). Species are adapted to specific ranges of temperature and salinity and are
therefore sensitive to just a few degrees higher or lower than those they usually
experience. Muthiah, (2005) found that larvae of sea cucumbers have the highest
survivorship and growth rate at specific water temperature of 28°C – 32°C.
Temperature influences organism’s biology including mortality, reproduction, growth
and behavior. For example, development of eggs and gonads in most of the marine
species are influenced by temperature (Lin et al., 2005).
Crabs concentration varies in the forest depending on the level of moisture, detritus
and shade. At low tide, crabs tend to concentrate in soggy areas and under shade
especially those species which occupy the upper intertidal areas such as Sesarma
10
species. In the lower intertidal areas the mangrove stems and roots carry a higher
biomass of barnacles, oysters and algae than those on the landward zone (Semesi et al.,
1998). This is due to less exposure to the air and the higher moisture content which
reduces the rate of desiccation (Semesi et al., 1998). Further study conducted by
Vilardy and Polania (2002), show that, the diversity of the mulluscs communities is
higher and species richness increases with low variation of dissolved oxygen. The
variation of physico-chemical parameters can affect the distribution and abundance of
macrofauna in their localities. The variation of physicochemical properties, may be
influenced by human activities that indirect affect the distribution of macro fauna at
large extent. Therefore different measures should be taken so as to minimize those
activities that may affect physico-chemical parameters which are very important in
regulating the distribution of mangrove fauna.
2.4 Threats of mangrove and their associated macrofauna
Mangrove vegetation play an important role in maintaining environmental complexity
and influencing the diversity and distribution of animals related to the ecological
system (Gao et al., 2005). At the same time these animals (macrofauna) play an
important part in mangrove ecological systems. They are both consumers and transfer
of energy flow and materials circulation system. However due to human population
pressure that rely on these resources to a large extent, hence they are seriously
threatened. Mangroves and their associated macrofauna are under threats Worldwide
through human population pressure (Maclaren &Masden, 2010). Currently these
resources are experiencing a high degree of degradation through a combination of
natural and human disturbance. However human factors contribute much (Fondo &
Marterns, 1998). It has been reported that cutting mangroves for building purposes,
11
fuel wood consumption, lime and charcoal making are the major threats of these
mangrove ecosystem (Semesi, 1999). The destruction of mangrove areas reduces the
diversity of macrofauna communities (Fondo & Marterns, 1998).
Over-fishing and the use of illegal fishing gears also have been reported to affect
population density of macrofauna by reducing the spawning biomass of fishery below
desired level (Taylar et al., 2003). It is the biggest threat to marine environment, even
greater than that of other human caused disruptions. Over-fishing influence changes in
species composition and biodiversity can occur with progressive reduction of large,
long lived and high value of predators’ species. Moreover, over-fishing may also
reduce genetic diversity of intertidal organisms as well as marine fisheries resources in.
generally.
Oil spills and crude oil is another most important factor affecting costal resources
(mangroves and their associated fauna). Oil spills is the release of liquid petroleum
hydrocarbon into the environment, especially marine areas, due to the human activity
and is a form of pollutants (Pezeshki et al., 2000). Oil spillage can be a resulting of
corrosion of oil pipes, storage tanks, sabotage and sometimes carelessness during oil
production or unloading operation. The impacts of spillage on coastal areas are
enormous whereby lives have been lost and the habitat and ecology have also been
damage due to the presence of hydrocarbons that disrupts the existing community
(Fukuyama and Vanblaricom, 1997).
Oil spills may have adverse effect on in fauna due to smothering or toxic (Kingstone et
al., 1995). The Florida oil spills in Buzzards Bay, resulting immediate mortality of
12
intertidal and sub tidal benthic fauna documented by Sander, (1978). The result show
that, the opportunistic polychaete, initially settled into disturbed areas at densities up
200,000 individual per meter square but after about seven months, densities of this
species dropped as other species replaced it (Sander, 1978). Oiled areas showed large
fluctuations in abundance and species composition while un-oiled areas were relatively
stable over time (Sander, 1978). The decrease in both density and species richness are
signs of disturbance to the macrofauna community brought about the oil spills. Hall,
(1994) define disturbance as a discrete event in time that disrupts an ecosystem,
community or population structure and changes resources, substrate availability or
physical environment.
Although direct effect mortalities from oil pollution may comprise much of the loss of
many macrofauna, however animals that are able to survive the spills may be subjected
to other threats such as predation. The study done by Elmgren et al., (2006) after the
Florida barge spills 700,000 liters of oil into the salt marsh sediments, the result show
that crabs exposed to the oil avoided burrowing, suffered delaying response, lower
feeding rate, thus oil residues are therefore biologically active and affect crabs
population. The effect of oil pollution on marine coastal area is a serious problem for
both mangrove and their associated macrofauna. So, this study will provide basic
information about the effect of oil spills to marine coastal area and to give out
recommendation which will be used by police and decision makers in conservation
program.

13
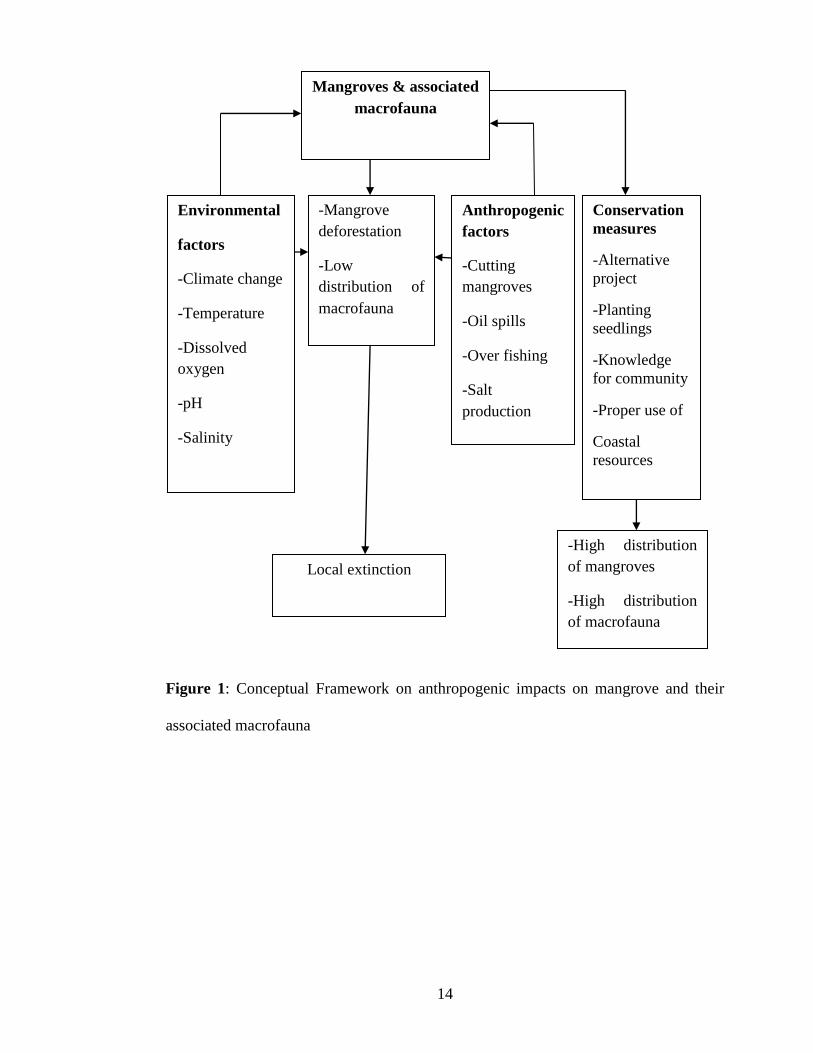
2.5 Conceptual Framework
Conceptually, mangrove and their associated macrofauna have been impacted through
natural factors like, salinity, temperature, pH dissolved oxygen. However,
anthropogenic activities such as cutting mangrove, salt production and oil spills
pollution have impacted this ecosystem in alarming rate. These factors cause serious
environmental degradation through habitat destruction and fragmentation that result to
improper habitat as well as inadequate food resources for variety of intertidal
organisms including macrofauna. Moreover, under severe condition local extinction
may occur. However, some measures such as planting of new mangrove seedlings and
unloading operation should be taken. Furthermore, knowledge of environmental
conservation for the local community including the effect of over-harvesting of coastal
resources as well as the use of illegal fishing gears should be given so as to ensure that
our biological resources we have are healthier and more sustainable.
14
Figure 1: Conceptual Framework on anthropogenic impacts on mangrove and their
associated macrofauna
-Mangrove
deforestation
-Low
distribution of
macrofauna
Local extinction
Mangroves & associated
macrofauna
Anthropogenic
factors
-Cutting
mangroves
-Oil spills
-Over fishing
-Salt
production
Environmental
factors
-Climate change
-Temperature
-Dissolved
oxygen
-pH
-Salinity
Conservation
measures
-Alternative
project
-Planting
seedlings
-Knowledge
for community
-Proper use of
Coastal
resources
-High distribution
of mangroves
-High distribution
of macrofauna
15
CHAPTER THREE
METHODOLOGY
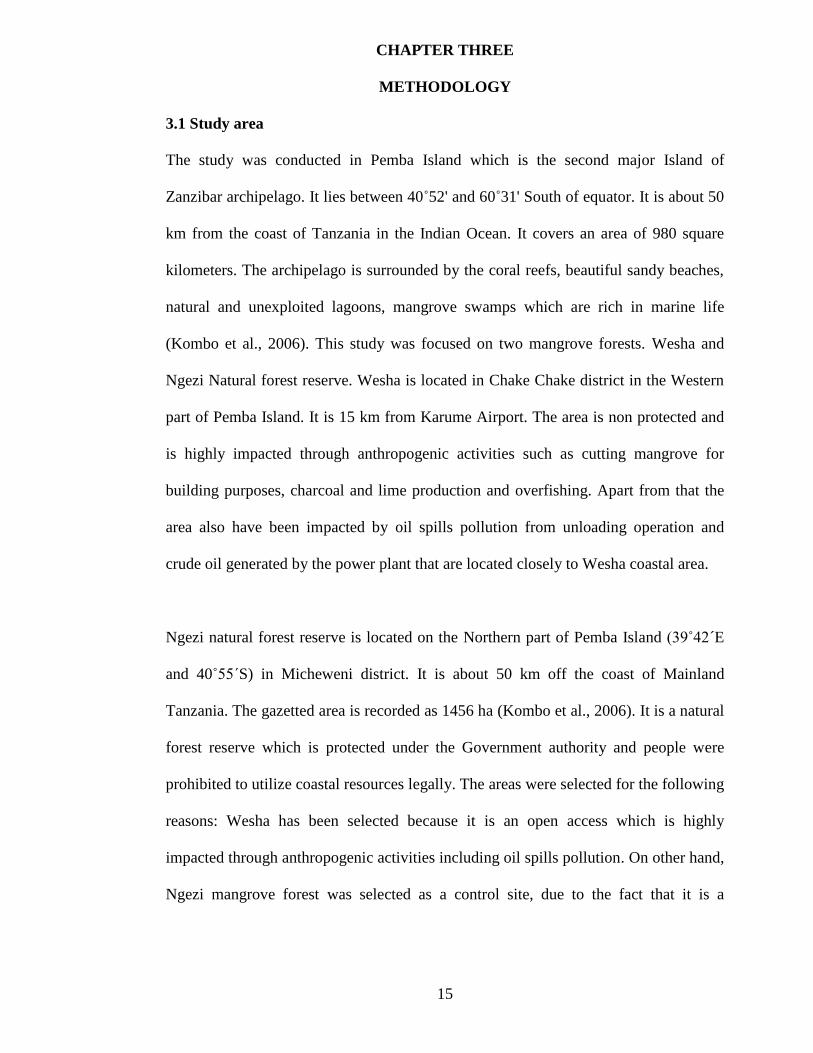
3.1 Study area
The study was conducted in Pemba Island which is the second major Island of
Zanzibar archipelago. It lies between 40˚52' and 60˚31' South of equator. It is about 50
km from the coast of Tanzania in the Indian Ocean. It covers an area of 980 square
kilometers. The archipelago is surrounded by the coral reefs, beautiful sandy beaches,
natural and unexploited lagoons, mangrove swamps which are rich in marine life
(Kombo et al., 2006). This study was focused on two mangrove forests. Wesha and
Ngezi Natural forest reserve. Wesha is located in Chake Chake district in the Western
part of Pemba Island. It is 15 km from Karume Airport. The area is non protected and
is highly impacted through anthropogenic activities such as cutting mangrove for
building purposes, charcoal and lime production and overfishing. Apart from that the
area also have been impacted by oil spills pollution from unloading operation and
crude oil generated by the power plant that are located closely to Wesha coastal area.
Ngezi natural forest reserve is located on the Northern part of Pemba Island (39˚42´E
and 40˚55´S) in Micheweni district. It is about 50 km off the coast of Mainland
Tanzania. The gazetted area is recorded as 1456 ha (Kombo et al., 2006). It is a natural
forest reserve which is protected under the Government authority and people were
prohibited to utilize coastal resources legally. The areas were selected for the following
reasons: Wesha has been selected because it is an open access which is highly
impacted through anthropogenic activities including oil spills pollution. On other hand,
Ngezi mangrove forest was selected as a control site, due to the fact that it is a

16
protected area with no or less anthropogenic activities including sources of oil
spills/contamination.
Figure 2: Map of Pemba Island showing the study areas (Modified by Bentje, 1990)
3.2 Population and Climate
The population density of Wesha was 3,209 and that of Ngezi was 185,326 (URT,
2002). Their annual growth rate is 5% which is greater than the National average of
3.1% (RGOZ, 2009).The climate is dominated by bimodal rain fall pattern, the main
rain season (Masika) occurs between March and June. The short rains (Vuli), usually

17
starts in October and ends in December. Some inter-monsoonal precipitation takes
place (Jumah et al., 2010). However, there is some variation in mean annual rainfall
among the study areas. The mean annual rain fall of Wesha is 1760 mm and the
average temperature ranges between 26 °C and 32 °C. Meanwhile, the mean annual
rain fall of Ngezi natural forest reserve is 1,860 mm, the long rains average 363mm per
month and the short rains average 175 mm per month (Beentje, 1990; Abdullah et al.,
1996).
3.3 Research design
The study was tailored through both quantitative and qualitative approaches.
Quantitative approach was used so as to increase level of reliability of gathering data
(Cassel & Symon, 1994). Qualitative approach was employed because it enabled the
researcher to obtain more and in-depth information. This is because the researcher can
interact with the research subjects by their own language and their own term. The
combined methods/approach ensured high degree of reliability of data, understanding
of the contextual aspects of the research, flexibility and openness of data collection and
more holistic interpretation of the research problem. Quantitative design was used to
collect information about the distribution and abundance of macrofauna, mangrove
diversity and regeneration rate as well as physico-chemical parameters of pore water.
Since qualitative design was used to collect data about anthropogenic activities that
could affect the distribution and abundance of mangrove macrofauna.
3.4 Sample Design and Sample Size.
Random sampling techniques were employed in biodiversity assessment and physico-
chemical properties of pore water through establishment of sampling plots and
18
quadrants. This technique was selected based on the nature of the forests and it was
more convenient and quick method of obtaining samples. Nine plots of 10 m x10 m
and 90 quadrants of one meter square (1 m x 1 m) were established along each study
area. However, stratified sampling was employed in selecting members for assessment
of anthropogenic activities. Furthermore 50 respondents were selected from each study
area (Ngezi and Wesha) to form a total of 100 respondents. Stratified sampling was
selected because it is the sampling technique that can minimize sampling error and also
reduce population variability (Folz, 1996).
3.5 Data collection method
3.5.1 Primary Data.
3.5.1.1 Preliminary Survey.
A preliminary survey was conducted in each study site so as to characterize the study
area for proper methodology design and identify working stations for establishment
and selection of sample plots.
3.5.1.2 Fauna and mangrove characterization
The transect survey was conducted to determine the distribution and abundance of
macrofauna, mangrove diversity and regeneration rate as well as determination of
physicochemical parameters of pore water along the study areas. A total of 3 plots of
10 m x 10 m each were randomly established in each zone (upper, middle and lower
zones), so as to make a total of nine plots in each study area. In each plot, 10 quadrants
of one by one meter square (1 m x 1 m) were established. A plot of 10 m x 10 m were
used to identify mangrove species while quadrant of one meter square was used to
count mangrove seedlings and collection of macrofauna located at the sediment and
19
those attached to the mangrove trunks (30 cm and 60 cm height from the sediment).
The collected macrofauna were identified using field guide book (Richmond, 1998).
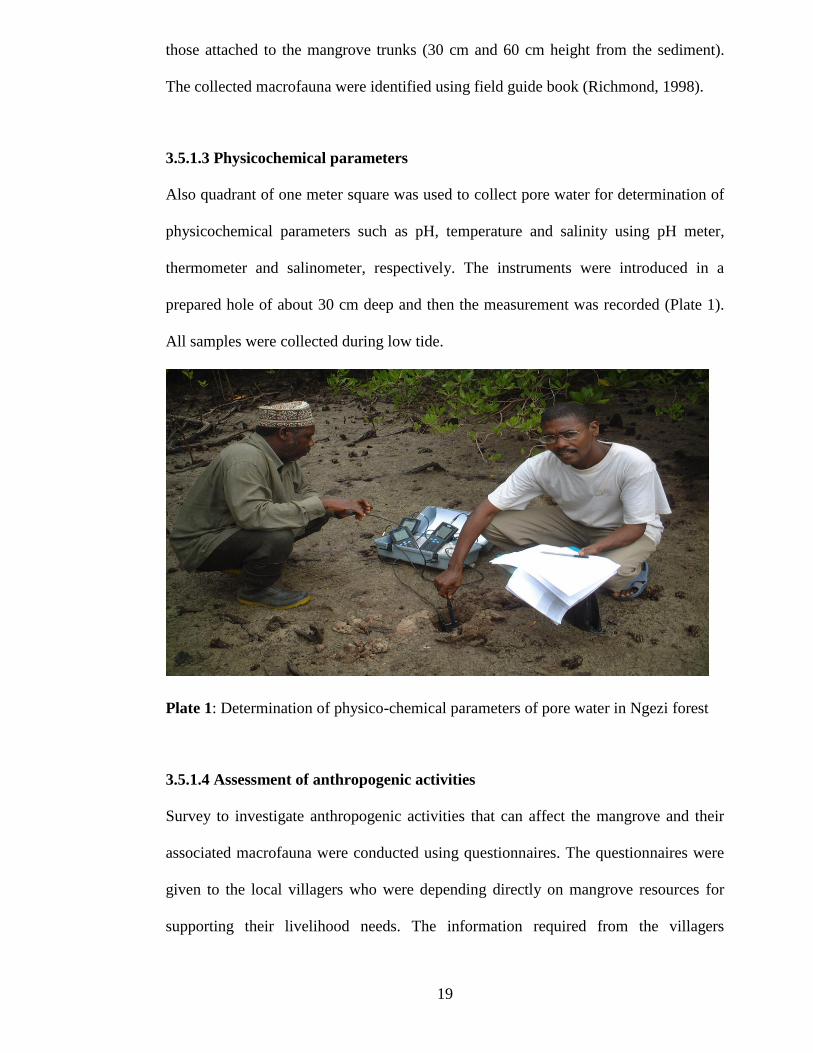
3.5.1.3 Physicochemical parameters
Also quadrant of one meter square was used to collect pore water for determination of
physicochemical parameters such as pH, temperature and salinity using pH meter,
thermometer and salinometer, respectively. The instruments were introduced in a
prepared hole of about 30 cm deep and then the measurement was recorded (Plate 1).
All samples were collected during low tide.
Plate 1: Determination of physico-chemical parameters of pore water in Ngezi forest
3.5.1.4 Assessment of anthropogenic activities
Survey to investigate anthropogenic activities that can affect the mangrove and their
associated macrofauna were conducted using questionnaires. The questionnaires were
given to the local villagers who were depending directly on mangrove resources for
supporting their livelihood needs. The information required from the villagers

20
including source of income and how they were benefited from the coastal resources. In
addition to that, checklists were supplied to the Government officers from the
department of forest from each study area to collect information about the
anthropogenic activities conducted by the local community. Also other information
about measures to be taken so as to reduce these anthropogenic impacts to the coastal
areas was collected. Furthermore, focus group discussions with the local leaders were
conducted to collect necessary information about the impact of different activities
performed by local community and its consequence to the mangrove forest and to their
associated fauna.
3.5.2 Materials used
A measuring tape was used to measure the size of sampling plot and the distance
between one plot to another. Quadrants were used to assess the distribution and
abundance of macrofauna, mangrove seedlings, and collection of pore water for
determination of physicochemical parameters. Salinometer was used to measure pore
water salinity, thermometer for pore water temperature, pH meter for pore water pH,
and questionnaires were used to collect information from the respondents. Moreover,
field forms were used for ecological data assessment as well as physicochemical
parameters of pore water.
3.6 Data analysis
Data were analyzed using Statistical package (InStat 3 Trial version and Statistical
Package for Social Science (SPSS) version 16). Anthropogenic data were analyzed
using SPSS, in which cross tabulation were used to get percentage of respondents
perception about factors affecting the distribution of macrofauna. However ecological
data and physicochemical parameters of pore water were analyzed using statistical test

21
such as t-Test, Pearson correlation, chi-square and ANOVA. Also Microsoft Excel
2003 was used to draw charts and graphs that were used to describe ecological data as
well as physicochemical parameters of water. Species diversity of mangrove and
macrofauna were determined using Shannon-Wieners which is more effective in
determination of species diversity.
H' = -Σ (Pi x ln Pi)
Where, i= 1
H' = Shannon diversity index
Pi= Fraction of entire population. Made up species i
S = number of species accounted.
Σ= Sum from all species.
3.7 Data validity and reliability
Validity increases the accuracy and usefulness of findings through eliminating much
confounding variables which allow greater confidence in the findings of the study.
Since both qualitative and quantitative approaches were used so as to increase the
validity and reliability of data. Quantitative approach was used in biodiversity
assessment from the field to ensure the validity and reliability of data because data is
obtained directly from field using transects through identification and counting.
However, qualitative approach also was used to increase the validity of data because
the data were collected directly from the respondents through questionnaires which are
more effective for assessing social issues. Moreover, pre-testing of data collection
methods (field survey and questionnaires) were conducted so as to increase validity of
data.
22
CHAPTER FOUR
RESULTS AND DISCUSSION
4. 1 Objective one: To examine mangrove distribution and regeneration rate
along the study area.
This objective covers the following sub titles, mangrove zonation, mangrove diversity,
mangrove species density, mangrove regeneration, and factors affecting mangrove
regeneration rate.
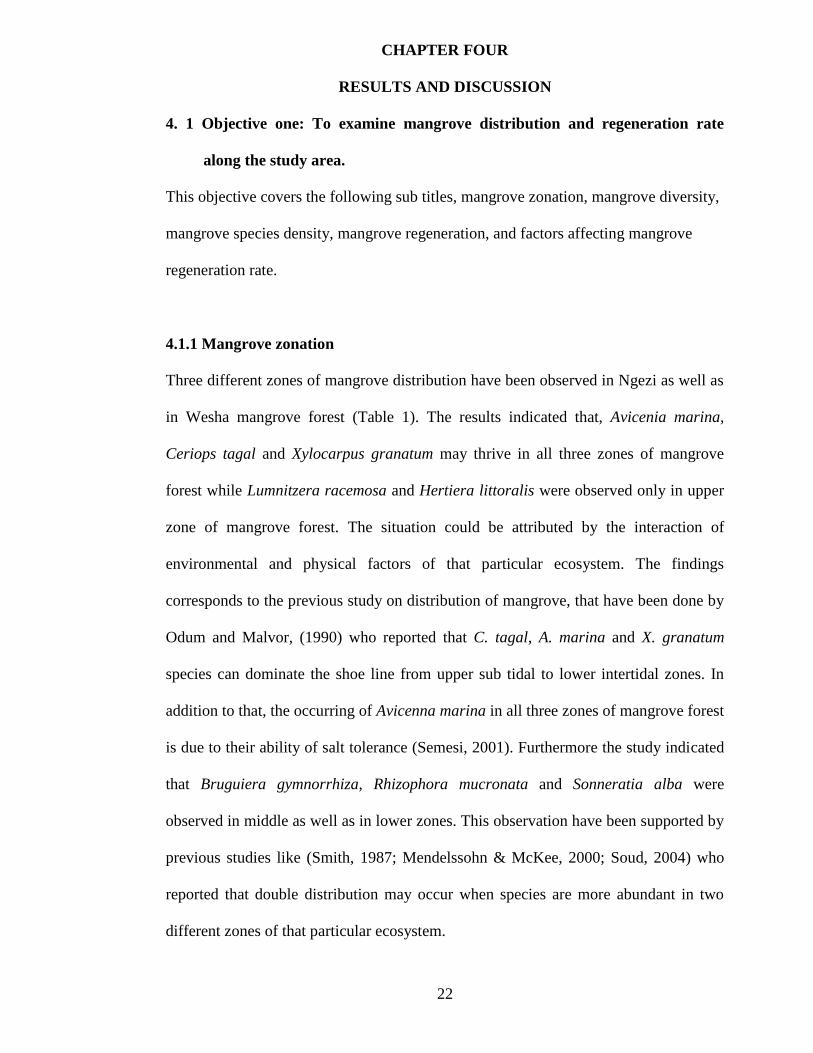
4.1.1 Mangrove zonation
Three different zones of mangrove distribution have been observed in Ngezi as well as
in Wesha mangrove forest (Table 1). The results indicated that, Avicenia marina,
Ceriops tagal and Xylocarpus granatum may thrive in all three zones of mangrove
forest while Lumnitzera racemosa and Hertiera littoralis were observed only in upper
zone of mangrove forest. The situation could be attributed by the interaction of
environmental and physical factors of that particular ecosystem. The findings
corresponds to the previous study on distribution of mangrove, that have been done by
Odum and Malvor, (1990) who reported that C. tagal, A. marina and X. granatum
species can dominate the shoe line from upper sub tidal to lower intertidal zones. In
addition to that, the occurring of Avicenna marina in all three zones of mangrove forest
is due to their ability of salt tolerance (Semesi, 2001). Furthermore the study indicated
that Bruguiera gymnorrhiza, Rhizophora mucronata and Sonneratia alba were
observed in middle as well as in lower zones. This observation have been supported by
previous studies like (Smith, 1987; Mendelssohn & McKee, 2000; Soud, 2004) who
reported that double distribution may occur when species are more abundant in two
different zones of that particular ecosystem.

23
Table 1: Distribution of mangrove species in three zone of Ngezi and Wesha forest
Mangrove
zone
Ngezi Wesha
Upper zone X. granatum, L .racemosa, H. littoralis, C.
tagal. A. marina and B. gymnorrhiza.
X. granatum, L. racemosa,
C. tagal, A. marina, H.
littoralis
Middle zone X. granatum, B. gymnorrhiza, C. tagal,
R. mucronata , S. alba and A. marina
R. mucronata, B. gymnorrhiza,
C. tagal, S. alba and A. marina
Lower zone S. alba, C. tagal, R. mucronata. X.
granatum and B. gymnorrhiza
R. mucronata, C. tagal, S.
alba, B. gymnorrhiza & A.
marina
Source: Field data 2012
In Ngezi, X. granatum, B. gymnorrhiza and R. mucronata were the dominant species at
upper, middle and lower zones, respectively. Unlike Ngezi, in Wesha, A. marina, were
the dominant species in upper zone while R. mucronata were observe as the dominant
species in middle as well as lower zones. Generally description of mangrove zonation
depicts a pattern that extends from shore to inland regions (usually higher in elevation).
Tidal flooding, land elevation, and salinity are often attributed as controlling factors in
mangrove zonation. The existence of distinct zones, each dominated by different
species is often evident in well developed mangal mangrove zonation, however the
distribution pattern is not uniformly throughout the world, it depend upon complex
physical and biological interaction occurring in that particular ecosystem (Odum and
Malvor,1990).
24
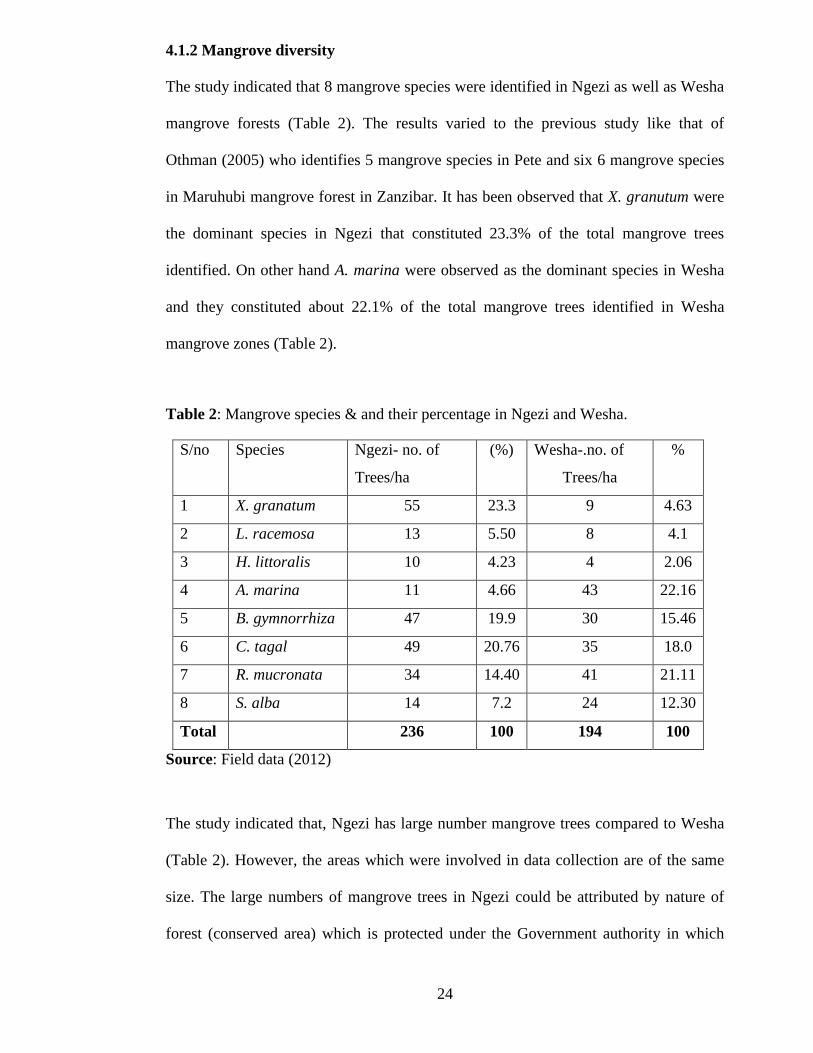
4.1.2 Mangrove diversity
The study indicated that 8 mangrove species were identified in Ngezi as well as Wesha
mangrove forests (Table 2). The results varied to the previous study like that of
Othman (2005) who identifies 5 mangrove species in Pete and six 6 mangrove species
in Maruhubi mangrove forest in Zanzibar. It has been observed that X. granutum were
the dominant species in Ngezi that constituted 23.3% of the total mangrove trees
identified. On other hand A. marina were observed as the dominant species in Wesha
and they constituted about 22.1% of the total mangrove trees identified in Wesha
mangrove zones (Table 2).
Table 2: Mangrove species & and their percentage in Ngezi and Wesha.
Source: Field data (2012)
The study indicated that, Ngezi has large number mangrove trees compared to Wesha
(Table 2). However, the areas which were involved in data collection are of the same
size. The large numbers of mangrove trees in Ngezi could be attributed by nature of
forest (conserved area) which is protected under the Government authority in which
S/no Species Ngezi- no. of
Trees/ha
(%) Wesha-.no. of
Trees/ha
%
1 X. granatum 55 23.3 9 4.63
2 L. racemosa 13 5.50 8 4.1
3 H. littoralis 10 4.23 4 2.06
4 A. marina 11 4.66 43 22.16
5 B. gymnorrhiza 47 19.9 30 15.46
6 C. tagal 49 20.76 35 18.0
7 R. mucronata 34 14.40 41 21.11
8 S. alba 14 7.2 24 12.30
Total 236 100 194 100
25
local communities were controlled by in utilization of these valuable resources. Apart
from that, also local community were restricted to perform most activities that could
affect the existing biological resources which are important to surrounding community
as well as to increase national income through ecotourism. In general, the study
indicated that, the species diversity index (H') was 1.85 and 1.87 for Ngezi and Wesha,
respectively. The study showed that, there were no differences in species diversity
between these two mangrove forests. The situation may be attributed by presence of
almost homogeneous physico-chemical parameters that determine the distribution of
mangrove trees Worldwide. Also, the corresponding physical conditions (e g soil type)
between the two forests may contribute in reducing diversification of mangrove
species along the study sites. It has been observed that, large area of Wesha mangrove
forest has been covered by sandy soil and silt like that of Ngezi thus why the species
that can tolerant in Ngezi can also exist in Wesha mangrove ecosystem.
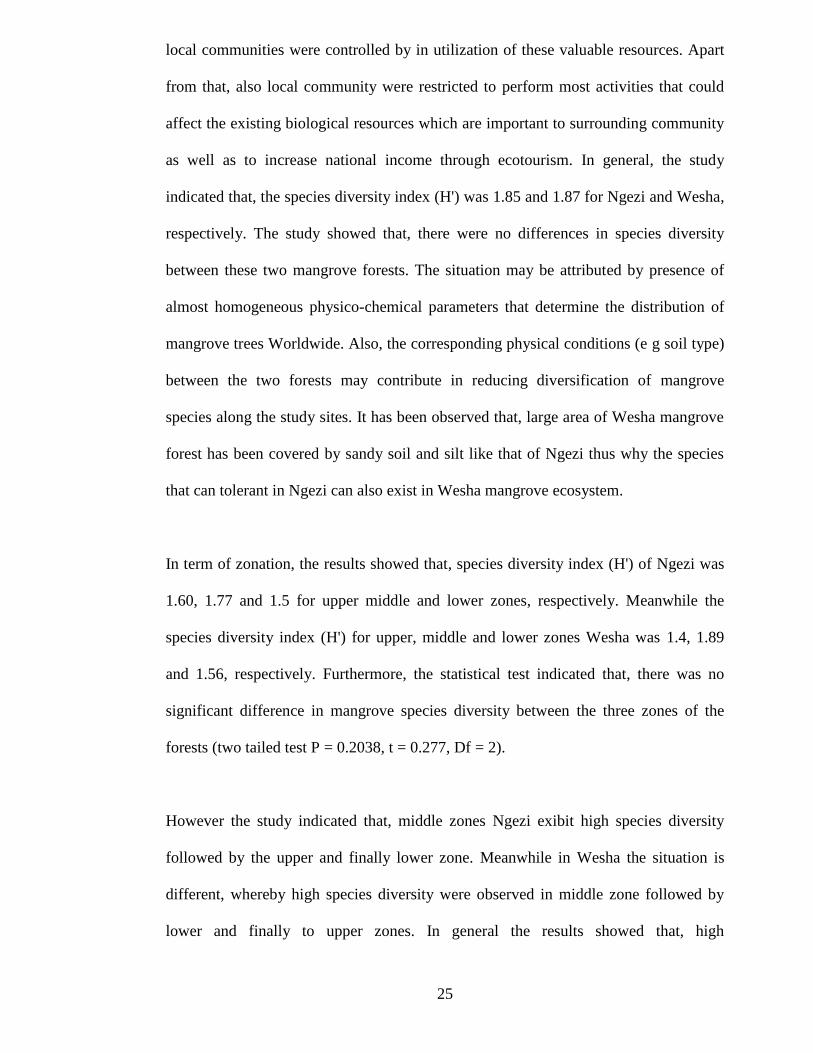
In term of zonation, the results showed that, species diversity index (H') of Ngezi was
1.60, 1.77 and 1.5 for upper middle and lower zones, respectively. Meanwhile the
species diversity index (H') for upper, middle and lower zones Wesha was 1.4, 1.89
and 1.56, respectively. Furthermore, the statistical test indicated that, there was no
significant difference in mangrove species diversity between the three zones of the
forests (two tailed test P = 0.2038, t = 0.277, Df = 2).
However the study indicated that, middle zones Ngezi exibit high species diversity
followed by the upper and finally lower zone. Meanwhile in Wesha the situation is
different, whereby high species diversity were observed in middle zone followed by
lower and finally to upper zones. In general the results showed that, high
26
diversification of mangrove species have been observed in middle zones. Probably
edaphic and environmental factors contribute to high species diversity in middle zones.
However, at the upper and lower zones of both forests shows slightly diversification of
mangrove species (Figure 3).
1
1.5
2
2.5
Upper Middle Lower
Div
ers
ity
in
dex
( H
')
Station
Ngez
Wesha
Figure 3: The mangrove species diversity in three zones of Ngezi and Wesha.
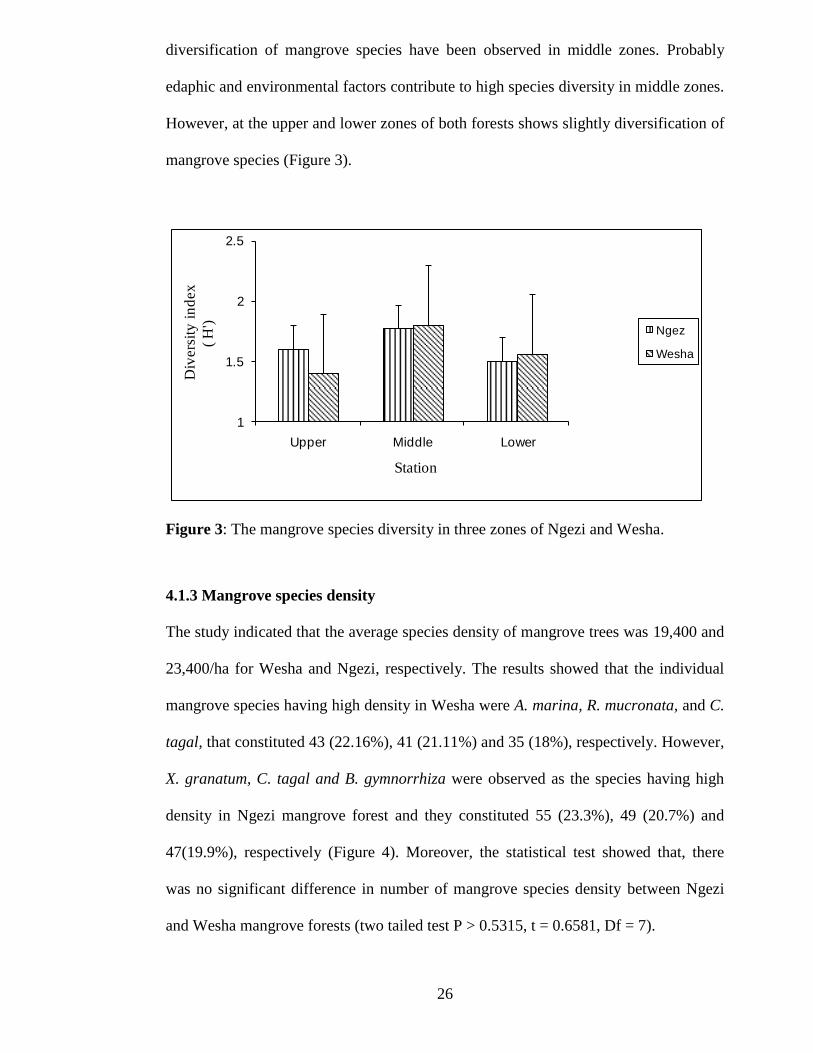
4.1.3 Mangrove species density
The study indicated that the average species density of mangrove trees was 19,400 and
23,400/ha for Wesha and Ngezi, respectively. The results showed that the individual
mangrove species having high density in Wesha were A. marina, R. mucronata, and C.
tagal, that constituted 43 (22.16%), 41 (21.11%) and 35 (18%), respectively. However,
X. granatum, C. tagal and B. gymnorrhiza were observed as the species having high
density in Ngezi mangrove forest and they constituted 55 (23.3%), 49 (20.7%) and
47(19.9%), respectively (Figure 4). Moreover, the statistical test showed that, there
was no significant difference in number of mangrove species density between Ngezi
and Wesha mangrove forests (two tailed test P > 0.5315, t = 0.6581, Df = 7).
27
2
12
22
32
42
52
62
Man
gro
ve s
pecie
s
Den
sity
/h
a
Mangrove species
Ngezi
Wesha
Figure 4: Mangrove species density in Ngezi and Wesha mangrove forest.
Furthermore, the results indicated that, X. granatum in Ngezi are the one having high
density compared to other species within the forest. The situation could be attributed
by its unique character to exist in all three zones of the forest. Also the situation have
been contributed by it morphological structure whereby most people were not
interested in harvesting this species for building purposes, boat making and tannin
extraction which are major threats for mangrove trees. However in small extent, they
were used as a wood fuel and lime production. Another important factor that made this
species to be more abundantly is due to the presence of dry dehiscent fruits that contain
four seeded chambers and each, contain a single seed, so that their seeds can stay for
very long period within the pericarp but still they are viable. Moreover conservation
status of the forest may also contribute to maintain that situation. A part from that, C.
tagal also has been observed as the second most species having high species density in
Ngezi. Probably high regeneration rate may influence high species density of
mangrove (Soud, 2004).
28
Unlike Ngezi, in Wesha Avicenia marina has been observed to exhibit high species
density. This is because, the species are not common harvested by most people for
economic purposes and thus why they have high species density. However in our
discussion with the Government officers from the department of Natural resources
Pemba, one of Government officer reported that traditionally, some people use A.
marina species for medicinal purpose especial for washing young baby.
In zonation wise, the results showed that in Ngezi the average mangrove trees counted
was 22, 32 and 25 for upper middle and lower zone, respectively. Similarly in Wesha
the average mangrove trees counted was 20, 21, and 23 for upper, middle and lower,
respectively (Figure 5). However results indicated that middle zone of Ngezi consist of
greater number of mangrove trees followed by lower and finally upper zone. Unlike
Ngezi, In Wesha lower zone has higher number of mangrove trees followed by middle
and finally upper zone (Figure 5). In general middle and lower zone of the both forest
consist of large number of mangrove trees. The situation could be explained by the
presence of large number of mangrove species like B. gymnorrhiza, C. tagal and R.
mucronata that were considered having high regeneration rate (Soud, 2004).
Furthermore statistical test (ANOVA) indicated that, there was no significant
difference in number of mangrove trees between three zones of Ngezi and Wesha
mangrove forest (P > 0.2375).

29
10
15
20
25
30
35
40
upper middle lower
Man
gro
ve
tree
s (D
ensi
ty/m
²)
Station
Ngezi
Wesha
Figure 5: Number of mangroves trees per zone in Ngezi and Wesha.
In general, the results indicated that all three zones of Wesha exhibit less number of
mangrove trees compared to Ngezi (Fig. 5). High population pressure in utilization of
mangrove trees for construction materials, fuel wood consumption, lime and charcoal
making that are performed by most local communities for supporting their livelihood
needs influence low mangrove density in Wesha. Apart from that, the study indicated
that 20% of the total respondents of Wesha said that, oil spills resulted from the
unloading operation and crude oil generated by the power plant contribute to lower
mangrove density. Through field survey large number of dead mangroves have been
observed along Wesha coastal area where the power plant is located and unloading
operation takes place (Plate 2) It has been observed that, the area near the power plant
has been completely degraded and some conservation measures have been taken
through establishment of small project as a pilot so as to restore the degraded area by
planting native species of mangrove seedlings in some part of Wesha coastal area
(Plate 2).
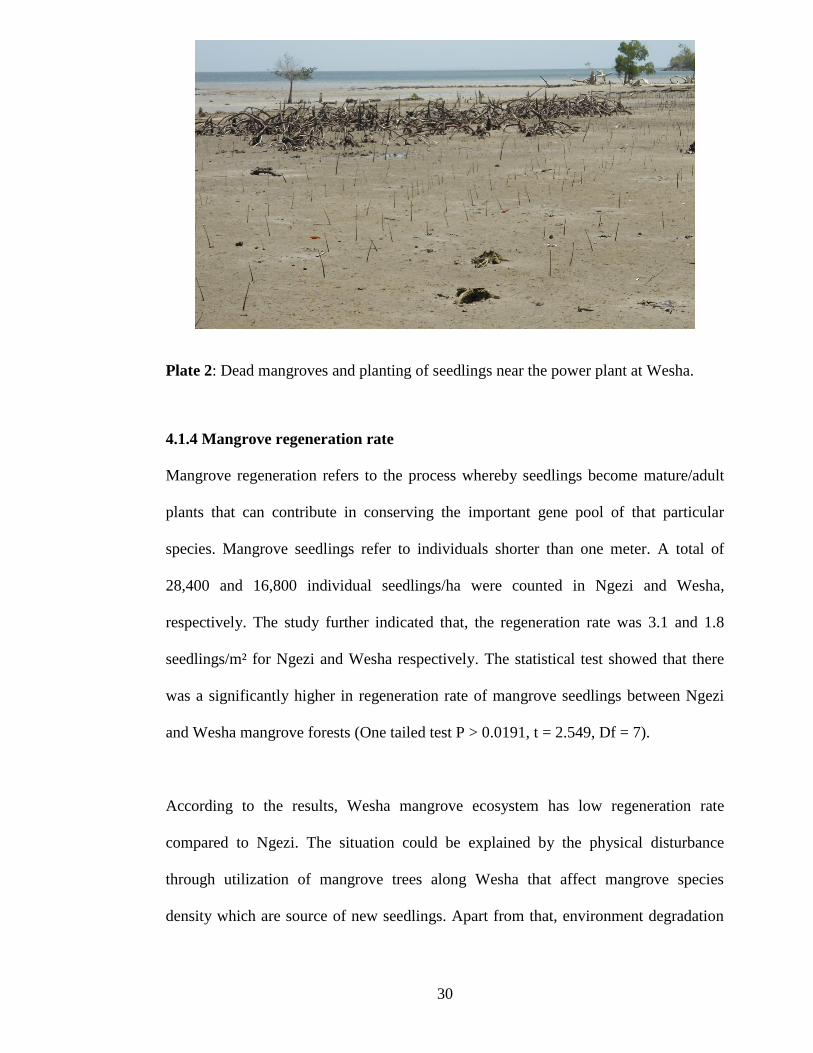
30
Plate 2: Dead mangroves and planting of seedlings near the power plant at Wesha.
4.1.4 Mangrove regeneration rate
Mangrove regeneration refers to the process whereby seedlings become mature/adult
plants that can contribute in conserving the important gene pool of that particular
species. Mangrove seedlings refer to individuals shorter than one meter. A total of
28,400 and 16,800 individual seedlings/ha were counted in Ngezi and Wesha,
respectively. The study further indicated that, the regeneration rate was 3.1 and 1.8
seedlings/m² for Ngezi and Wesha respectively. The statistical test showed that there
was a significantly higher in regeneration rate of mangrove seedlings between Ngezi
and Wesha mangrove forests (One tailed test P > 0.0191, t = 2.549, Df = 7).
According to the results, Wesha mangrove ecosystem has low regeneration rate
compared to Ngezi. The situation could be explained by the physical disturbance
through utilization of mangrove trees along Wesha that affect mangrove species
density which are source of new seedlings. Apart from that, environment degradation
31
caused by crude oil generated by the power plant that is located along Wesha coasta
area also contributes low regeneration. Unlike Wesha, Ngezi have been observed to
exhibit high regeneration rate. The situation could be attributed by the conservation
status of the forest whereby most activities that could affect the existing biological
diversity were not allowed legally.
In term of zonation, in Ngezi the mangrove seedlings counted was 77 (27.11%), 111
(39.08%) and 96 (33.80%) for upper middle and lower zone, respectively. Similarly in
Wesha the mangrove seedlings counted was 42 (25%), 62 (36.90%) and 64 (38.09%)
for upper middle and lower zones, respectively. The results indicated that in Ngezi
higher regeneration rate were observed in middle zone followed by lower and lastly
upper zone Unlike Ngezi, in Wesha higher regeneration rate have been observed in
lower zone followed by middle and finally upper zones (Figure 6). In general the
results indicated that middle and lower zones exhibit higher regeneration rate
compared to upper zone. The situation could be explained by the presence of large
number of mangrove species having high regeneration rate like R. mucronata, C. tagal
and B. gymnorrhiza.

32
30
50
70
90
110
130
upper middle lower
No
.of
Seed
lin
gs
(Den
sity
/m²)
Station
Ngezi
Wesha
Figure 6: Regeneration rate per zone in Ngeazi and Wesha mangrove forest.
The findings agree with the previous studies such as that of Jumaha et al., (2001) and
Soud, (2004) who reported that mangrove species like, C. tagal, R. mucronata and B.
gymnorrhiza have higher regeneration rate. Moreover, the statistical test indicated that
there was a significantly higher in regeneration rate in three zones of both forests (P >
0.0179, t = 7.381, Df = 2).
At species level, the results showed that, in both study sites C. tagal, R. mucronata and
B. gymnorrhiza exhibit high regeneration rate. In Ngezi the regeneration rate for the
three mangrove species which are probably having high regeneration rate were C.
tagal, R. mucronata and B. gymnorrhiza that constituted 22.18%, 23.2%, and 27.8%,
respectively. Like Ngezi, in Wesha C. tagal, R. mucronata and B. gymnorrhiza
constituted 19.0%, 30.35% and 23.21% of the total seedlings, respectively (Table 3).
These findings corresponds to the previous study on mangrove regeneration done by
Jumah et al., (2001) who reported that C. tagal, B. gymnorrhiza and R. mucronata are
mangrove species having high rate of regeneration.
33
Table 3: Regeneration rate per species in Ngezi and Wesha mangrove forest.
Source: Field data (2012)
4.1.5 Factors affecting mangrove regeneration
Generally, regeneration are influenced by number of factors such as salinity, types of
seedling, predators (such as crabs, barnacles and gastropods), shade, tidal inundation,
high temperature, oil spills pollution and other anthropogenic activities performed by
the local community living around the coast. These factors may affect natural habitat
as well as environmental conditions that are important in supporting proper growth and
development of mangrove seedlings (Fukuyama and Vanblaricom, 1997). For
example, physico-chemical parameters of water are among the most important factors
affecting mangrove regeneration in any mangrove ecosystem. The study revealed that,
the physicochemical parameters of water were almost the same in both sites. However,
the results showed that Wesha exhibit very low regeneration rate compared to Ngezi.
Human factors such as clear felling of mangrove for construction materials, wood fuel
Ngezi Wesha
S/no Mangrove
species
No. of
seedlings
Percentage
(%)
No. of.
seedlings
Percentage
(%)
1 X .granatum 40 14.08 15 8.92
2 L. racemosa 10 3.52 3 1.78
3 H. littoralis 5 1.76 2 1.19
4 A. marina 18 6.33 23 13.69
5 B. gymnorrhiza 79 27.81 39 23.21
6 C. tagal 63 22.18 32 19.04
7 R .mucronata 66 23.23 51 30.35
8 S. alba 3 1.05 3 1.78
Total 284 100 168 100
34
consumption and salt production are the common activities that lead to mangrove
deforestation. As many mangrove species reproduce through viviparous mode of
reproduction whereby seedlings grow while still they are attached to the parent plant.
So, physical disturbance of mangroves may influence low production of mangrove
seedlings.
Apart from high rate of mangrove utilization by the local communities around Wesha
coastal area, also field observation showed that large numbers of mangrove trees
closely to the power plant are completely dead and propagules have been observed.
Possibly, crude oil generated by the power plant influence mangrove deforestation
which is directly associated to lower the production of new seedlings. The observation
is consistent with the previous studies on mangrove deforestation. Example, (Snedaker
et al., 1981 and Getter et al., 1981) who reported that chronic effect of oil pollution
contamination influence defoliation and death of mangrove seedlings. Moreover, the
major consequence of die back of mangroves is to influence erosion along the coast
due to the completely degraded area that is unable to resist with water current mostly
during high tide. Environmental degradation along the coast may influence mangrove
seedlings to be carried by water current (Shunula, 2001).
Through focus group discussion which was conducted with government officers and
local leaders, Officer in charge of Wesha port reported that for very long period,
unloading operation was not well managed. He stated that, during unloading operation,
a significant amount of oil have been observed around Wesha coastal area whereby
storage tank of petroleum are located (Plate 3).

35
Plate 3: Showing Wesha port where storage tanks of petroleum are located
In this area large numbers of dead mangrove have been observed. The situation was
the major factor that influence low mangrove density which directly affects the
availability of seedlings. The observations correlate with the previous observation done
by Fukuyama and Vanblaricom (1997) who reported that, oil pollution may disrupt the
existing community by affecting physiological activities of the living tissues, soak the
sediment as well as shortage of oxygen (anoxic condition) whereby oxygen is very
important in growth and development of seedlings.
4.2 Objective two: To examine the distribution and abundance of macrofauna
This objective covers the distribution, species richness, species diversity and
abundance of macrofauna in general, abundance of crustaceans, gastropods and
bivalves. Also tables and figures will be used to elaborate the findings.

36
4.2.1 Distribution of Macrofauna
Mollusks and arthropods were the only two phyla of macrofauna encountered during
the study period. The 2 phyla consist of 3 classes namely gastropods, bivalves and
crustacean with 19 families, 29 genera and 33 species. Out of 33, 25 species of
macrofauna comprises of 4 species of gastropod, 2 species of bivalve and 19 species of
crustaceans were identified in Ngezi. Likewise in Wesha, 23 species of macrofauna
that comprises of 6 species of gastropods, 13 species of crustaceans and 4 species of
class bivalve were identified. In addition, further analysis of the results revealed that
out of 33 species, 10 species were only identified in Ngezi while 8 species were only
identified in Wesha, with 15 species found in both sites (Table 4). These findings
correspond with the previous study that was conducted by Othman, (2005) who
identifies thirty (30) species of macrofauna from Maruhubi and Pete mangrove forest
in Zanzibar. However the observation varied from the study done by Schrijvers et al.,
(1995) who reported 16 species of macrofauna in mangroves of Gazi Bay in Kenya.
Also Hart, (1994) reported forty three species of macrofauna from mangroves swamp
of Port Harcourt area of the Niger Delta.

37
Table 4: Distribution of macrofauna in the study sites (+ found, - not found)
Source: Field data 2012
Furthermore, it was observed that, C. decollata and T. palustris (gastropods) were the
dominant species in Ngezi meanwhile I. ephippium (bivalves) was the most dominant
species in Wesha. The occurring of large number of gastropods in Ngezi, could be
S/N Class Individual species Sites
Wesha Ngezi
1
Crustaceans
Eurycarcinus natalensis - +
2 Scylla serrata + +
3 Sarmatium grassum + +
4 Matuta.lunaris + -
5 Macrophthalamus grandidieri + -
6 Macrophthalamus depressus + -
7 Cardisoma carnifex + + 8 Uca inversa Inversa + + 9 Uca uvillei + + 10 Charybdis natator + + 11 Caenobita violascens + -
12 Metopograpsus thukuhar + + 13 Uca tetragon + + 14 Uca lactea annulipes + + 15 Epixanthus frontalis - + 16 Calapa hepatica - + 17 Thalamita poisson - + 18 Neosarmatium smith - + 19 Sesarmops impressus - + 20 Female uca - + 21 Clibanarius danai - + 22 Philyra platchira - + 23 Ocypode ryderi - + Total 13 19
Gastropods
Terebralia palustris + +
24 Fusnus colus + +
25 Planaxis sulcatus + +
26 Cerithidea decollata + +
27 Rhinoclavis senesis + -
28 Phasianella nivosa + -
Total 6 4
29
Bivalves
Isognomon ephippium + +
30 Anadara antiquata + -
31 Trachycardium pectiniforme + -
32 Saccostrea cuculata + +
Total 4 2
Total species 23 25

38
explained by the conservation status of the forest whereby local community were
restricted in utilization of coastal resources legally. Apart from the conservation status,
that species were not more preferred by local community for food. On other hand, the
occurring of bivalves (I. ephippium) as a dominant species in Wesha could be
attributed by unique characters possessed by that particular species to exist in stressed
environment. Probably are among the bivalve species having special immunity mainly
supported by hemocytes which are important in eliminating the parthogen by
phagocytosis as supported by study done by Coles and Pipe (1994). That is why they
are more resistant to stressed environment.
The study further indicated that gastropods like Rhinoclavis senesis and Phasianella
nivosa and some bivalve species like Anadara antiquata and Trachycardium
pectiniforme were among the 8 species of macrofauna that were only identified in
Wesha. Probably these species are less susceptible to environmental degradation and
that is why they were found only in Wesha mangrove zones which are highly impacted
through human activities including pollution from the power plant. On other hand, the
study indicated that Eurycarcinus nataensis, Epixanthus frontalis, and Philyra
platchira were among the ten species of macrofauna that were only identified in Ngezi
but not identified in Wesha. It is likely that, these species are more susceptible to
anthropogenic factors including oil spill pollution which are the major source
environment degradation in Wesha. The observation relate to the observation of
Suchanek (1993) who reported that, animals in soft stratum area are more susceptible
from pollution. Moreover, the results showed that, the species that were only identified
in Ngezi constituted about 30.30%, while those that were only identified in Wesha they
constituted 24% of the total species identified. However, the study revealed that, there

39
was an overlapping of species whereby 15 species of macrofauna were identified in
Ngezi as well as Wesha mangrove zones. The percentage of species overlapping was
45.45% which is greater compared to the species that were only identified in either
sites. The situation could be explained by, that species are well adapted to the
environment.
In zonation wise, the results indicated that, 14, 21, and 24 species of macrofauna were
identified in upper, middle, and lower zones of Ngezi mangrove forest, respectively.
Like Ngezi in Wesha upper, middle and lower zones constituted 11, 19 and 23 species
of macro fauna, respectively. In generally the study indicated that upper zones exhibit
less species of macrofauna compared to middle and lower zone of both systems. The
situation could be explained by the presence of long period of low tide as well as long
period of exposure to air with the additional of high temperature variation.
Furthermore, the study indicated that, no bivalve species were identified in upper zone
of either site. This is because bivalves are filter feeders, so they need an environment
of long period of high tide, less temperature variation as well as less period of exposure
to the air.
The study further indicated that some species of gastropod (C. decollata) and bivalves
(I. ephippium and S. cuculata) were observed on mangrove trunks as their main
habitat. Gastropods like C. decolata were found in wide range of habitats, from the
sediment, 30cm and 60cm height from the sediment. Similarly the results indicated that
some bivalve species like I. ephippium and S. cuculata were also observed on
mangrove trunks at the different height from the sediment.

40
Moreover, the results indicated that Ngezi has high species richness (where n= 25)
compared to Wesha (where n = 23). The situation could be explained by the nature of
the forest as conserved area in which local communities were restricted to utilize these
resources legally. Apart from that, large coverage area of Ngezi forest also contributes
high species richness through providing adequate space and food supply. On other
hand low species richness in Wesha are influenced by human disturbance such as clear
felling of mangrove for building purposes, salt production and over-fishing. In addition
to that, oil spills pollution and crude oil generated by the power plant that are closely to
Wesha coastal area also may influence low population density of macrofauna.
Furthermore, the study revealed that species diversity index (H') for Ngezi was 1.77
while that of Wesha was 2.00. This indicated that, Wesha has high species diversity
compared to Ngezi. It is likely that, the presence of some species of gastropods and
bivalves which are more resistant to worse condition contribute high species diversity
of macrofauna in Wesha mangrove ecosystem.
In term of zonation the study indicated that, in Ngezi the species diversity index (H')
was 1.68, 1.81, and 1.75 for upper, middle and lower zones, respectively. Similarly in
Wesha the species diversity index (H') was 1.61, 2.4 and 1.8 for upper, middle and
lower zones, respectively (Figure 7). In generally high species diversity were observed
in middle followed by lower and finally upper zones. The situation could be explained
by the presence of adequate amount of food resource, less temperature that reduce
animal desiccation as well as less period of exposure to the air (Ajao and Fagade,
2002). However, the study revealed that upper zone Wesha has least species diversity
index compared to other zones of both forests. Human disturbance like, clear cutting of
mangroves and waste generated by the power plant which results high degradation of
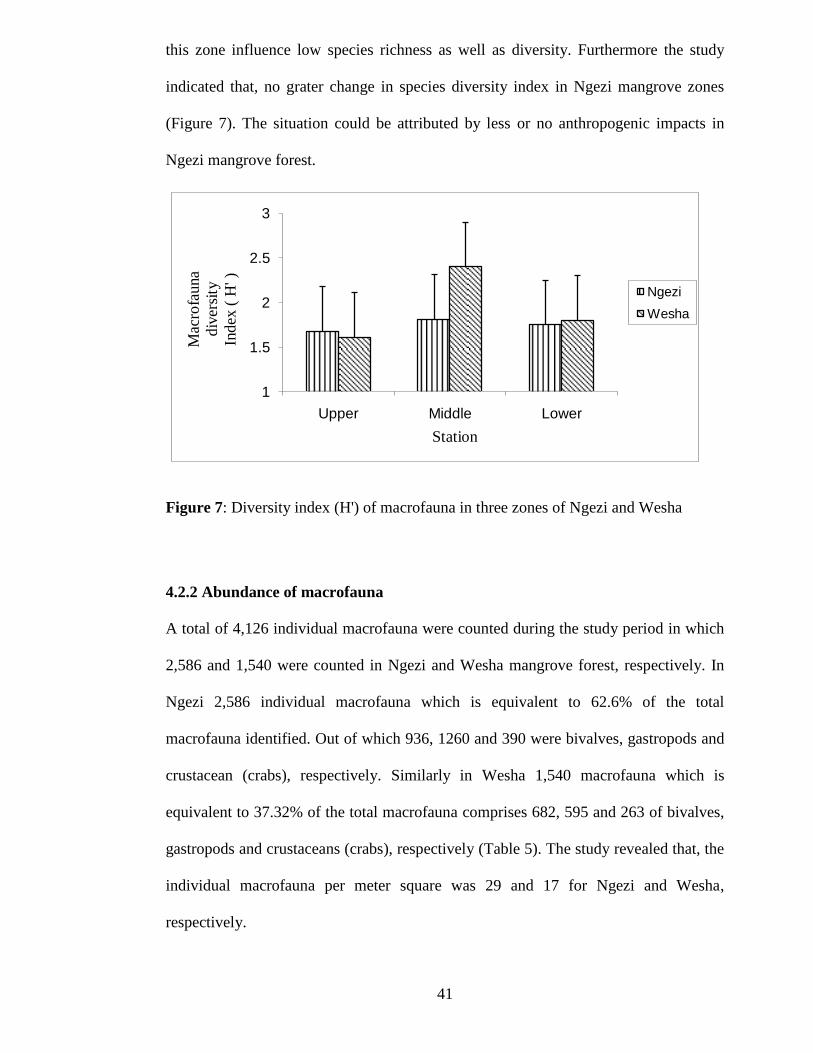
41
this zone influence low species richness as well as diversity. Furthermore the study
indicated that, no grater change in species diversity index in Ngezi mangrove zones
(Figure 7). The situation could be attributed by less or no anthropogenic impacts in
Ngezi mangrove forest.
1
1.5
2
2.5
3
Upper Middle Lower
Mac
rofa
una
div
ersi
ty
Ind
ex (
H' )
Station
Ngezi
Wesha
Figure 7: Diversity index (H') of macrofauna in three zones of Ngezi and Wesha
4.2.2 Abundance of macrofauna
A total of 4,126 individual macrofauna were counted during the study period in which
2,586 and 1,540 were counted in Ngezi and Wesha mangrove forest, respectively. In
Ngezi 2,586 individual macrofauna which is equivalent to 62.6% of the total
macrofauna identified. Out of which 936, 1260 and 390 were bivalves, gastropods and
crustacean (crabs), respectively. Similarly in Wesha 1,540 macrofauna which is
equivalent to 37.32% of the total macrofauna comprises 682, 595 and 263 of bivalves,
gastropods and crustaceans (crabs), respectively (Table 5). The study revealed that, the
individual macrofauna per meter square was 29 and 17 for Ngezi and Wesha,
respectively.

42
Table 5: Abundance of macrofauna species identified in Ngezi and Wesha.
Source: Field data 2012
S/no Class Individual species Number.of
macrofauna
Wesha Ngezi
1
Crustaceans
Eurycarcinus natalensis 0 4
2 Scylla serrata 11 18
3 Sarmatium grassum 29 31
4 Matuta.lunaris 11 0
5 Macrophthalamus grandidieri 16 0
6 Macrophthalamus depressus 14 0
7 Cardisoma carnifex 13 17
8 Uca inversa Inversa 39 48
9 Uca uvillei 26 42
10 Charybdis natator 12 16
11 Caenobita violascens 3 0
12 Metopograpsus thukuhar 21 19
13 Uca tetragon 23 27
14 Uca lactea annulipes 45 55
15 Epixanthus frontalis 0 4
16 Calapa hepatica 0 3
17 Thalamita poisson 0 8
18 Neosarmatium smith 0 18
19 Sesarmops impressus 0 47
20 Female uca 0 6
21 Clibanarius danai 0 19
22 Philyra platchira 0 3
23 Ocypode ryderi 0 5
Total 263 390
Gastropods
Terebralia palustris 78 107
24 Fusnus colus 5 2
25 Planaxis sulcatus 10 9
26 Cerithidea decollata 471 1142
27 Rhinoclavis senesis 3 0
28 Phasianella nivosa 28 0
Total 595 1260
29
Bivalves
Isognomon ephippium 445 666
30 Anadara antiquata 3 0
31 Trachycardium pectiniforme 4 0
32 Saccostrea cuculata 230 270
Total 682 936
Total macrofauna 1540 2586
43
Moreover, the statistical analysis indicated that, there was no significant difference in
number of macrofauna between the sampling sites (P > 0.1442, t =1.497, Df = 32).
Similarly other test indicated that there was no significant difference in number of
macrofauna in three zones of Ngezi mangrove forest (ANOVA P = 0.91). The same
test indicated that there was no significant difference in number of macrofauna in
Wesha mangrove forest (P = 0.86). It has been observed that Ngezi mangrove forest
was dominated by gastropods that constituted about 48.7% followed by bivalves that
constituted about 36.19% of the total individuals counted. Unlike Ngezi, Wesha
mangrove forest was dominant by bivalve species that constituted 44.28%, followed by
gastropods that constituted 38.6% of the total individuals counted. Crabs were found to
be the least abundant in both study sites and they constituted about 15.08% and
17.07% for Ngezi and Wesha, respectively. Moreover the study showed that, only
epifauna were considered, however fish and prawn were excluded due to the time
factor, because all the ecological data were collected during the low tide.
In general, the results indicated that Ngezi mangrove forest has large number of
macrofauna compared to Wesha, even though the recorded physico-chemical
parameters of Ngezi and Wesha which are the most important factors that determine
the distribution of macrofuna were almost the same. It is likely that, there are other
factors that influence low distribution of macrofauna along Wesha mangrove forest.
The situation could be attributed by physical disturbance such as cutting mangrove,
overfishing that initiate habitat destruction as well as fragmentation. Apart from that,
also oil pollution and crude oil generated by the power plant that causes serious
ecological risks as well as environmental disturbance to Wesha mangrove ecosystem
influence low distribution of macrofauna. The observations correspond to the previous
44
studies on distribution of macrobenthos like, Pearson and Rosenberg, (2003); Surugiu,
(2005); Hatje et al., (2008) who reported that, the distribution of macrobenthos can be
affected by both anthropogenic factors as well as toxic compounds from the petroleum
hydrocarbons including heavy metals.
4.2.2.1 Crustacean (Crabs)
A total of 653 crabs were counted during the study period, out of which 390 (59.7%)
were found in Ngezi while 263 (40.27%) were found in Wesha. In general, the study
revealed that a total of 5 and 3 crabs /m² were counted in Ngezi and Wesha mangrove
forests, respectively. The statistical test (two tailed test) indicated that there was a
significantly higher in number of crabs in Ngezi than Wesha (P < 0.0472, T = 2.102,
Df = 22). The presence of huge number of crabs in Ngezi is influenced by nature of the
forest which is a protected under the Government authority whereby local people were
restricted to perform most activities that may affect or lowering biological diversity
present in that ecosystem.
In term of zonation, the results indicated that, in Ngezi, upper, middle and lower zones
comprises 38.2% (149), 34.1% (133), and 27.69% (108) of the total crabs identified
respectively. Similarly in Wesha, the upper, middle and lower zones comprises 39.16%
(103), 33% (87) and 27.7% (73) of the total crabs identified respectively (Fig 8).
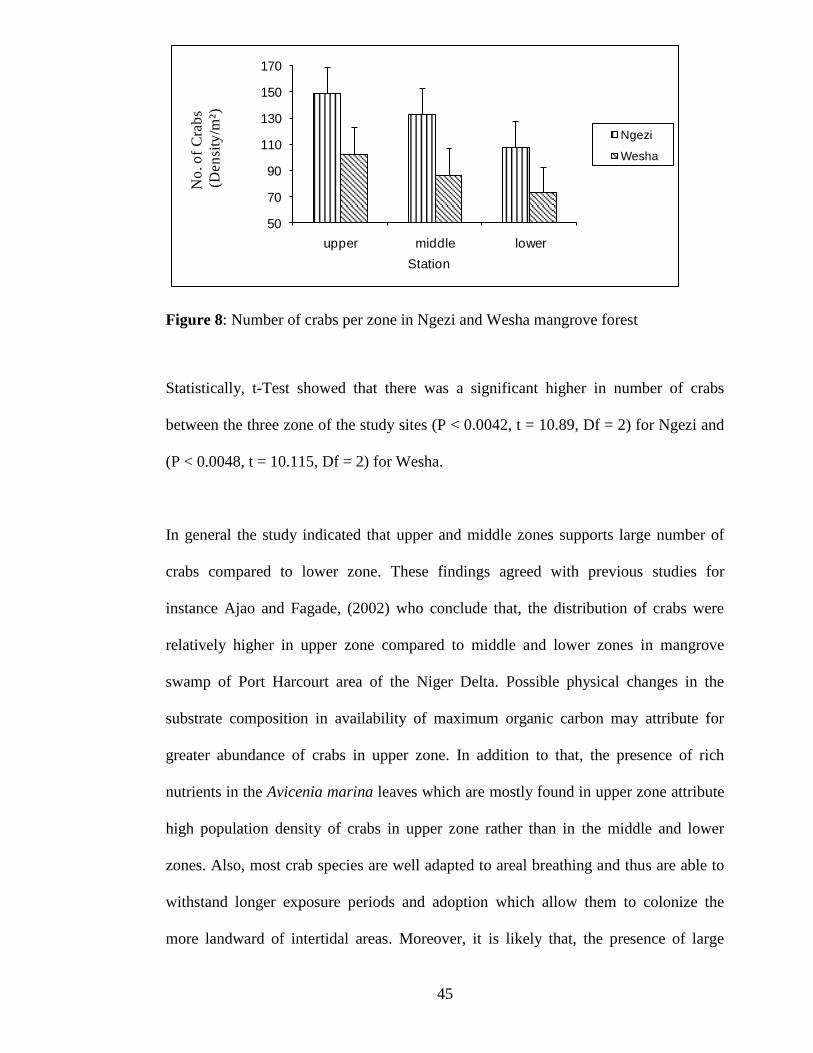
45
50
70
90
110
130
150
170
upper middle lower
No
. o
f C
rab
s
(Den
sity
/m²)
Station
Ngezi
Wesha
Figure 8: Number of crabs per zone in Ngezi and Wesha mangrove forest
Statistically, t-Test showed that there was a significant higher in number of crabs
between the three zone of the study sites (P < 0.0042, t = 10.89, Df = 2) for Ngezi and
(P < 0.0048, t = 10.115, Df = 2) for Wesha.
In general the study indicated that upper and middle zones supports large number of
crabs compared to lower zone. These findings agreed with previous studies for
instance Ajao and Fagade, (2002) who conclude that, the distribution of crabs were
relatively higher in upper zone compared to middle and lower zones in mangrove
swamp of Port Harcourt area of the Niger Delta. Possible physical changes in the
substrate composition in availability of maximum organic carbon may attribute for
greater abundance of crabs in upper zone. In addition to that, the presence of rich
nutrients in the Avicenia marina leaves which are mostly found in upper zone attribute
high population density of crabs in upper zone rather than in the middle and lower
zones. Also, most crab species are well adapted to areal breathing and thus are able to
withstand longer exposure periods and adoption which allow them to colonize the
more landward of intertidal areas. Moreover, it is likely that, the presence of large

46
number of crabs in upper zone is due to the presence of lower number of predators that
depend directly on such kind of organisms as a source of food.
At the species level, the results showed that, Uca annulupes, Uca inversa inversa and
Sesarmorp impresus that constituted 14.18%, 12.28% and 12.19% of the total crabs
counted, respectively were the dominant crab species in Ngezi. However, in Wesha,
Uca annulupe, Uca inversa inversa and Sarmatium Grassum were observed as the
dominant crab species and they constituted 17.13%, 14.96% and 11.2% of the total
crabs counted, respectively. The study indicated that Uca annulupes were the dominant
crab species in Ngezi as well as in Wesha mangrove zones. The results corresponds
with the study of Hartnnoll et al., (2002) who reported that, Uca annulupes is the most
abundant among the crab species in East African Mangroves brachyurans.
4.2.2.2 Gastropods
In Wesha, a total of 595 individual gastropods which was equivalent to 32.07% of the
total gastropods were identified and counted. They belonged to Terebralia palustris,
Planaxis sulucatus, Rhinoclavis.senesis. Phasionella nivosa, Fusnus colus and
Cerithedea decollata. Similarly, in Ngezi 1,260 individual gastropod which was
equivalent to 67.92% of the total gastropods were counted. They belonged to
Terebralia palustris, Planaxis.sulucatus, Fusnus colus and Cerithedea decollata. The
study showed that 14 and 7 individual gastropods /m² were counted in Ngezi and
Wesha mangrove zones, respectively. Furthermore, the statistical test indicated that,
there was a significant higher in number of gastropods between Ngezi and Wesha (χ²
=14.95, P < 0.0001, Df = 5.
47
The presence of fewer number of gastropods in Wesha than Ngezi could be attributed
by less species richness that are influenced by increasing anthropogenic activities such
as cutting pressure of mangrove trees which are the main habitat of most gastropod
species especially tree dwellers. Apart from lacking appropriate habitat oil spills
pollution that may introducing toxic materials from aromatic hydrocarbons.also
influence less number of gastropods in Wesha. On other hand, lager number of
gastropods in Ngezi could be attributed by the conservation status of the forest that
promotes high species richness.
In zonation wise, in Ngezi, the upper, middle and lower zone comprised of 26.81%
(338), 36.11% (455) and 37.06% (467) of the total gastropods counted, respectively.
Similarly, in Wesha the upper, middle and lower zones comprised of 28.4% (169),
37.14% (221), and 34.45% (205) of the total gastropods counted, respectively. The
study revealed that more gastropods were observed in middle and lower zones rather in
upper zone (Figure 9). It is likely that, the presence of hard shells that protect them to
be taken by their predators influence them to inhabit at middle and lower shore of the
intertidal areas where large number of predators are found. Apart from that, low
salinity that were and recorded at the middle and lower zones favor high population
density of gastropods. Furthermore, other statistical test indicated that, there was no
significant difference in number of gastropods between the three zones of the forest
(One way ANOVA P > 0.964 for Ngezi and P > 0.323 for Wesha).

48
100
200
300
400
500
600
upper middle lower
No
. o
f G
ast
rop
od
s
(Den
sity
/m²)
Station
Ngezi
Wesha
Figure 9: Number of gastropods per zone in Ngezi and Wesha mangrove forest.
At the species level, the results revealed that, C. decollata and T. Palustris were the
dominant species of gastropods in both sites and they constituted 90.6%, and 8.49% for
Ngezi and 79.15% and 13.1% for Wesha. Even though less gastropods were counted in
Wesha, but more species were identified. The situation could be explained by the
presence of wood boring gastropods that survived worst condition even in a spilled
area. The results correspond with the study of Powell, (1990) who reported that some
species of gastropods are resistant on harsh environment.
Moreover, the study revealed that some species of gastropod (C. decollata) have been
observed in mangrove trunk as their main habitat. The study revealed that a total of
1142 and 471 C. decollata were counted in Ngezi and Wesha, respectively during the
study period. In Ngezi 34.5% of the total C decollata were observed in 30 cm while
62.69% were observed in 60 cm height from the sediment and only 2.71% were
observed in sediment. Like Ngezi in Wesha mangrove forest 37.15%, 55.4% and
7.43% of the total C. decollata were observed in 30 cm, 60 cm and sediment

49
respectively. The observation are consistent to the observation of the previous study on
distribution of macrofauna along the intertidal area conducted by Ajao and Fagade
(2002), who reported that gastropods and bivalves are relatively tolerant to physical
and chemical variations in the environment and they are found in a broad range of
habitat.
4.2.2.3 Bivalves
A total of 682 individual bivalves which is equivalent to 42.15% of the total bivalves
were counted in Wesha and they belonged to Isognomon ephippium, saccostrea
cuculata, Anadara antiquata and Trachycardium pectiniforme. Meanwhile 936
individual bivalves which is equivalent to 57.84% were counted in Ngezi and they
belonged to Isognomon ephippium and Saccostrea cuculata. The study further
indicated that, 10 and 8 bivalves /m² were counted in Ngezi and Wesha, respectively.
Furthermore, the statistical test showed that, there was a significant higher in number
of bivalves between Ngezi and Wesha mangrove ecosystem (χ² = 14.65, P < 0.021, Df
= 3). The results indicated that, more bivalves were counted in Ngezi that belonged to
only 2 species. Unlike Ngezi, in Wesha less bivalves were identified that belonged to 4
species. The presence of more number of bivalves in Ngezi could be influenced by
protective nature of the forest which influences more species richness. On other hand
less number of bivalves in Wesha could be attributed by high population pressure that
affects the richness of biodiversity. On other hand more species of bivalves identified
from Wesha mangrove ecosystem could be explained by the presence of some
bivalve’s species that probably having special immunity mainly supported by
hemocytes which are important in eliminating pathogen by phagocytosis (Coles and

50
Pipe, 1994). These results corresponds to the study done by Powell, (1990) who
reported that, some species of gastropod and bivalve are more resistant in hush
condition even in a contaminated area. It has been reported that, some bivalve species
their hemocytes produce lysosome enzymes and antimicrobial molecules which
contribute to the destruction of pathogen.
For the case of zonation, the results indicated that, in Ngezi, upper, middle and lower
zones constituted 0 (0%), 447 (47.75%) and 489 (52.24%) of the total bivalves counted
respectively. Similarly in Wesha, upper, middle and lower zones constituted 0 (0%),
315 (46.18%) and 367 (53.81%) of the total bivalves counted respectively. In general,
the results indicated that, middle and lower zone of Wesha have been observed to
support very few numbers of bivalves compared to Ngezi (Figure 10). Habitat
destruction through cutting mangrove and undersized fishing influence low population
density of macrofauna in Wesha. However, the statistical analysis indicated that there
was no significant difference in number of bivalves between the three zones of the both
sites (One way ANOVA P < 0.0266) for Ngezi and (P > 0.1664) for Wesha.
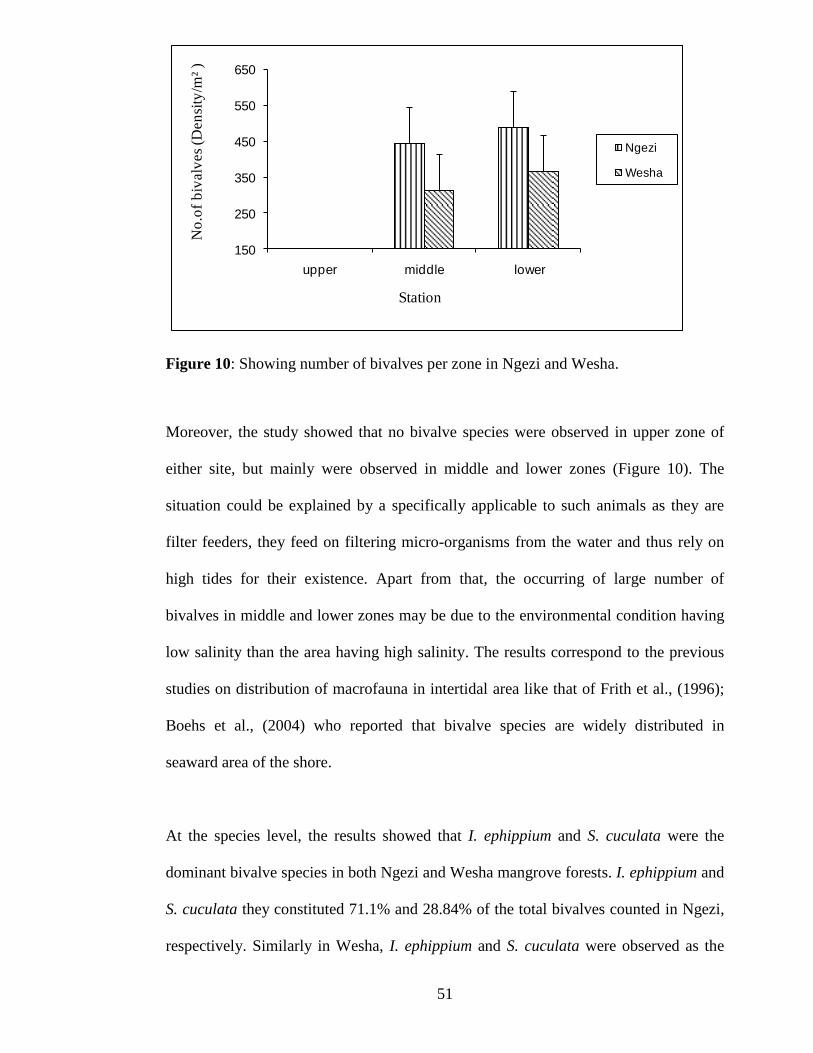
51
150
250
350
450
550
650
upper middle lower
No
.of
biv
alv
es
(Den
sity
/m²
)
Station
Ngezi
Wesha
Figure 10: Showing number of bivalves per zone in Ngezi and Wesha.
Moreover, the study showed that no bivalve species were observed in upper zone of
either site, but mainly were observed in middle and lower zones (Figure 10). The
situation could be explained by a specifically applicable to such animals as they are
filter feeders, they feed on filtering micro-organisms from the water and thus rely on
high tides for their existence. Apart from that, the occurring of large number of
bivalves in middle and lower zones may be due to the environmental condition having
low salinity than the area having high salinity. The results correspond to the previous
studies on distribution of macrofauna in intertidal area like that of Frith et al., (1996);
Boehs et al., (2004) who reported that bivalve species are widely distributed in
seaward area of the shore.
At the species level, the results showed that I. ephippium and S. cuculata were the
dominant bivalve species in both Ngezi and Wesha mangrove forests. I. ephippium and
S. cuculata they constituted 71.1% and 28.84% of the total bivalves counted in Ngezi,
respectively. Similarly in Wesha, I. ephippium and S. cuculata were observed as the

52
dominant bivalve species that constituted 65.24% and 33.2% of the total bivalves
identified, respectively.
In addition to that, the study indicated that some bivalve species were observed on
mangrove trunks as their main habitat (Plate 4). A total of 1,111 I. ephippium were
counted during the study period. In Ngezi 666 I. ephippium counted, out of 35.1% and
64.8% were observed in 30 cm and 60 cm height on mangrove trunks from the
sediment, respectively. Meanwhile in Wesha 445 I. ephippium counted, 24.7% and
75.5% were observed in 30 cm and 60 cm height from the sediment, respectively.
Plate 4: Showing (bivalve) Isognomon ephippium attached to the mangrove trunks
The study further indicated that, a total of 500 S. cuculata were counted in Wesha and
Ngezi mangrove forest. In Wesha 230 S. cuculat counted, 31.7% and 68.2% were
observed in 30 cm and 60 cm height from the sediment, respectively. Similarly in
Ngezi 270 S. cuculata counted, 36.2% and 63.7% of the total S. cuculata were
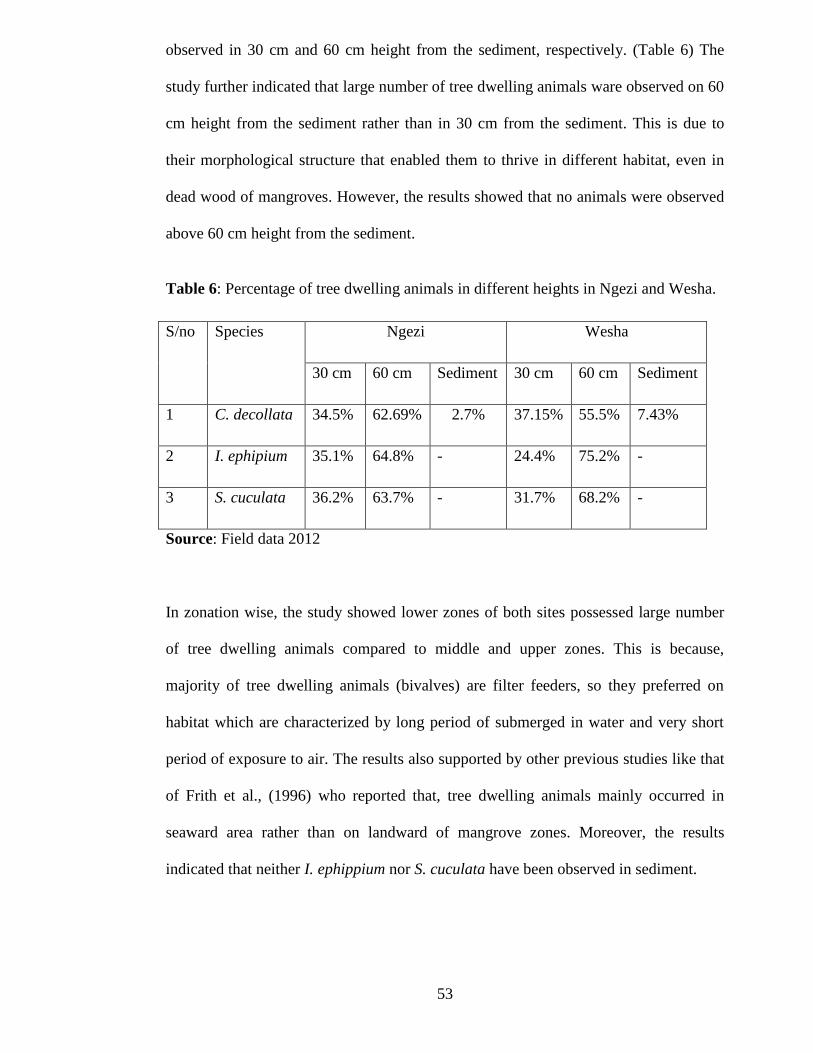
53
observed in 30 cm and 60 cm height from the sediment, respectively. (Table 6) The
study further indicated that large number of tree dwelling animals ware observed on 60
cm height from the sediment rather than in 30 cm from the sediment. This is due to
their morphological structure that enabled them to thrive in different habitat, even in
dead wood of mangroves. However, the results showed that no animals were observed
above 60 cm height from the sediment.
Table 6: Percentage of tree dwelling animals in different heights in Ngezi and Wesha.
Source: Field data 2012
In zonation wise, the study showed lower zones of both sites possessed large number
of tree dwelling animals compared to middle and upper zones. This is because,
majority of tree dwelling animals (bivalves) are filter feeders, so they preferred on
habitat which are characterized by long period of submerged in water and very short
period of exposure to air. The results also supported by other previous studies like that
of Frith et al., (1996) who reported that, tree dwelling animals mainly occurred in
seaward area rather than on landward of mangrove zones. Moreover, the results
indicated that neither I. ephippium nor S. cuculata have been observed in sediment.
S/no Species Ngezi Wesha
30 cm 60 cm Sediment 30 cm 60 cm Sediment
1 C. decollata 34.5% 62.69% 2.7% 37.15% 55.5% 7.43%
2 I. ephipium 35.1% 64.8% - 24.4% 75.2% -
3 S. cuculata 36.2% 63.7% - 31.7% 68.2% -
54
4.3 Objective three: To assess the association between environmental conditions
(salinity, temperature and pH) to the distribution of macrofauna.
This objective covers three physicochemical parameters of pore water which are
salinity, pH and temperature. Figures and tables have been used to elaborate the
results.
4.3.1 Salinity
The results indicated that, the salinity value ranged from 32 ‰ – 40.5‰ for Wesha and
25.8‰ - 39.7‰ for Ngezi mangrove forest. Furthermore, the statistical analysis
showed that there was no significance difference in salinity value between Ngezi and
Wesha mangrove forest (One tail P < 0.1798, t = 1.034, Df = 4). The results
correspond to the previous studies. For examples Richardson (2010) reported that
salinity in coastal areas ranges on 32‰ - 35‰. However the result differs from other
studies like that of Vijayalakshmi et al., (1993) who reported that the salinity value
ranges from 34‰.-48‰ in mangroves of Gulf of Kachchh. The study further indicated
that, highest salinity value was recorded at Wesha while the lowest was recorded at
Ngezi which was 40.54‰ and 25.88‰ respectively. Salinity plays a crucial role on
distribution and abundance of mangrove macrofauna at large extent. It has been
identified as a key environmental variable affecting the distribution of organisms and
influencing critical physiological process (Jansson, 1994). It is important because it
represents ecological master factor for marine organisms.
In zonation wise, the results showed that in Wesha the salinity value was 40.5‰,
35.8‰, and 32.8‰ for upper middle and lower zones, respectively. Similarly in Ngezi
the salinity value for upper, middle and lower zones was 39.75‰, 25.88‰ and

55
28.75‰, respectively (Figure 11). The study indicated that in Wesha the salinity value
decreases from upper zone to middle zone and lower zone. The upper zone Wesha
exhibit high salinity value compared to middle and lower zones. The situation could be
explained by high temperature and subsequent evaporation of sea water that coupled
with increased salinity (Zingda et al., 1987). However in Ngezi the situation is quite
different, high salinity value was recorded at upper zone followed by lower and lastly
middle zone of the forest. According to the results middle zone of Ngezi exhibit very
low salinity compared to the other zones of both sites. This is due to the fresh water
influx from the river Kunguni that discharged their water through this zone, thus why
the salinity value in this zone was found to be very low compared other zones (Figure
11).
20
25
30
35
40
45
upper middle lower
Sal
init
y v
aria
tio
n
( ‰
)
Station
Ngezi
Wesha
Figure 11: Variation of salinity in Ngezi and Wesha mangrove forest.
The salinity is the most important a biotic factor that determines the distribution and
abundance of macrofauna along the coast. In general the results showed that, low
salinity support large number of macrofauna mostly gastropods and bivalves. Bivalves
are filter feeders so most of the time they need water for their survival and that is why
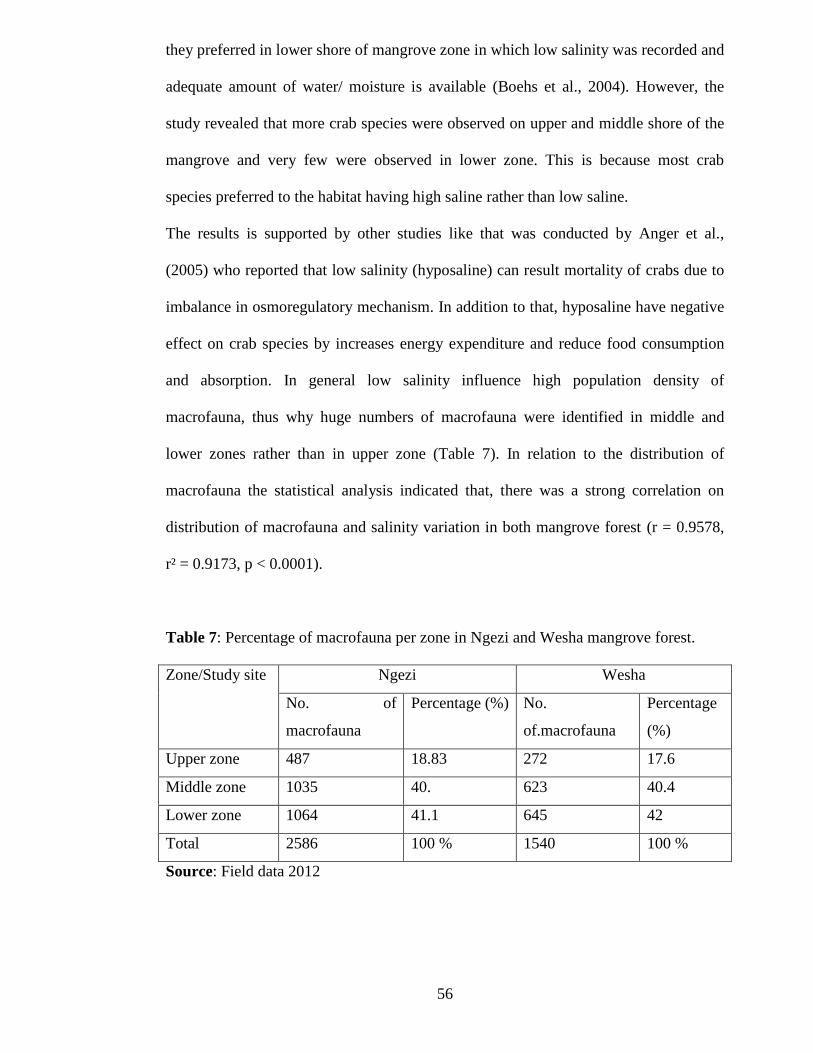
56
they preferred in lower shore of mangrove zone in which low salinity was recorded and
adequate amount of water/ moisture is available (Boehs et al., 2004). However, the
study revealed that more crab species were observed on upper and middle shore of the
mangrove and very few were observed in lower zone. This is because most crab
species preferred to the habitat having high saline rather than low saline.
The results is supported by other studies like that was conducted by Anger et al.,
(2005) who reported that low salinity (hyposaline) can result mortality of crabs due to
imbalance in osmoregulatory mechanism. In addition to that, hyposaline have negative
effect on crab species by increases energy expenditure and reduce food consumption
and absorption. In general low salinity influence high population density of
macrofauna, thus why huge numbers of macrofauna were identified in middle and
lower zones rather than in upper zone (Table 7). In relation to the distribution of
macrofauna the statistical analysis indicated that, there was a strong correlation on
distribution of macrofauna and salinity variation in both mangrove forest (r = 0.9578,
r² = 0.9173, p < 0.0001).
Table 7: Percentage of macrofauna per zone in Ngezi and Wesha mangrove forest.
Source: Field data 2012
Zone/Study site Ngezi Wesha
No. of
macrofauna
Percentage (%) No.
of.macrofauna
Percentage
(%)
Upper zone 487 18.83 272 17.6
Middle zone 1035 40. 623 40.4
Lower zone 1064 41.1 645 42
Total 2586 100 % 1540 100 %
57
4.3.2 Pore water pH
The pH of water is the second most important a biotic factor that may influence many
biological and chemical processes in natural waters (Saad, 1998). The results showed
that the recorded pH ranged from 6.55 to 6.6 and 6.42 to 6.52 for Ngezi and Wesha
respectively. The study revealed that the highest pH value was recorded in Ngezi
which was 6.6 while the lowest pH was recorded in Wesha which was 6.42.
The study further indicated that, there was no significant difference in pH value
between Ngezi and Wesha mangrove ecosystem (two tailed test P > 0.1729, t = 2.081,
Df = 2). The results are also supported by the previous study on physicochemical
parameters, Example, Rogothaman and Patil (1995) who reported that the pH of pore
water ranged from 6.7 to 7.4 in the mangroves along Vellar estuary. However, the
results varied from the study of Govindasany and Kannan (1991) who reported that the
pH of pore water ranged from 4.9 to 7.2 in the mangroves of Pitchavaram.
In term of zonation, the results showed that, in Ngezi the pH value was 6.56, 6.6 and
6.5 for upper middle and lower zones respectively. Similarly in Wesha the salinity
value was 6.52, 6.49 and 6.42 for upper middle and lower zones respectively. The
study further indicated that upper zone Wesha exhibit high pH value followed by
middle and lastly lower zones. However, in Ngezi the situation is different, high pH
value was recorded at the middle zone followed by upper and finally lower zone
(Figure 12). The situation could be explained by the fresh water influx from the river
Kunguni that discharged their water directly to the middle zone Ngezi. Furthermore,
the study indicated that, there was no great variation of pH value along the study sites
(Figure 12).

58
6
6.2
6.4
6.6
6.8
7
upper middle lower
pH
vari
ati
on
Station
Ngezi
Wesha
Figure 12: Variation of pH per zone in Ngezi and Wesha mangrove forest.
In relation to the distribution of macrofauna, the results indicated that low pH favor
high population density of macrofauna like gastropod and bivalve species that is why
huge number of gastropods and bivalves were observed and recorded at the lower
shore where low pH value were recorded. These results are also supported by previous
study on effect of physicochemical parameters on distribution of macrofauna along
intertidal area done by Boehs et al., (2004) who reported that bivalves are widely
distributed in environment with low pH. Furthermore, the statistical analysis (Pearson
correlation) indicated that there was a strong correlation between pore water pH and
the distribution of macrofauna in both study sites (r = 0.9591, r² = 0.9785, p < 0.0001).
4.3.3 Pore water temperature
Like salinity and pH, temperature plays an important role on distribution and
abundance of macrofauna in a particular area of niche. In the present study, the results
indicated that the pore water temperature recorded ranged from 28.44˚C - 29.81˚C and
29.1˚C - 31.57˚C for Ngezi and Wesha, respectively. The highest recorded temperature

59
was 31.57˚C in Wesha while the lowest temperature was 28.44˚C in Ngezi. Moreover,
the statistical analysis indicated that there was no significant difference in temperature
variation between Ngezi and Wesha mangrove forest (two tailed test P < 0.0900, t =
3.105, df = 2).
These results is also observed earlier by several workers like Ragothaman and Patil
(1995) who reported that the pore water temperature ranged from 27˚C and 33˚C in
Tapi estuary; Watts et al., (1982) reported that pore water temperature in Gulf of
Karachchh ranging between 25˚C to 30˚C, Selvam et al., (1992) reported that pore
water temperature along Kakinada mangrove ranging between 26.9˚C to 31.2˚C.
However, the results varied to the study of Kesavan et al., (2007) who reported that
pore water temperature in Godavari mangrove ranging from 19˚C to 37˚C. The highest
temperature recorded at Wesha mangrove forest could be explain by free open space
whereby local community were observed to involved in utilization of mangrove trees
for construction materials, wood fuels, sea weed farming and lime and charcoal
making which are major threats of mangrove community.
Moreover, the die back of mangrove forest may attribute in temperature fluctuation in
Wesha. Generally, surface water temperature is influenced by the intensity of solar
radiation, evaporation and fresh water influx. Unsuitable temperature may affect
growth rates, length of life, reproductive capacity as well as intra and interspecific
competition. In fact such effect may have some impact, directly or indirectly on
distribution of mangrove macrofauna. Moreover the major obvious effect of unsuitable
temperature is the resulting of exclusion of certain species of that particular habitat
(Choudhury et al., 1984).
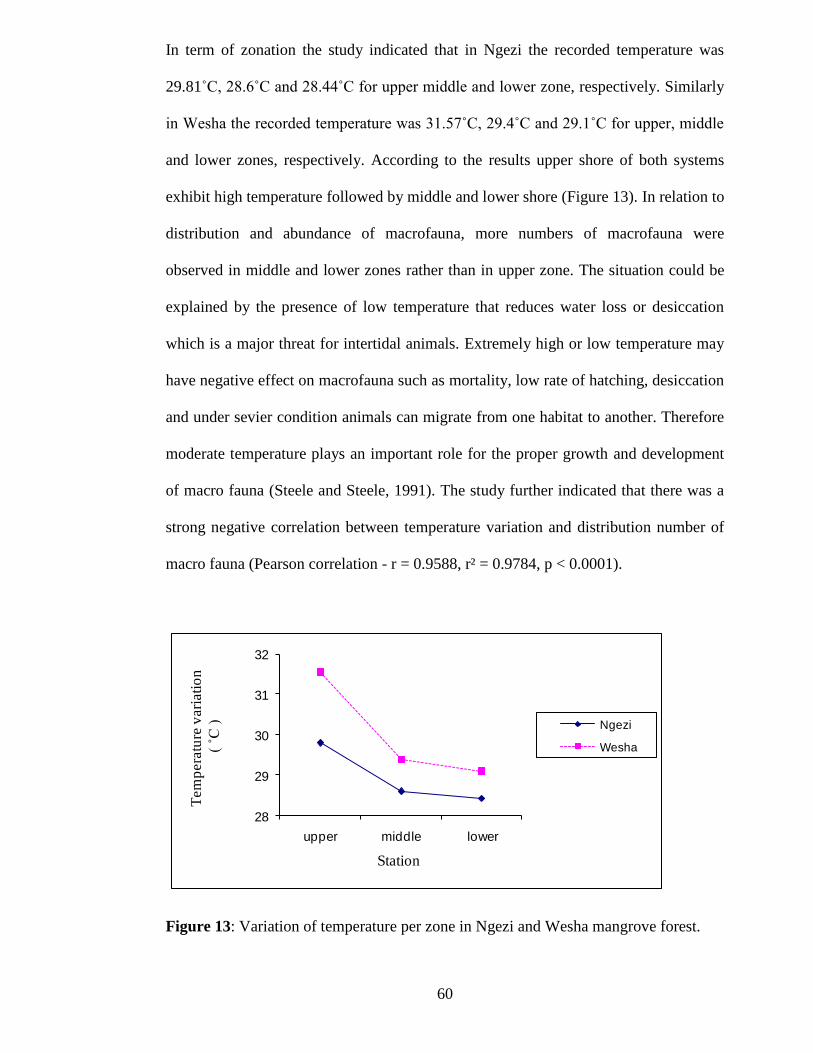
60
In term of zonation the study indicated that in Ngezi the recorded temperature was
29.81˚C, 28.6˚C and 28.44˚C for upper middle and lower zone, respectively. Similarly
in Wesha the recorded temperature was 31.57˚C, 29.4˚C and 29.1˚C for upper, middle
and lower zones, respectively. According to the results upper shore of both systems
exhibit high temperature followed by middle and lower shore (Figure 13). In relation to
distribution and abundance of macrofauna, more numbers of macrofauna were
observed in middle and lower zones rather than in upper zone. The situation could be
explained by the presence of low temperature that reduces water loss or desiccation
which is a major threat for intertidal animals. Extremely high or low temperature may
have negative effect on macrofauna such as mortality, low rate of hatching, desiccation
and under sevier condition animals can migrate from one habitat to another. Therefore
moderate temperature plays an important role for the proper growth and development
of macro fauna (Steele and Steele, 1991). The study further indicated that there was a
strong negative correlation between temperature variation and distribution number of
macro fauna (Pearson correlation - r = 0.9588, r² = 0.9784, p < 0.0001).
28
29
30
31
32
upper middle lower
Tem
pera
ture
vari
ati
on
( ˚C
)
Station
Ngezi
Wesha
Figure 13: Variation of temperature per zone in Ngezi and Wesha mangrove forest.

61
Furthermore, the present study showed that, no great variation of physicochemical
parameters between the study areas, however differences in distribution and abundance
of macrofauna have been observed at large extent between the two sites. Possibly there
are other factors that contribute lower distribution of macrofauna at Wesha rather than
environment factors. Cutting mangrove, over-fishing, and contamination from the oil
spill pollution with the addition of crude oil generated by the power plant which is
closely located to Wesha coastal area influence low distribution and abundance of
macrofuna in Wesha.
4.4 Objective four: To investigate anthropogenic activities affecting the
distribution and abundance of macrofauna
This objective covers respondent profile, clear felling of mangroves, over-fishing, oil
spills pollution and salt production as an anthropogenic factors affecting the
distribution and abundance of macrofauna.
4.4.1 Respondents profile
Fifty respondents from each study site were involved in this study to make a total of
one hundred (100) respondents. Among these 56% were males and 44% were females
(Table 8). Out of these 89% were married while 11% were unmarried (Table 8). In
considering educational status 21% of the total respondents were illiterate, 30%
attained primary education, 46% attained secondary education and the remaining 3%
have completed Advance level and above (Table 8). The study further indicated that
28% of the total respondents were involved in fishing activity, 24% in farming activity,
32%) in collection of marine resources and the remaining 16% were involved in other
economic activities (Table 8).

62
Table 8: Respondent profile
Category Number of respondents Percentage (%)
Gender
Male 56 56
Female 44 44
Marital Status
Married 89 89
Single 11 11
Type of Activities
Fishing 28 28
Farming 24 24
Collector of marine resources 32 32
Others 16 16
Education
Never attended 21 21
Primary Education 30 30
Secondary education 46 46
A level and Above 3 3
Source: Field data 2012
4.4.2 Anthropogenic activities
During the study period, four anthropogenic factors were investigated as major threats
on distribution and abundance of macrofauna along the study sites.

63
Table 9: Percentage of anthropogenic factors in Wesha and Ngezi
Source: Field data 2012
4.4.2.1 Clear cutting of mangroves
The results indicated that, 38% of the total respondents in Wesha agreed that clear
felling of mangrove for several purposes contribute to lower the distribution and
abundance of macrofauna while in Ngezi only 30% of total respondents agreed that
low distribution and abundance of macrofauna is the resulting of clear felling of
mangrove trees (Table 9). The study showed that, in Wesha large number of the local
communities were involved in clear felling mangrove for supporting their livelihood
needs. The situation could be explained by free open space whereby local communities
were involved in utilization of coastal resources without any restriction from
Government. The results correlate well with the previous studies like that of Semesi,
(1992, 1998) who reported that most destructive activities on mangrove are the
clearing for several purposes like construction materials, lime production and boat
making.
In contrast to Wesha, in Ngezi the results indicated that only 30% of the total
respondents agreed that felling of mangrove trees influence low distribution of
macrofauna. The situation could be explained by the conservation status of the forest in
which local communities were restricted in utilization of mangrove resources legally.
Apart from that, Ngezi has large area covered by terrestrial forest which is an
Site Cutting mangrove Oil pollution Over-fishing Salt production
Ngezi 30% 0% 28% 42%
Wesha 38% 20% 32% 10%

64
alternative resource for charcoal making, building materials, and other purposes like
fuel wood consumption. In considering the importance of mangrove trees to the
macrofauna, further study on the Mesoamerican reef has revealed that reefs close to
mangrove areas has twenty five (25) times more fish of some species rather than in
area where the mangroves have been cleared.
The felling of mangroves lead to loss of habitat, shore line, organic matter production
and species dependent on the habitat and mangrove based food chain (Semesi, 1991).
In general mangrove forest may be felled for several purposes like aquaculture ponds,
salt pans, agricultural use like rice fields, roads construction, industrial development,
boat making and village development. The commercial needs are the most important
activities that lead on over exploitation of mangroves (Semesi, 1991).
Clear felling of mangroves is considered as major threat of this unique system. In our
discussion with Government officers and local leaders, the head of forest department
Pemba reported that, the majority of local people along Wesha coastal area were
involved in cutting mangroves as a major source of income (Plate 5). The situation are
influenced by lacking of employment from the Government and they have no
alternative income generating project for improving their livelihood needs and thus
why they were involved in utilization of these coastal resources much with out
considering their roles to other living creatures living in that particular ecosystem.
However, the study revealed several negative impacts of clear felling of mangrove
trees to their associated macrofauna in number of ways. Felling of mangroves
contribute in habitat destruction that result refuges related problems, loss of breeding
ground for fish as well as other macrofauna in particular.
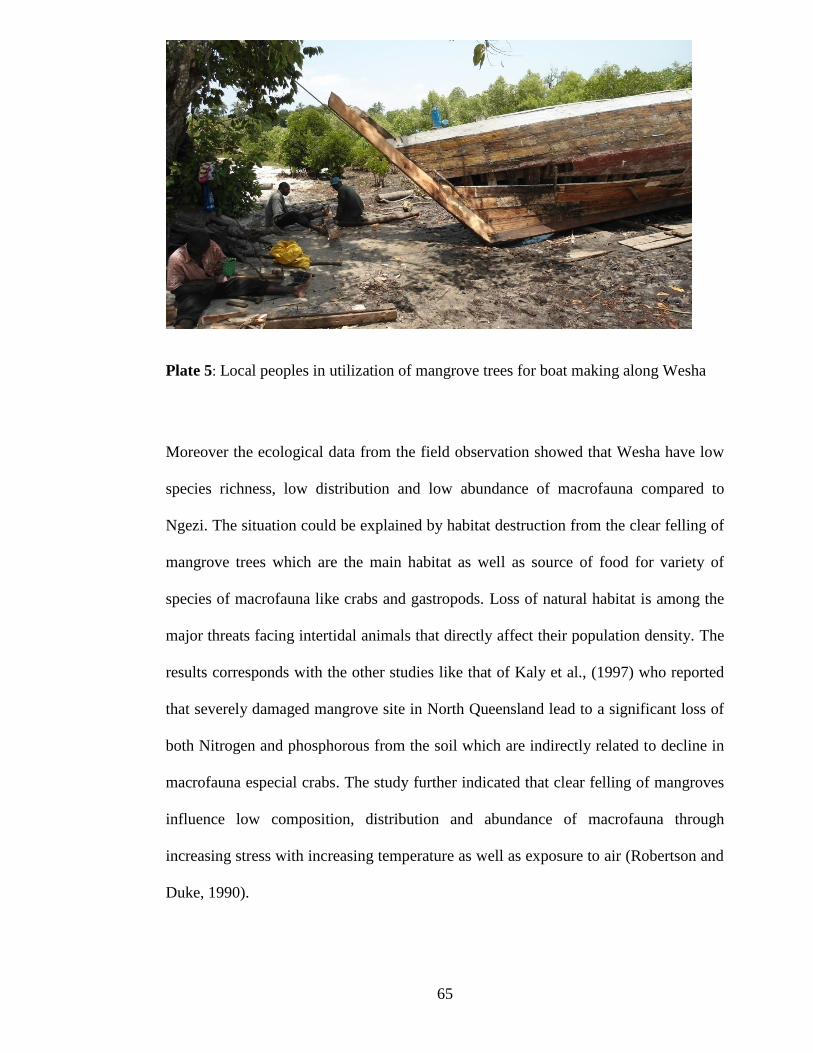
65
Plate 5: Local peoples in utilization of mangrove trees for boat making along Wesha
Moreover the ecological data from the field observation showed that Wesha have low
species richness, low distribution and low abundance of macrofauna compared to
Ngezi. The situation could be explained by habitat destruction from the clear felling of
mangrove trees which are the main habitat as well as source of food for variety of
species of macrofauna like crabs and gastropods. Loss of natural habitat is among the
major threats facing intertidal animals that directly affect their population density. The
results corresponds with the other studies like that of Kaly et al., (1997) who reported
that severely damaged mangrove site in North Queensland lead to a significant loss of
both Nitrogen and phosphorous from the soil which are indirectly related to decline in
macrofauna especial crabs. The study further indicated that clear felling of mangroves
influence low composition, distribution and abundance of macrofauna through
increasing stress with increasing temperature as well as exposure to air (Robertson and
Duke, 1990).
66
Apart from raising temperature and increasing exposure to air, felling of mangrove
trees, affect energy transfer because they are valuable food resources of macrofauna
like crabs and gastropods. It is likely that low distribution and abundance of
macrofauna in Wesha mangrove ecosystem are influenced by inadequate food
resources through clear felling of mangrove. Mangroves are important in providing
goods and services to many organisms living along the estuary environment. The
results correlate to the previous findings on mangrove deforestation done by Stuart et
al., (1990). In addition the productive nature of mangrove communities which are often
important link between many biological diversity and other near shore community
(Alongi, 1989; Robertson, 1991; Lee, 1995; Kathiresan and Bigham, 2001).
Like any other ecosystem, mangrove link number of macro as well as micro-organisms
to make it as complete system. Each unit plays any important role in supporting the life
of others, so, the removal of a single unit will affect the flow of energy of that
particular ecosystem. Therefore, the clear felling of mangrove trees in Wesha
contributes low distribution and abundance of macrofauna through disruption of either
components of concerned system. Furthermore, loss of mangrove leaves that are
important in contributes substantially to formation of detritus which support many
coastal fisheries, contributes low distribution and abundance of macrofauna.
4.4.2.2 Over-fishing and illegal fishing gears
The results showed that 28% of the total respondents in Ngezi agreed that low
distribution and abundance of macrofauna are influenced by over fishing activities that
are performed by local community living along the coast illegal. However the study
indicated that, 32% of the total respondents in Wesha agreed that low distribution of

67
macrofauna are influenced by over-fishing (Table 9). This observation corresponds to
the previous studies like that of Myers and Worm, (2003) who reported that over-
fishing as a major factor that influence biodiversity loss. In Ngezi, low percentage of
respondents that agreed, low distribution of macrofauna are influenced by overfishing
could be explain by the nature of the forest which is protected and local people were
just utilize these valuable resources under supervision otherwise they utilize the
resources illegally. Unlike, Ngezi, in Wesha large percentage of the respondents agreed
that, low distribution of macrofauna are influenced by overfishing. The situation could
be explained by free space Wesha in which majority of local communities living near
and around Wesha coastal area were involved in utilization of these resources with out
consider the size and age of macrofauna that are landed.
Over-fishing is among the anthropogenic activities affecting the distribution and
abundance of macrofauna. It occurs when fish and other living resources are caught at
a rate which exceeds the maximum harvest that allows the population to be maintained
by reproduction (Myers and Worm, 2003). Over fishing and the use of illegal fishing
gears are among factors influencing of low population density of macrofauna in
intertidal area as well as threatening the endangered species due to harvesting even non
target animals (Jones, 1992; Gray, 1997; Janning and Kaiser, 1998; Myers and Worm,
(2003). The situation results biodiversity loss due to the incidental capture of non
target animals. Apart from that, long term over-fishing reduces the abundance,
spawning potential and possibly population parameters like growth and maturity of
macrofauna (Myers and Worm, 2003).

68
Moreover, over-fishing reduces age and size structure, sex ratio, species composition
of the target resources as well as of their associated and dependent species. Over-
fishing and the use of illegal fishing gears lead to clear changes in community
composition of benthic infauna and epifauna which may have far-reaching implications
for the integrity of marine food webs (Darrel et al., 2012). In addition to that over
fishing and the use of illegal fishing gears may alter habitats most notably by
destroying and disturbing bottom topography and associated habitat e.g. sea grass and
benthic communities as well as direct mortality of benthic infauna.(Kaiser & Spencer,
1996, Schwinghamer et al., 1998).
4.4.2.3 Oil spills
The study indicated that in Ngezi no respondents agreed that low distribution and
abundance of macrofauna are influenced by oil spills pollution. However, the study
revealed that 20% of the total respondents in Wesha agreed that low distributions of
macrofauna are influenced by oil spills pollution (Table 9). The situation could be
explained by the presence of port that are mainly used for unloading operation of
petroleum as well as the presence of power plant that are located closely to Wesha
coastal area (Plate 6). The power plant discharged their wastes directly along the coast
where varieties of living organisms are located. Oil spills from the unloading operation
and crude oil generated by the power plant are the main source of environmental
degradation that influence low population density of macrofauna in Wesha.

69
Plate 6: Crude oil generated by power plant along Wesha costal area.
Pollution from the oil spills continue to damage mangrove as well as to their associated
fauna (Semesi, 1998). Oil contamination can damage animals in the mangal, both in
sediments and submerged mangrove roots (Elmgren et al., 2006). Through field
observation, the study indicated that low distribution and abundance of macrofauna
were identified in Wesha compared to Ngezi The results corresponds to the previous
studies like Levy et al., (1980) who reported that, the population density of macrofauna
have been reduced by 60% after the Galeta spills in Panama. The decreasing of
population density is a part of related to loss of root surface on which most macrofauna
like bivalves and some gastropods are located as their main habitat. Therefore, loss of
mangrove vegetation influence low distribution of macrofauna due to lack of suitable
habitat, lack of adequate food from the mangrove leaves as well as refuges related
problems (Plate 7).

70
Plate 7: Showing dead mangroves near the power plant at Wesha coastal area.
It has been reported that, oil spills pollution and industrial wastes induced adverse
effect on macrofauna due to smothering or toxic (Kingstone et al., 1995). Oil spills
pollution can induced direct mortality of macrofauna that results low population
density as well as low species richness due to ecological disturbance (Hall, 1994).
Apart from direct mortality of macrofauna, oil spills and waste from the power plant
may also associated to long term effect such as predation, avoided burrowing activities,
delaying response, lower feeding rate due to oil residue which are biological active that
can affect population density of macrofauna (Elmgren et al., 2006). Moreover, unlike
Wesha in Ngezi, the situation is different whereby the population density of
macrofauna was high. This could be explained by the absence of source of oil pollution
that causes seriously ecological damage that could affect the population density of
macrofauna along the intertidal area like Wesha which is highly polluted.
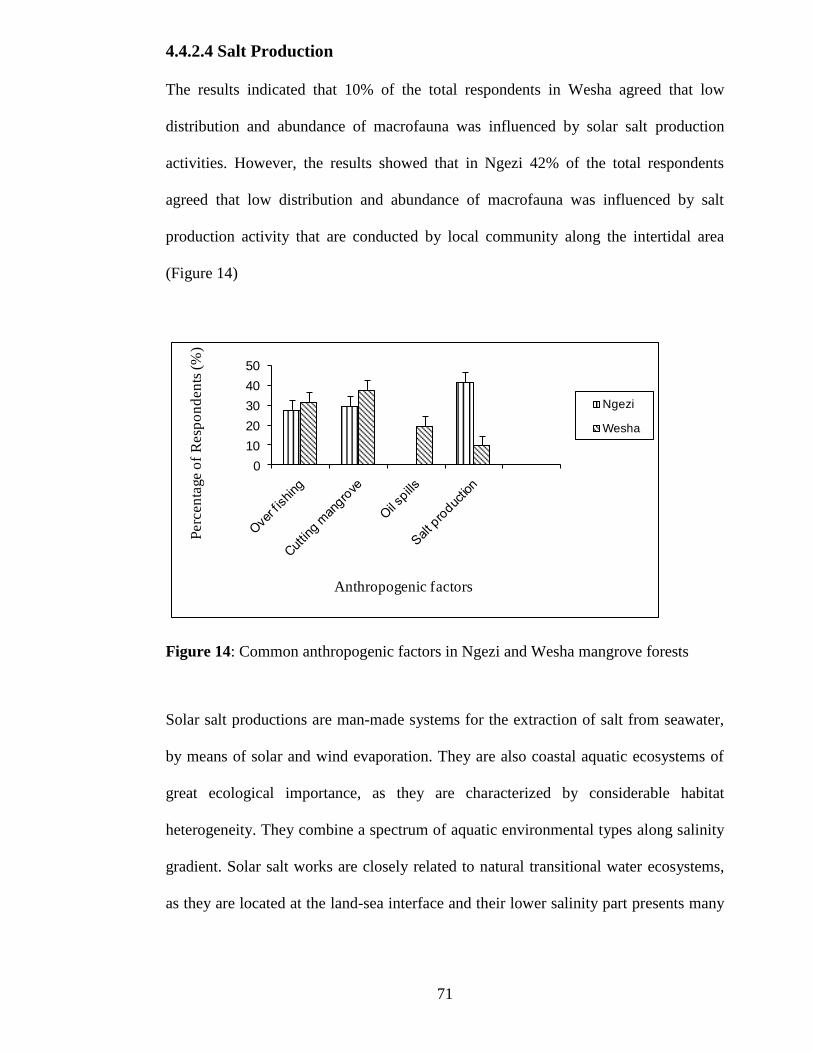
71
4.4.2.4 Salt Production
The results indicated that 10% of the total respondents in Wesha agreed that low
distribution and abundance of macrofauna was influenced by solar salt production
activities. However, the results showed that in Ngezi 42% of the total respondents
agreed that low distribution and abundance of macrofauna was influenced by salt
production activity that are conducted by local community along the intertidal area
(Figure 14)
0
10
20
30
40
50
Perc
en
tage o
f R
esp
on
den
ts (
%)
Anthropogenic factors
Ngezi
Wesha
Figure 14: Common anthropogenic factors in Ngezi and Wesha mangrove forests
Solar salt productions are man-made systems for the extraction of salt from seawater,
by means of solar and wind evaporation. They are also coastal aquatic ecosystems of
great ecological importance, as they are characterized by considerable habitat
heterogeneity. They combine a spectrum of aquatic environmental types along salinity
gradient. Solar salt works are closely related to natural transitional water ecosystems,
as they are located at the land-sea interface and their lower salinity part presents many

72
similarities with coastal lagoons, regarding both the abiotic environment and the biota
(Evagelopoulos & Koutsoubas, 2007).
Salt solar production is among the anthropogenic activities that constitute greatest
threat on mangrove as well as to their associated fauna (Farnsworth, 1997; Semesi,
1998). It is associated with the clear cutting of mangrove forests, which are significant,
used as suitable habitat for animals living in the mangrove zones. Therefore, felling of
mangrove trees results habitat loss that influence low distribution of macrofauna along
the intertidal areas. Apart from that solar salt production elevate water salinity and
decreased water flow due to salt farms, the situation may kill number of macrofauna
that directly result low population density (Viles, 2005). Further study indicated that
population density of macro-invertebrates of coastal lagoon in Ghana was less in area
near the salt ponds compared to the area with out salt ponds (Molony and Parry, 2006).
Moreover, salt ponds increases water temperature whereby macrobenthose suffered
from elaveted temperature. The situation may affect the physiological process of
macrofauna and under sevier condition may result mortality of macrofauna that
directly influence low distribution and abundance of macrofauna.
However, the study indicated that the intensity of anthropogenic activities to the
distribution and abundance of macrofauna varies. The results indicated that in Ngezi
42% of the total respondents agreed that solar salt production influence low
distribution of macrofauna however, high population density have been observed. It is
likely that solar salt production has lees impact on distribution and abundance of
macrofauna compared to other activities that were identified during the study period.
Even though, Ngezi is a protected area but the results showed that in some extent local
73
communities were allowed to utilize some resources but in a proper way. For example
the study indicated that some local people were involved in solar salt production but it
might be the operation has less effect on distribution of macrofauna because the
activities are conducted at the open space which is far apart from the mangroves. Apart
from that, due to the nature of forest (conserved area) solar salt production in Ngezi act
as an alternative income generating project instead of depending on mangrove and
their associated macrofauna which are mainly prohibited.
Furthermore, the statistical analysis indicated that, there was a significant higher in
anthropogenic activities affecting the distribution and abundance of macrofauna
between Ngezi and Wesha (two tailed test P > 0.0399, t = 0.000, Df = 3). The same test
indicated that there was no significant difference in anthropogenic factors in Wesha
mangrove forest (P > 0.1342, t = 2.039, Df = 3). However, the study indicated that,
there was a significant differences in anthropogenic factors in Ngezi mangrove forest
with salt production being the most influencing factor (p > 0.0171, t = 4.811, Df = 3).

74
CHAPTER FIVE
CONCLUSION AND RECOMMENDATIONS
5.1 Conclusion
The results indicated that Wesha mangroves ecosystem have been greatly impacted
through human activities with the addition of oil spills pollution from unloading
operation and wastes generated by the power plant. The study indicated that, Wesha
(non protected) has low species density of mangrove trees with low regeneration rate
compared to Ngezi (protected) where the species diversity and regeneration rate were
observed to be higher. The results further indicated that, the physicochemical
parameters of pore water between the study sites were almost the same however
Wesha has low species richness, low distribution and low abundance of macrofauna.
Moreover, the study has shown that, cutting mangrove for different purpose, salt
production, over-fishing and oil spills pollution were the major anthropogenic
activities that affect mangrove as well as to their associated macrofauna along the
study sites. However the study indicated that, Wesha (non protected area) coastal zones
are more affected compared to Ngezi which is well protected. Even though Wesha
have been seriously impacted by number of anthropogenic factors, but it is more
diverse in macrofauna species due to the presence of bivalve species that are more
resistant to anthropogenic threats. Therefore intensive conservation practice is needed
so as to protect them.
75
5.2 Recommendations
Based on results of the present study the following recommendations should be taken:-
To reduce mangrove deforestation as well as low distribution and abundance of
macrofauna along Wesha mangrove forest, unloading operation and wastes from
power plant should be well manageable.
The degraded system along Wesha coastal area should be restored so as to bring back
as nearly as possible to its original state with high resistant and resilience.
Publicity and awareness campaign through film shows, organizing seminars, nature
camps, distributing publicity materials should be conducted not only to the local
community of Wesha coastal area but also for all people living along the coast so as
promote knowledge of environmental conservation which is important in supporting
many biological resources.
Alternative projects for income generation should be established for local community
living along the coast rather than depending only on harvesting of coastal resources for
supporting their livelihood to a large extent.
Establishment of community based conservation that involves local villagers in the
management of coastal resources will promote sense of ownership. The situation will
promote effective management of coastal resources which is very important for the
benefit of all stake holders and Government in general.
76
Under sized fishing of coastal resources mainly macrofauna such as crabs, bivalves
and gastropods should be burned.
Priority environmental protection must be incorporated into the planning of all major
projects as a fundamental requirement.
Comprehensive and more powerful environmental laws should be formulated and
enacted to enabling the relevant bodies to enforce such legislation.
Specific project of environmental conservation for Wesha mangrove forest should be
established due to the presence of variety of biological resources in order to make it
healthier like or more than other conservation area.
5.3 Limitation of the study
The following are some constraints that were encountered during this study. Firstly,
lack of instruments like (DO meter) for measuring dissolved oxygen which was the
most important parameter used to determine the distribution of macrofauna. Secondly
lack of financial support which is important for the successful completion of any study,
so due to financial constrain the study could not detect the level of oil pollution along
the study areas.
5.4 Area for further study
According to the results, the study revealed that, Wesha mangrove forest and their
associated macrofauna have been seriously impacted by combination of anthropogenic
factors including oil spills pollution. So these factors result serious ecological damage
77
in such away the degraded system are an able to provide goods and services needed by
biological diversity living in that particular ecosystem. Hence further scientific study is
needed to detect the level of oil pollution as well as the survival of planting seedlings
along Wesha coastal area. Apart from that, also further scientific study for the species
of macrofauna that are considered as less susceptible to the oil pollution is needed.

78
REFERENCES
Ajao, E. A. and Fagade, S. O. (1990), A study of Sediment communities in Lagos
Lagoon, Nigeria. J. Oil Chemi. Pollut.7: 85-105.
Ajao, E. A. and Fagade, S. O. (2002), The benthic macro in fauna of Lagos Lagoon.
The Zoologist, 1(2): 1-5.
Alfred, J. B., Varshney, R. K. and Ghosh, A. K. (1997), An assessment manual for
faunal biodiversity in South Asia. SACEP/NORAD publication series on Biodiversity
in South Asia No. 1: 181pp.
Alongi, D. M. (1989), The role of soft-bottom communities in tropical mangrove and
coral reef ecosystems. Rev. Aqua. Sci. 1: 243–281.
Anger, K., Riesebeck, K. and Puschel, C. (2005), Effect of salinity on larval and early
juvenile growth of an extremely euryhaline crab species Armases miersii
(Decapoda:Grapsidae).Hydrobiologia, 426:161-168.
Ansa, E. J. (2005), Studies of the benthic macrofauna of the Andoni flats in the Niger
Delta Area of Nigeria. Ph.D Thesis, University of Port Harcourt, Port Harcourt,
Nigeria, pp: 242.
Abdullah, H. S., Ali, M. S. and Kurika, T. (1996), Ngezi forest Reserve Management
Plan. Zanzibar Forestry Development Plan, Tech. Paper No. 31.
79
Baker, J. M. (2001), Oil pollution, In Encyclopedia of Ocean Sciences, Vol. 4 (Steele,
J. H., Thorpe, S. A. & Turekian, K. K, ( eds) , pp. 1999–2007. Academic Press.
Ball, M. C. (2002), Interactive effect of salinity and irradiance on growth: Implications
for mangrove forest structure along Salinity gradients. Tree (Berl) 16: 126- 139.
Benebo, T. E., Inko–Tariah, T., Abby–Kalio, N. J. and Amadi, A. (1999), Revegetation
of Cleared mangrove areas in the Niger Delta of Nigeria – SPDC (E) Experience.
Paper Presented at a two – day workshop on mangrove ecosystem conservation held at
the Hotel Presidential, Port Harcourt, 25-27 November, 1999.
Boehs, G., Absher, T. A. & Cruz-Kaled, A. (2004), Composition and distribution of
benthic molluscs on intertidal flats of Paranaguá Bay (Paraná, Brazil). Scientia Marina
68(4): 537-543.
Beentje, H. J. (1990), Botanical Assessment of Ngezi Forest Pemba. FINIDA Report to
the Commission for Natural Resources, Zanzibar.
Boufadel, M., Sharifi, Y., Van Aken, B., Wrenn, B., and Lee, K. (2010), Nutrient and
oxygen concentrations within the sediments of an Alaskan Beach Polluted with the
Exxon Valdez Oil spills Environmental Science technology 44:7418-424.
Brown, C. A. and Oyenekan, J. A. (1998), Temporal variability in the structure of
benthic macrofauna community of the Lagos lagoon and habour, Nigeria. Pol. Arch.
Hydrobio. 45(1): 45 – 54.
80
Caccioni, R. (2000), Benthic foraminifera as a bioindicators of heavy metal pollution.
A case study from the Goro lagoon (Italy). In: R. E. Martin, Editor, Environmental
micropaleontology 71-103.
Canand, C. (1997a), Hong Kong imports of beche-de-mer, January–March 1996. SPC
Beche-de-Mer Information Bulletin No. 9: 23.
Canand, C. (1997b), Are holothurian fisheries for export sustainable? International
Congress of Reefs, Panama, 2: 2021–2024.
Coles, J. A. and Pipe, R. K. (1994), Phenoloxidase activity in the hemolymph and
hemocytes of Marine mussel Mytilus edulis. Fish & Shellfish Immunology. Vol.4
pp335-352.
Cassell, C. & Symon, G. (1994), Quantitative research in work contexts. In C.
Cassell,&Symon (Eds), Qualitative methods in organizational research ( pp. 1-
13).Thousand Oaks, C A: Sage Publications.
Choudhury, A., Bhunia, A. B. and Nandi, S. (1984), Preliminary survey on macro
benthos of Prentice Island, Sundarbans, West Bengal. Rec. Zool. Surv. India, 81: 81-
92.content. Chem. Biodivers., 1, 1569-1577.
Donato, D. C., Kauffman, J. B., Murdiyarso, D., Kurninato, S., Stihdam, M., &
Kanninen, M. (2011), Mangrove among the most carbon-rich forests in the Tropics.
Nature Geoscience, Advance Online Publication.
81
Darrell, R., Mullowney, J., Corey, J., Earl, G., Dawe, B., Katherine, R. (2012), Impacts
of a bottom trawling exclusion zone on Snow Crab abundance and fish harvester
behavior in the LabradorSea,Canada.MarinePolicy 36:3,567-575.
Dauvin, J. C. (2000), The muddy fine sand Abra alba-Melinna palmate community of
the Bay of Morlaix Twenty after the Amoco Cadiz oil spill.Marine pollution Buttetin
40,528-536.
Dittmann, S. (2000), Zonation of Benthic Communities in Tropical tidal flat of north
east Australia. J. Sea Res 43: 33-51.
Elmgren, R., Hansson, S., Larsson, U. and Sundelin, B. (2006), Impact of oil on deep
soft bottoms. In: Kineman, J.J., R. Elmgren, and S. Hansson (eds.), The Thesis oil
spill. Washington.
Emmanuel, B. E., Chukwu, L. O. and Azeez, L. O. (2008a), Cast net design
characteristics, catch composition and selectivity in tropical open lagoon. African
Journal of Biotechnology.7 (12): 2081 – 2089.
Emmanuel, B. E., Chukwu, L.O. and Azeez, L.O. (2008b), Gill net selectivity and
catch rates of pelagic fish in tropical coastal lagoonal ecosystem. African Journal of
Biotechnology . 7 (21), 3962-3971.

82
Evagelopoulos, A. & Koutsoubas, D. (2007), Seasonal communities, structure of the
Molluscan macrofauna at the marine-lagoonal environmental transition at Kallon Solar
Saltworks (Lesvos Island, NE Aegean Sea, Greece). Journal of Natural History in
press.
Ewa-Oboho, I. (1994), Effects of Simulated oil exposure on two intertidal macro-
zoobenthos Tympanotomus fuscata (L) and Uca tanger (Eydoux 1935) in a Tropical
mangrove ecosystem. Exotox envir,Saf, 28:243.
Folz, D. H. (1996), Survey research for Public Administration, Thousand Oaks, Stage
Publication ISBN 0-7619-0152-3(acid free paper) ISBN 0-7619-0153-1(Chapter 3:
Sampling, pp 42-76).
Frith, D. W., Tantanasiriwong, R. & Bhatia, O. (1996), Zonation of macrofauna on a
mangrove shore, Phuket Island, South Thailand. Phuket Mar. Biol. Center Res. Bull.,
10: 1-37.
Farnsworth, E. J. and Aaron, M. E. (1997), The global Conservation Status of
Mangrove, Sept, 1997. AMBIO 26 (6):328-334.
Fukuyama, A. K. and Vanblaricom, G. R. (1997), Literature review of the effects of oil
and oil Spills on Arctic and north temperate intertidal and shallow sub tidal
ecosystems. Seattle: NOAA Tech. Memo. NOS ORCA 103, 124 pp.

83
Fondo, E. and Martens, E. (1998), Effect of Mangrove deforestation on macrofaunal
densities, Gazi Bay, Kenya [ J ]. Mangrove and Salt Marshes, 2:75-83.
Gao, A., Chen, Q., Zeng, J. and Yang, J. (2005), Macrofauna community in the
Mangrove Snail Terebralia palustris (Linnaeus) (Potamididae:Gastropoda) (J). Journal
of Experimental and Marine Biology & Ecology, 261: 173-183.
General Authority for Fish Resources Development (GAFRD) (2006), "Statistics of
fish production", Cairo, Egypt.
Gereta, E. (2004), Trans- boundary water Issues threaten the Serengeti ecosystem.
Oryx 38:13-16.
Gesteira, J. L. and Dauvin, J. C. (2000), Amphipods are good bioindicators of impact
of oil spills on soft bottom macro benthic communities. Marine Pollution Bulletin 40,
1017-1027.
Getter, C. D., Scott, G. I. and Michel, J. (1981), The effect of Oil spills on mangrove
regeneration a Comparison of five Oil spills sites in the Gulf of Mexico and the
Caribian Sea. pp 535-540. In: Proceeding of the 1981 Oil Spills Conference, America.
Gibson, R. N. (1982), Recent studies on the biology of intertidal fishes. Oceanogr.
Mar. Biol. Annu. Rev., 20: 363–414.

84
Govindasamy, C. and Kannan, L. (1991), Rotifers of the Pitchavaram mangroves
(Southeast coast of India): A hydrobiological approach. Mahasagar. 24(1): 39-45.
Gray, J. S. (1997), Marine biodiversity: patterns, threats and conservation needs
.Biodiversity conserve 6: 153- 175.
Guerreiro, J., Freitas, S., Pereira, P. & Macia, A. (1996), Sediment macrobenthos of
mangrove flat at Inhaca Island, Mozambique. Cah. Biol.Mar. 37:309-327.
Gilman, E., Vanlavieren, H., Ellison, J., Wilson, V. J., Areki, F. (2009), Pacific Island
Mangroves in a Hanging Climate and Rising Sea. UNEP. Nairobi: UNEP Regional
Seas Reports and studies.
Hartnoll, R. G., Cannicci, S., Emmerson, W. D., Fratini, S., Macia, A., Mgaya, Y.,
Porri, F., Ruwa, R. K., Shunula, J. P., Skov, M. W. & Vannini, M. (2002), Geographic
trends in mangrove crab abundance in East Africa. Wetl. Ecol. Mange. 10: 203–213.
Hall, S. J. (1994), Physical disturbance and marine benthic communities: life in
unconsolidated sediments. Oceanogr. and Mar. Biol. Ann Rev. 32:179-239.
Hart, A. I. (1994), The ecology of the communities of benthic macrofauna in mangrove
swamp of Port Horcourt area of the Niger Delta. P h. D. Thesis, University of Port
Horcourt, River State, pp 262.

85
Hatje, V., Barros, F., Magalhães, W., Riatto, V. B., Amorim, F., Figueiredo, M. B.,
Spanó, S. & Cirano, M. (2008), Trace metals and benthic macrofauna distribution in
Camamu Bay, Brazil: Sediment quality prior oil and gas exploration.Marine Pollution
Bulletin 56(1): 348-379.
Hoffman, L. L. (2003), Mangrove ecology: From photosynthesis to forest dynamics.
Ph.D. Thesis. Stanford University, Stanford, California.
ICMZ (2009), The status of Zanzibar Coastal Resources Toward the Development of
Intergrated Coastal Management Strategies and Action Plan. Department of
Environment/MACEMP. 88pp.
Ikomi, R. B., Arimoro, F. O. and Odihirin, O. K. (2005), Composition, distribution and
abundance of macroinvertebrates of the upper reaches of River Ethiope Delta State,
Nigeria. The Zoologist, 3:68-81.
Jannings, S. and Kaiser, M. J. (1998), The effect of fishing on marine ecosystems.
Adv. Mar. Biol 14:201-352.
Jansson, B. O. (1994), Ecology of Eyjafjordur Project.Physical Parameteres measured
in Eyjafjordur in Period of April 1992- August 1993.Reykjavik, Iceland.
Jiddawi, N. S. (2005), Marine Fisheries, In: Tanzania state of the coast Report 2005.
The National ICM Strategy & Prospects for Poverty Reduction TCMP, Dar -es –
salaam.
86
Jones, J. B. (1992), Environmental impact of trawling on the sea bed: a review. NZJ
Mar Freshw Res 26:59-67.
Jones, C. G., Lawton, J. H. and Shachak, M. (1994), Organisms are ecosystem
engineers. Oikos 69:373-392.
Jumah, S. M., Silima, A. P. and Hassan, I. H. (2001), The Zanzibar Mangrove
Inventory. The Society for Natural Resources Conservation and Development.
Kaiser, M. J. and Spencer, B. E. (1996), The effect of beam –traw disturbance on in
fauna communities in different habitats. J Anim Ecol 65:348-358.
Kaly, U. L., Eugelink, G. and Robertson, A. I. (1997), Soil conditions in damaged
North Queesland mangroves. Estuaries, 20(2):291-300.
Kathiresan, K. and Bigham, B. L. (2001), Biology of mangrove and mangrove
ecosystem. Advances in Marine Biology Vol.40, 81-251.
Kathiresan, K. (2006), A review of studies on Pichavaran mangrove, south east
India.Hydrologia, 430:185.
Kathiresan, K. (2010), Mangrove ecosystem: Distribution of Mangroves. (A.
University, Ed). Retrieved 2010 December from Centre of Advanced Study in Marine
Biology.

87
Kennedy, V. S., Twilley, R. R., Kleypas, J. A., Cowan, J. H. and Hare, S. R. (2002),
Coastal and marine ecosystems and global climate change.Electronic version, January
2006. http://ian.umces.edu/pdfs/pew_marine_resources.pdf.
Kesavan, K., Palpandi, C., Amalraj, T., Vairamani, S., Raveendran, S. and
Shanmugam, A. (2007), Population density and distribution pattern of macrofauna in
the mangroves along Coringi River (Godavari mangroves, Andhra Pradesh). National
Conference Emerging Scenario in Zoology, 27th September, 70–76.
Kingstone, P. F., Dixon, S. and Moore, D. C. (1995), The impact of the Braer oilspill
on the macro benthic in fauna sediments off the Shetlands. Marine Pollution Bulletin,
30: 450- 459.
Kombo, Y. H., Masoud, T. S., Hamduni, S. I., Makame, K. M. and Jumah, S. M.
(2006), Zanzibar Biodiversity and Fragile ecosystem: Salvaging the last Remaining
Patches.
Kathirvel, M. (1992), Resources and exploitation of mud crab Scylla serrata (Forskal)
in India. In Angel C. A . (Ed). The mud crabs. Areport on the seminar convened in
Sural Thai, Thailand, November 5- 8 -1991.
Lee, S. Y. (1995), Mangrove out welling: a review .Hydrobiologyia 295, 203-212.
Lee, S.Y. (1998), The ecological role of grapsid crabs in mangrove ecosystem:
Implications for conservation. Mar. Fresh water Res., 49:335-343.
88
Lee, S.Y. (1999), Tropical mangrove ecology: Physical and Biotic factors influencing
ecosystem structure and function. Aus. J. Ecol., 24: 355-366.
Levy, E. M. (1980), Result of the IGOSS Pilot project on Marine Pollution (Petroleum)
Monitoring dissolved /dispersed Petroleum residue. Third work shop on Marine
Pollution Monitoring, New Delhi (mimo).
Lin, Q., Lu, J., Gao, Y., Shen, L., Cai, J. and Luo, J. (2005), The effect of temperature
on gonad development and survival rate of juvenile seahorses, Hippocampus kuda
Bleeker. Elsevier Aquaculture.
Marsden, D. and Maclaren, S. R. (2010), Short time Study testing the resilience of an
estuarine bivalves to macroalgal mats Resilience of an estuarine bivalves.
Hydrobiologia 649: 217-229.
Molony, B. W. and Parry, G. O. (2006), Predicting andmanaging the effects of
hypersalinity on the fish community in solar salt fields in north-western Australia.
Journal of Applied Ichthyology 22: 109 - 118
Macnae, W. (1968), A general account of flora and fauna of mangrove swamps in the
Indo-West Pacific region .Adv. Mar. Biol., 6:73-76.
McLeod, E. (2006), Managing Mangroves for Resilience to Climate Change: IUCN
Resilience Science Group Working Paper Series No: 2. Gland. Switzerland.
89
Mendelssohn, I. A. and McKee, K. L. (2000), Saltmarshes and mangroves. Pp. 501-
536. In M.Barbour and W. D. Billings (eds.), North American Terrestrial Vegetation,
2nd edition,Cambridge University Press, Cambridge.
Molina, C. (1995), Flux of Nitrogen and Sediments in a Fringe Mangrove Forest in
Terminos Lagoon, Mexico. Estuarine, Coastal and Shelf Science, 40, 139-160.
Myers, R. A. and Worm, B. (2003), Rapid World wide Depletion of predatory Fish
communities Nature 423:280-283.
Muthiah, P. S. (2005), Effects of temperature and pH on larval growth, survival and
development of the sea cucumber Holothurians spinifera Theel. Elsevier, Aquaculture
250: 823 – 829.
Navarrete, S. A. and Menge, B. A. (1996), Key stone predation and interaction
strength: Interactive effects of predators on their main prey. Ecological Monographs
66:409-429.
Nicholson, C. (2009), "Mangroves and Crabs as Ecosystem Engineers in Zanzibar”.
ISP Collection. Paper 760.http://digitalcollections.sit.edu/isp_collection/760.
Nordhaus, I., Hadipudjana, F. A., Janssen, R. and Pamungkas, J. (2009), Spatio-
temporal variation of macrobenthic communities in the mangrove-fringed Segara
Anakan lagoon, Indonesia, affected by anthropogenic activities. Reg Environ Change
9:291-313.
90
Nwankwo, D. I. (1998), Seasonal changes in phytoplankton composition and diversity
in Epe lagoon, Nigeria. Acta Hydrobiol. 40 (2): 83 – 92.
Nyandwi, N. and Dubi, A. (2001), Episodic atmospheric changes and their impact on
the hydrograph of coastal waters in Tanzania. Climate Research. 18: 157 – 162.
Odiete, W. O. (1999), Environmental physiology of animals and pollution. Diversified
Resources, Lagos,Nigeria, pp: 220-246.
Odum, W. E. and Malvor, C. C. (1990), Mangrove. In Myers, R L &J J Ewel,
eds.Ecosystem of Florida.517-548.University of Central Florida Press.Orlando,FL.
Ogbogu, S. S. (2001), Assessment of water quality and macroinvertebrates abundance
in Opa- stream Reservoir system, Ile-Ife. Glob. J. Pure Appl. Sci., 17(3): 517-521.
Osuji, L. C., Adesiyan, S. O. and Obute, G. C. (2004), Post impact assessment of oil
Pollution in Agbada west plain of Niger Delta, Nigeria: Field reconnaissance and total
extractable hydrocarbon content. Chem. Biodivers., 1, 1569-1577.
Othman, W. J. (2005), Social-Ecological resilience of Pete and Maruhubi mangrove
ecosystems in Zanzibar, Tanzania. Msc thesis. Norwegian University of Life
Sciences, Oslo, Norway.
Partin, S. (2004), Crude oil spills Environmental impact of In:Culter J.Cleverland (ed)
Encyclopodea of energy Elservier, New York pp737-748.

91
Pearson, T. H. & Rosenberg, R. (2003), Macrobenthic succession in relation to organic
enrichment and pollution of the marine environment. Oceanography and Marine
Biology: an Annual Review 16(1): 229-311.
Pezeshki, S. R., Hester, M., Lin, Q. and Nyaman, J. A. (2000), “The effect of oil spills
and cleanup US Gulf Coast marsh macrophytes: a review” Environmental Pollution
108 (2000):128-139.
Power, M. E., Tilman, D., Esters, J. A., Menge, B. A., Bond, W. J., Mills, I. S., Daily,
G., Gastilla, J. C., Lubchenco, J., Paine, R. T. (1996), Challenge in the quest for Key
stones. Bioscience 46:609-620.
Proffitt, C. E. and Devlin, D. J. (1998), Are there cumulative effects in red mangroves
from oil Spills during seedling and sapling stages.Ecological Applications 8(1): 121-
127.
Powell, C. B. (1990), Ecological effects of human activities on the value and resources
of Nigerian wetlands. In: Nigerian Wetlands (Akpata,T.V.I.and Okali, D. U. U eds).
The Nigerian Man and Biosphere National Committee and UNESCO: 120-129.
Ragothaman, G. and Patil, T. (1995), Studies on the physico- chemical parameters and
phytoplankton of Narmada estuary. Enviromedia, 14(2): 221-226.
RGOZ (2009), Comprehensive multiyear plan Zanzibar, 2010-2014.
{http/www.who.Int/entity/immunization _financing /countries/ cmyp/Zanzibar}.
92
Richardson, C. (2010), Preliminary Report on Flamingo Beach Mangrove
Survey.Duke University. Durham: Duke University Wet land Center. River Monory,V.
H., Day, J. W.,Twilley, R. R.,Vera.-.Herrera, F.,&Coronado.
Richmond, M. D. (1998), Aguide to seashores of Eastern Africa and the Western
Indian Ocean Island. Sida, Department for Research Cooperation,SAREC.
Robertson, A. I. and Duke, N. C. (1990), Mangrove fish communities in Tropical
Queesland, Australian spatial and temporary pattern in densities, biomass and
community structure. Marine Biology 104,369-379.
Robertson, A. I. (1991), Plant-animal interactions and the structure and function of
mangrove forest ecosystem. Australian Journal of Ecology.Vol. 16: 433-443.
Robertson, A. I. (1996), Sandy beaches and Intertidal flat. In Marine Biology
(Hammond, L. S and Synnot, R.N, eds) Long man Chesire,Melbourne, pp.297-314.
Suchanek, T. H. (1993), Oil impacts on Marine invertebrate population &
Comminities. American Zologist, 33 (6): 510-523.
Saad, M. A. (1998), Seasonal variations of some physico – chemical conditions of
Shatt – al – Arab estuary, Iran. Estuar. Coast. Mar. Sci. 6: 503-513.
Sanders, H. L. (1978), Florida oil impact on the Buzzards Bay benthic fauna: West
Falmouth.

93
Schrijvers, J., Van-Gansheke, D. and Vincx, M. (1995), Mangrove benthic infauna of
mangrove and surrounding beaches at Gazi Bay, Kenya. Hydrobiologia 306: 55–66.
Schwinghamer, P., Gordon, D. J., Roweil, T. W., Prena, J., Mc-Keown, D. L.,
Sonnichsen, G. and Guignes, J. Y. (1998), Effects of experimental otter trawling on
surficial sedirnent properties of a sany-bottom ecosystem on the Grand Banks of
Newfoundland. Conserv Biol 12: 1215 - 1222.
Selvam, V., Azariah, J. and Azariah, H. (1992), Diurnal variation in physical –
chemical properties and primary production in the interconnected marine, mangrove
and freshwater biotopes of Kakinada coast, Andhra Pradesh, India. Hydrobiologia,
247: 181-186.
Semesi, A. K. (1991), Management Plan for the Mangrove Ecosystem of Mainland
Tanzania. Vols.1–10. Ministry of Tourism, Natural Resources and Environment, Forest
and Bee-keepingDivision, Dar es Salaam.
Semesi, A. K. (1992), Developing management plans for the mangrove forest reserves
of mainland Tanzania. Hydrobiologia 247:1–10.
Semesi, A. K. (1998), “Mangrove management and utilization in Eastern Africa”. In
Dahdouh, Kairo, Bosire, Koedam (eds.), Restoration and management of mangrove
system,Vol. 27 SA 620-626.
94
Semesi, A. K., Mgaya, Y. D., Muruke, M. H., Francis, J., Mtolera, M. & Msumi, G.
(1998), Coastal resources utilization and conservation issues in Bagamoyo,
Tanzania.Ambio 27(8): 635– 644.
Semesi, A. K., Muruke, M. H. and Mgaya, Y. D. (1999), Mangrove of Ruvu River and
Kaole, Bagamoyo District. In: Howell K. M. and Semesi A .K, (eds).Coastal
Resources of Bagamoyo District, Tanzania. Proceedings of a work shop on coastal
resources of Bagamoyo. 18-19 December, 1997. Faculty of Science, University of Dar
es Salaam.
Semesi, A. K. (2001), “Mangrove in Tanzania” .Department of Botany,University of
Dar es Salaam,Tanzania.In second WIOMSA scientific Symposium.22-26 October,
2001 Dar es Salaam.Abstruct 71 pp.
Shunula, J. P. (2001), “A survey of the distribution and status of Mangrove forests in
Zanzibar, Tanzania” in Jiddawi N. S AND Akili J. M (eds). A Priliminary Study of
Flora and Fauna of Jonzani – Pete mangrove Greek, 6 COLE, 1- 1V, 34.
Smith, T. J. (1987), Seed predation in relation to tree dominance and distribution in
mangrove forests. Ecology 68: 266-273.
Smith, T. J., Bato, K. G., Frusher, S. D. & Giddins, R. L. (1991), Key stone species
and mangrove forest dynamics: the influence of Burrowing by crabs on soil nutrients
status and forest Productivity. Estuarine,Coastal and Shelf Science 33,19-32.
95
Snedaker, S. C., Jimenez, J. A. and Brown, M. S. (1981), Anomalous areal root in
Avicenia germinans (L) L. in Florida and coast Rica . Bull. Mar. Sci, 31: 467-470.
Solarin, B. B. (1998), Hydrobiology, fishes and fisheries of the Lagos Lagoon, Nigeria.
Ph.D Thesis, University of Lagos. 256pp.
Soud, M. M. (2004), Investigation on species diversity and the extent of deforestation
in Chake chake bay mangrove ecosystem, Pemba. Master Thesis University of Dar es
Salaam.Dar es Salam University Press.
Steele, D. H. and Steele, V. J. (1991), Effect of salinity on the survival, growth rate,
and reproductive out put Gammarus lawrencianus (crustacean, amphipoda) Mar.Ecol.
prog. Ser.78:49-56.
Stuart, S. N., Adams, R. J. and Jenkins, M. D. (1990), Biodiversity in Sub-Saharan
Africa and its Islands: Conservation, Management and Sustainable Use. Occasional
Papers of the IUCN Species Survival Commission No.6. IUCN, Gland, Switzerland.
ISBN: 2831700213.
Surugiu, V. (2005), The use of polychaetes as indicators of eutrophication and organic
enrichment of coastal waters:a study case - Romanian Black Sea Coast. Analele
ªtiinþifice ale Universitãþii “Al.I. Cuza” Iaºi, Biologie animalã 51: 55-62.
Taylor, M., Ravilious, C. and Green, P. E. (2003), “A joint Report for UNEP and
WCMC”. Mangroves of East Africa. [http//.unep-wcwc. Org].

96
United Republic of Tanzania (2002), Population and housing census; General report
National bureau of J. Fish. Res. Board Can. 35:717-730statistics, President Office, Dar
es Salaam.
Vannucci, M. (2002), Indo west Pacific mangroves. In mangrove ecosystem (Lacerda
l. Ded) pp.123. Springer verlag, Barlin.
Vijayalakshmi, R. N., Govindan, K., Ramaiah, N. and Gajabhiye, S. N. (1993), Fishery
potential of the Gulf of Kachchh. J. Indian. Fish. Ass. 23: 91-103.
Vilardy, S. and Polania, J. (2002), Mollusc fauna of the mangrove root – Fouling
community at the Colombian Archipelago of San Andres and Old Providence. Wetland
Ecol., Manage. 10: 273-282.
Viles, H. (2005), Coastal problem: Geomorphology, Ecology, & Society at the Coast.
Landon: Edward Arnold, pp 187-190.
Vohra, F. C. (1971), Zonation on tropical sandy shore. J. Anim. Ecol. 40: 679-709.
Watts, S. A., Scheibling, R. E., Marsh, A. G. and McClintcock, J. B. (1982), Effect of
Temperature and salinity on larval development of sibling species of Echinaster
(Echinodermata: Asteroidea) and their hybrids. Biol. Bull. 163: 348-354.
Wells, S., Ravilous, C. and Corcoran, E. (2006), In the Front Line: Shoreline
Protection and other Ecosystem Services from Mangroves and Coral Reefs. United
97
Nations Environment Programme World Conservation Monitoring Centre, Cambridge,
UK, 33 pp.
Zikoki, F. D. and Zabbey, N. (2006), Environmental gradients and benthic community
of the middle reaches of Imo River, South –Eastern Nigeria. Environ. Ecol., 24(1):32-
36.
Zingda, M. D., Abidi, S. A., Sarma, P. and Rokade, M. A. (1987), Base water quality
off thal in contribution in marine sciences – Dr. S.Z. Quasim Sixtieth Birthday
Felicitation Volume, pp. 307-318.
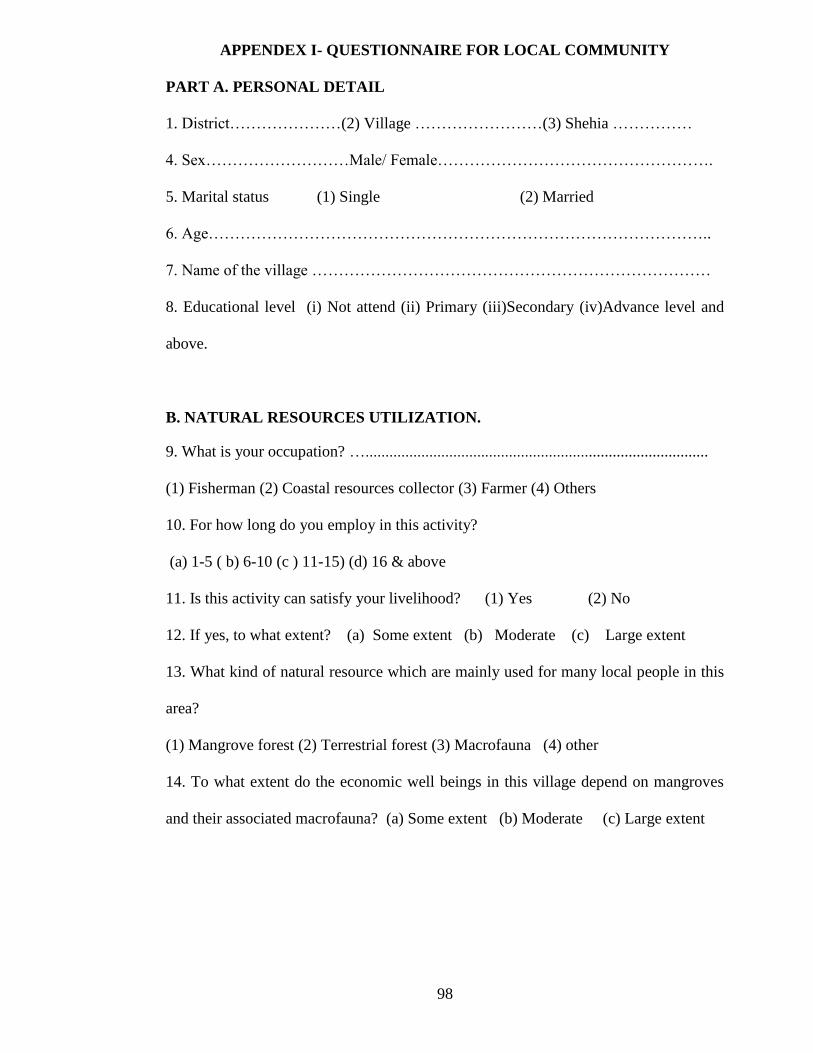
98
APPENDEX I- QUESTIONNAIRE FOR LOCAL COMMUNITY
PART A. PERSONAL DETAIL
1. District…………………(2) Village ……………………(3) Shehia ……………
4. Sex………………………Male/ Female…………………………………………….
5. Marital status (1) Single (2) Married
6. Age…………………………………………………………………………………..
7. Name of the village …………………………………………………………………
8. Educational level (i) Not attend (ii) Primary (iii)Secondary (iv)Advance level and
above.
B. NATURAL RESOURCES UTILIZATION.
9. What is your occupation? …......................................................................................
(1) Fisherman (2) Coastal resources collector (3) Farmer (4) Others
10. For how long do you employ in this activity?
(a) 1-5 ( b) 6-10 (c ) 11-15) (d) 16 & above
11. Is this activity can satisfy your livelihood? (1) Yes (2) No
12. If yes, to what extent? (a) Some extent (b) Moderate (c) Large extent
13. What kind of natural resource which are mainly used for many local people in this
area?
(1) Mangrove forest (2) Terrestrial forest (3) Macrofauna (4) other
14. To what extent do the economic well beings in this village depend on mangroves
and their associated macrofauna? (a) Some extent (b) Moderate (c) Large extent
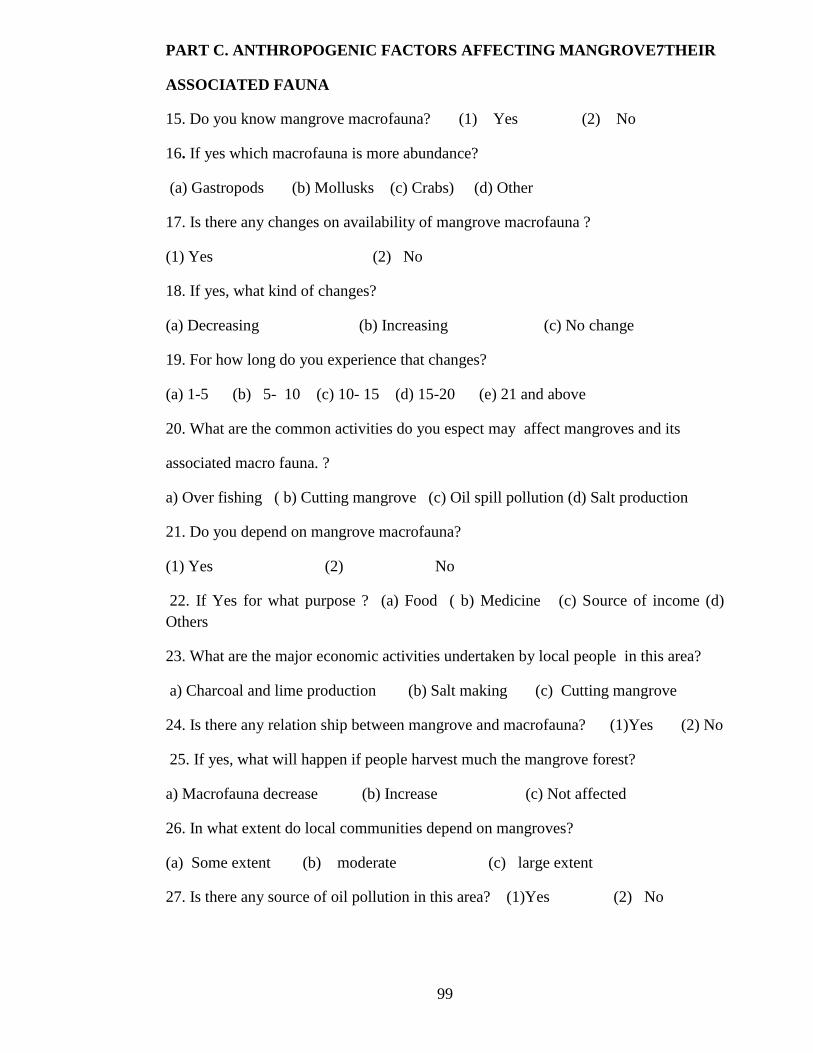
99
PART C. ANTHROPOGENIC FACTORS AFFECTING MANGROVE7THEIR
ASSOCIATED FAUNA
15. Do you know mangrove macrofauna? (1) Yes (2) No
16. If yes which macrofauna is more abundance?
(a) Gastropods (b) Mollusks (c) Crabs) (d) Other
17. Is there any changes on availability of mangrove macrofauna ?
(1) Yes (2) No
18. If yes, what kind of changes?
(a) Decreasing (b) Increasing (c) No change
19. For how long do you experience that changes?
(a) 1-5 (b) 5- 10 (c) 10- 15 (d) 15-20 (e) 21 and above
20. What are the common activities do you espect may affect mangroves and its
associated macro fauna. ?
a) Over fishing ( b) Cutting mangrove (c) Oil spill pollution (d) Salt production
21. Do you depend on mangrove macrofauna?
(1) Yes (2) No
22. If Yes for what purpose ? (a) Food ( b) Medicine (c) Source of income (d)
Others
23. What are the major economic activities undertaken by local people in this area?
a) Charcoal and lime production (b) Salt making (c) Cutting mangrove
24. Is there any relation ship between mangrove and macrofauna? (1)Yes (2) No
25. If yes, what will happen if people harvest much the mangrove forest?
a) Macrofauna decrease (b) Increase (c) Not affected
26. In what extent do local communities depend on mangroves?
(a) Some extent (b) moderate (c) large extent
27. Is there any source of oil pollution in this area? (1)Yes (2) No

100
28. If yes, list them ( a)………………(b)……………..(c)……………(d)…
29. Do you aspect that oil spills can affect mangrove and their associated fauna?
(1) Yes (2) No

101
APPENDEX 11-CHEK LIST FOR GOVERNMENT OFFICERS
1) What do you understand by mangrove macrofauna?
2) What is their main habitat?
3) Is there any economic importance of mangrove macrofauna?
4) Is there any relation ship between mangrove and macrofauna?
5) There is any change in availability of macrofauna within six years ago?
6) For your experience, what are common activities conducted by local people in this
area?
7) Which one of the above may affect mangrove ecosystem at all?
8) What factors that may influence local community to involved in utilization of
coastal resources in non sustainable manner.
9) How over-harvesting of coastal resources may affect the distribution of
macrofauna?
10) What do you aspect, if these activities are proceeds for next ten years?
11) Is there any NGO’S dealing with environmental conservation in area?
12) What measures to be taken so as to reduce these anthropogenic activities that could
affect the mangroves as well as to their associated macrofauna.?
Thank you for your contribution