Certification Reports, Results of U.S. E.P.A. Standard Evaluations
52
Manual No: 577013-872 ● Revision: A FX1V AND FX2V - Leak Detectors Certification Reports Results of U.S. E.P.A. Standard Evaluations
Transcript of Certification Reports, Results of U.S. E.P.A. Standard Evaluations
Manual No: 577013-872 ● Revision: A
FX1V AND FX2V - Leak Detectors
Certification Reports
Results of U.S. E.P.A. Standard Evaluations

© Veeder-Root 2006. All rights reserved.

Evaluation of the Veeder-Root Fx1V and Fx2V Leak Detectors Installed
in the Big Flow or Packer/Manifold on Rigid and Flexible Pipelines
Final Report
PREPARED FOR
Veeder-Root 125 Powder Forest Drive
Post Office Box 2003 Simsbury, Connecticut 06070-2003
November 21, 2005

iii
Preface
This report was prepared for Veeder-Root by Ken Wilcox Associates, Inc. This report presents the results of an independent performance evaluation of the Big Flow leak detector using a Red Jacket Fx2V mechanical leak detector as the pilot valve. Testing was conducted with gasoline on both rigid and flexible pipelines. The results in this report can be applied to the Veeder-Root Fx1V and Fx2V.
The purpose of the current testing was to demonstrate that the Big Flow system
performs adequately when tested on larger piping including both rigid, flexible, and a combination of both types of pipelines. Testing for this evaluation was performed in accordance with the federal EPA "Standard Test Procedures for Evaluating Leak Detection Methods: "Pipeline Leak Detection Systems", EPA/530/UST-90/010, September, 1990.”
The work was conducted at the Fuels Management Research Center which is operated by Ken Wilcox Associates, Inc. This report was prepared by Dr. Ken Wilcox and the laboratory testing conducted by Craig Wilcox. Questions regarding this evaluation should be directed to Mr. Alex Abri, Veeder-Root, at (800) 323-1799 KEN WILCOX ASSOCIATES, INC.
H. Kendall Wilcox, Ph.D. President November 21, 2005
iii
Table of Contents
Title Page No. Preface ii 1.0 Introduction 1 2.0 Overview of Evaluation Procedures 3 3.0 Description of the Testing Location 5 4.0 Test Results and Discussion 6 5.0 Conclusions 7 Appendix A – EPA Forms for the Evaluation of the Veeder-Root Fx1V and Fx2V Leak Detectors Installed in the Big Flow or Packer/Manifold on Rigid Pipelines Appendix B – EPA Forms for the Evaluation of the Veeder-Root Fx1V and Fx2V Leak Detectors Installed in the Big Flow or Packer/Manifold on Flexible Pipelines

Veeder-Root Fx2V in Big Flow or Packer/Manifold
Page 1 of 7
1.0 Introduction The federal Environmental Protection Agency (EPA) has provided a series of documents
that describe the procedures which are to be used to verify that leak detection equipment meets the performance requirements of the Federal Register.1 At the minimum, a leak detector that is capable of detecting leaks of 3.0 gallons per hour (gal/hr) or larger on an hourly basis must be installed on all pressurized piping. The probability of detecting a leak of stated size must be 95% or greater with a probability of a false alarm (declaring a tight line to be leaking) of no more than 5%. This report presents the results of an evaluation of the performance of the Veeder-Root Big Flow Pipeline Leak Detection System using an FX2V mechanical leak detector as the pilot valve. Two types of pipe line configurations were used during this evaluation: testing on rigid pipe only; and testing on flexline only. Complete sets of 53 tests were conducted for each pipeline configuration, thus meeting all of the requirements for a full EPA evaluation according to the standard EPA procedures for pipeline leak detectors.2
1 CFR 280.4 2 Standard Test Procedures for Evaluating Leak Detection Methods: Pressurized Pipeline Leak Detection Systems, EPA/530 UST-90/010, September 1990.
Veeder-Root Fx2V in Big Flow or Packer/Manifold
Page 2 of 7
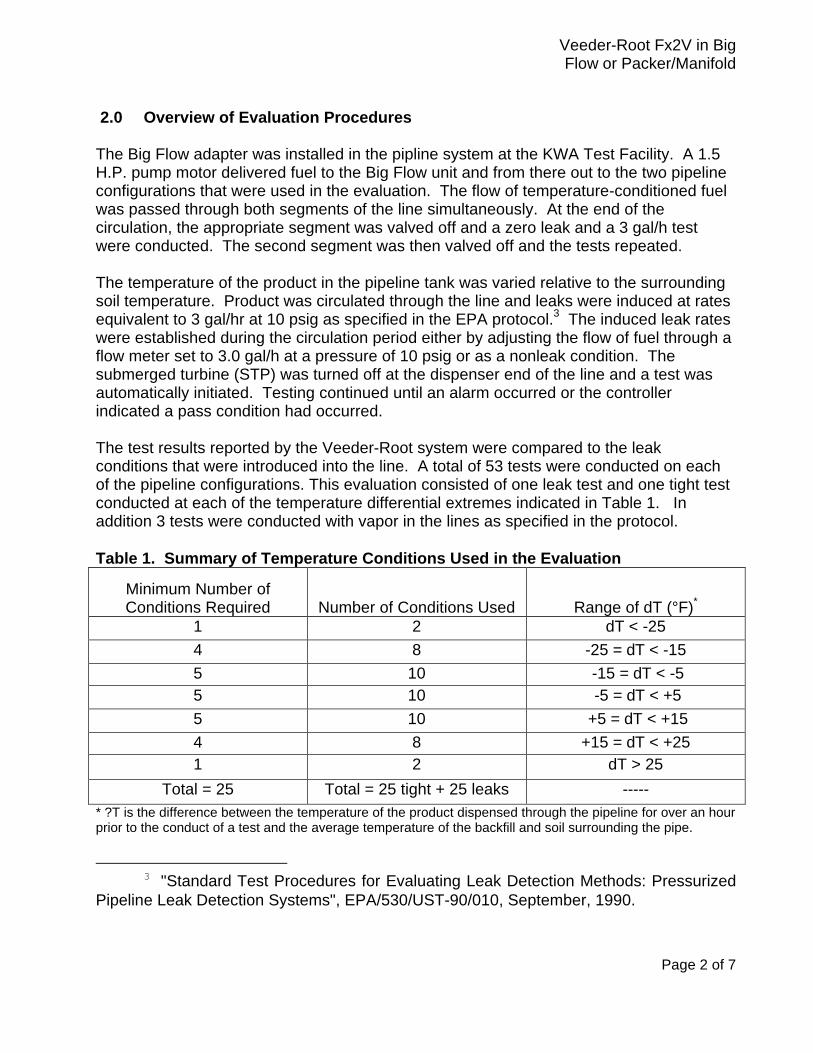
2.0 Overview of Evaluation Procedures The Big Flow adapter was installed in the pipline system at the KWA Test Facility. A 1.5 H.P. pump motor delivered fuel to the Big Flow unit and from there out to the two pipeline configurations that were used in the evaluation. The flow of temperature-conditioned fuel was passed through both segments of the line simultaneously. At the end of the circulation, the appropriate segment was valved off and a zero leak and a 3 gal/h test were conducted. The second segment was then valved off and the tests repeated. The temperature of the product in the pipeline tank was varied relative to the surrounding soil temperature. Product was circulated through the line and leaks were induced at rates equivalent to 3 gal/hr at 10 psig as specified in the EPA protocol.3 The induced leak rates were established during the circulation period either by adjusting the flow of fuel through a flow meter set to 3.0 gal/h at a pressure of 10 psig or as a nonleak condition. The submerged turbine (STP) was turned off at the dispenser end of the line and a test was automatically initiated. Testing continued until an alarm occurred or the controller indicated a pass condition had occurred. The test results reported by the Veeder-Root system were compared to the leak conditions that were introduced into the line. A total of 53 tests were conducted on each of the pipeline configurations. This evaluation consisted of one leak test and one tight test conducted at each of the temperature differential extremes indicated in Table 1. In addition 3 tests were conducted with vapor in the lines as specified in the protocol. Table 1. Summary of Temperature Conditions Used in the Evaluation
Minimum Number of Conditions Required Number of Conditions Used Range of dT (°F)*
1 2 dT < -25 4 8 -25 = dT < -15 5 10 -15 = dT < -5 5 10 -5 = dT < +5 5 10 +5 = dT < +15 4 8 +15 = dT < +25 1 2 dT > 25
Total = 25 Total = 25 tight + 25 leaks ----- * ?T is the difference between the temperature of the product dispensed through the pipeline for over an hour prior to the conduct of a test and the average temperature of the backfill and soil surrounding the pipe.
3 "Standard Test Procedures for Evaluating Leak Detection Methods: Pressurized
Pipeline Leak Detection Systems", EPA/530/UST-90/010, September, 1990.

Veeder-Root Fx2V in Big Flow or Packer/Manifold
Page 3 of 7
Briefly summarized, the test procedures were as follows: 1. Product was conditioned in the pipeline tank to the required temperature. The soil
temperature was monitored at distances of 2, 4, and 12 inches from the pipeline to determine proper temperature differentials.
2. Product was circulated through the both legs of the pipeline (rigid and flexible) at a
combined rate of approximately 30 gal/min for one hour. 3. After valving off the segments of interest, a leak was induced in the line equivalent to
3.0 gal/hr at 10 psig. 4. The submerged pump dispenser switch was shut off and the pressure was reduced to
zero. 5. The pump was authorized and the test was automatically conducted by the MLD. 6. This process was repeated for both rigid and flexible pipeline configurations at the end
of each circulation. 7. This process was repeated for each of the temperature differentials shown in Table 1. Since the test times were less than 15 minutes, the protocol allows for conducting 3 tests for each circulation. In this case the test times were less than one minute so that 3 tests could be conducted on each line for each circulation. The entire process of conducting the six tests was usually less than 10 minutes.

Veeder-Root Fx2V in Big Flow or Packer/Manifold
Page 4 of 7
3.0 Description of the Testing Location The Veeder-Root system was evaluated at the Fuels Management Research Center located in Grain Valley, Missouri, which is operated by Ken Wilcox Associates, Inc. Two different pipeline configurations were tested during the evaluation. A summary of the two configurations is provided in Table 2. Table 2. Description of Pipelines Used in This Evaluation
* The National Workgroup does not allow volume of rigid line to be included in flex line volume for purposes of calculating maximum line size.
The flex line tests were conducted on a 3-inch diameter by 130 ft. long flexible line containing unleaded gasoline. There was also a 30-foot long section of rigid line that is 3.125 inches in diameter coming from the STP to the beginning of the flexline. Although the total volume of the line was 59.7 gallons, the National Workgroup on Leak Detection Evaluations (NWGLDE) allows only the inclusion of the volume of the flexible line in the calculations for maximum line volume for the flex line. The line size has accordingly been limited to just the volume of the flex line, which is 47.7 gallons. The bulk modulus, which is a measure of the "stretch" which occurs when the line is pressurized, was 8,360 psi. The rigid tests were conducted on a 4-inch diameter by 200 ft. long FRP segment also containing gasoline. An additional 3.125-inch diameter for 30 ft of FRP pipe connected to the STP at the beginning of the 4-inch diameter FRP pipe and an additional 150 ft of 3.125-inch diameter FRP pipe followed the 4-inch diameter pipe leading back to the storage tank. The total volume of the line was 208.4 gallons. The bulk modulus was 34,458 psi. The conditioned product was contained in a 600 gallon steel tank, which was equipped with a standard 1.5 H.P. Red Jacket submersible pump. Product was heated or cooled in the tank by circulating glycol and product through an external heat exchanger. RTD's were located at 2 inches, 4 inches and 12 inches from the line as specified by the EPA protocol. A single temperature probe was located 4 inches from the bottom of the product conditioning tank. The weighted soil temperature and the product tank temperature at the beginning of the test were used to compute the temperature differential.
Length of Each Pipe Segment (ft) Line Description 3.125” dia
FRP 4” dia FRP
3” dia Flex
Total Gal.
Bulk Modulus (psi)
Flex Line 30* 0 130 47.7* 8,360 Rigid Line 150 200 0 208.4 34,458

Veeder-Root Fx2V in Big Flow or Packer/Manifold
Page 5 of 7
4.0 Test Results and Discussion Testing for this evaluation was conducted using procedures specified in the EPA protocol. The results of the evaluation have been calculated using Section 7.4 of the EPA procedures for systems that do not report a leak rate. The results of the data analysis have been summarized in Table 3. Calculation of PFA and PD A total of 50 tests without vapor in the line were conducted for the Hourly Testing mode, which consisted of 25 leak tests and 25 tight tests. Three tests were conducted with vapor in the line, but the results of these tests were not included in the performance calculations. There were no missed detections or false alarms observed for any of the 50 tests. The PD of a 3.0 gal/hr leak was calculated to be 100% with a confidence interval from 100 to 86.7% and the PFA on tight line was calculated to be 0% with a confidence interval of zero to 13.3%. When a leak was present in the line, test times were all 1 minute or less. When a leak was not present in the line, test times were also all1 minute or less. Maximum Line Size The EPA allows for line leak detectors to be used on lines up to twice the size that they were evaluated on. During this testing, the Veeder-Root system was evaluated on a FRP line consisting of a total of 180 ft of 3.125 inch diameter FRP and 200 ft of 4 inch diameter FRP with a total volume of 208.4 gallons. It was also evaluated on a flexible line that was 130 feet in length by 3-inches in diameter plus 30-feet in length by 3.125-inches in diameter. While the total volume of the line as tested was 59.7 gallons, only the volume of the flex line by itself was included in the calculations for the maximum line size. If the EPA protocol limitations are applied to the Veeder-Root system, the results of this evaluation would apply to rigid lines with a total volume of up to 416.7 gallons and flexible pipelines having a maximum volume of 95.4 gallons. Waiting Times Waiting times after the delivery of product, after product is circulated through the line or after pumping has stopped are not necessary before valid tests can be conducted. All of the tests were conducted immediately after product circulation through the pipeline was stopped.

Veeder-Root Fx2V in Big Flow or Packer/Manifold
Page 6 of 7
Table 3. Performance Parameters for the Veeder-Root Pipeline Leak Detector for the Rigid and Flexible Pipeline Tests Using the EPA Protocol
Rigid Flex Parameter Value Value
Probability of False Alarm (PFA) 0% 0 % Of a 3.0 gal/hr leak (Hourly Confidence Interval for Probability 86.7% to 100% 86.7% to 100% of False Alarm (Hourly PFA) Probability of Detection (PD) 100% 100% of a 3.0 gal/hr leak (Hourly) Confidence Interval for Probability 0% to 13.3% 0% to 13.3% of False Alarm (Hourly PFA) Maximum Line Size 416.7 gal 95.4 gal Waiting Time After Delivery of None None Product Before Conducting a Test Waiting Time After Product Circulation None None Through Line Before Conducting a Test Hourly Test Times with 3.0 gal/hr Leak Range: 0 to 1 minutes Hourly Test Times without Leak Range: 0 to 1 minutes * Volume of flexible section of line only

Veeder-Root Fx2V in Big Flow or Packer/Manifold
Page 7 of 7
5.0 Conclusions The following conclusions are based on the data collected during this evaluation.
1. The Veeder-Root Fx1V and Fx2V Leak Detectors meet the US federal performance requirements for hourly monitoring when Installed in the Big Flow or Packer/Manifold on rigid and flexible Pipelines.
2. The maximum size lines that the system can be installed on are 416.7 gallons for rigid lines and 95.4 gallons for flexible lines.
3. No stabilization times are needed after dispensing of product through the line have been completed.

Appendix A.
EPA Forms for Evaluation of the Veeder-Root
Fx1V and Fx2V Leak Detectors Installed in the Big Flow or Packer/Manifold on
Rigid Pipelines

Results of the Performance Evaluation Conducted According to EPA Test Procedures Pipeline Leak Detection System Used as an Hourly Monitoring Test
This form summarizes the results of an evaluation to determine whether the pipeline leak detection system named below and described in Attachment 1 complies with federal regulations for conducting an hourly monitoring test. The evaluation was conducted according to the United States Environmental Protection Agency's (EPA's) evaluation procedure, specified in Standard Test Procedures for Evaluating Leak Detection Methods: Pipeline Leak Detection Systems. The full evaluation report includes seven attachments.
Tank system owners who use this pipeline leak detection system should keep this form on file to show compliance with the federal regulations. Tank system owners should check with state and local agencies to make sure this form satisfies the requirements of these agencies. System Evaluated
Name Veeder-Root Fx2V installed in the Big Flow or Packer/Manifold
Version number(s) Rigid Lines (applies to Fx1V also)
Vendor Veeder-Root (Name of Manufacturer)
125 Powder Forest Drive, P.O. Box 2003 (Address) Simsbury, CT 06070-7684 (800) 323-1799 (City) (State) (Zip Code) (Phone) Evaluation Results 1. The performance of this system
(X) meets or exceeds ( ) does not meet the federal standards established by the EPA regulation for hourly monitoring tests.
The EPA regulation for an hourly monitoring test requires that the system be capable of detecting a leak as small as 3 gal/h with a probability of detection (PD) of 95% and a probability of false alarm (PFA) of 5%.
2. The estimated PFA in this evaluation is 0 % with a confidence interval from 0 % to
13.3 % The estimated PD against a leak rate of 3 gal/h defined at a pipeline pressure of 10 psi in this
evaluation is 100 %. With a confidence interval from 86.7 % to 100 %.. Pipeline Leak Detection Systems - Results Forms Page 1 of 5
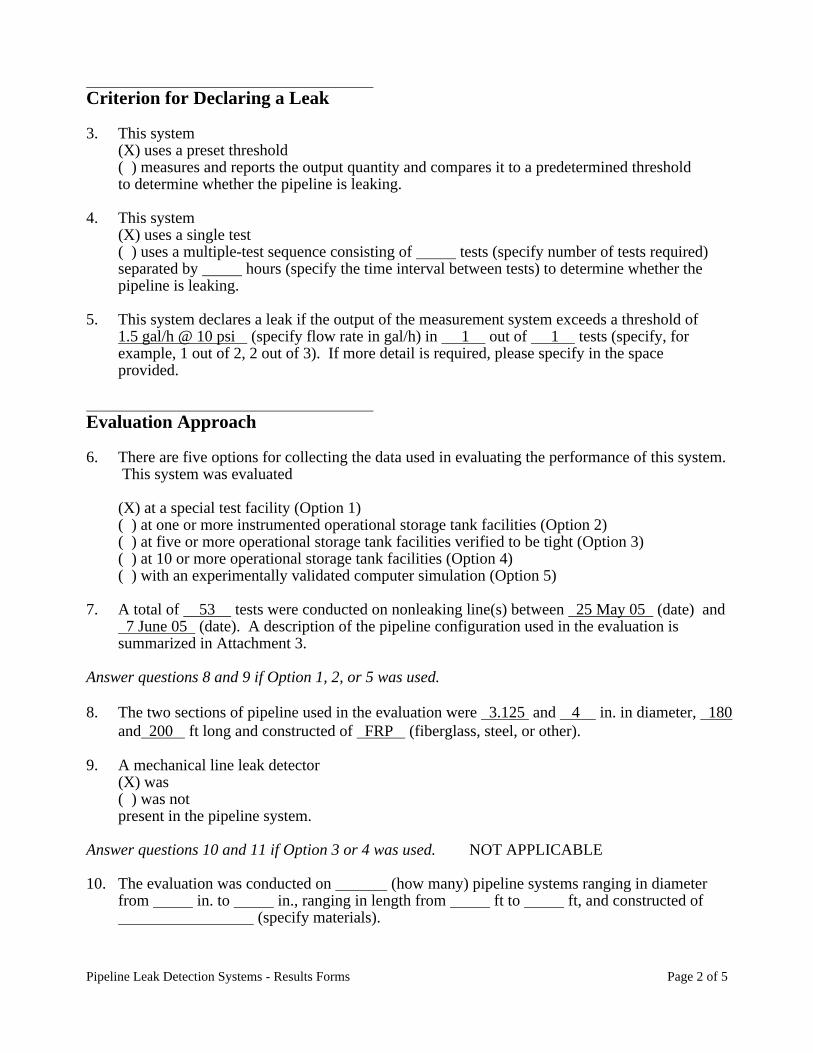
Criterion for Declaring a Leak 3. This system
(X) uses a preset threshold ( ) measures and reports the output quantity and compares it to a predetermined threshold to determine whether the pipeline is leaking.
4. This system
(X) uses a single test ( ) uses a multiple-test sequence consisting of tests (specify number of tests required)
separated by hours (specify the time interval between tests) to determine whether the pipeline is leaking. 5. This system declares a leak if the output of the measurement system exceeds a threshold of
1.5 gal/h @ 10 psi (specify flow rate in gal/h) in 1 out of 1 tests (specify, for example, 1 out of 2, 2 out of 3). If more detail is required, please specify in the space provided.
Evaluation Approach 6. There are five options for collecting the data used in evaluating the performance of this system.
This system was evaluated
(X) at a special test facility (Option 1) ( ) at one or more instrumented operational storage tank facilities (Option 2) ( ) at five or more operational storage tank facilities verified to be tight (Option 3) ( ) at 10 or more operational storage tank facilities (Option 4) ( ) with an experimentally validated computer simulation (Option 5)
7. A total of 53 tests were conducted on nonleaking line(s) between 25 May 05 (date) and
7 June 05 (date). A description of the pipeline configuration used in the evaluation is summarized in Attachment 3.
Answer questions 8 and 9 if Option 1, 2, or 5 was used. 8. The two sections of pipeline used in the evaluation were 3.125 and 4 in. in diameter, 180
and 200 ft long and constructed of FRP (fiberglass, steel, or other). 9. A mechanical line leak detector
(X) was ( ) was not present in the pipeline system.
Answer questions 10 and 11 if Option 3 or 4 was used. NOT APPLICABLE 10. The evaluation was conducted on (how many) pipeline systems ranging in diameter
from in. to in., ranging in length from ft to ft, and constructed of (specify materials).
Pipeline Leak Detection Systems - Results Forms Page 2 of 5
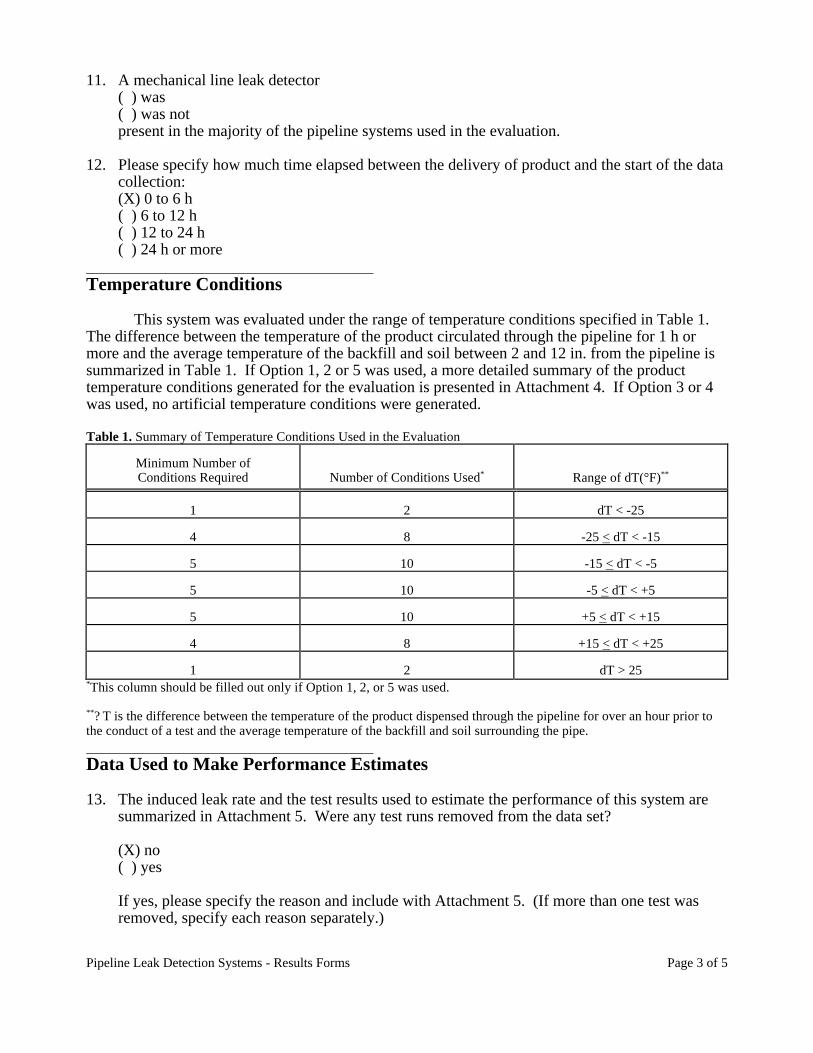
11. A mechanical line leak detector ( ) was ( ) was not present in the majority of the pipeline systems used in the evaluation.
12. Please specify how much time elapsed between the delivery of product and the start of the data
collection: (X) 0 to 6 h ( ) 6 to 12 h ( ) 12 to 24 h ( ) 24 h or more
Temperature Conditions
This system was evaluated under the range of temperature conditions specified in Table 1. The difference between the temperature of the product circulated through the pipeline for 1 h or more and the average temperature of the backfill and soil between 2 and 12 in. from the pipeline is summarized in Table 1. If Option 1, 2 or 5 was used, a more detailed summary of the product temperature conditions generated for the evaluation is presented in Attachment 4. If Option 3 or 4 was used, no artificial temperature conditions were generated. Table 1. Summary of Temperature Conditions Used in the Evaluation
Minimum Number of Conditions Required
Number of Conditions Used*
Range of dT(°F)**
1
2
dT < -25
4
8
-25 < dT < -15
5
10
-15 < dT < -5
5
10
-5 < dT < +5
5
10
+5 < dT < +15
4
8
+15 < dT < +25
1
2
dT > 25
*This column should be filled out only if Option 1, 2, or 5 was used. **? T is the difference between the temperature of the product dispensed through the pipeline for over an hour prior to the conduct of a test and the average temperature of the backfill and soil surrounding the pipe. Data Used to Make Performance Estimates 13. The induced leak rate and the test results used to estimate the performance of this system are
summarized in Attachment 5. Were any test runs removed from the data set?
(X) no ( ) yes
If yes, please specify the reason and include with Attachment 5. (If more than one test was removed, specify each reason separately.)
Pipeline Leak Detection Systems - Results Forms Page 3 of 5

Sensitivity to Trapped Vapor 14. (X) According to the vendor, this system can be used even if trapped vapor is present in the
pipeline during a test. ( ) According to the vendor, this system should not be used if trapped vapor is present in the pipeline.
15. The sensitivity of this system to trapped vapor is indicated by the test results summarized in
Table 2. These tests were conducted at 28 psi with 110 ml of vapor trapped in the line at a pressure of 0 psi. The data and test conditions are reported in Attachment 6.
Table 2. Summary of the Results of Trapped Vapor Tests (see Attachment 6 for additional tests)
Test No.
dT
(°F)
Induced Leak Rate
(gal/h @ 10 psi)
Measured Leak Rate
(gal/h)
51
-7.7
3
Leak detected
52
-7.7
0
Tight
53
-7.7
3
Leak detected
Performance Characteristics of the Instrumentation 16. State below the performance characteristics of the primary measurement system used to
collect the data. (Please specify the units, for example, gallons, inches.)
Quantity Measured: Temperature Volume Time (ms) Resolution: 0.01 deg F 1% 10 Precision: 0.03 deg F 2% 10 Accuracy: 0.10 deg F 4% 10 Minimum Detectable Quantity: 0.04 deg F 1% 10 Response Time: 2 min N/A 10 Threshold is exceeded when the flow rate due to a leak exceeds 1.5 gal/h. (@10 psi)
Application of the System 17. This leak detection system is intended to test pipeline systems that are associated with
underground storage tank facilities, that contain petroleum or other chemical products, that are typically constructed of fiberglass or steel, and that typically measure 2 or 3 in. in diameter and 350 ft or less in length. The performance estimates are valid when:
• the system that was evaluated has not been substantially changed by subsequent
modifications
• the manufacturer's instructions for using the system are followed
• the mechanical line leak detector (X) is present in ( ) has been removed from the pipeline (check both if appropriate)
Pipeline Leak Detection Systems - Results Forms Page 4 of 5

the waiting time between the last delivery of product to the underground storage tank and the start of data collection for the test is 0 h
• the waiting time between the last dispensing of product through the pipeline system and the start of data collection for the test is 0 h
• the total data collection time for the test is variable min (depends on line
characteristics)
• the volume of the product in the pipeline is less than twice the volume of the product in the pipeline system using in the evaluation, unless separate written justification for testing larger pipeline systems is presented by the manufacturer, concurred with by the evaluator, and attached to this evaluation as Attachment 8
• please give any other limitations specified by the vendor or determined during the
evaluation. Disclaimer: This test procedure only addresses the issue of the system's ability to detect leaks in pipelines. It does not test the equipment for safety hazards or assess the operational functionality, reliability or maintainability of the equipment. Attachments Attachment 1 - Description of the System Evaluated Attachment 2 - Summary of the Performance of the System Evaluated Attachment 3 - Summary of the Configuration of the Pipeline System(s) Used in the Evaluation Attachment 4 - Data Sheet Summarizing Product Temperature Conditions Used in the Evaluation Attachment 5 - Data Sheet Summarizing the Test Results and the Leak Rates Used in the Evaluation Attachment 6 - Data Sheet Summarizing the Test Results and the Trapped Vapor Tests Attachment 7 - Data Sheet Summarizing the Test Results Used to Check the Relationship Supplied
by the Manufacturer for Combining the Signal and Noise Certification of Results I certify that the pipeline leak detection system was operated according to the vendor's instructions. I also certify that the evaluation was performed according to the procedure specified by the EPA and that the results presented above are those obtained during the evaluation. H. Kendall Wilcox Ken Wilcox Associates, Inc. (name of person performing evaluation) (organization performing evaluation)
1125 Valley Ridge Drive (signature) (street address) November 21, 2005 Grain Valley, MO 64039 (date) (city, state, zip) (816) 443-2494 (telephone number) Pipeline Leak Detection Systems - Results Forms Page 5 of 5

Attachment 1
Description Pipeline Leak Detection System
This form provides supporting information on the operating principles of the leak detection system or on how the equipment works. This form is to be filled out by the evaluating organization with assistance from the manufacturer before the start of the evaluation.
Describe the important features of the system as indicated below. A detailed description is not required, nor is it necessary to reveal proprietary features of the system.
To minimize the time required to complete this form, the most frequently expected answers to the questions have been provided. For those answers that are dependent on site conditions, please give answers that apply in "typical" conditions. Please write in any additional information about the system that you believe is important.
Check all appropriate boxes for each question. Check more than one box per question if it applies. If 'Other' is checked, please complete the space provided to specify or briefly describe the matter. If necessary, use all the white space next to a question to complete a description.
System Name and Version: Veeder-Root Fx2V Installed in Big Flow or Packer/Manifold Date: November 21, 2005 Applicability of the System 1. With what products can this system be used? (Check all applicable responses.)
(X) gasoline (X) diesel (X) aviation fuel ( ) fuel oil #4 ( ) fuel oil #6 (X) solvent (Contact manufacturer for solvent applications) ( ) waste oil (X) other (specify) Contact manufacturer for other hydrocarbon applications.
2. What types of pipelines can be tested? (Check all applicable responses.)
(X) fiberglass (X) steel (X) other (specify) any rigid piping
3. Can this leak detection system be used to test double-wall pipeline systems?
(X) yes ( ) no
Description - Pipeline Leak Detection Systems Page 1 of 5

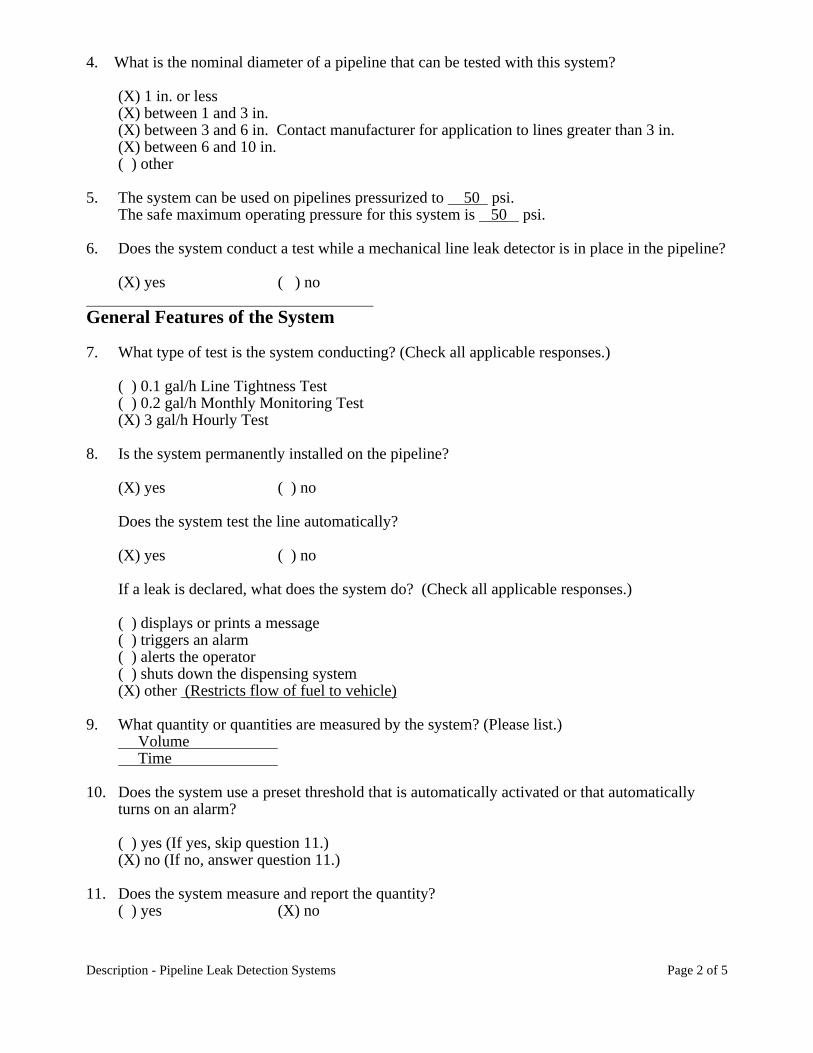
4. What is the nominal diameter of a pipeline that can be tested with this system?
(X) 1 in. or less (X) between 1 and 3 in. (X) between 3 and 6 in. Contact manufacturer for application to lines greater than 3 in. (X) between 6 and 10 in. ( ) other
5. The system can be used on pipelines pressurized to 50 psi.
The safe maximum operating pressure for this system is 50 psi. 6. Does the system conduct a test while a mechanical line leak detector is in place in the pipeline?
(X) yes ( ) no General Features of the System 7. What type of test is the system conducting? (Check all applicable responses.)
( ) 0.1 gal/h Line Tightness Test ( ) 0.2 gal/h Monthly Monitoring Test (X) 3 gal/h Hourly Test
8. Is the system permanently installed on the pipeline?
(X) yes ( ) no
Does the system test the line automatically? (X) yes ( ) no
If a leak is declared, what does the system do? (Check all applicable responses.)
( ) displays or prints a message ( ) triggers an alarm ( ) alerts the operator ( ) shuts down the dispensing system (X) other (Restricts flow of fuel to vehicle)
9. What quantity or quantities are measured by the system? (Please list.)
Volume Time
10. Does the system use a preset threshold that is automatically activated or that automatically
turns on an alarm?
( ) yes (If yes, skip question 11.) (X) no (If no, answer question 11.)
11. Does the system measure and report the quantity?
( ) yes (X) no Description - Pipeline Leak Detection Systems Page 2 of 5

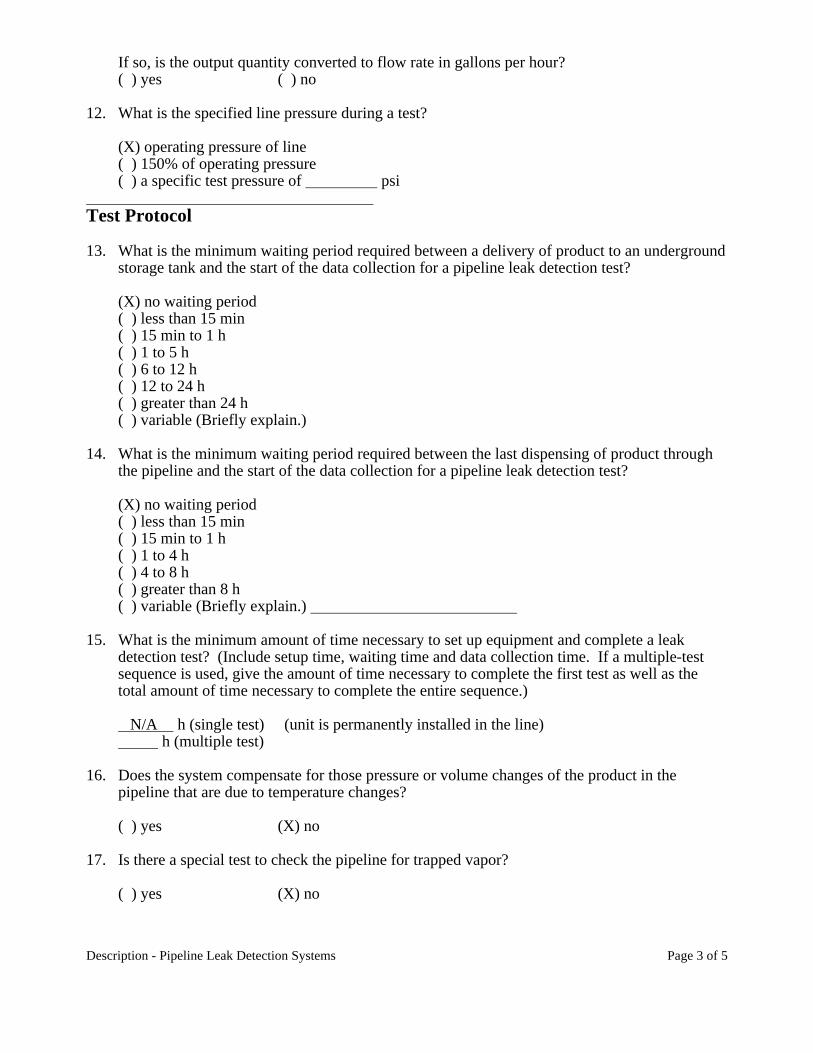
If so, is the output quantity converted to flow rate in gallons per hour? ( ) yes ( ) no
12. What is the specified line pressure during a test?
(X) operating pressure of line ( ) 150% of operating pressure ( ) a specific test pressure of psi
Test Protocol 13. What is the minimum waiting period required between a delivery of product to an underground
storage tank and the start of the data collection for a pipeline leak detection test?
(X) no waiting period ( ) less than 15 min ( ) 15 min to 1 h ( ) 1 to 5 h ( ) 6 to 12 h ( ) 12 to 24 h ( ) greater than 24 h ( ) variable (Briefly explain.)
14. What is the minimum waiting period required between the last dispensing of product through
the pipeline and the start of the data collection for a pipeline leak detection test?
(X) no waiting period ( ) less than 15 min ( ) 15 min to 1 h ( ) 1 to 4 h ( ) 4 to 8 h ( ) greater than 8 h ( ) variable (Briefly explain.)
15. What is the minimum amount of time necessary to set up equipment and complete a leak
detection test? (Include setup time, waiting time and data collection time. If a multiple-test sequence is used, give the amount of time necessary to complete the first test as well as the total amount of time necessary to complete the entire sequence.)
N/A h (single test) (unit is permanently installed in the line) h (multiple test)
16. Does the system compensate for those pressure or volume changes of the product in the
pipeline that are due to temperature changes?
( ) yes (X) no 17. Is there a special test to check the pipeline for trapped vapor?
( ) yes (X) no Description - Pipeline Leak Detection Systems Page 3 of 5

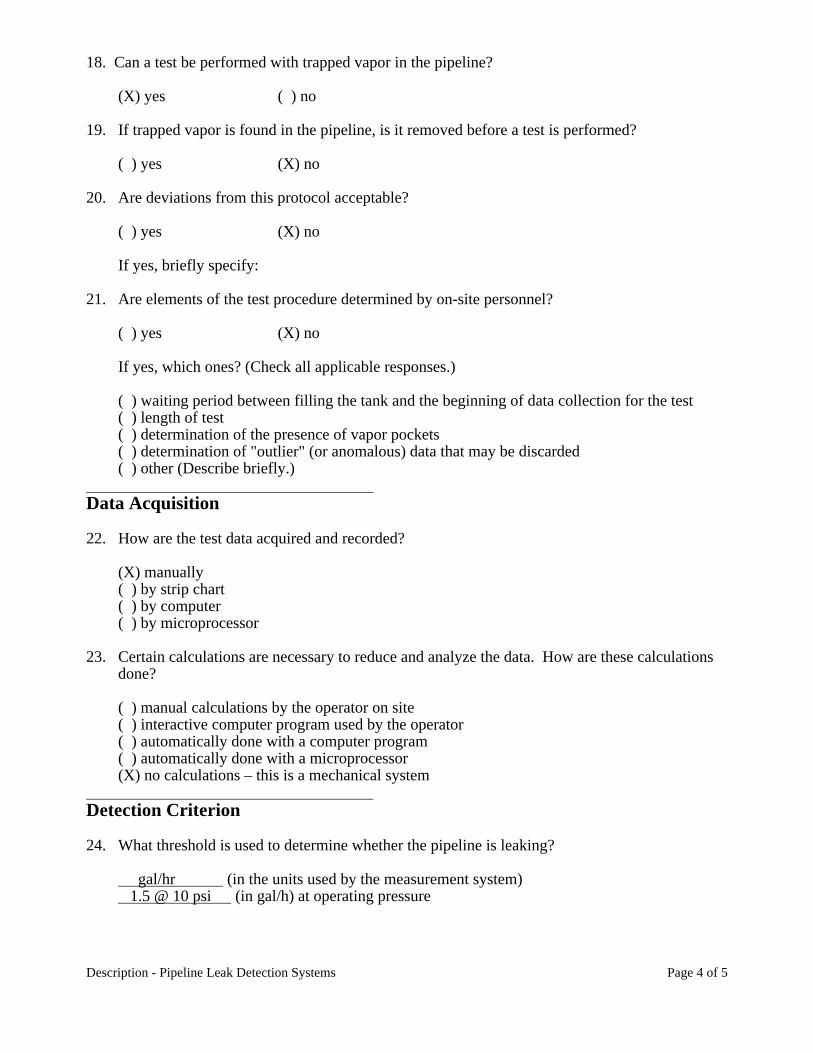
18. Can a test be performed with trapped vapor in the pipeline?
(X) yes* ( ) no 19. If trapped vapor is found in the pipeline, is it removed before a test is performed?
( ) yes (X) no 20. Are deviations from this protocol acceptable?
( ) yes (X) no
If yes, briefly specify: 21. Are elements of the test procedure determined by on-site personnel?
( ) yes (X) no
If yes, which ones? (Check all applicable responses.)
( ) waiting period between filling the tank and the beginning of data collection for the test ( ) length of test ( ) determination of the presence of vapor pockets ( ) determination of "outlier" (or anomalous) data that may be discarded ( ) other (Describe briefly.)
Data Acquisition 22. How are the test data acquired and recorded?
(X) manually ( ) by strip chart ( ) by computer ( ) by microprocessor
23. Certain calculations are necessary to reduce and analyze the data. How are these calculations
done?
( ) manual calculations by the operator on site ( ) interactive computer program used by the operator ( ) automatically done with a computer program ( ) automatically done with a microprocessor (X) no calculations – this is a mechanical system
Detection Criterion 24. What threshold is used to determine whether the pipeline is leaking?
gal/hr (in the units used by the measurement system) 1.5 @ 10 psi (in gal/h) at operating pressure
Description - Pipeline Leak Detection Systems Page 4 of 5
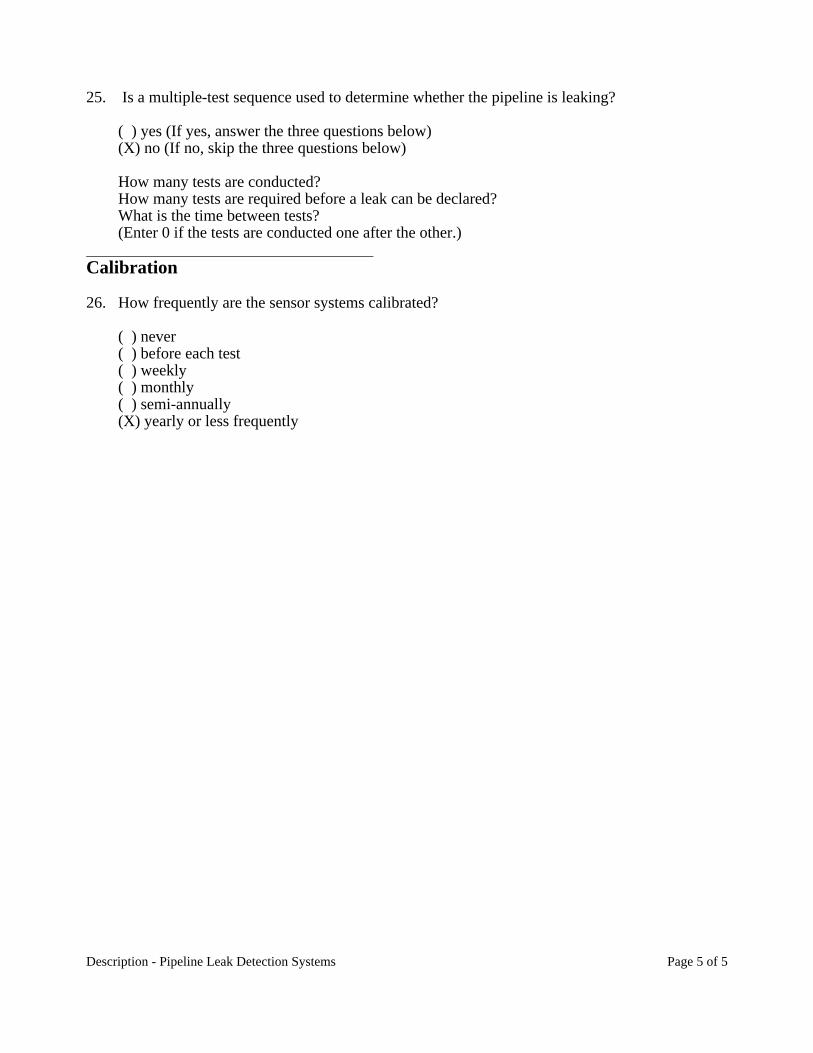
25. Is a multiple-test sequence used to determine whether the pipeline is leaking?
( ) yes (If yes, answer the three questions below) (X) no (If no, skip the three questions below)
How many tests are conducted? How many tests are required before a leak can be declared? What is the time between tests? (Enter 0 if the tests are conducted one after the other.)
Calibration 26. How frequently are the sensor systems calibrated?
( ) never ( ) before each test ( ) weekly ( ) monthly ( ) semi-annually (X) yearly or less frequently
Description - Pipeline Leak Detection Systems Page 5 of 5

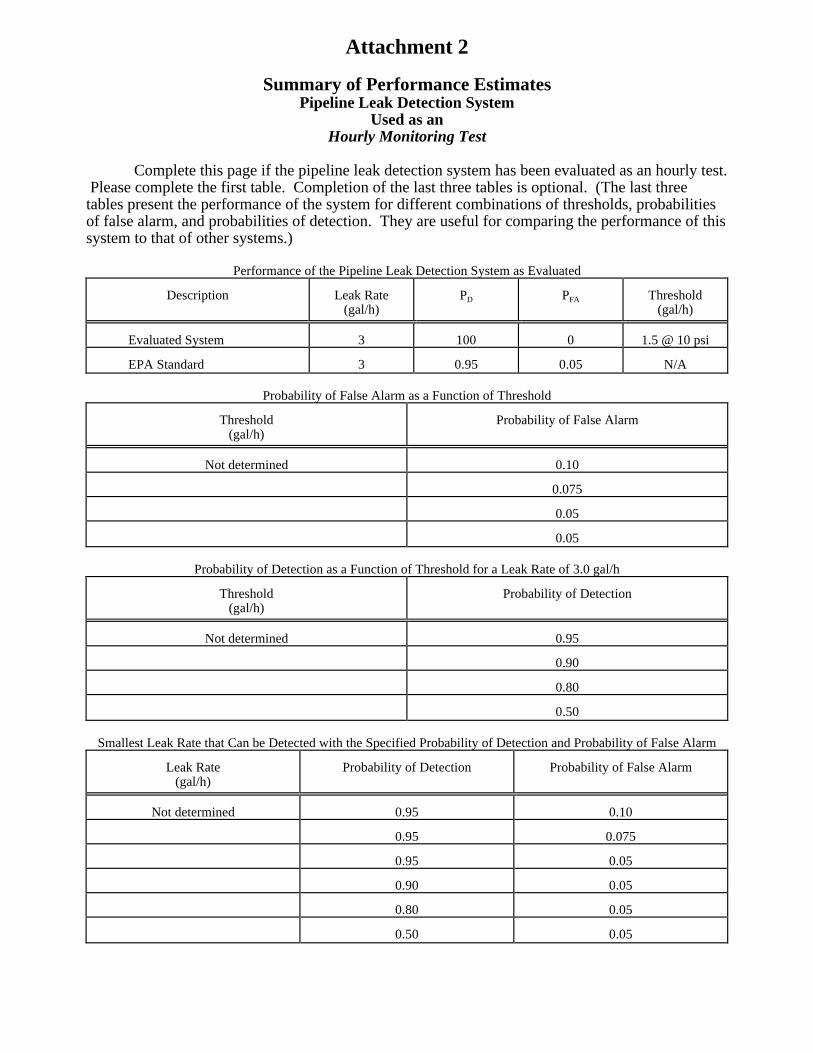
Attachment 2 Summary of Performance Estimates Pipeline Leak Detection System Used as an Hourly Monitoring Test
Complete this page if the pipeline leak detection system has been evaluated as an hourly test. Please complete the first table. Completion of the last three tables is optional. (The last three tables present the performance of the system for different combinations of thresholds, probabilities of false alarm, and probabilities of detection. They are useful for comparing the performance of this system to that of other systems.) Performance of the Pipeline Leak Detection System as Evaluated
Description
Leak Rate
(gal/h)
PD
PFA
Threshold
(gal/h) Evaluated System
3
100
0
1.5 @ 10 psi
EPA Standard
3
0.95
0.05
N/A
Probability of False Alarm as a Function of Threshold
Threshold
(gal/h)
Probability of False Alarm
Not determined
0.10
0.075
0.05
0.05
Probability of Detection as a Function of Threshold for a Leak Rate of 3.0 gal/h
Threshold
(gal/h)
Probability of Detection
Not determined
0.95
0.90
0.80
0.50
Smallest Leak Rate that Can be Detected with the Specified Probability of Detection and Probability of False Alarm
Leak Rate
(gal/h)
Probability of Detection
Probability of False Alarm
Not determined
0.95
0.10
0.95
0.075
0.95
0.05
0.90
0.05
0.80
0.05
0.50
0.05
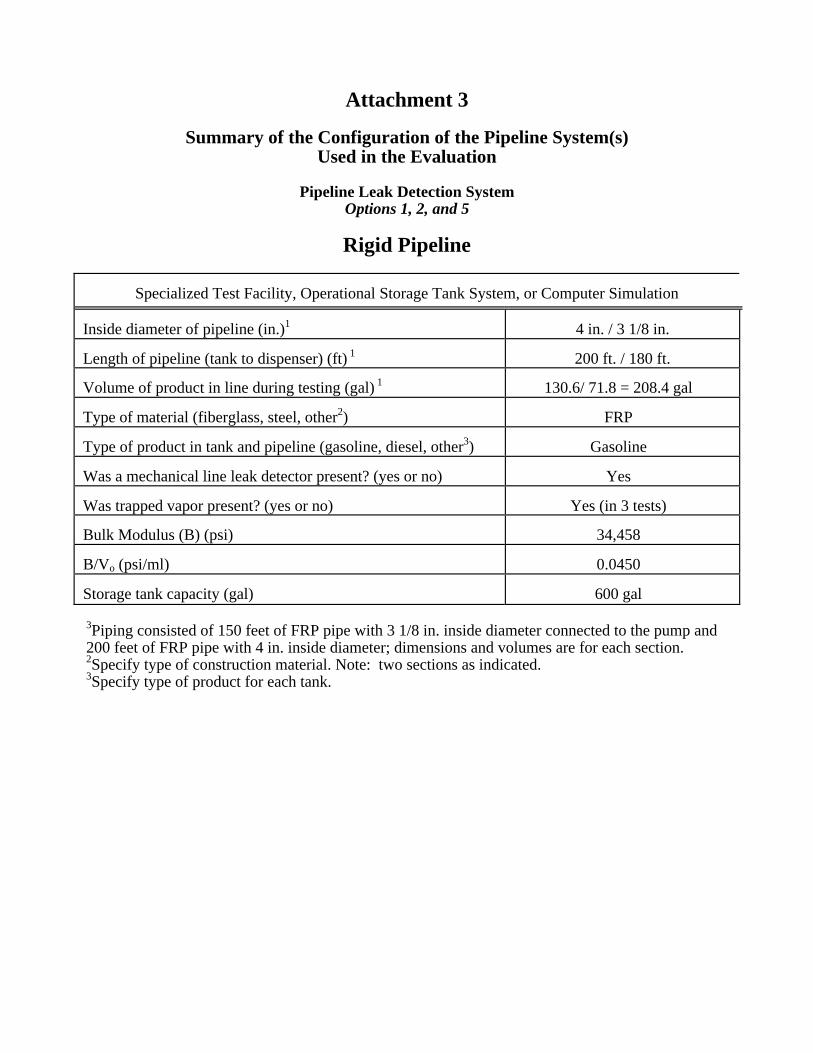
Attachment 3 Summary of the Configuration of the Pipeline System(s)
Used in the Evaluation Pipeline Leak Detection System Options 1, 2, and 5
Rigid Pipeline
Specialized Test Facility, Operational Storage Tank System, or Computer Simulation Inside diameter of pipeline (in.)1
4 in. / 3 1/8 in.
Length of pipeline (tank to dispenser) (ft) 1
200 ft. / 180 ft.
Volume of product in line during testing (gal) 1
130.6/ 71.8 = 208.4 gal
Type of material (fiberglass, steel, other2)
FRP
Type of product in tank and pipeline (gasoline, diesel, other3)
Gasoline
Was a mechanical line leak detector present? (yes or no)
Yes
Was trapped vapor present? (yes or no)
Yes (in 3 tests)
Bulk Modulus (B) (psi)
34,458
B/Vo (psi/ml)
0.0450
Storage tank capacity (gal)
600 gal
3Piping consisted of 150 feet of FRP pipe with 3 1/8 in. inside diameter connected to the pump and 200 feet of FRP pipe with 4 in. inside diameter; dimensions and volumes are for each section. 2Specify type of construction material. Note: two sections as indicated. 3Specify type of product for each tank.

Veeder-Root Fx2Vi n Big Flow or Packer/Manifold
Test No. Date Nominal Time Time Duration of Time of T(TB) T(1) T(2) T(3) T(G) T(TB)-T(G) Temperature(Based on Test Product Circulation Circulation Circulation Temperature Test
Temperature Began Temperature Started Ended Measurements MatrixCondition) Before Category
CirculationWas Started
(D-M-Y) (deg F) (local military) (local military) (h-min) (local military) (deg F) (deg F) (deg F) (deg F) (deg F) (deg F) (Table 5.1)
1 25-May-05 65.3 930 1030 1 930 65.3 64.7 64.6 64.7 64.7 0.6 -5 to +52 25-May-05 65.3 930 1030 1 930 65.3 64.7 64.6 64.7 64.7 0.6 -5 to +53 25-May-05 65.3 930 1030 1 930 65.3 64.7 64.6 64.7 64.7 0.6 -5 to +54 25-May-05 66.9 1055 1155 1 1055 66.9 64.7 64.7 64.7 64.7 2.2 -5 to +55 25-May-05 66.9 1055 1155 1 1055 66.9 64.7 64.7 64.7 64.7 2.2 -5 to +56 25-May-05 66.9 1055 1155 1 1055 66.9 64.7 64.7 64.7 64.7 2.2 -5 to +57 25-May-05 68.4 1330 1430 1 1330 68.4 64.8 64.7 64.8 64.8 3.6 -5 to +58 25-May-05 68.4 1330 1430 1 1330 68.4 64.8 64.7 64.8 64.8 3.6 -5 to +59 25-May-05 68.4 1330 1430 1 1330 68.4 64.8 64.7 64.8 64.8 3.6 -5 to +510 25-May-05 69.1 1500 1600 1 1500 69.1 65 64.8 64.7 64.8 4.3 -5 to +511 26-May-05 76.1 955 1055 1 955 76.1 65.1 65.1 65 65 11.1 +5 to +1512 26-May-05 76.1 955 1055 1 955 76.1 65.1 65.1 65 65 11.1 +5 to +1513 26-May-05 76.1 955 1055 1 955 76.1 65.1 65.1 65 65 11.1 +5 to +1514 26-May-05 78.2 1132 1232 1 1132 78.2 65.5 65.2 65 65.1 13.1 +5 to +1515 26-May-05 78.2 1132 1232 1 1132 78.2 65.5 65.2 65 65.1 13.1 +5 to +1516 26-May-05 78.2 1132 1232 1 1132 78.2 65.5 65.2 65 65.1 13.1 +5 to +1517 26-May-05 80 1405 1505 1 1405 80 65.8 65.3 65.2 65.3 14.7 +5 to +1518 26-May-05 80 1405 1505 1 1405 80 65.8 65.3 65.2 65.3 14.7 +5 to +1519 26-May-05 80 1405 1505 1 1405 80 65.8 65.3 65.2 65.3 14.7 +5 to +1520 26-May-05 77.4 1547 1647 1 1547 77.4 66.4 65.7 65.3 65.5 11.9 +5 to +1521 27-May-05 83.3 1011 1111 1 1011 83.3 66 65.6 65.5 65.6 17.7 +15 to +2522 27-May-05 83.3 1011 1111 1 1011 83.3 66 65.6 65.5 65.6 17.7 +15 to +2523 27-May-05 83.3 1011 1111 1 1011 83.3 66 65.6 65.5 65.6 17.7 +15 to +2524 27-May-05 87.2 1122 1222 1 1122 87.2 67.3 66.1 65.8 66 21.2 +15 to +2525 27-May-05 87.2 1122 1222 1 1122 87.2 67.3 66.1 65.8 66 21.2 +15 to +2526 27-May-05 87.2 1122 1222 1 1122 87.2 67.3 66.1 65.8 66 21.2 +15 to +2527 31-May-05 92.9 1300 1400 1 1300 92.9 66.9 66.8 66.9 66.9 26 >+2528 31-May-05 92.9 1300 1400 1 1300 92.9 66.9 66.8 66.9 66.9 26 >+25
Options 1 and 5
Attachment 4
Data Sheet Summarizing the Product Temperature Conditions Used in the Evaluation
Hourly Testing on Rigid Pipelines - 3.0 gal/hr leak tests
Pipeline Leak Detection System
Page 1 of 2

Veeder-Root Fx2Vi n Big Flow or Packer/Manifold
Test No. Date Nominal Time Time Duration of Time of T(TB) T(1) T(2) T(3) T(G) T(TB)-T(G) Temperature(Based on Test Product Circulation Circulation Circulation Temperature Test
Temperature Began Temperature Started Ended Measurements MatrixCondition) Before Category
CirculationWas Started
(D-M-Y) (deg F) (local military) (local military) (h-min) (local military) (deg F) (deg F) (deg F) (deg F) (deg F) (deg F) (Table 5.1)
Options 1 and 5
Attachment 4
Data Sheet Summarizing the Product Temperature Conditions Used in the Evaluation
Hourly Testing on Rigid Pipelines - 3.0 gal/hr leak tests
Pipeline Leak Detection System
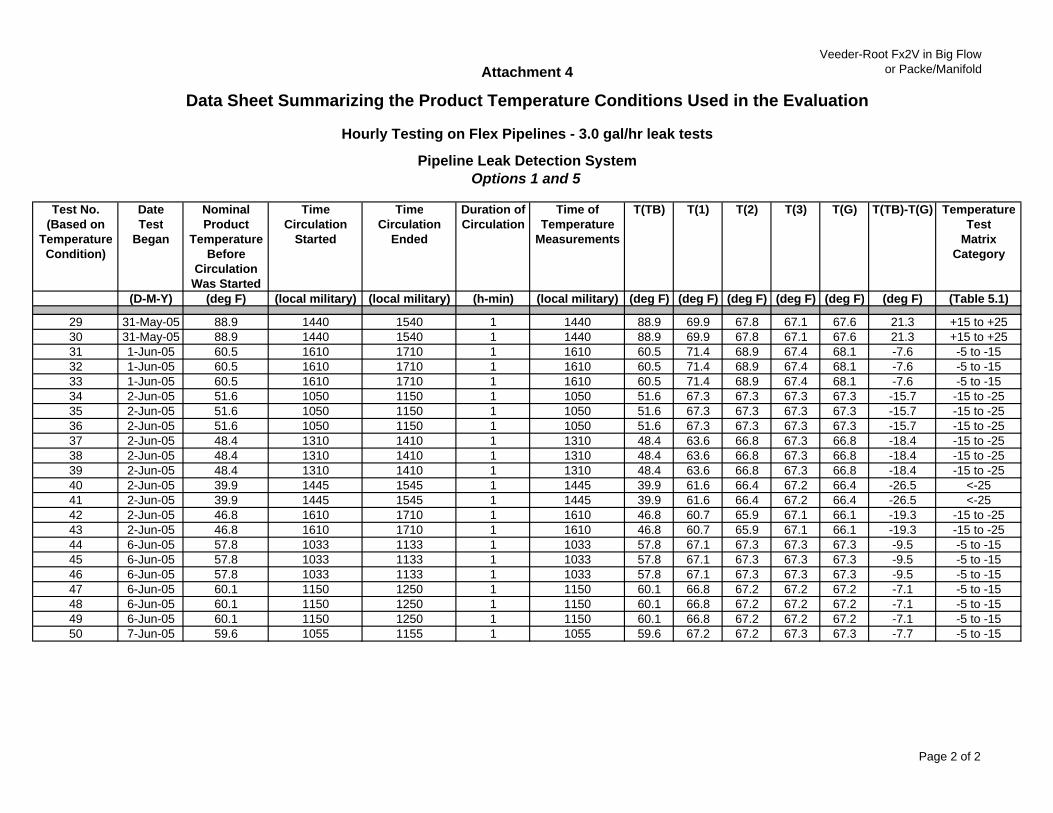
29 31-May-05 88.9 1440 1540 1 1440 88.9 69.9 67.8 67.1 67.6 21.3 +15 to +2530 31-May-05 88.9 1440 1540 1 1440 88.9 69.9 67.8 67.1 67.6 21.3 +15 to +2531 1-Jun-05 60.5 1610 1710 1 1610 60.5 71.4 68.9 67.4 68.1 -7.6 -5 to -1532 1-Jun-05 60.5 1610 1710 1 1610 60.5 71.4 68.9 67.4 68.1 -7.6 -5 to -1533 1-Jun-05 60.5 1610 1710 1 1610 60.5 71.4 68.9 67.4 68.1 -7.6 -5 to -1534 2-Jun-05 51.6 1050 1150 1 1050 51.6 67.3 67.3 67.3 67.3 -15.7 -15 to -2535 2-Jun-05 51.6 1050 1150 1 1050 51.6 67.3 67.3 67.3 67.3 -15.7 -15 to -2536 2-Jun-05 51.6 1050 1150 1 1050 51.6 67.3 67.3 67.3 67.3 -15.7 -15 to -2537 2-Jun-05 48.4 1310 1410 1 1310 48.4 63.6 66.8 67.3 66.8 -18.4 -15 to -2538 2-Jun-05 48.4 1310 1410 1 1310 48.4 63.6 66.8 67.3 66.8 -18.4 -15 to -2539 2-Jun-05 48.4 1310 1410 1 1310 48.4 63.6 66.8 67.3 66.8 -18.4 -15 to -2540 2-Jun-05 39.9 1445 1545 1 1445 39.9 61.6 66.4 67.2 66.4 -26.5 <-2541 2-Jun-05 39.9 1445 1545 1 1445 39.9 61.6 66.4 67.2 66.4 -26.5 <-2542 2-Jun-05 46.8 1610 1710 1 1610 46.8 60.7 65.9 67.1 66.1 -19.3 -15 to -2543 2-Jun-05 46.8 1610 1710 1 1610 46.8 60.7 65.9 67.1 66.1 -19.3 -15 to -2544 6-Jun-05 57.8 1033 1133 1 1033 57.8 67.1 67.3 67.3 67.3 -9.5 -5 to -1545 6-Jun-05 57.8 1033 1133 1 1033 57.8 67.1 67.3 67.3 67.3 -9.5 -5 to -1546 6-Jun-05 57.8 1033 1133 1 1033 57.8 67.1 67.3 67.3 67.3 -9.5 -5 to -1547 6-Jun-05 60.1 1150 1250 1 1150 60.1 66.8 67.2 67.2 67.2 -7.1 -5 to -1548 6-Jun-05 60.1 1150 1250 1 1150 60.1 66.8 67.2 67.2 67.2 -7.1 -5 to -1549 6-Jun-05 60.1 1150 1250 1 1150 60.1 66.8 67.2 67.2 67.2 -7.1 -5 to -1550 7-Jun-05 59.6 1055 1155 1 1055 59.6 67.2 67.2 67.3 67.3 -7.7 -5 to -15
Page 2 of 2

Veeder-Root Fx2V in Big Flow or Packer/Manifold
Test No. Date Induced Time between End Time Data Time Data Measured Was(Based on Test Leak Rate of Circulation and Collection Collection Test Threshold
Temperature Began Start of Data Began Ended Result Exceeded?Condition) Collection for Test
(D-M-Y) (gal/h) (h-min) (local military) (local military) (leak or tight) (yes or no)
1 25-May-05 3.0 6 10:36 10:37 3.0 yes2 25-May-05 0.0 7 10:37 10:37 0.0 no3 25-May-05 3.0 8 10:38 10:39 3.0 yes4 25-May-05 0.0 5 12:00 12:00 0.0 no5 25-May-05 3.0 6 12:01 12:02 3.0 yes6 25-May-05 0.0 7 12:02 12:02 0.0 no7 25-May-05 3.0 8 14:38 14:38 3.0 yes8 25-May-05 0.0 9 14:39 14:39 0.0 no9 25-May-05 3.0 10 14:40 14:41 3.0 yes10 25-May-05 0.0 5 16:05 16:05 0.0 no11 26-May-05 3.0 6 11:01 11:01 3.0 yes12 26-May-05 0.0 7 11:02 11:02 0.0 no13 26-May-05 3.0 8 11:03 11:04 3.0 yes14 26-May-05 0.0 6 12:38 12:38 0.0 no15 26-May-05 3.0 7 12:39 12:40 3.0 yes16 26-May-05 0.0 8 12:40 12:40 0.0 no17 26-May-05 0.0 6 15:11 15:11 0.0 no18 26-May-05 3.0 7 15:12 15:13 3.0 yes19 26-May-05 0.0 8 15:13 15:13 0.0 no20 26-May-05 3.0 7 16:54 16:55 3.0 yes21 27-May-05 3.0 7 11:18 11:19 3.0 yes22 27-May-05 0.0 8 11:19 11:19 0.0 no23 27-May-05 3.0 8 11:19 11:20 3.0 yes24 27-May-05 0.0 5 12:27 12:27 0.0 no25 27-May-05 3.0 6 12:28 12:29 3.0 yes26 27-May-05 0.0 7 12:29 12:29 0.0 no27 31-May-05 0.0 5 14:05 14:05 0.0 no28 31-May-05 3.0 6 14:06 14:07 3.0 yes29 31-May-05 0.0 5 15:45 15:45 0.0 no30 31-May-05 3.0 5 15:45 15:46 3.0 yes31 1-Jun-05 3.0 5 17:15 17:16 3.0 yes32 1-Jun-05 0.0 6 17:16 17:16 0.0 no33 1-Jun-05 3.0 7 17:17 17:18 3.0 yes34 2-Jun-05 3.0 7 11:57 11:58 3.0 yes35 2-Jun-05 0.0 8 11:58 11:58 0.0 no
Attachment 5
Data Sheet Summarizing the Test Results and the Leak Rates Used in the Evaluation
Pipeline Leak Detection SystemOptions 1 and 5
Hourly Testing on Rigid Pipelines - 3.0 gal/hr leak tests
Page 1 of 2
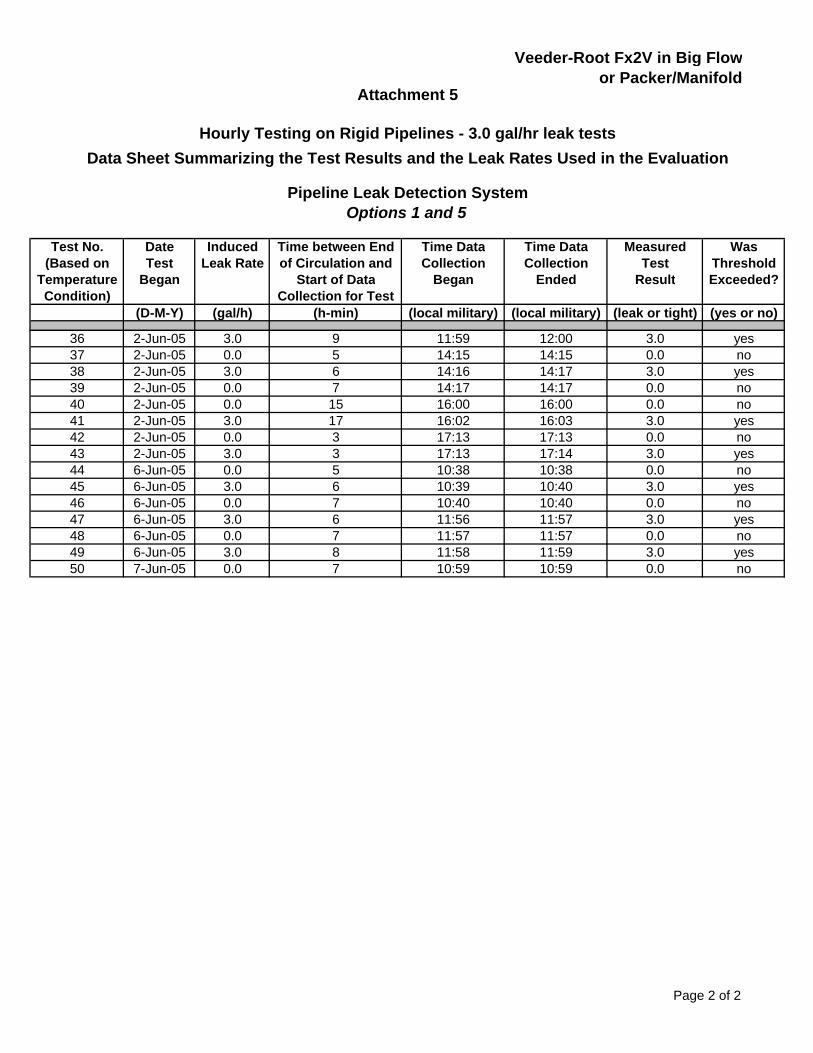
Veeder-Root Fx2V in Big Flow or Packer/Manifold
Test No. Date Induced Time between End Time Data Time Data Measured Was(Based on Test Leak Rate of Circulation and Collection Collection Test Threshold
Temperature Began Start of Data Began Ended Result Exceeded?Condition) Collection for Test
(D-M-Y) (gal/h) (h-min) (local military) (local military) (leak or tight) (yes or no)
Attachment 5
Data Sheet Summarizing the Test Results and the Leak Rates Used in the Evaluation
Pipeline Leak Detection SystemOptions 1 and 5
Hourly Testing on Rigid Pipelines - 3.0 gal/hr leak tests
36 2-Jun-05 3.0 9 11:59 12:00 3.0 yes37 2-Jun-05 0.0 5 14:15 14:15 0.0 no38 2-Jun-05 3.0 6 14:16 14:17 3.0 yes39 2-Jun-05 0.0 7 14:17 14:17 0.0 no40 2-Jun-05 0.0 15 16:00 16:00 0.0 no41 2-Jun-05 3.0 17 16:02 16:03 3.0 yes42 2-Jun-05 0.0 3 17:13 17:13 0.0 no43 2-Jun-05 3.0 3 17:13 17:14 3.0 yes44 6-Jun-05 0.0 5 10:38 10:38 0.0 no45 6-Jun-05 3.0 6 10:39 10:40 3.0 yes46 6-Jun-05 0.0 7 10:40 10:40 0.0 no47 6-Jun-05 3.0 6 11:56 11:57 3.0 yes48 6-Jun-05 0.0 7 11:57 11:57 0.0 no49 6-Jun-05 3.0 8 11:58 11:59 3.0 yes50 7-Jun-05 0.0 7 10:59 10:59 0.0 no
Page 2 of 2

Veeder-Root Fx2V in Big Flow or Packer/Manifold
Attachment 6
Data Sheet Summarizing the Test Results and the Trapped Vapor Tests
Pipeline Leak Detection SystemOptions 1 and 5
Summary of Temperature Conditions
Test No. Date Test Nominal Time Time Duration of Time of T(TB) T(1) T(2) T(3) T(G) T(TB)-T(G) Temperature(Based on Began Product Circulation Circulation Circulation Temperature Test
Temperature Temperature Started Ended Measurements MatrixCondition) Before Category
CirculationWas Started
(D-M-Y) (deg F) (local military) (local military) (h-min) (local military) (deg F) (deg F) (deg F) (deg F) (deg F) (deg F) (Table 5.1)
51 07-Jun-05 59.60 0955 1055 1 0955 59.6 67.2 67.2 67.3 67.3 -7.7 -5 to -1552 07-Jun-05 59.60 0955 1055 1 0955 59.6 67.2 67.2 67.3 67.3 -7.7 -5 to -1553 07=Jun-05 59.60 0955 1055 1 0955 59.6 67.2 67.2 67.3 67.3 -7.7 -5 to -15
Summary of Leak Rates
Test No. Date Test Pipeline Induced Leak Time between End of Time Data Time Data Measured Was ThresholdBegan Pressure Rate Circulation and Start of Collection Began Collection Ended Test Exceeded?
Data Collection for Test Result
(D-M-Y) (psi) (gal/h) (h-min) (local military) (local military) (leak or tight) (yes or no)
51 07-Jun-05 30 3.0 1101 yes52 07-Jun-05 30 0.0 1102 no53 07-Jun-05 30 3.0 1104 Yes
Hourly Testing on Rigid Pipelines - 3.0 gal/hr leak tests
0:07
110011011103
LeakTight
0:050:06
Leak
Page 1 of 1

Attachment 7 Data Sheet Summarizing the Test Results Used to Check the Relationship
Supplied by the Manufacturer for Combining the Signal and Noise Pipeline Leak Detection System Options 1 and 5
NOT APPLICABLE TO THIS EVALUATION
First Check
Test No.
Actual Leak Rate*
(gal/h)
Measured Leak Rate
(gal/h)
1
2
3
4
5
6
* Recommended leak rates for monthly monitoring tests and line tightness tests: 0.0, 0.05, 0.10, 0.20, 0.30 and
0.40 gal/h. Recommended leak rates for hourly tests: 0.0, 2.0, 2.5, 3.0, 3.5, and 4.0 gal/h.
Second Check
Test No.
Actual Leak Rate*
(gal/h)
Measured Leak Rate
(gal/h)
A
B
C
A + B*
* A + B is the summation of the results of Tests A and B using the manufacturer's relationship for combining the
signal and the noise.
Appendix B
EPA Forms for Evaluation of the Veeder-Root
Fx1V and Fx2V Leak Detectors Installed in the Big Flow or Packer/Manifold on
Flexible Pipelines
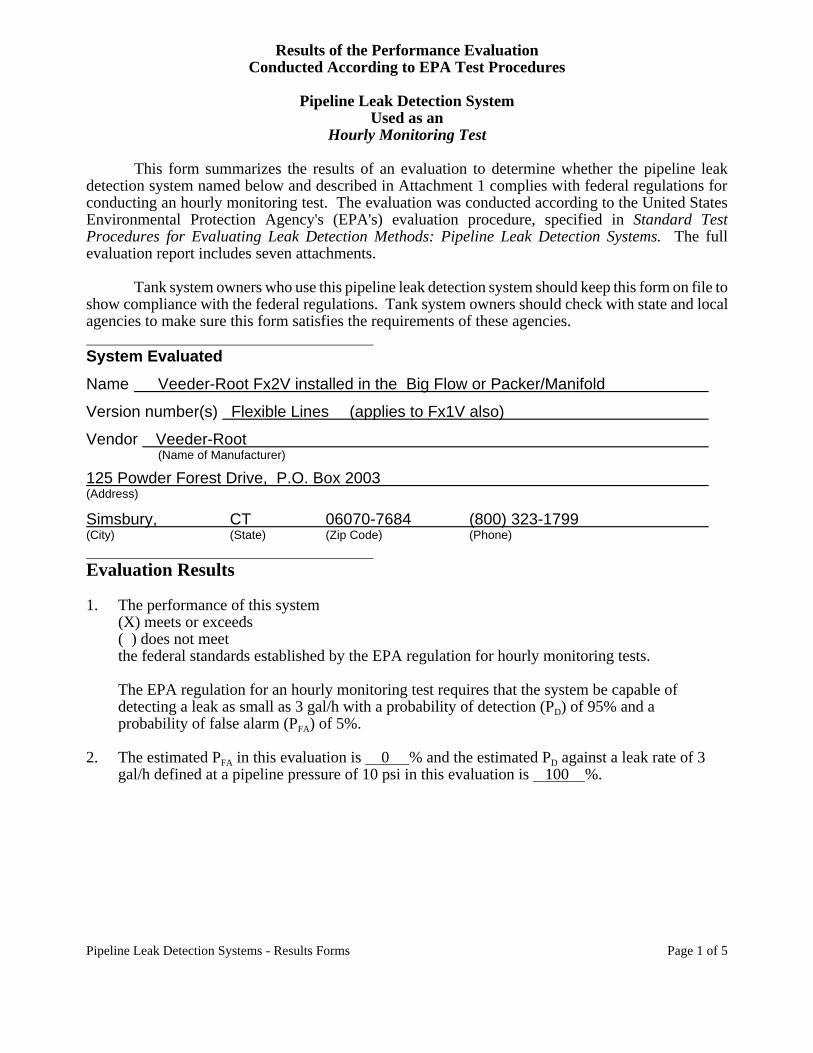
Results of the Performance Evaluation Conducted According to EPA Test Procedures Pipeline Leak Detection System Used as an Hourly Monitoring Test
This form summarizes the results of an evaluation to determine whether the pipeline leak detection system named below and described in Attachment 1 complies with federal regulations for conducting an hourly monitoring test. The evaluation was conducted according to the United States Environmental Protection Agency's (EPA's) evaluation procedure, specified in Standard Test Procedures for Evaluating Leak Detection Methods: Pipeline Leak Detection Systems. The full evaluation report includes seven attachments.
Tank system owners who use this pipeline leak detection system should keep this form on file to show compliance with the federal regulations. Tank system owners should check with state and local agencies to make sure this form satisfies the requirements of these agencies. System Evaluated
Name Veeder-Root Fx2V installed in the Big Flow or Packer/Manifold
Version number(s) Flexible Lines (applies to Fx1V also)
Vendor Veeder-Root (Name of Manufacturer)
125 Powder Forest Drive, P.O. Box 2003 (Address) Simsbury, CT 06070-7684 (800) 323-1799 (City) (State) (Zip Code) (Phone) Evaluation Results 1. The performance of this system
(X) meets or exceeds ( ) does not meet the federal standards established by the EPA regulation for hourly monitoring tests.
The EPA regulation for an hourly monitoring test requires that the system be capable of detecting a leak as small as 3 gal/h with a probability of detection (PD) of 95% and a probability of false alarm (PFA) of 5%.
2. The estimated PFA in this evaluation is 0 % and the estimated PD against a leak rate of 3
gal/h defined at a pipeline pressure of 10 psi in this evaluation is 100 %. Pipeline Leak Detection Systems - Results Forms Page 1 of 5

Criterion for Declaring a Leak 3. This system
(X) uses a preset threshold ( ) measures and reports the output quantity and compares it to a predetermined threshold to determine whether the pipeline is leaking.
4. This system
(X) uses a single test ( ) uses a multiple-test sequence consisting of tests (specify number of tests required)
separated by hours (specify the time interval between tests) to determine whether the pipeline is leaking. 5. This system declares a leak if the output of the measurement system exceeds a threshold of
1.5 gal/h @ 10 psi (specify flow rate in gal/h) in 1 out of 1 tests (specify, for example, 1 out of 2, 2 out of 3). If more detail is required, please specify in the space provided.
Evaluation Approach 6. There are five options for collecting the data used in evaluating the performance of this system.
This system was evaluated
(X) at a special test facility (Option 1) ( ) at one or more instrumented operational storage tank facilities (Option 2) ( ) at five or more operational storage tank facilities verified to be tight (Option 3) ( ) at 10 or more operational storage tank facilities (Option 4) ( ) with an experimentally validated computer simulation (Option 5)
7. A total of 53 tests were conducted on nonleaking line(s) between 25 May 05 (date) and
7 June 05 (date). A description of the pipeline configuration used in the evaluation is summarized in Attachment 3.
Answer questions 8 and 9 if Option 1, 2, or 5 was used. 8. The pipeline used in the evaluation was 3 in. in diameter, 130 ft long and constructed
of flexible materials (fiberglass, steel, or other)plus a section 3.125 in. in diameter, 30 ft long and constructed of FRP .
9. A mechanical line leak detector
(X) was ( ) was not present in the pipeline system.
Answer questions 10 and 11 if Option 3 or 4 was used. NOT APPLICABLE 10. The evaluation was conducted on (how many) pipeline systems ranging in diameter
from in. to in., ranging in length from ft to ft, and constructed of (specify materials).
Pipeline Leak Detection Systems - Results Forms Page 2 of 5
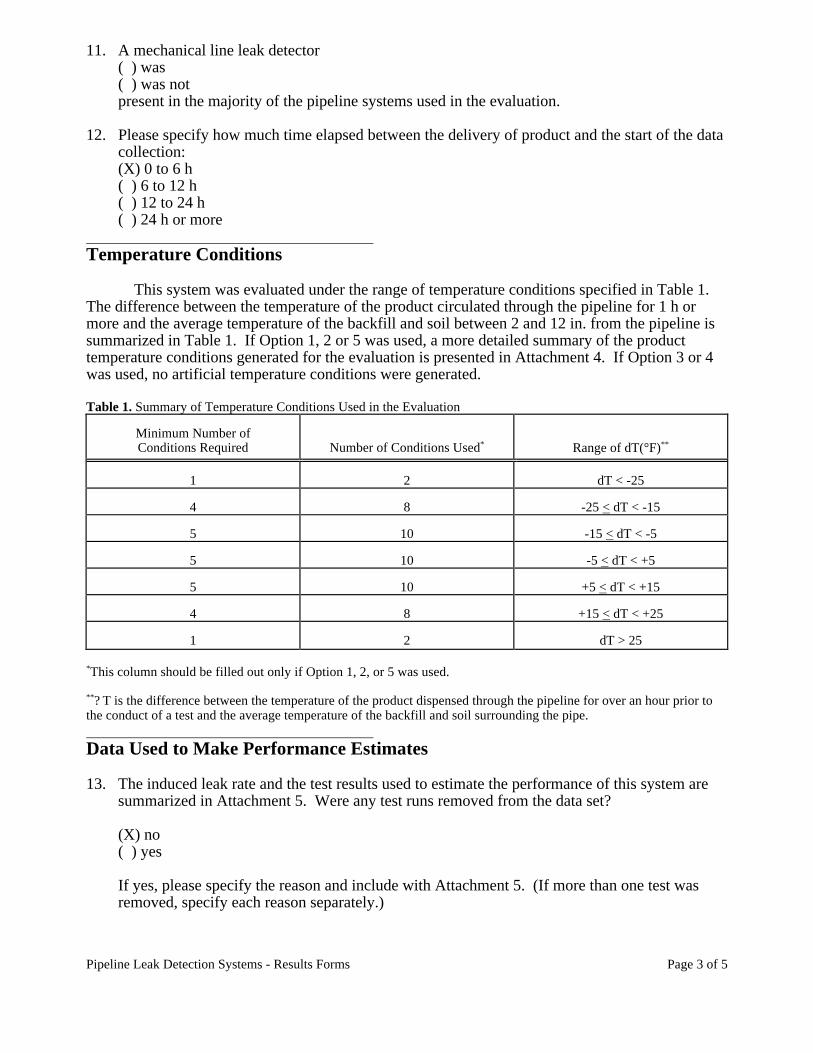
11. A mechanical line leak detector ( ) was ( ) was not present in the majority of the pipeline systems used in the evaluation.
12. Please specify how much time elapsed between the delivery of product and the start of the data
collection: (X) 0 to 6 h ( ) 6 to 12 h ( ) 12 to 24 h ( ) 24 h or more
Temperature Conditions
This system was evaluated under the range of temperature conditions specified in Table 1. The difference between the temperature of the product circulated through the pipeline for 1 h or more and the average temperature of the backfill and soil between 2 and 12 in. from the pipeline is summarized in Table 1. If Option 1, 2 or 5 was used, a more detailed summary of the product temperature conditions generated for the evaluation is presented in Attachment 4. If Option 3 or 4 was used, no artificial temperature conditions were generated. Table 1. Summary of Temperature Conditions Used in the Evaluation
Minimum Number of Conditions Required
Number of Conditions Used*
Range of dT(°F)**
1
2
dT < -25
4
8
-25 < dT < -15
5
10
-15 < dT < -5
5
10
-5 < dT < +5
5
10
+5 < dT < +15
4
8
+15 < dT < +25
1
2
dT > 25
*This column should be filled out only if Option 1, 2, or 5 was used. **? T is the difference between the temperature of the product dispensed through the pipeline for over an hour prior to the conduct of a test and the average temperature of the backfill and soil surrounding the pipe. Data Used to Make Performance Estimates 13. The induced leak rate and the test results used to estimate the performance of this system are
summarized in Attachment 5. Were any test runs removed from the data set?
(X) no ( ) yes
If yes, please specify the reason and include with Attachment 5. (If more than one test was removed, specify each reason separately.)
Pipeline Leak Detection Systems - Results Forms Page 3 of 5

Sensitivity to Trapped Vapor 14. (X) According to the vendor, this system can be used even if trapped vapor is present in the
pipeline during a test. ( ) According to the vendor, this system should not be used if trapped vapor is present in the pipeline.
15. The sensitivity of this system to trapped vapor is indicated by the test results summarized in
Table 2. These tests were conducted at 28 psi with 110 ml of vapor trapped in the line at a pressure of 0 psi. The data and test conditions are reported in Attachment 6.
Table 2. Summary of the Results of Trapped Vapor Tests (see Attachment 6 for additional tests)
Test No.
dT
(°F)
Induced Leak Rate
(gal/h @ 10 psi)
Measured Leak Rate
(gal/h)
51
-7.7
3
Leak detected
52
-7.7
0
Tight
53
-7.7
3
Leak detected
Performance Characteristics of the Instrumentation 16. State below the performance characteristics of the primary measurement system used to
collect the data. (Please specify the units, for example, gallons, inches.)
Quantity Measured: Temperature Volume Time (ms) Resolution: 0.01 deg F 1% 10 Precision: 0.03 deg F 2% 10 Accuracy: 0.10 deg F 4% 10 Minimum Detectable Quantity: 0.04 deg F 1% 10 Response Time: 2 min N/A 10 Threshold is exceeded when the flow rate due to a leak exceeds 1.5 gal/h. (@10 psi)
Application of the System 17. This leak detection system is intended to test pipeline systems that are associated with
underground storage tank facilities, that contain petroleum or other chemical products, that are typically constructed of fiberglass or steel, and that typically measure 2 or 3 in. in diameter and 350 ft or less in length. The performance estimates are valid when:
• the system that was evaluated has not been substantially changed by subsequent
modifications
• the manufacturer's instructions for using the system are followed
• the mechanical line leak detector ( ) is present in (X) has been removed from the pipeline (check both if appropriate)
Pipeline Leak Detection Systems - Results Forms Page 4 of 5
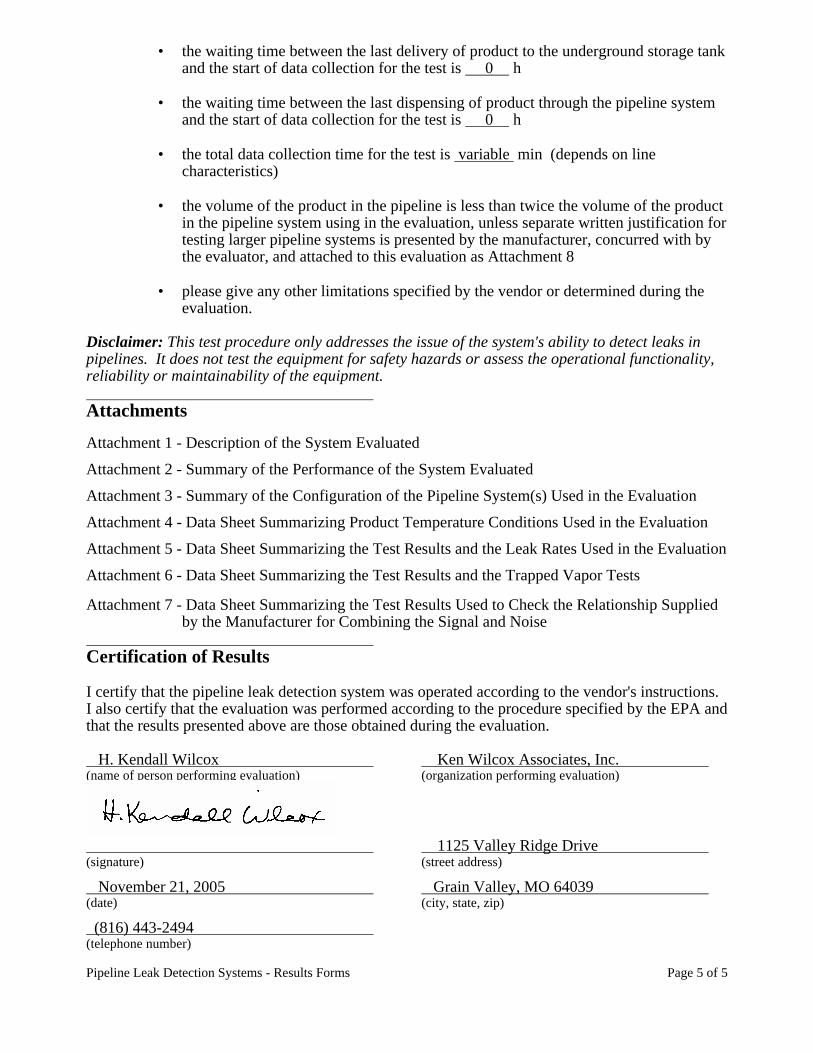
• the waiting time between the last delivery of product to the underground storage tank and the start of data collection for the test is 0 h
• the waiting time between the last dispensing of product through the pipeline system
and the start of data collection for the test is 0 h
• the total data collection time for the test is variable min (depends on line characteristics)
• the volume of the product in the pipeline is less than twice the volume of the product
in the pipeline system using in the evaluation, unless separate written justification for testing larger pipeline systems is presented by the manufacturer, concurred with by the evaluator, and attached to this evaluation as Attachment 8
• please give any other limitations specified by the vendor or determined during the
evaluation. Disclaimer: This test procedure only addresses the issue of the system's ability to detect leaks in pipelines. It does not test the equipment for safety hazards or assess the operational functionality, reliability or maintainability of the equipment. Attachments Attachment 1 - Description of the System Evaluated Attachment 2 - Summary of the Performance of the System Evaluated Attachment 3 - Summary of the Configuration of the Pipeline System(s) Used in the Evaluation Attachment 4 - Data Sheet Summarizing Product Temperature Conditions Used in the Evaluation Attachment 5 - Data Sheet Summarizing the Test Results and the Leak Rates Used in the Evaluation Attachment 6 - Data Sheet Summarizing the Test Results and the Trapped Vapor Tests Attachment 7 - Data Sheet Summarizing the Test Results Used to Check the Relationship Supplied
by the Manufacturer for Combining the Signal and Noise Certification of Results I certify that the pipeline leak detection system was operated according to the vendor's instructions. I also certify that the evaluation was performed according to the procedure specified by the EPA and that the results presented above are those obtained during the evaluation. H. Kendall Wilcox Ken Wilcox Associates, Inc. (name of person performing evaluation) (organization performing evaluation)
1125 Valley Ridge Drive (signature) (street address) November 21, 2005 Grain Valley, MO 64039 (date) (city, state, zip) (816) 443-2494 (telephone number) Pipeline Leak Detection Systems - Results Forms Page 5 of 5

Attachment 1 Description Pipeline Leak Detection System
This form provides supporting information on the operating principles of the leak detection system or on how the equipment works. This form is to be filled out by the evaluating organization with assistance from the manufacturer before the start of the evaluation.
Describe the important features of the system as indicated below. A detailed description is not required, nor is it necessary to reveal proprietary features of the system.
To minimize the time required to complete this form, the most frequently expected answers to the questions have been provided. For those answers that are dependent on site conditions, please give answers that apply in "typical" conditions. Please write in any additional information about the system that you believe is important.
Check all appropriate boxes for each question. Check more than one box per question if it applies. If 'Other' is checked, please complete the space provided to specify or briefly describe the matter. If necessary, use all the white space next to a question to complete a description. System Name and Version: Veeder-Root Fx2V installed in the Big Flow or Packer/Manifold Date November 21, 2005 Applicability of the System 1. With what products can this system be used? (Check all applicable responses.)
(X) gasoline (X) diesel (X) aviation fuel ( ) fuel oil #4 ( ) fuel oil #6 (X) solvent (Contact manufacturer for solvent applications) ( ) waste oil (X) other (specify) Contact manufacturer for other hydrocarbon applications.
2. What types of pipelines can be tested? (Check all applicable responses.)
(X) fiberglass (X) steel (X) other (specify) any flexible piping
3. Can this leak detection system be used to test double-wall pipeline systems?
(X) yes ( ) no Description - Pipeline Leak Detection Systems Page 1 of 5
4. What is the nominal diameter of a pipeline that can be tested with this system?
(X) 1 in. or less (X) between 1 and 3 in. (X) between 3 and 6 in. Contact manufacturer for application to lines greater than 3 in. (X) between 6 and 10 in. ( ) other
5. The system can be used on pipelines pressurized to 50 psi.
The safe maximum operating pressure for this system is 50 psi. 6. Does the system conduct a test while a mechanical line leak detector is in place in the pipeline?
(X) yes ( ) no General Features of the System 7. What type of test is the system conducting? (Check all applicable responses.)
( ) 0.1 gal/h Line Tightness Test ( ) 0.2 gal/h Monthly Monitoring Test (X) 3 gal/h Hourly Test
8. Is the system permanently installed on the pipeline?
(X) yes ( ) no
Does the system test the line automatically?
(X) yes ( ) no
If a leak is declared, what does the system do? (Check all applicable responses.)
( ) displays or prints a message ( ) triggers an alarm ( ) alerts the operator ( ) shuts down the dispensing system (X) other (Restricts flow of fuel to vehicle)
9. What quantity or quantities are measured by the system? (Please list.)
Volume Time
10. Does the system use a preset threshold that is automatically activated or that automatically
turns on an alarm?
( ) yes (If yes, skip question 11.) (X) no (If no, answer question 11.)
11. Does the system measure and report the quantity?
( ) yes (X) no Description - Pipeline Leak Detection Systems Page 2 of 5
If so, is the output quantity converted to flow rate in gallons per hour? ( ) yes ( ) no
12. What is the specified line pressure during a test?
(X) operating pressure of line ( ) 150% of operating pressure ( ) a specific test pressure of psi
Test Protocol 13. What is the minimum waiting period required between a delivery of product to an underground
storage tank and the start of the data collection for a pipeline leak detection test?
(X) no waiting period ( ) less than 15 min ( ) 15 min to 1 h ( ) 1 to 5 h ( ) 6 to 12 h ( ) 12 to 24 h ( ) greater than 24 h ( ) variable (Briefly explain.)
14. What is the minimum waiting period required between the last dispensing of product through
the pipeline and the start of the data collection for a pipeline leak detection test?
(X) no waiting period ( ) less than 15 min ( ) 15 min to 1 h ( ) 1 to 4 h ( ) 4 to 8 h ( ) greater than 8 h ( ) variable (Briefly explain.)
15. What is the minimum amount of time necessary to set up equipment and complete a leak
detection test? (Include setup time, waiting time and data collection time. If a multiple-test sequence is used, give the amount of time necessary to complete the first test as well as the total amount of time necessary to complete the entire sequence.)
N/A h (single test) (unit is permanently installed in the line) h (multiple test)
16. Does the system compensate for those pressure or volume changes of the product in the
pipeline that are due to temperature changes?
( ) yes (X) no 17. Is there a special test to check the pipeline for trapped vapor?
( ) yes (X) no Description - Pipeline Leak Detection Systems Page 3 of 5
18. Can a test be performed with trapped vapor in the pipeline?
(X) yes ( ) no 19. If trapped vapor is found in the pipeline, is it removed before a test is performed?
( ) yes (X) no 20. Are deviations from this protocol acceptable?
( ) yes (X) no
If yes, briefly specify: 21. Are elements of the test procedure determined by on-site personnel?
( ) yes (X) no
If yes, which ones? (Check all applicable responses.)
( ) waiting period between filling the tank and the beginning of data collection for the test ( ) length of test ( ) determination of the presence of vapor pockets ( ) determination of "outlier" (or anomalous) data that may be discarded ( ) other (Describe briefly.)
Data Acquisition 22. How are the test data acquired and recorded?
(X) manually ( ) by strip chart ( ) by computer ( ) by microprocessor
23. Certain calculations are necessary to reduce and analyze the data. How are these calculations
done?
( ) manual calculations by the operator on site ( ) interactive computer program used by the operator ( ) automatically done with a computer program ( ) automatically done with a microprocessor (X) no calculations – this is a mechanical system
Detection Criterion 24. What threshold is used to determine whether the pipeline is leaking?
gal/hr (in the units used by the measurement system) 1.5 @ 10 psi (in gal/h) at operating pressure
Description - Pipeline Leak Detection Systems Page 4 of 5

25. Is a multiple-test sequence used to determine whether the pipeline is leaking?
( ) yes (If yes, answer the three questions below) (X) no (If no, skip the three questions below)
How many tests are conducted? How many tests are required before a leak can be declared? What is the time between tests? (Enter 0 if the tests are conducted one after the other.)
Calibration 26. How frequently are the sensor systems calibrated?
( ) never ( ) before each test ( ) weekly ( ) monthly ( ) semi-annually (X) yearly or less frequently
Description - Pipeline Leak Detection Systems Page 5 of 5
Attachment 2 Summary of Performance Estimates Pipeline Leak Detection System Used as an Hourly Monitoring Test
Complete this page if the pipeline leak detection system has been evaluated as an hourly test. Please complete the first table. Completion of the last three tables is optional. (The last three tables present the performance of the system for different combinations of thresholds, probabilities of false alarm, and probabilities of detection. They are useful for comparing the performance of this system to that of other systems.) Performance of the Pipeline Leak Detection System as Evaluated
Description
Leak Rate
(gal/h)
PD
PFA
Threshold
(gal/h) Evaluated System
3
100
0
1.5 @ 10 psi
EPA Standard
3
0.95
0.05
N/A
Probability of False Alarm as a Function of Threshold
Threshold
(gal/h)
Probability of False Alarm
Not determined
0.10
0.075
0.05
0.05
Probability of Detection as a Function of Threshold for a Leak Rate of 3.0 gal/h
Threshold
(gal/h)
Probability of Detection
Not determined
0.95
0.90
0.80
0.50
Smallest Leak Rate that Can be Detected with the Specified Probability of Detection and Probability of False Alarm
Leak Rate
(gal/h)
Probability of Detection
Probability of False Alarm
Not determined
0.95
0.10
0.95
0.075
0.95
0.05
0.90
0.05
0.80
0.05
0.50
0.05

Attachment 3 Summary of the Configuration of the Pipeline System(s)
Used in the Evaluation Pipeline Leak Detection System Options 1, 2, and 5
Flexible Pipeline
Specialized Test Facility, Operational Storage Tank System, or Computer Simulation Inside diameter of pipeline (in.)1
3 in / 3 1/8 in
Length of pipeline (tank to dispenser) (ft) 1
130 ft. / 30 ft.
Volume of product in line during testing (gal) 1
47.74 gal*
Type of material (fiberglass, steel, other)
Flex/FRP
Type of product in tank and pipeline (gasoline, diesel, other)
Gasoline
Was a mechanical line leak detector present? (yes or no)
Yes
Was trapped vapor present? (yes or no)
Yes (in 3 tests)
Bulk Modulus (B) (psi)
8360
B/Vo (psi/ml)
0.037
Storage tank capacity (gal)
600 gal
1 Piping consisted of 30 feet of FRP pipe with 3 1/8 in. inside diameter connected to the pump and 130 feet of flexible pipe with 3 in. inside diameter. The total line volume was 59.4 gallons.

Veeder-Root Fx2V in Big Flow or Packe/Manifold
Test No. Date Nominal Time Time Duration of Time of T(TB) T(1) T(2) T(3) T(G) T(TB)-T(G) Temperature(Based on Test Product Circulation Circulation Circulation Temperature Test
Temperature Began Temperature Started Ended Measurements MatrixCondition) Before Category
CirculationWas Started
(D-M-Y) (deg F) (local military) (local military) (h-min) (local military) (deg F) (deg F) (deg F) (deg F) (deg F) (deg F) (Table 5.1)
1 25-May-05 65.3 930 1030 1 930 65.3 64.7 64.6 64.7 64.7 0.6 -5 to +52 25-May-05 65.3 930 1030 1 930 65.3 64.7 64.6 64.7 64.7 0.6 -5 to +53 25-May-05 65.3 930 1030 1 930 65.3 64.7 64.6 64.7 64.7 0.6 -5 to +54 25-May-05 66.9 1055 1155 1 1055 66.9 64.7 64.7 64.7 64.7 2.2 -5 to +55 25-May-05 66.9 1055 1155 1 1055 66.9 64.7 64.7 64.7 64.7 2.2 -5 to +56 25-May-05 66.9 1055 1155 1 1055 66.9 64.7 64.7 64.7 64.7 2.2 -5 to +57 25-May-05 68.4 1330 1430 1 1330 68.4 64.8 64.7 64.8 64.8 3.6 -5 to +58 25-May-05 68.4 1330 1430 1 1330 68.4 64.8 64.7 64.8 64.8 3.6 -5 to +59 25-May-05 68.4 1330 1430 1 1330 68.4 64.8 64.7 64.8 64.8 3.6 -5 to +510 25-May-05 69.1 1500 1600 1 1500 69.1 65 64.8 64.7 64.8 4.3 -5 to +511 26-May-05 76.1 955 1055 1 955 76.1 65.1 65.1 65 65 11.1 +5 to +1512 26-May-05 76.1 955 1055 1 955 76.1 65.1 65.1 65 65 11.1 +5 to +1513 26-May-05 76.1 955 1055 1 955 76.1 65.1 65.1 65 65 11.1 +5 to +1514 26-May-05 78.2 1132 1232 1 1132 78.2 65.5 65.2 65 65.1 13.1 +5 to +1515 26-May-05 78.2 1132 1232 1 1132 78.2 65.5 65.2 65 65.1 13.1 +5 to +1516 26-May-05 78.2 1132 1232 1 1132 78.2 65.5 65.2 65 65.1 13.1 +5 to +1517 26-May-05 80 1405 1505 1 1405 80 65.8 65.3 65.2 65.3 14.7 +5 to +1518 26-May-05 80 1405 1505 1 1405 80 65.8 65.3 65.2 65.3 14.7 +5 to +1519 26-May-05 80 1405 1505 1 1405 80 65.8 65.3 65.2 65.3 14.7 +5 to +1520 26-May-05 77.4 1547 1647 1 1547 77.4 66.4 65.7 65.3 65.5 11.9 +5 to +1521 27-May-05 83.3 1011 1111 1 1011 83.3 66 65.6 65.5 65.6 17.7 +15 to +2522 27-May-05 83.3 1011 1111 1 1011 83.3 66 65.6 65.5 65.6 17.7 +15 to +2523 27-May-05 83.3 1011 1111 1 1011 83.3 66 65.6 65.5 65.6 17.7 +15 to +2524 27-May-05 87.2 1122 1222 1 1122 87.2 67.3 66.1 65.8 66 21.2 +15 to +2525 27-May-05 87.2 1122 1222 1 1122 87.2 67.3 66.1 65.8 66 21.2 +15 to +2526 27-May-05 87.2 1122 1222 1 1122 87.2 67.3 66.1 65.8 66 21.2 +15 to +2527 31-May-05 92.9 1300 1400 1 1300 92.9 66.9 66.8 66.9 66.9 26 >+2528 31-May-05 92.9 1300 1400 1 1300 92.9 66.9 66.8 66.9 66.9 26 >+25
Pipeline Leak Detection SystemOptions 1 and 5
Attachment 4
Data Sheet Summarizing the Product Temperature Conditions Used in the Evaluation
Hourly Testing on Flex Pipelines - 3.0 gal/hr leak tests
Page 1 of 2
Veeder-Root Fx2V in Big Flow or Packe/Manifold
Test No. Date Nominal Time Time Duration of Time of T(TB) T(1) T(2) T(3) T(G) T(TB)-T(G) Temperature(Based on Test Product Circulation Circulation Circulation Temperature Test
Temperature Began Temperature Started Ended Measurements MatrixCondition) Before Category
CirculationWas Started
(D-M-Y) (deg F) (local military) (local military) (h-min) (local military) (deg F) (deg F) (deg F) (deg F) (deg F) (deg F) (Table 5.1)
Pipeline Leak Detection SystemOptions 1 and 5
Attachment 4
Data Sheet Summarizing the Product Temperature Conditions Used in the Evaluation
Hourly Testing on Flex Pipelines - 3.0 gal/hr leak tests
29 31-May-05 88.9 1440 1540 1 1440 88.9 69.9 67.8 67.1 67.6 21.3 +15 to +2530 31-May-05 88.9 1440 1540 1 1440 88.9 69.9 67.8 67.1 67.6 21.3 +15 to +2531 1-Jun-05 60.5 1610 1710 1 1610 60.5 71.4 68.9 67.4 68.1 -7.6 -5 to -1532 1-Jun-05 60.5 1610 1710 1 1610 60.5 71.4 68.9 67.4 68.1 -7.6 -5 to -1533 1-Jun-05 60.5 1610 1710 1 1610 60.5 71.4 68.9 67.4 68.1 -7.6 -5 to -1534 2-Jun-05 51.6 1050 1150 1 1050 51.6 67.3 67.3 67.3 67.3 -15.7 -15 to -2535 2-Jun-05 51.6 1050 1150 1 1050 51.6 67.3 67.3 67.3 67.3 -15.7 -15 to -2536 2-Jun-05 51.6 1050 1150 1 1050 51.6 67.3 67.3 67.3 67.3 -15.7 -15 to -2537 2-Jun-05 48.4 1310 1410 1 1310 48.4 63.6 66.8 67.3 66.8 -18.4 -15 to -2538 2-Jun-05 48.4 1310 1410 1 1310 48.4 63.6 66.8 67.3 66.8 -18.4 -15 to -2539 2-Jun-05 48.4 1310 1410 1 1310 48.4 63.6 66.8 67.3 66.8 -18.4 -15 to -2540 2-Jun-05 39.9 1445 1545 1 1445 39.9 61.6 66.4 67.2 66.4 -26.5 <-2541 2-Jun-05 39.9 1445 1545 1 1445 39.9 61.6 66.4 67.2 66.4 -26.5 <-2542 2-Jun-05 46.8 1610 1710 1 1610 46.8 60.7 65.9 67.1 66.1 -19.3 -15 to -2543 2-Jun-05 46.8 1610 1710 1 1610 46.8 60.7 65.9 67.1 66.1 -19.3 -15 to -2544 6-Jun-05 57.8 1033 1133 1 1033 57.8 67.1 67.3 67.3 67.3 -9.5 -5 to -1545 6-Jun-05 57.8 1033 1133 1 1033 57.8 67.1 67.3 67.3 67.3 -9.5 -5 to -1546 6-Jun-05 57.8 1033 1133 1 1033 57.8 67.1 67.3 67.3 67.3 -9.5 -5 to -1547 6-Jun-05 60.1 1150 1250 1 1150 60.1 66.8 67.2 67.2 67.2 -7.1 -5 to -1548 6-Jun-05 60.1 1150 1250 1 1150 60.1 66.8 67.2 67.2 67.2 -7.1 -5 to -1549 6-Jun-05 60.1 1150 1250 1 1150 60.1 66.8 67.2 67.2 67.2 -7.1 -5 to -1550 7-Jun-05 59.6 1055 1155 1 1055 59.6 67.2 67.2 67.3 67.3 -7.7 -5 to -15
Page 2 of 2
Veeder-root Fx2V in Big Flowor Packer/Manifold
Test No. Date Induced Time between End Time Data Time Data Measured Was(Based on Test Leak Rate of Circulation and Collection Collection Test Threshold
Temperature Began Start of Data Began Ended Result Exceeded?Condition) Collection for Test
(D-M-Y) (gal/h) (h-min) (local military) (local military) (leak or tight) (yes or no)
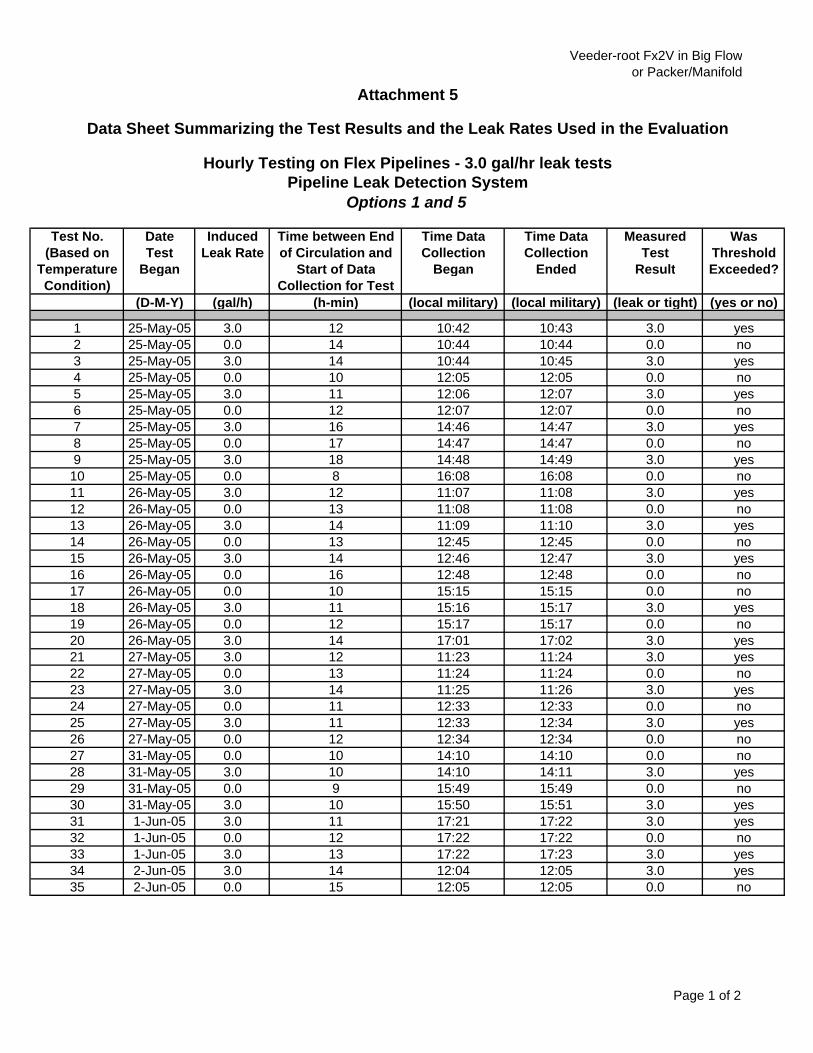
1 25-May-05 3.0 12 10:42 10:43 3.0 yes2 25-May-05 0.0 14 10:44 10:44 0.0 no3 25-May-05 3.0 14 10:44 10:45 3.0 yes4 25-May-05 0.0 10 12:05 12:05 0.0 no5 25-May-05 3.0 11 12:06 12:07 3.0 yes6 25-May-05 0.0 12 12:07 12:07 0.0 no7 25-May-05 3.0 16 14:46 14:47 3.0 yes8 25-May-05 0.0 17 14:47 14:47 0.0 no9 25-May-05 3.0 18 14:48 14:49 3.0 yes10 25-May-05 0.0 8 16:08 16:08 0.0 no11 26-May-05 3.0 12 11:07 11:08 3.0 yes12 26-May-05 0.0 13 11:08 11:08 0.0 no13 26-May-05 3.0 14 11:09 11:10 3.0 yes14 26-May-05 0.0 13 12:45 12:45 0.0 no15 26-May-05 3.0 14 12:46 12:47 3.0 yes16 26-May-05 0.0 16 12:48 12:48 0.0 no17 26-May-05 0.0 10 15:15 15:15 0.0 no18 26-May-05 3.0 11 15:16 15:17 3.0 yes19 26-May-05 0.0 12 15:17 15:17 0.0 no20 26-May-05 3.0 14 17:01 17:02 3.0 yes21 27-May-05 3.0 12 11:23 11:24 3.0 yes22 27-May-05 0.0 13 11:24 11:24 0.0 no23 27-May-05 3.0 14 11:25 11:26 3.0 yes24 27-May-05 0.0 11 12:33 12:33 0.0 no25 27-May-05 3.0 11 12:33 12:34 3.0 yes26 27-May-05 0.0 12 12:34 12:34 0.0 no27 31-May-05 0.0 10 14:10 14:10 0.0 no28 31-May-05 3.0 10 14:10 14:11 3.0 yes29 31-May-05 0.0 9 15:49 15:49 0.0 no30 31-May-05 3.0 10 15:50 15:51 3.0 yes31 1-Jun-05 3.0 11 17:21 17:22 3.0 yes32 1-Jun-05 0.0 12 17:22 17:22 0.0 no33 1-Jun-05 3.0 13 17:22 17:23 3.0 yes34 2-Jun-05 3.0 14 12:04 12:05 3.0 yes35 2-Jun-05 0.0 15 12:05 12:05 0.0 no
Attachment 5
Data Sheet Summarizing the Test Results and the Leak Rates Used in the Evaluation
Pipeline Leak Detection SystemOptions 1 and 5
Hourly Testing on Flex Pipelines - 3.0 gal/hr leak tests
Page 1 of 2
Veeder-root Fx2V in Big Flowor Packer/Manifold
Test No. Date Induced Time between End Time Data Time Data Measured Was(Based on Test Leak Rate of Circulation and Collection Collection Test Threshold
Temperature Began Start of Data Began Ended Result Exceeded?Condition) Collection for Test
(D-M-Y) (gal/h) (h-min) (local military) (local military) (leak or tight) (yes or no)
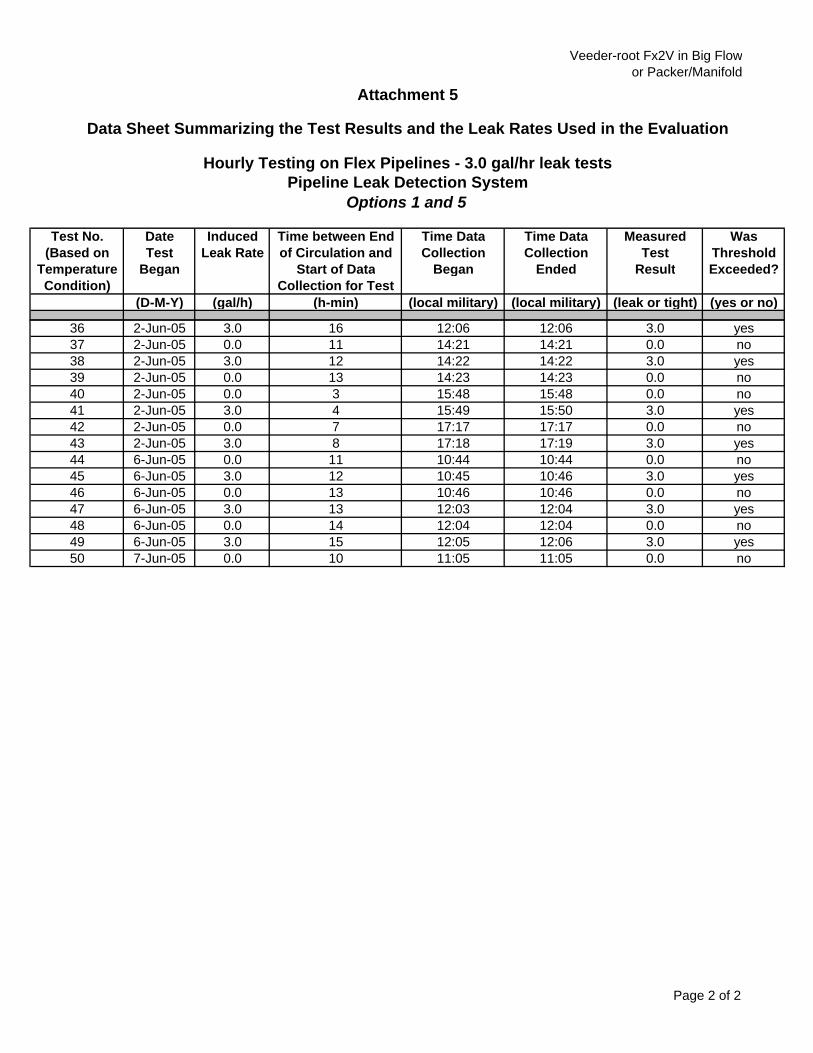
Attachment 5
Data Sheet Summarizing the Test Results and the Leak Rates Used in the Evaluation
Pipeline Leak Detection SystemOptions 1 and 5
Hourly Testing on Flex Pipelines - 3.0 gal/hr leak tests
36 2-Jun-05 3.0 16 12:06 12:06 3.0 yes37 2-Jun-05 0.0 11 14:21 14:21 0.0 no38 2-Jun-05 3.0 12 14:22 14:22 3.0 yes39 2-Jun-05 0.0 13 14:23 14:23 0.0 no40 2-Jun-05 0.0 3 15:48 15:48 0.0 no41 2-Jun-05 3.0 4 15:49 15:50 3.0 yes42 2-Jun-05 0.0 7 17:17 17:17 0.0 no43 2-Jun-05 3.0 8 17:18 17:19 3.0 yes44 6-Jun-05 0.0 11 10:44 10:44 0.0 no45 6-Jun-05 3.0 12 10:45 10:46 3.0 yes46 6-Jun-05 0.0 13 10:46 10:46 0.0 no47 6-Jun-05 3.0 13 12:03 12:04 3.0 yes48 6-Jun-05 0.0 14 12:04 12:04 0.0 no49 6-Jun-05 3.0 15 12:05 12:06 3.0 yes50 7-Jun-05 0.0 10 11:05 11:05 0.0 no
Page 2 of 2
Veeder-Root Fx2V in Big Flowor Packer/Manifold
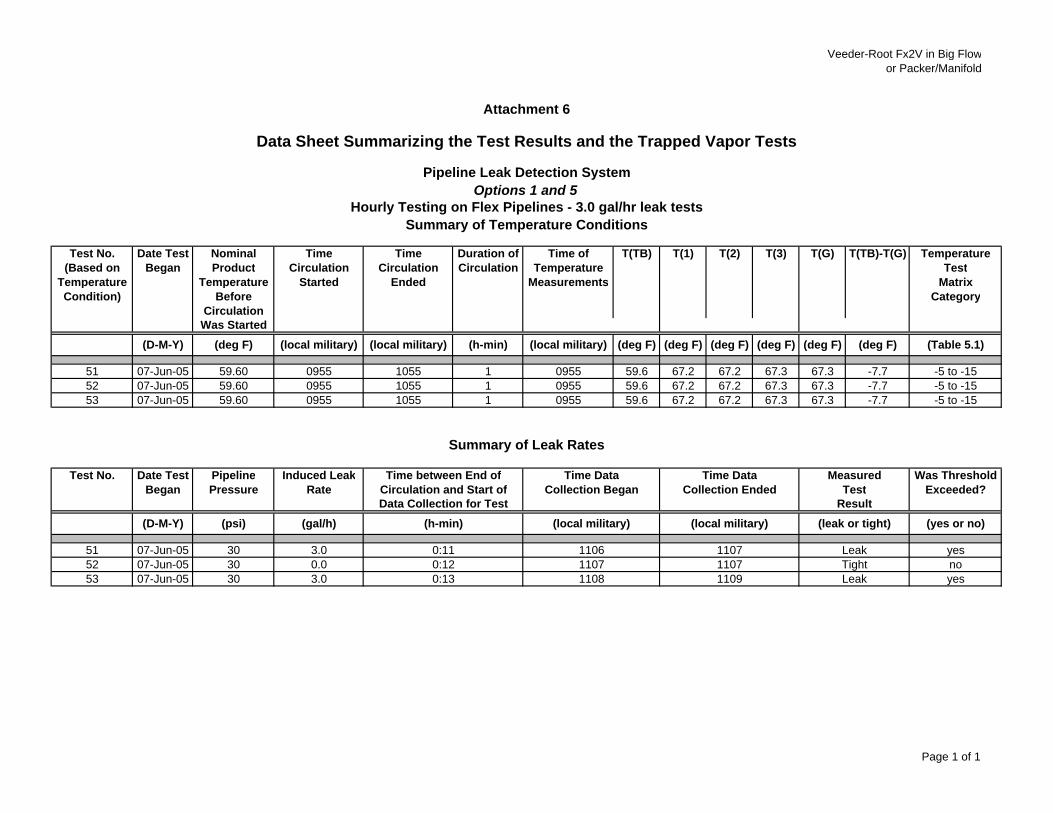
Attachment 6
Data Sheet Summarizing the Test Results and the Trapped Vapor Tests
Pipeline Leak Detection SystemOptions 1 and 5
Summary of Temperature Conditions
Test No. Date Test Nominal Time Time Duration of Time of T(TB) T(1) T(2) T(3) T(G) T(TB)-T(G) Temperature(Based on Began Product Circulation Circulation Circulation Temperature Test
Temperature Temperature Started Ended Measurements MatrixCondition) Before Category
CirculationWas Started
(D-M-Y) (deg F) (local military) (local military) (h-min) (local military) (deg F) (deg F) (deg F) (deg F) (deg F) (deg F) (Table 5.1)
51 07-Jun-05 59.60 0955 1055 1 0955 59.6 67.2 67.2 67.3 67.3 -7.7 -5 to -1552 07-Jun-05 59.60 0955 1055 1 0955 59.6 67.2 67.2 67.3 67.3 -7.7 -5 to -1553 07-Jun-05 59.60 0955 1055 1 0955 59.6 67.2 67.2 67.3 67.3 -7.7 -5 to -15
Summary of Leak Rates
Test No. Date Test Pipeline Induced Leak Time between End of Time Data Time Data Measured Was ThresholdBegan Pressure Rate Circulation and Start of Collection Began Collection Ended Test Exceeded?
Data Collection for Test Result
(D-M-Y) (psi) (gal/h) (h-min) (local military) (local military) (leak or tight) (yes or no)
51 07-Jun-05 30 3.0 1107 yes52 07-Jun-05 30 0.0 1107 no53 07-Jun-05 30 3.0 1109 yes
Hourly Testing on Flex Pipelines - 3.0 gal/hr leak tests
0:13
110611071108
LeakTight
0:110:12
Leak
Page 1 of 1
Attachment 7 Data Sheet Summarizing the Test Results Used to Check the Relationship
Supplied by the Manufacturer for Combining the Signal and Noise Pipeline Leak Detection System Options 1 and 5
NOT APPLICABLE TO THIS EVALUATION
First Check
Test No.
Actual Leak Rate* (gal/h)
Measured Leak Rate
(gal/h)
1
2
3
4
5
6
* Recommended leak rates for monthly monitoring tests and line tightness tests: 0.0, 0.05, 0.10, 0.20, 0.30 and
0.40 gal/h. Recommended leak rates for hourly tests: 0.0, 2.0, 2.5, 3.0, 3.5, and 4.0 gal/h.
Second Check
Test No.
Actual Leak Rate* (gal/h)
Measured Leak Rate
(gal/h)
A
B
C
A + B*
* A + B is the summation of the results of Tests A and B using the manufacturer's relationship for combining
the signal and the noise.


For technical support, sales orother assistance, please visit:
www.veeder.com