CERTIFICATION REPORT polymer reference materials ERM
62
CERTIFICATION REPORT Certification of the mass fractions of various polybrominated diphenyl ethers (PBDEs), decabrominated biphenyl and total Br and total Sb in two polymer reference materials Certified Reference Materials ERM ® -EC590 & ERM ® -EC591 EUR 23677 EN - 2009
Transcript of CERTIFICATION REPORT polymer reference materials ERM

CERTIFICATION REPORT
Certification of the mass fractions of various polybrominated diphenyl ethers (PBDEs),
decabrominated biphenyl and total Br and total Sb in two polymer reference materials
Certified Reference Materials ERM®-EC590 & ERM®-EC591
EU
R23677
EN
-2009

The mission of the JRC-IRMM is to promote a common and reliable European measurement system in support of EU policies. European Commission Joint Research Centre Institute for Reference Materials and Measurements Contact information Reference materials sales Retieseweg 111 B-2440 Geel, Belgium E-mail: [email protected] Tel.: +32 (0)14 571 705 Fax: +32 (0)14 590 406 http://irmm.jrc.ec.europa.eu/ http://www.jrc.ec.europa.eu/ Legal Notice Neither the European Commission nor any person acting on behalf of the Commission is responsible for the use which might be made of this publication.
Europe Direct is a service to help you find answers to your questions about the European Union
Freephone number (*):
00 800 6 7 8 9 10 11
(*) Certain mobile telephone operators do not allow access to 00 800 numbers or these calls may be billed.
A great deal of additional information on the European Union is available on the Internet. It can be accessed through the Europa server http://europa.eu/ JRC 49501 EUR 23677 EN ISBN 978-92-79-11105-1 ISSN 1018-5593 DOI 10.2787/9764 Luxembourg: Office for Official Publications of the European Communities © European Communities, 2009 Reproduction is authorised provided the source is acknowledged Printed in Belgium

CERTIFICATION REPORT
Certification of the mass fractions of various polybrominated diphenyl ethers (PBDEs),
decabrominated biphenyl and total Br and total Sb in two polymer reference materials
Certified Reference Materials ERM®-EC590 & ERM®-EC591
T. Linsinger, A. Birgersson-Liebich, F. Pellizzato, T. Venelinov, S. Voorspoels, A. Lamberty

Disclaimer
Certain commercial equipment, instruments, and materials are identified in this report to specify adequately the experimental procedure. In no case does such identification imply recommendation or endorsement by the European Commission, nor does it imply that the material or
equipment is necessarily the best available for the purpose.

1
ABSTRACT This report describes the preparation and certification of the polymer certified reference materials (CRM) ERM-EC590 and ERM-EC591. The CRMs have been certified by the European Commission, Joint Research Centre, Institute for Reference Materials and Measurements (IRMM), Geel, Belgium.
The CRMs were prepared from a low-density polyethylene granulate and polypropylene granulate spiked with technical mixtures of brominated diphenylethers (BDEs) and brominated biphenyls (BB). Technical Penta-BDE, Octa-BDE, Deca-BDE and Deca-BB were added.
Certification of the CRM included testing of the homogeneity and stability of the material as well as the characterisation using an intercomparison approach.
The CRMs have been certified for their content of Br as well as for several BDE congeners and decabrominated biphenyl (BB-209). Indicative values have been established for Sb. Additional information about several BDE-congeners is given.
These CRMs are intended for use in quality assurance of measurements of BDEs. BB-209 and elements in polymers and related matrices.
Uncertainties are expanded uncertainties estimated in accordance with the Guide to the Expression of Uncertainty in Measurement (GUM) with a coverage factor of k = 2, corresponding to a level of confidence of about 95 %. The following values were assigned.
Certified values
ERM-EC590
[g/kg] ERM-EC591
[g/kg] Br 2.13 ± 0.09 2.08 ± 0.07 2,4,4'-TriBDE (BDE-28) 0.0025 ± 0.0006 2,2',4,4'-TetraBDE (BDE-47) 0.23 ± 0.04 0.245 ± 0.023 2,2',3,4,4'-PentaBDE (BDE-99) 0.30 ± 0.06 0.32 ± 0.04 2,2',4,4',6-PentaBDE (BDE-100) 0.063 ± 0.016 0.066 ± 0.007 2,2',4,4',5,5'-HexaBDE (BDE-153) 0.047 ± 0.012 0.044 ± 0.010 2,2',4,4',5,6'-HexaBDE (BDE-154) 0.026 ± 0.007 0.026 ± 0.006 2,2',3,4,4',5,6'-HeptaBDE (BDE-183) 0.132 ± 0.012 0.087 ± 0.008 2,2',3,3',4,4',6,6'-OctaBDE + 2,2',3, 4,4',5,6,6'-OctaBDE (BDE-197+204)
0.076 ± 0.015 0.052 ± 0.009
DecaBDE (BDE-209) 0.65 ± 0.010 0.78 ± 0.09 DecaBB (BB-209) 0.63 ± 0.10 0.74 ± 0.08
Indicative values
ERM-EC590
[g/kg] ERM-EC591
[g/kg] Sb 0.756 ± 0.025 0.713 ± 0.022

2
3
TABLE OF CONTENTS Abstract...................................................................................................................................1 Table of Contents ...................................................................................................................3 Glossary ..................................................................................................................................4 1 Introduction.....................................................................................................................5 2 Participants .....................................................................................................................7 3 Processing ......................................................................................................................9
3.1 Material selection......................................................................................................9 3.2 Processing................................................................................................................9
4 Assessment of homogeneity.......................................................................................10 4.1 Between-bottle homogeneity ..................................................................................10 4.2 Within-bottle heterogeneity and Minimum sample intake .......................................15
5 Assessment of stability ...............................................................................................16 6 Characterisation ...........................................................................................................20
6.1 Selection of participants..........................................................................................20 6.2 Setup ......................................................................................................................20 6.3 Technical Evaluation ..............................................................................................21 6.4 Statistical evaluation...............................................................................................23
7 Value assignment .........................................................................................................25 7.1 Certified values.......................................................................................................25 7.2 Indicative values .....................................................................................................26 7.3 Additional Material information ...............................................................................27 7.4 Confirmation of assigned values.............................................................................27
8 Metrological traceability ..............................................................................................30 9 Commutability...............................................................................................................30 10 Instructions for use ......................................................................................................31
10.1 Storage conditions..................................................................................................31 10.2 Safety and protection of the environment ...............................................................31 10.3 Handling of the material..........................................................................................31 10.4 Use of the certified values ......................................................................................31
11 References ....................................................................................................................32 12 Acknowledgements......................................................................................................33 13 Annex(es) ......................................................................................................................33

4
GLOSSARY ANOVA Analysis of variance BFR Brominated flame retardant CRM Certified reference material ECNI Electron capture negative
ionisation ERM® European Reference Materials GC Gas chromatography HPLC High performance liquid
chromatography IA-MS Ion attachment-mass
spectrometry IC Ion chromatography ICP-MS Inductively coupled plasma-mass
spectrometry IEC International Electrotechnical
Commission (I)NAA (Instrumental) neutron activation
analysis ISO International Organization for
Standardization k0NAA Neutron activation analysis using
the k0-method for quantification MS Mass spectrometry (P)BB (Poly) brominated biphenyl (P)BDE (Poly)brominated diphenyl ether PCB Polychlorinated biphenyl PE Polyethylene PLE Pressurized liquid extraction (=
accelerated solvent extraction) PP Polypropylene PTV Programmable temperature
vaporizor Q-MS Quadrupole mass spectrometer QCM Quality control material RoHS EU Directive on "Restriction of the
use of certain hazardous substances in electrical and
electronic equipment", Directive 2002/95/EC
SF-MS Sectorfield mass spectrometer SRM® Standard reference material UV Ultraviolet WDXRF Wavelength-dispersive X-ray
fluorescence spectrometry MSB Mean square among groups from
an ANOVA MSW Mean square within groups from
an ANOVA p Number of laboratories s Standard deviation of dataset
means in the characterisation study
sbb Between-unit variability sbetween Standard deviation between-
groups (ANOVA) sR Reproducibility standard deviation swb Standard deviation within bottle swithin Standard deviation within groups
(ANOVA) u*
bb Between-bottle heterogeneity that could be hidden by method repeatability
ubb Uncertainty related to a possible between-bottle heterogeneity
uCRM Combined uncertainty of the certified value
uchar Uncertainty of the characterisation
UCRM Expanded uncertainty of a certified value
ults Uncertainty of long-term stability uoutl Uncertainty estimated from
outliers usts Uncertainty of short-term stability

5
1 INTRODUCTION The European Commission's Directive on the “Restriction of the use of certain hazardous substances in electrical and electronic equipment” (RoHS) [1 ] bans the use of certain polybrominated flame retardants (BFRs) in electric and electronic devices since the 1st of July 2006 unless no technical substitutes exist. Commission Decision 2005/618/EC sets limit values of 1 g/kg (0.1 %) for the sum of polybrominated biphenyls (PBBs) and polybrominated diphenyl ethers (PBDEs) in plastics [2]. Decabrominated diphenylether (Deca-BDE) was originally exempted [3], but this exemption was annulled by the European Court of Justice [4] for procedural errors. Similar legislation to the European RoHS Directive has been adopted by Australia, Canada, Korea, Taiwan, the People's Republic of China, Japan and several states in the USA (e.g. Washington, Maine). Actual enforcement of this directive requires – amongst other measures - also testing of materials and products for their content of BFRs. Reliable quality of the determination of BFRs is therefore crucial.
PBDEs belong to a class of brominated compounds that are structurally comparable to polychlorinated biphenyls (PCBs), and therefore share the same numbering of congeners as proposed by Ballschmiter et al. [5]. PBDEs are commercially available as technical mixtures, consisting of various congeners, the average degree of bromination of which is used to derive the name. For example, technical Penta-BDE has on average 5 bromine atoms per diphenylether, although it consists of various tetra-, penta- and hexabrominated congeners. The composition of two technical mixtures of Penta- and Octa-BDE is given in Table 1 [6]. Technical Deca-BDE and Deca-BB are relatively pure substances, consisting of at least 97 % BDE-209 and BB-209, respectively. Congener patterns depend on the reaction conditions and can vary from producer to producer and even from batch to batch.
Table 1: Composition of the technical mixtures of Penta- and Octa-BDE from Great Lakes Chemicals. Number in brackets give the main congeners.
technical Penta-BDE technical Octa-BDE tetrabrominated BDEs 35% (BDE-47) pentabrominated BDEs 56 % (BDE-99, -100) hexabrominated BDEs 9 % (BDE-153, 154) 8 % (BDE-153) heptabrominated BDEs 40 % (BDE-183) octabrominated BDEs 36 %% (BDE-196, BDE-197, BDE-203)nonabrominated BDEs 15 % (BDE-207)
Mass fractions of intentionally added BFRs to polymers range from 10 to 30 % and are thus far above the limits stipulated by the RoHS Directive, but concentrations near the legal limit are possible for recycled plastics. Considerable loads of BFRs in videocassettes made from recycled plastics have been already reported [7].
Several organisations developed standardised methods in order to improve analytical performance in the determination of PBDEs in polymers, but none of these include PBBs. The German Federal Environment Agency (UBA) commissioned the Federal Institute for Materials Research and Testing (BAM) to develop and validate a method for the analysis of technical mixtures of Penta- and Octa-BDE in plastics. Relative repeatability and reproducibility standard deviations in four polymers fortified around 1 g/kg were 4 and 25 %, respectively [ 8 ]. In addition, Working Group 3 of the technical committee 111 of the International Electrotechnical Commission has developed a standard method for all RoHS relevant substances, which includes a method for BFRs in an informative annex. This draft standard follows largely the German method for BFRs, but also includes Deca-BDE. At present, the voting draft has been accepted.
In order to provide the analytical laboratories with the necessary tools for adequate quality assurance and quality control during PBDE analysis in polymers, the Institute for Reference

6
Materials and Measurements (IRMM), one of the institutes of the European Commission's Joint Research Centre (JRC), has decided to produce two reference materials for PBDEs and PBBs in polymers. The materials should be certified for individual PBDE and PBB congeners as well as for total Br, as screening for Br is frequently used to identify potentially incompliant samples. Only indicative values for Sb were regarded necessary, as Sb itself is not restricted by the RoHS directive, but, as Sb2O3 is commonly used as synergist for BFRs, is also sometimes used for screening purposes.
7
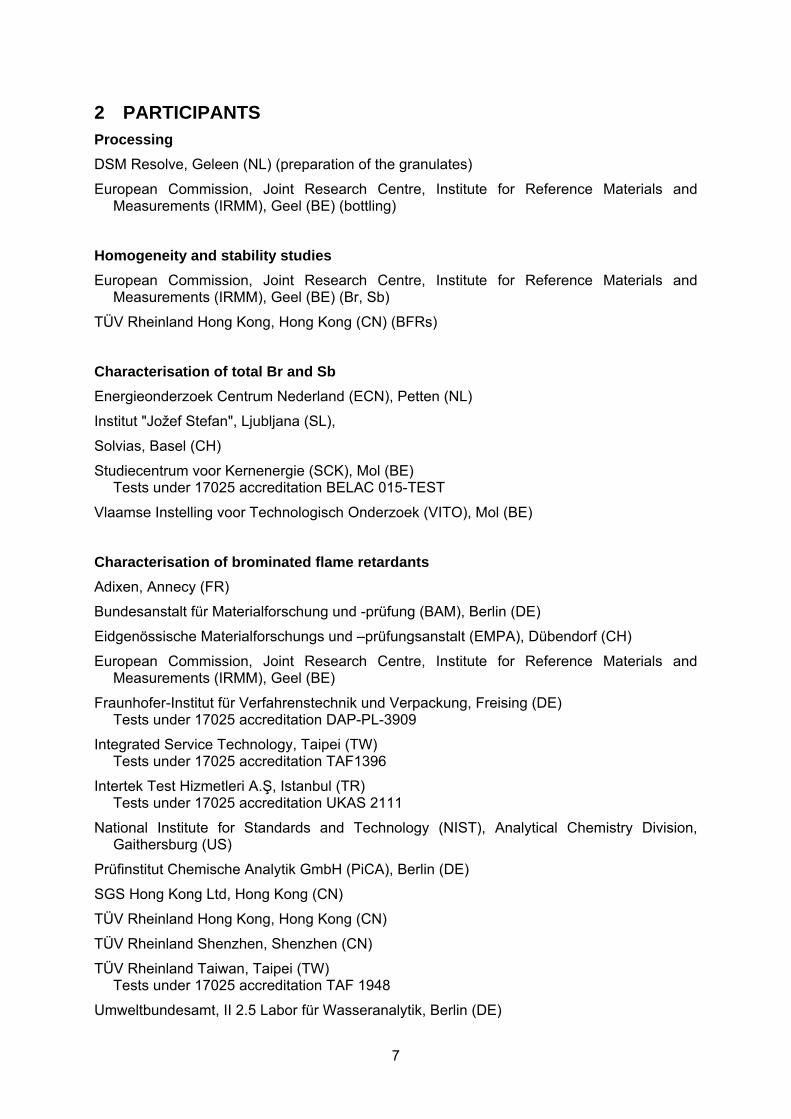
2 PARTICIPANTS Processing DSM Resolve, Geleen (NL) (preparation of the granulates)
European Commission, Joint Research Centre, Institute for Reference Materials and Measurements (IRMM), Geel (BE) (bottling)
Homogeneity and stability studies European Commission, Joint Research Centre, Institute for Reference Materials and
Measurements (IRMM), Geel (BE) (Br, Sb)
TÜV Rheinland Hong Kong, Hong Kong (CN) (BFRs)
Characterisation of total Br and Sb Energieonderzoek Centrum Nederland (ECN), Petten (NL)
Institut "Jožef Stefan", Ljubljana (SL),
Solvias, Basel (CH)
Studiecentrum voor Kernenergie (SCK), Mol (BE) Tests under 17025 accreditation BELAC 015-TEST
Vlaamse Instelling voor Technologisch Onderzoek (VITO), Mol (BE)
Characterisation of brominated flame retardants Adixen, Annecy (FR)
Bundesanstalt für Materialforschung und -prüfung (BAM), Berlin (DE)
Eidgenössische Materialforschungs und –prüfungsanstalt (EMPA), Dübendorf (CH)
European Commission, Joint Research Centre, Institute for Reference Materials and Measurements (IRMM), Geel (BE)
Fraunhofer-Institut für Verfahrenstechnik und Verpackung, Freising (DE) Tests under 17025 accreditation DAP-PL-3909
Integrated Service Technology, Taipei (TW) Tests under 17025 accreditation TAF1396
Intertek Test Hizmetleri A.Ş, Istanbul (TR) Tests under 17025 accreditation UKAS 2111
National Institute for Standards and Technology (NIST), Analytical Chemistry Division, Gaithersburg (US)
Prüfinstitut Chemische Analytik GmbH (PiCA), Berlin (DE)
SGS Hong Kong Ltd, Hong Kong (CN)
TÜV Rheinland Hong Kong, Hong Kong (CN)
TÜV Rheinland Shenzhen, Shenzhen (CN)
TÜV Rheinland Taiwan, Taipei (TW) Tests under 17025 accreditation TAF 1948
Umweltbundesamt, II 2.5 Labor für Wasseranalytik, Berlin (DE)

8
Umweltbundesamt, Umweltanalytik & Chemikalien, Wien (AT)
VDE Prüf- und Zertifizierungsinstitut, Offenbach (DE)
Vlaamse Instelling voor Technologisch Onderzoek (VITO), Mol (BE)
Wageningen IMARES Institute for Marine Resources & Ecosystem Studies, IJmuiden (NL)

9
3 PROCESSING 3.1 MATERIAL SELECTION After consultation with experts in the field, it was decided to produce two materials based on a polymer partly soluble in common solvents and a polymer insoluble in common solvents, in order to cover as many analytical challenges as possible. The first case would test the removal of dissolved matrix, which can strongly interfere with the determination of BFRs, whereas the second material would be more challenging to extract. Finally, polyethylene (PE) was selected as soluble polymer and polypropylene (PP) as insoluble polymer.
Penta-BDE, Octa-BDE, Deca-BDE and Deca-BB were chosen as substances banned by the RoHS directive. It was aimed at achieving mass fractions not too far away from the legal limit for each technical mixture, while being not too far above the legal limit for the sum of all substances.
3.2 PROCESSING Two batches of 90 kg of material were prepared from commercial PE and PP (both from Sabic, NL). No additives were added to the PE material. The lubricant Ca-stearate and the antioxidants Irgafos 168 and Irganox 1010 were added to the PP material.
The granulates were fortified with technical mixtures of Penta-, Octa- and Deca-BDE as well as with a technical mixture of Deca-BB. Deca-BDE (Saytex 102™) and Deca-BB (Adine 102™) were provided by Albemarle Corp, Louvain-La-Neuve (BE). The supplier of the technical mixture of Penta-BDE and Octa-BDE wished to remain confidential. In addition, Sb2O3 was added to simulate real samples, where Sb2O3 is usually added as synergist to the BFRs. The approximate composition of the two materials is given in Table 2.
Table 2: Nominal composition of the two reference materials.
ERM-EC590 ERM-EC591 Matrix Polyethylene Polypropylene Additives none Ca-stearate, Irgafos 1638,
Irganox 1010 technical Penta-BDE 0.7 g/kg 0.7 g/kg technical Octa-BDE 0.25 g/kg 0.20 g/kg technical Deca-BDE 0.7 g/kg 0.7 g/kg technical Deca-BB 0.7 g/kg 0.7 g/kg Sb2O3 0.8 g/kg 0.8 g/kg
Samples were extruded several times and 20 g each were filled into amber glass bottle. Samples have been stored at 4 °C ever since.

10
4 ASSESSMENT OF HOMOGENEITY Key requirement for any reference material is equivalence between the various units. In this respect, it is not relevant whether the variation between units is significant compared to the analytical variation, but whether this variation is significant to the certified uncertainty. Consequently, ISO Guide 35 demands RM producers to quantify the between bottle variation. This aspect is covered in between-unit homogeneity studies.
Within-unit heterogeneity does not influence the uncertainty of the certified value, but determines the minimum size of subsample that is representative for the whole unit. Quantification of within-unit heterogeneity is therefore necessary to determine the minimum sample intake.
4.1 BETWEEN-BOTTLE HOMOGENEITY Quantification of between-bottle heterogeneity is most easily done by analysis of variance (ANOVA), which can separate the between-bottle variation (sbb) from the within-bottle variation (swb). The latter is equivalent to the analytical variation if the individual subsamples are representative for the whole bottle. Evaluation by ANOVA requires bottle averages to follow at least a unimodal distribution and results for each bottle to follow unimodal distributions with approximately the same standard deviations. Distribution of the bottle averages can easily be checked, but too few data are available for each bottle to make a clear statement of the distribution of individual results. Therefore, it was checked whether all individual data follow a unimodal distribution. Minor deviations from unimodality of the individual values do not grossly affect the estimate of between-unit standard deviations.
One has to bear in mind that sbb and swb are estimates of the true standard deviations and therefore subject to random fluctuations. Therefore, the mean square between groups (MSB) can be smaller than the mean squares within groups (MSW), resulting in negative arguments under the square root used for the estimation of the between-bottle variation, whereas the true variation cannot be lower than zero. In this case, u*
bb, the maximum heterogeneity that could be hidden by method repeatability, was calculated as described by Linsinger et al. [9]. u*
bb is comparable to the limit of detection of an analytical method, yielding the maximum heterogeneity that might be undetected by the given study setup.
Between-bottle homogeneity was tested on 20 samples. Samples were taken using a random-stratified sampling scheme, thus ensuring that the complete batch was covered. Four replicate determinations per bottle were performed under repeatability conditions by wavelength dispersive x-ray fluorescence spectrometry (WDXRF) (Br, Sb) and ultrasonic extraction with toluene and subsequent quantification by GC-MS (BFRs). Sample intakes were 4 g for WDXRF and 0.5 g for GC-MS.
A second subset of 20 bottles covering the whole batch had been taken for the stability testing during storage (see below). Also these samples were selected from the whole batch following a random stratified sampling scheme. Also these samples were analysed under repeatability conditions in one analytical run. As no influence of time and temperature was found for any of the conditions tested for the congeners concerned, the data from these studies were used to gain additional information on material homogeneity when outliers, bimodal distributions or trends in the filling sequence were found. To do this, storage information was ignored and only the bottle number was taken into consideration. These data were subjected to the same evaluations as the samples originally used for homogeneity.
Grubbs-tests at 99 % confidence levels were performed to detect potentially outlying individual results as well as outlying bottle averages. Regression analyses were performed to evaluate potential trends in the analytical sequence as well as trends in the filling sequence. It was furthermore checked whether the individual data and bottle averages follow normal
11
distributions using normal probability plots and whether the individual data are unimodally distributed using histograms.
Results were corrected for their trend in the analytical sequence if the trend was significant on at least a 95 % confidence level as shown below.
ibresult measuredresult corrected ⋅−=
b slope of the linear regression
i position of the result in the analytical sequence
As the analytical sequence and the bottle numbers were not correlated, this correction improved the sensitivity of the subsequent statistical analysis through a reduction in analytical variation without masking potential between-unit heterogeneities.
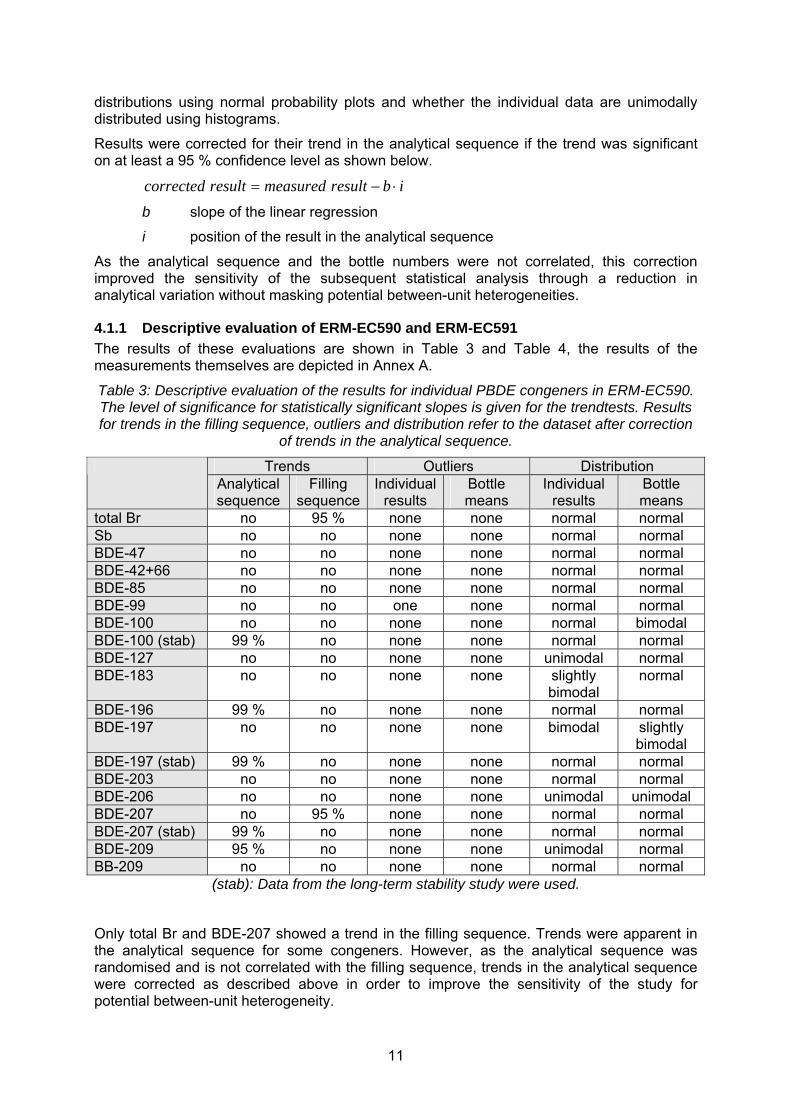
4.1.1 Descriptive evaluation of ERM-EC590 and ERM-EC591 The results of these evaluations are shown in Table 3 and Table 4, the results of the measurements themselves are depicted in Annex A.
Table 3: Descriptive evaluation of the results for individual PBDE congeners in ERM-EC590. The level of significance for statistically significant slopes is given for the trendtests. Results for trends in the filling sequence, outliers and distribution refer to the dataset after correction
of trends in the analytical sequence.
Trends Outliers Distribution Analytical sequence
Filling sequence
Individual results
Bottle means
Individual results
Bottle means
total Br no 95 % none none normal normal Sb no no none none normal normal BDE-47 no no none none normal normal BDE-42+66 no no none none normal normal BDE-85 no no none none normal normal BDE-99 no no one none normal normal BDE-100 no no none none normal bimodal BDE-100 (stab) 99 % no none none normal normal BDE-127 no no none none unimodal normal BDE-183 no no none none slightly
bimodal normal
BDE-196 99 % no none none normal normal BDE-197 no no none none bimodal slightly
bimodal BDE-197 (stab) 99 % no none none normal normal BDE-203 no no none none normal normal BDE-206 no no none none unimodal unimodal BDE-207 no 95 % none none normal normal BDE-207 (stab) 99 % no none none normal normal BDE-209 95 % no none none unimodal normal BB-209 no no none none normal normal
(stab): Data from the long-term stability study were used.
Only total Br and BDE-207 showed a trend in the filling sequence. Trends were apparent in the analytical sequence for some congeners. However, as the analytical sequence was randomised and is not correlated with the filling sequence, trends in the analytical sequence were corrected as described above in order to improve the sensitivity of the study for potential between-unit heterogeneity.
12
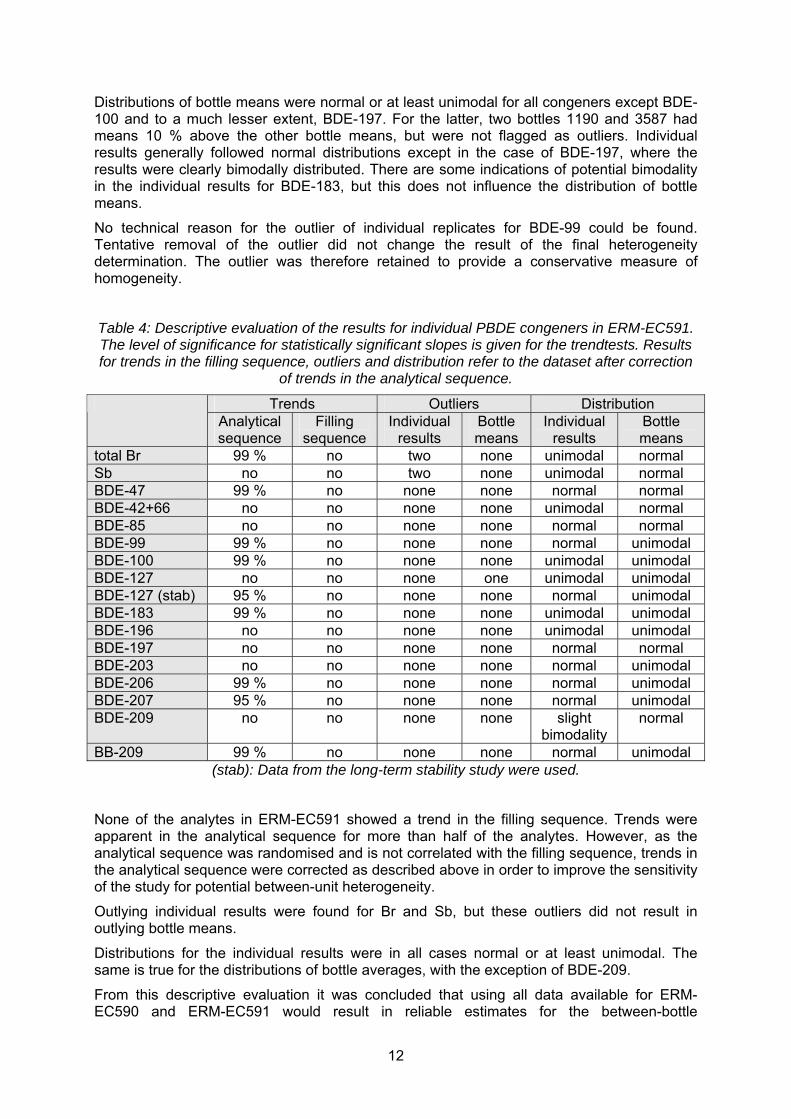
Distributions of bottle means were normal or at least unimodal for all congeners except BDE-100 and to a much lesser extent, BDE-197. For the latter, two bottles 1190 and 3587 had means 10 % above the other bottle means, but were not flagged as outliers. Individual results generally followed normal distributions except in the case of BDE-197, where the results were clearly bimodally distributed. There are some indications of potential bimodality in the individual results for BDE-183, but this does not influence the distribution of bottle means.
No technical reason for the outlier of individual replicates for BDE-99 could be found. Tentative removal of the outlier did not change the result of the final heterogeneity determination. The outlier was therefore retained to provide a conservative measure of homogeneity.
Table 4: Descriptive evaluation of the results for individual PBDE congeners in ERM-EC591. The level of significance for statistically significant slopes is given for the trendtests. Results for trends in the filling sequence, outliers and distribution refer to the dataset after correction
of trends in the analytical sequence.
Trends Outliers Distribution Analytical sequence
Filling sequence
Individual results
Bottle means
Individual results
Bottle means
total Br 99 % no two none unimodal normal Sb no no two none unimodal normal BDE-47 99 % no none none normal normal BDE-42+66 no no none none unimodal normal BDE-85 no no none none normal normal BDE-99 99 % no none none normal unimodal BDE-100 99 % no none none unimodal unimodal BDE-127 no no none one unimodal unimodal BDE-127 (stab) 95 % no none none normal unimodal BDE-183 99 % no none none unimodal unimodal BDE-196 no no none none unimodal unimodal BDE-197 no no none none normal normal BDE-203 no no none none normal unimodal BDE-206 99 % no none none normal unimodal BDE-207 95 % no none none normal unimodal BDE-209 no no none none slight
bimodality normal
BB-209 99 % no none none normal unimodal (stab): Data from the long-term stability study were used.
None of the analytes in ERM-EC591 showed a trend in the filling sequence. Trends were apparent in the analytical sequence for more than half of the analytes. However, as the analytical sequence was randomised and is not correlated with the filling sequence, trends in the analytical sequence were corrected as described above in order to improve the sensitivity of the study for potential between-unit heterogeneity.
Outlying individual results were found for Br and Sb, but these outliers did not result in outlying bottle means.
Distributions for the individual results were in all cases normal or at least unimodal. The same is true for the distributions of bottle averages, with the exception of BDE-209.
From this descriptive evaluation it was concluded that using all data available for ERM-EC590 and ERM-EC591 would result in reliable estimates for the between-bottle
13
heterogeneity for Br, Sb and all BFRs when the results from long-term stability are used as well.
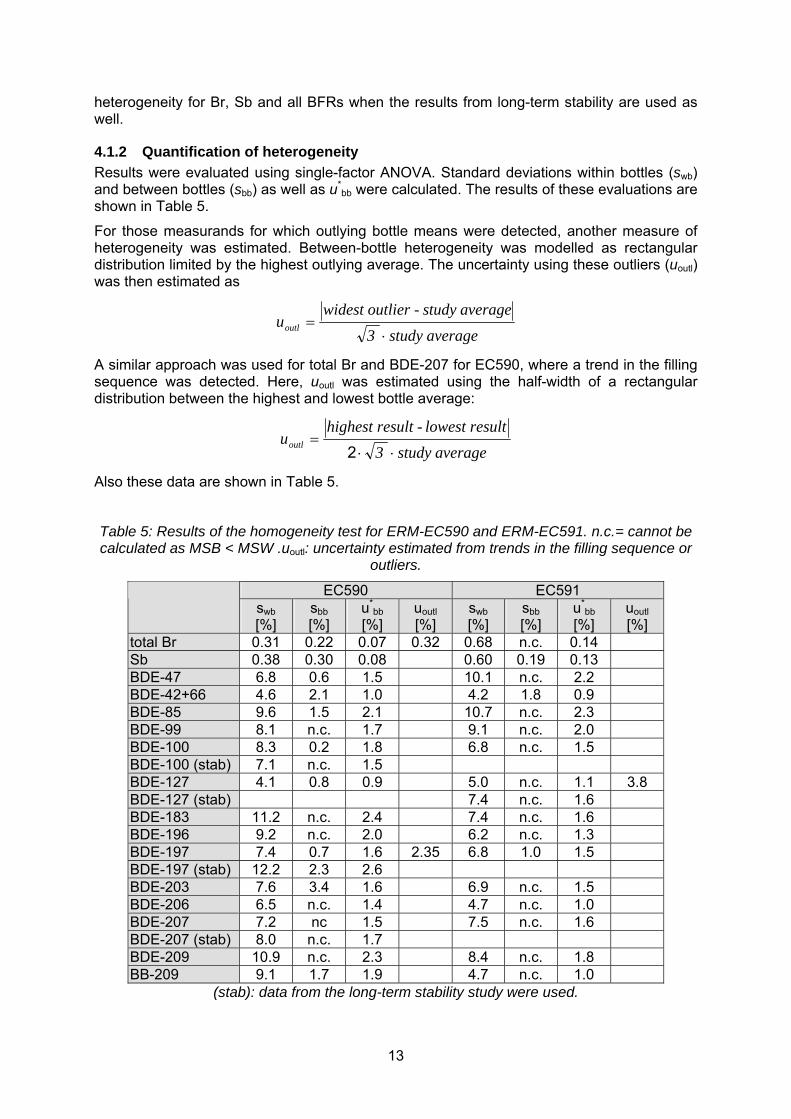
4.1.2 Quantification of heterogeneity Results were evaluated using single-factor ANOVA. Standard deviations within bottles (swb) and between bottles (sbb) as well as u*
bb were calculated. The results of these evaluations are shown in Table 5.
For those measurands for which outlying bottle means were detected, another measure of heterogeneity was estimated. Between-bottle heterogeneity was modelled as rectangular distribution limited by the highest outlying average. The uncertainty using these outliers (uoutl) was then estimated as
averagestudy 3average study - outlier widest
uoutl⋅
=
A similar approach was used for total Br and BDE-207 for EC590, where a trend in the filling sequence was detected. Here, uoutl was estimated using the half-width of a rectangular distribution between the highest and lowest bottle average:
averagestudy 3result lowest - result highest
uoutl⋅⋅
=2
Also these data are shown in Table 5.
Table 5: Results of the homogeneity test for ERM-EC590 and ERM-EC591. n.c.= cannot be calculated as MSB < MSW .uoutl: uncertainty estimated from trends in the filling sequence or
outliers.
EC590 EC591 swb [%]
sbb [%]
u*bb
[%] uoutl [%]
swb [%]
sbb [%]
u*bb
[%] uoutl [%]
total Br 0.31 0.22 0.07 0.32 0.68 n.c. 0.14 Sb 0.38 0.30 0.08 0.60 0.19 0.13 BDE-47 6.8 0.6 1.5 10.1 n.c. 2.2 BDE-42+66 4.6 2.1 1.0 4.2 1.8 0.9 BDE-85 9.6 1.5 2.1 10.7 n.c. 2.3 BDE-99 8.1 n.c. 1.7 9.1 n.c. 2.0 BDE-100 8.3 0.2 1.8 6.8 n.c. 1.5 BDE-100 (stab) 7.1 n.c. 1.5 BDE-127 4.1 0.8 0.9 5.0 n.c. 1.1 3.8 BDE-127 (stab) 7.4 n.c. 1.6 BDE-183 11.2 n.c. 2.4 7.4 n.c. 1.6 BDE-196 9.2 n.c. 2.0 6.2 n.c. 1.3 BDE-197 7.4 0.7 1.6 2.35 6.8 1.0 1.5 BDE-197 (stab) 12.2 2.3 2.6 BDE-203 7.6 3.4 1.6 6.9 n.c. 1.5 BDE-206 6.5 n.c. 1.4 4.7 n.c. 1.0 BDE-207 7.2 nc 1.5 7.5 n.c. 1.6 BDE-207 (stab) 8.0 n.c. 1.7 BDE-209 10.9 n.c. 2.3 8.4 n.c. 1.8 BB-209 9.1 1.7 1.9 4.7 n.c. 1.0
(stab): data from the long-term stability study were used.

14
The good repeatability of the measurements for Br and Sb allows setting very tight limits for potential heterogeneity. The studies demonstrated that the potential between-unit variation in both materials for Br and Sb is below 0.4 %, which is small enough to make the materials suitable as reference materials.
For BFRs, the frequent occurrence of MSB<MSW (n.c. in Table 5) demonstrates that material heterogeneity is smaller than can be detected for many congeners. For four congeners (BDE-100, -197 and -207 in EC590 and BDE-127 in EC591), assessments were made using data from the stability studies. The question now arises which results are more reliable. For this, it has to be borne in mind that BDE-127, BDE-197, BDE-203 and BDE-207 were not added as single compounds but as parts of mixtures of several congeners. The physicochemical characteristics of the various congeners cover a continuum from the lower brominated ones to the highly brominated ones. A de-mixing of selected congeners during processing was therefore deemed impossible. It was therefore concluded that the bimodal distributions for BDE-100 and -197 (EC590), the trend in the filling sequence for BDE-207 (EC590) and the outlying bottle average for BDE-127 (EC591) are results of analytical artefacts and do not reflect the real distribution of these analytes in the material. Therefore, the results from the stability data were used. The assessment of homogeneity for individual congeners demonstrated that between-unit variation for the individual congeners is below 3 % for all congeners, which is negligible compared to the method variability usually observed.
The materials are therefore sufficiently homogeneous to serve as reference materials.
BDE-28, -153 and -154 were not determined in the study. As stated above, the two congeners were not added individually but as part of technical mixtures of various congeners. The distribution of these congeners in the material can only be heterogeneous, if selective de-mixing or enrichment or evaporation of these congeners occurred during processing. The chemical properties of BDE-28, -153 and -154 are very similar to those of the other congener. The same is true for the phzsical properties: While it is true that BDE-28 is more volatie than the other congeners, its vapour pressure at processing temperatures is still low enough to make selective evaporation unlikely. Therefore, homogeneity of these congeners was assessed from the homogeneity of the other congeners. The highest uncertainty contribution of all congeners for a particular material was therefore used as conservative estimate of the uncertainty of homogeneity for BDE-28, -153 and -154.
The between-unit heterogeneity (ubb) was therefore estimated as the larger value of sbb or u*
bb. The results from the stability studies were used for BDEs-100, 197 and -207 (EC590) and BDE-127 (EC591) whereas uoutl was used for total Br for EC590. For BDE-28, -153 and BDE-154 which were not determined in the study, the highest result of the other congeners for the material in question was used. The values are listed in Table 6.

15
Table 6: Summary of the estimates of between-unit heterogeneity for ERM-EC590 and ERM-EC591.
EC590 ubb [%]
EC591 ubb [%]
Total Br 0.32 0.14 Sb 0.30 0.19 BDE-28 2.6 2.3 BDE-47 1.5 2.2 BDE-42+66 2.1 0.9 BDE-85 2.1 2.3 BDE-99 1.7 2.0 BDE-100 1.5 1.5 BDE-127 0.9 1.6 BDE-153 2.6 2.3 BDE-154 2.6 2.3 BDE-183 2.4 1.6 BDE-196 2.0 1.3 BDE-197 2.6 1.5 BDE-203 1.6 1.5 BDE-206 1.4 1.0 BDE-207 1.7 1.6 BDE-209 2.3 1.8 BB-209 1.9 1.0
4.2 WITHIN-BOTTLE HETEROGENEITY AND MINIMUM SAMPLE INTAKE Within-bottle heterogeneity is closely correlated to the minimum sample intake. Due to the intrinsic heterogeneity, individual subsamples of a material will not contain the same amount of analyte. The minimum subsample that is representative for the complete bottle is the minimum sample intake. The larger the intrinsic heterogeneity, the larger the minimum sample intake.
Minimum sample intake was determined from the results of the characterisation study, using the method information supplied by the participants. The smallest sample intake that still yielded results with a repeatability and accuracy acceptable to be included in the respective studies was taken as minimum sample intake. Using the data from Annex C and D, the following minimum sample intakes are derived:
Total Br: 30 mg
Sb: 200 mg
BFRs: 30 mg of ground material
16
5 ASSESSMENT OF STABILITY Time, temperature and radiation were regarded as the most relevant influences on stability of the materials. The influence of ultraviolet or visible radiation was minimised by the choice of container: the brown glass bottles absorb most of the incoming radiation. In addition, materials are stored and dispatched in the dark, thus practically eliminating the possibility of radiative degradation. Therefore, only the influences of time and temperature needed to be investigated. The most relevant degradation pathway was assumed to be "blooming", i.e. a diffusion of the flame retardants to the surface of the polymer. Blooming is well documented and results in increased loads of some BFRs in household dust [10]. Blooming usually follows Fick's law [11], with higher temperatures leading to faster diffusion.
Stability testing is necessary to establish conditions for dispatch to the customers as well as conditions for storage. The stability studies were conducted as isochronous stability studies [12]. In this type of studies, samples are stored for a certain interval at the test conditions. After that time, samples are moved to conditions where further degradation is negligible ("reference condition"), effectively "freezing" the degradation status of the materials. This setup allows analysis of materials of various exposure times under repeatability conditions, thus greatly improving the sensitivity of the study to detect degradation.
Samples were stored for 0, 4, 8 and 12 months at 4 °C, 18 °C and 60 °C respectively. Storage at -20 °C was defined as reference condition for all studies. Two bottles were stored for each time/temperature combination. After the end of the study, four measurements were performed on each bottle, giving in total 8 results per time/temperature combination (2 bottles x 4 replicates). Measurements were performed by WDXRF (Br, Sb) and ultrasonic extraction with toluene and subsequent quantification by GC-MS (BFRs), respectively.
The studies were evaluated individually for each temperature. Results were screened for outliers using a Grubbs test, but only outliers that were dubious on technical grounds were excluded. Linear regressions were performed and the slopes were tested for significance on 95 % confidence levels. In addition to the evaluation per temperature, data for all temperatures for a given congener were combined into a single dataset. This was possible as all measurements for each study had been randomised over the whole analytical sequence. The data therefore can be regarded as forming one large dataset. This combination therefore increases the power of the statistical regression analysis for the combined studies. The results of these evaluations are summarised in Table 7 and Table 8, whereas graphical representations of the studies are given in Annex B.

17
Table 7: Results of the evaluation of the one-year stability studies for ERM-EC590.
Analyte 4 °C 18 °C 60 °C All temp. combined
Outl. Slope Outl. Slope Outl. Slope Outl. Slope Br none not sig. none sig. none 99 % not combined Sb 1 (ret.) not sig. none not sig. 1 (ret.) not sig. not combined BDE-47 none not sig. none not sig. none not sig. none not sig. BDE-42+66
2 (ret) 95 % none 95 % none not sig. 1(ret) not sig
BDE-85 none not sig. none not sig. none not sig. none not sig. BDE-99 none not sig. none not sig. none not sig. none not sig. BDE-100 none not sig. none not sig. none not sig. none not sig. BDE127 none not sig. none not sig. none 99 % none not sig. BDE-183 none not sig. none not sig. none not sig. none not sig. BDE-196 1 (ret) not sig. 1 (ret) not sig. none not sig. none not sig. BDE-197 none not sig. none not sig. none not sig. none not sig. BDE-203 none not sig. none not sig. none not sig. none not sig. BDE-206 none not sig. none not sig. none not sig. none not sig. BDE-207 none not sig. none not sig. none not sig. none not sig. BDE-209 none not sig. none not sig. none not sig. none not sig. BB-209 1 (ret) not sig. none not sig. 1 (ret) not sig. none not sig.
Outl.: number of outlying individual values; (ret): outlier was retained;sig./not sig.: significance on a 95 % confidence level.
Table 8: Results of the evaluation of the stability studies for ERM-EC591.
Analyte 4 °C 18 °C 60 °C All temp. combined
Outl. Slope Outl. Slope Outl. Slope Outl. Slope Br 1 (ret) not sig. none not sig. 2(ret) 99 % not combined Sb none not sig. none not sig. none not sig. not combined BDE-47 1 (ret) not sig none not sig. none not sig. 1 (ret) not sig. BDE-42+66 none not sig. none not sig. 1 (ret) not sig. 2 (ret) not sig. BDE-85 none not sig. none not sig. none not sig. none not sig. BDE-99 none not sig. none not sig. none not sig. none not sig. BDE-100 none not sig. none not sig. 1 (ret) not sig. 2 (ret) not sig. BDE-127 none not sig. 1 (ret) not sig none not sig. 1 (ret) not sig BDE-183 none not sig. none not sig. none not sig. none not sig. BDE-196 none not sig. none not sig. none not sig. none not sig. BDE-197 none not sig. none not sig. none not sig. none not sig. BDE-203 none not sig. none not sig. none not sig. none not sig. BDE-206 1 (ret) not sig. none not sig. 2 (ret) not sig. 2 (ret) not sig. BDE-207 none not sig. none not sig. none not sig. none not sig. BDE-209 none not sig. none not sig. none not sig. none not sig. BB-209 none not sig. none not sig. none not sig. none not sig.
Outl.: number of outlying individual values; (ret): outlier was retained;sig./not sig.: significance on a 95 % confidence level.
18
Some outlying individual results were found for both materials. However, removal of these results did not affect the result on the significance of the slopes. As no technical reason for exclusion was found and as retention leads to a conservative estimate for the uncertainty of degradation, the results were retained.
The slopes for Br were significant for storage at 18 and 60 °C in ERM-EC590 and for storage at 60 °C in ERM-EC591. These slopes indicate loss of Br, which can be explained by evaporation of some BFRs. In contrast, BDE-127 shows a statistically significant increasing trend at 60 °C, which would only possible by selective degradation of other congeners. This was considered very unlikely. None of the other slopes was found significant on a 95 % confidence level. The same holds true for the combined datasets for the BFRs. This indicates slight changes of the total Br content upon storage at 60 °C, whereas no indication of degradation of any of the other analytes, regardless of the temperatures was found. However, due to the intrinsic variability of results, degradation cannot be completely ruled out even in the absence of statistically significant trends. It is therefore necessary to quantify the potential degradation that could be obscured by the method repeatability, i.e. to estimate the uncertainty of stability.
As explained above, degradation is expected to proceed faster at 18 and 60 °C than at 4 °C. The combination of the 4, 18 and 60 °C studies therefore gives a conservative estimate for the stability at 4 °C, while minimising the influence of method repeatability on the uncertainty estimate due to the higher number of results per time.
Uncertainties of stability during dispatch and storage were estimated as described in [13] for each analyte. For this approach, the uncertainty of the linear regression line with a slope of zero is calculated. The uncertainty contribution is then estimated as a chosen shelf life multiplied with the uncertainty of the regression lines. The following uncertainties were estimated:
• usts, the uncertainty of degradation during dispatch. This was estimated from the 60 °C studies for a time of 0.25 months (1 week). The uncertainty therefore describes the possible change during a dispatch at 60 °C lasting for one week.
• ults, the stability during storage. This uncertainty contribution was estimated from the 4 °C studies (total Br, Sb) or from the combined studies for a shelf life of 24 months (BFRs). The uncertainty contribution therefore describes the possible degradation for 24 months at 4 °C.
The results of these evaluations are summarised in Table 9.

19
Table 9: Results of the evaluation of the uncertainties of stability for ERM-EC590 and ERM-EC591. usts was estimated for a period of 1 week storage at 60 °C. ults was estimated for a
storage of 24 months at 4 °C from the 1 year/4 °C study for Br and Sb and from the combination of all temperatures for BFRs.
ERM-EC590 ERM-EC591 Analyte usts 60 °C, 1 week
[%] ults4°C,2 years
[%] usts 60 °C, 1 week
[%] ults4°C,2 years
[%] Br 0.009 0.402 0.004 0.306 Sb 0.008 0.632 0.005 0.432 BDE-47 0.1 6.1 < 0.1 2.2 BDE-42+66 0.1 6.7 < 0.1 2.9 BDE-85 0.2 11.5 0.1 7.4 BDE-99 0.1 9.2 0.1 4.3 BDE-100 0.2 12.1 0.1 4.2 BDE-127 0.1 3.4 < 0.1 3.2 BDE-183 < 0.1 3.1 0.1 3.4 BDE-196 0.1 4.4 0.1 5.9 BDE-197 0.1 8.9 0.1 6.8 BDE-203 0.1 6.0 0.2 10.8 BDE-206 0.1 5.8 0.1 6.2 BDE-207 0.1 6.8 0.1 5.2 BDE-209 0.1 6.3 0.1 4.8 BB-209 0.1 5.4 0.1 4.4
As can be seen in Table 9, usts is negligible in all cases. The material can therefore be dispatched under ambient conditions.
Uncertainties of stability during storage are about 0.5 % for total Br and Sb. Due to the significantly worse repeatability of the determination of BFRs, their uncertainties range from 2 to 12 %, depending on the congener. These uncertainties are taken up in the final uncertainties of the certified values and might be reduced in the future, based on the results of the stability monitoring after certification.
BDE-28, -153 and -154 were not determined in the study. Based on the chemical similarity and the known persistence of the congeners, more rapid degradation than for the other congeners can is unlikely for BDE-28, -153 and -154. While BDE-28 is more volatile than the others, its vapour pressure at processing temperatures is still low enough as to prevent significant evaporation losses. Therefore, the highest of value of the study for each material can be taken as conservative estimate for the uncertainty of stability for BDE-28, -153 and -154.

20
6 CHARACTERISATION 6.1 SELECTION OF PARTICIPANTS Participants in the characterisation studies were selected based on criteria that comprised both technical aspects as well as aspects regarding quality management.
Participants for the characterisation of total Br had demonstrated their competence in the determination of Br and Sb in polymers in previous certification exercises. Participants for the characterisation of PBDEs were selected based on participation in intercomparisons for BFRs [8, 14] or method validation reports.
Fulfilment of the quality management requirements ensured that the technical standard was maintained from the time of demonstration to the actual measurement. Most participating laboratories are accredited to ISO 17025, even if the measurements are in many cases not covered by the scope of accreditation. Where measurements are covered by the scope of accreditation, the accreditation number is stated in the list of participants (section 2),.
6.2 SETUP Guiding principle of the characterisation study was randomisation of laboratory bias. To achieve this, the following measures were taken
• Several laboratories were selected to perform independent measurements.
• Different methodologies were employed whenever possible to confirm the absence of method bias. Laboratories were therefore free to select a method of their choice. Results for Br were obtained by k0-neutron activation analysis (k0NAA), instrumental neutron activation analysis (INAA), combustion-ion chromatography (IC), combustion-sectorfield inductively coupled plasma-mass spectrometry (SF-ICP-MS) and combustion – titration. Sb was only determined by k0NAAand INAA, as these methods can simultaneously determine Sb and Br and as only indicative values were aimed for. The methods are described in tabular form in Annex C. Results for BFRs were obtained using different sample preparation techniques (Soxhlet extraction, complete dissolution, ultrasonic extraction, pressurised liquid extraction). Individual BFRs were quantified using gas chromatography-mass spectrometry (GC-MS) with different ionisation (electron impact, negative ionisation) and mass separation techniques (quadrupol, sectorfield). In addition, direct ion-attachment mass-spectrometry (IA-MS) and high performance liquid chromatography (HPLC) with UV detection were applied for confirmatory purposes. The methods are described in tabular form in Annex D.
• Six independent measurements per laboratory were performed. These measurements were spread over at least two days, to ensure within-laboratory reproducibility conditions.
• Independent calibration lines were prepared for all measurements.
• Laboratories performed and reported results for method blanks.
Samples for the characterisation study covered the whole batch and were selected using a random stratified sampling scheme.
Laboratories received quality control samples to demonstrate traceability of their results. For total Br and Sb, the certified reference material ERM-EC681k, "Trace metals in LDPE" with a Br-mass fraction of 770 mg/kg was used. For BFRs, blinded candidate SRM®s 2257 and 2258 (PBDEs in isooctane) from the US National Institute for Standards and Technology (NIST) were used. Laboratories were requested to report the results on these materials together with the results on candidate CRMs ERM-EC590 and EC591.

21
Laboratories were also requested to give estimations of the expanded uncertainties of the mean value of the six results. No approach for the estimation was prescribed, i.e. top-down and bottom-up were regarded as equally valid procedures.
6.3 TECHNICAL EVALUATION
6.3.1 Br and Sb All laboratories received a bottle of ERM-EC681k as quality control sample. The results on this sample could therefore directly be used to check for absence of significant bias. This material has a certified Br content of 770 ± 40 mg/kg, which is about 1/3 of the Br content of the new materials and an Sb content of 99 ± 6 mg/kg. The three sets of results obtained by k0NAA and INAA as well as the results obtained by combustion-IC and combustion-SF-ICP-MS agreed with the certified value for Br within the respective uncertainties. Results by combustion-titration were 10 % below the certified values, with combined uncertainty being only 8.3 %. This agreement was regarded as sufficient to prove traceability of the results of the method. Results from neutron activation tended to be higher than those from destructive methods. However, the results agree within the respective uncertainties. All results were therefore accepted on technical grounds.
As only an indicative value for Sb had been aimed at, only three datasets by k0NAA were obtained for Sb. The results for the certified quality control sample agreed in all cases with the certified values. Therefore, all three datasets were accepted for value assignment. No statistical evaluation was performed, as the number of datasets was too low.
The results of these studies are depicted in Annex E.
6.3.2 PBDEs and BB-209 Two quantitative indicators of technical problems were used, namely the results on the quality control solution and the calculated total Br content. Results on the quality control solution were compared to the candidate certified values, with strong deviations indicating technical problems. Total Br content was calculated from the results submitted by the participants and compared to the total Br content as determined by element specific methods. While the calculated Br content can be below the one determined by element specific methods as often not all congeners were reported, it cannot be above. Results were discussed with the participants. The discussion aimed at identification of potential technical problems in the submitted data:
Laboratory 7 reported results in agreement with the quality control solution. However, results for the polymers were consistently higher than those of the other laboratories. While this is not a problem per se, the Br-content as calculated from these results is 35-40 % above the Br mass fraction as determined by element analysis methods, indicating calibration problems. The results of laboratory 7 were therefore excluded from the evaluation.
Laboratory 8 reported that partial dissolution of the polymers led to a formation of a film in the liner of the GC. This resulted in degradation of BDE-209, as shown by the relatively high ratio of BDE-206/BDE-209 for EC590. EC591 does not dissolve in toluene and is therefore not affected by these issues. Nevertheless, the reported results for BDE-209 and BB-209 were two to three times above the spiking levels, resulting in calculated Br mass fractions far above the ones measured by elemental analysis techniques. The results for the congeners BDE-209 and BB-209 for both materials were therefore excluded from the evaluation.
Laboratory 10 reported that it had corrected its results for the recovery of an internal QC sample, which was 80-85 %. The corrected results were therefore 15-20 % above the results of the other participants. The laboratory re-submitted the uncorrected values after the discussion. As at that time the results of the other laboratories had already been disclosed,
22
these results are not included in the set of results used for value assignment, but are shown for comparison in Annex E.
Laboratory 11 reported low results for all congeners for EC590 except BDE-209 and BB-209. As the laboratory used a high sample intake (1000 mg), a small volume of solvent (10 mL) and a solvent that dissolves EC590 (toluene), matrix effects may have influenced the results for EC590. The results from Laboratory 11 for EC590 were therefore excluded from the evaluation. Results for BDE-209 and BB-209 for EC591 were twice to three times the spiking levels. Due to these results, the Br content calculated from the BFRs for EC591 was 50 % above the mass fraction as determined from elemental methods. The results for BDE-209 and BB-209 for EC591 were therefore also excluded from the evaluation.
Laboratory 12 reported calibration problems for BDE-47. When crosschecked against another standard, the standard used showed only a recovery of 80 %. The results for BDE-47 were therefore excluded from the further evaluation.
Laboratory 13 reported results for the quality control solution that deviated up to an order of magnitude from the candidate certified values, indicating calibration problems. The complete dataset was therefore excluded from evaluation.
Laboratory 18 reported that BB-209 is normally not determined by the laboratory. Evaluation was performed with without internal calibration, which, as confirmed by another laboratory, is inappropriate for this compound. The results for BB-209 were therefore excluded from further evaluation.
Laboratory 19 reported a coelution between BDE-196 and BDE-203 on an RTx-5 column. Measurements on a second column (LC-50) were performed, where a separation is possible. The laboratory also reported separate results for BDE-198 (see also discussion next page).
Laboratory 20 reported results in agreement with the candidate certified value for the quality control solution but consistently high values for all congeners in the polymers. The total Br content as calculated from these results is twice the Br content as determined by element analysis methods. As this is impossible, the complete dataset was excluded from further evaluation.
Laboratory 21 reported problems with a commercial standard: A "certified" commercial standard mixture it had used as internal quality control contained only 50 % of the stated concentration of BDE-209. As this standard mixture had not been used for quantification, results were retained. Only Laboratory 21 had sieved its milled powder to obtain different particle size fractions, which were analysed independently. It reported a strong influence of the particle size on results for higher BDEs: recoveries decrease for larger particle sizes. Finally, the results on the smallest particle size fraction was chosen for reporting of results. This effect seems to be due to a combination of solvent and particle size: Laboratory 21 deliberately chose a solvent (isooctane) with little interaction with the matrix to minimise interferences by with the polymer. Other laboratories using e.g. toluene reported good results, even for samples taken "as is".
The results from the laboratories that use PCB-209 as internal standard do not form a cluster, not even for the determination of BDE-209. PCB-209 therefore seems in principle to be a suitable internal standard.
Literature on possible coelutions on different GC columns indicates that for the columns used in this study, a separation of BDE-197/BDE-204 is often not possible [15]. The results therefore give the sums of these two congeners.

23
Literature data suggest that BDE-198 usually coelutes with BDE-203 [15], whereas no information on BDE-196 is given in this paper. The results for BDE-203 may therefore also be the sum of BDE-198 and -203. However, while laboratories 8, 16, 18 and 21 reported results for BDE-196 and -203, laboratory 19 reported coelution of BDE-196 and 203 on an apparently equivalent column, whereas BDE-198 could be separated. All of these laboratories confirmed the identity of the congeners by the retention time of individual standards. Slight differences between theoretically identical columns therefore seem to cause different coelutions. Due to this unclear situation, no values for BDE-196, -198 and -203 are assigned.
Another potentially critical issue is the method blank for BDE-209, as this congener is used frequently in electric equipment of furniture upholstery and contamination is therefore possible. The method blanks submitted by the participants were investigated. The majority of laboratories that delivered accepted results could not detect any method blanks. The remaining laboratories usually found blanks corresponding to less than 10 mg/kg in a sample. This amount is negligible compared to the mass fraction of BDE-209 in the material (700 mg/kg).
The results of these studies are depicted in Annex E. Note: The graphs in Annex E show expanded uncertainties, not standard deviations. Results with a low standard deviation may well have a large uncertainty.
6.4 STATISTICAL EVALUATION The datasets accepted on technical grounds were tested for outlying means using the Grubbs test and using the Cochran test for outlying standard deviations, (both at a 99 % confidence level) as well as for normality of dataset means using kurtosis/skewness tests and normal probability plots. Standard deviation within (swithin) and between (sbetween) laboratories were calculated using one-way ANOVA. The results of these evaluations are shown in Table 10 and Table 11.
Table 10: Statistical evaluation of the technically accepted datasets for ERM-EC590.
Outliers Statistical parameters Measurand p Means Variances
Normally distributed Average
[mg/kg] s
[mg/kg] sbetween [mg/kg]
swithin [mg/kg]
Br 6 none none yes 2131 105 102 54 Sb 3 n.a. n.a. n.a. 755.7 19.2 17.3 20.1
BDE-28 5 none n.a. yes 2.440 0.276 0.265 0.193 BDE-47 11 none Labs 9, 18 yes 233.9 30.8 28. 9 26.2 BDE-99 11 Lab 19 Labs 9, 18 about 302.1 32.4 30.74 24.8
BDE-100 11 none Labs 9, 19 yes 63.02 3.66 3.45 3.01 BDE-153 11 none Labs 9, 18 yes 47.412 3.376 3.123 3.139 BDE-154 7 none Lab 18 yes 25.73 1.80 1.43 2.66
BDE-183 11 none Labs 9, 14, 18 yes 132.37 9.26 7.82 12.17
BDE-197+204 10 none Lab 18 yes 76.00 6.42 5.69 7.27
BDE-209 10 none Lab 9 yes 654.8 36.4 17.7 77.9 BB-209 8 none Lab 9 yes 634.0 76.83 74.3 47.5 p: number of accepted sets of results; s: standard deviation of dataset means; averages and
standard deviations in mg/kg.n.a. Not applicable (too few data).
24
Table 11: Statistical evaluation of the technically accepted datasets for ERM-EC591.
Outliers Statistical parameters Measurand p Means Variances
Normally distributed Average
[mg/kg] s
[mg/kg] sbetween [mg/kg]
swithin [mg/kg]
Br 6 none none yes 2083 75 68 75 Sb 3 n.a. n.a. n.a. 712.8 17.8 16.9 13.6
BDE-28 6 none none yes 2.549 0.344 0.330 0.158 BDE-47 12 none Lab 9 about 245.1 28.4 26.4 23.9 BDE-99 12 Lab 19 Lab 9 about 316.6 34.1 33.5 14.6
BDE-100 12 none Labs 9, 18 yes 65.99 4.15 3.91 3.41 BDE-153 12 none Labs 9, 18 yes 44.04 3.62 3.53 2.03 BDE-154 8 none none yes 26.27 2.01 1.89 1.70 BDE-183 12 none Labs 14, 18 yes 86.54 7.63 7.02 7.34
BDE-197+204 11 none Labs 14, 18 yes 51.87 6.43 5.91 6.25
BDE-209 10 none Lab 9 yes 783.6 45.3 n.a. 221.0 BB-209 8 none none yes 742.6 60.7 58.5 39.7 p: number of accepted sets of results; s: standard deviation of dataset means; averages and
standard deviations in mg/kg. n.a. Not applicable (too few data).
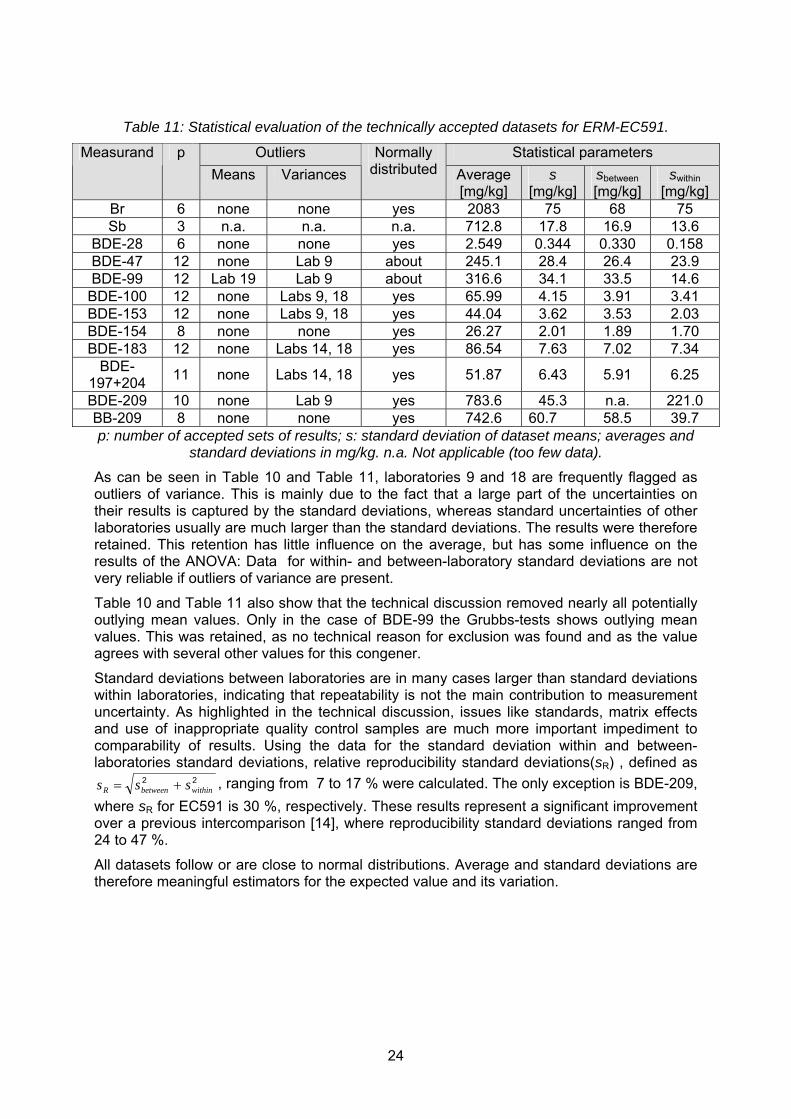
As can be seen in Table 10 and Table 11, laboratories 9 and 18 are frequently flagged as outliers of variance. This is mainly due to the fact that a large part of the uncertainties on their results is captured by the standard deviations, whereas standard uncertainties of other laboratories usually are much larger than the standard deviations. The results were therefore retained. This retention has little influence on the average, but has some influence on the results of the ANOVA: Data for within- and between-laboratory standard deviations are not very reliable if outliers of variance are present.
Table 10 and Table 11 also show that the technical discussion removed nearly all potentially outlying mean values. Only in the case of BDE-99 the Grubbs-tests shows outlying mean values. This was retained, as no technical reason for exclusion was found and as the value agrees with several other values for this congener.
Standard deviations between laboratories are in many cases larger than standard deviations within laboratories, indicating that repeatability is not the main contribution to measurement uncertainty. As highlighted in the technical discussion, issues like standards, matrix effects and use of inappropriate quality control samples are much more important impediment to comparability of results. Using the data for the standard deviation within and between-laboratories standard deviations, relative reproducibility standard deviations(sR) , defined as
22withinbetweenR sss += , ranging from 7 to 17 % were calculated. The only exception is BDE-209,
where sR for EC591 is 30 %, respectively. These results represent a significant improvement over a previous intercomparison [14], where reproducibility standard deviations ranged from 24 to 47 %.
All datasets follow or are close to normal distributions. Average and standard deviations are therefore meaningful estimators for the expected value and its variation.

25
7 VALUE ASSIGNMENT For these materials, certified, indicative and informative values have been assigned.
Certified values are values that fulfil the highest standards of accuracy. Procedures at IRMM require generally pooling of not less than 6 datasets to assign certified values. Full uncertainty budgets in accordance with the Guide to the expression of uncertainty in measurement [16] must be established.
Indicative values are values where either the uncertainty is deemed too large or where too few independent datasets were available to allow certification. Uncertainties are evaluated according to the same rules as for certified values.
Additional material information refers to values that have been obtained in the course of the study. For example, results reported from only one or two laboratories in cases where individual measurement uncertainty is high, would fall under this category.
7.1 CERTIFIED VALUES The unweighted means of the means of the accepted datasets as shown in Table 10 and Table 11 were used as assigned values for all measurands.
The certified uncertainty consists of uncertainties related to characterisation (uchar), between-bottle heterogeneity (ubb), degradation during long-term storage (ults) and transport to the customer (usts) [17].
• uchar was estimated as the standard error of the mean of laboratory means, i.e. s/√p with s and p taken from Table 10 and Table 11.
• ubb was estimated as the larger value of the standard deviation between-units (sbb) or the maximum heterogeneity potentially hidden by method repeatability (u*
bb), or as uoutl in the case of Br (EC590). The values are taken from Table 6. The highest of these values was taken as estimate for BDE -153 and -154.
• usts was estimated from stability tests and was taken from Table 9. For BDE-28, -153 and BDE-154, which were not determined in the study, the highest result of the study was taken.
• ults was estimated from stability tests and was taken from Table 9. For BDE-28, -153 and BDE-154, which were not determined in the study, the highest result of the study was taken.
These uncertainties were regarded as uncorrelated and combined quadratically to estimate the uncertainty of the certified value (uCRM) as shown below.
2222stsltsbbcharCRM uuuuu +++=
The various uncertainty contributions and the combined uncertainty are shown in Table 12 and Table 13.

26
Table 12: Uncertainty budget and certified values for ERM-EC590. uchar
[%]
ubb
[%]
ults
[%]
usts
[%]
uCRM
[%]
Certified value [g/kg]
UCRM (k=2) [g/kg]
Br 2.01 0.32 0.402 0.009 2.1 2.13 0.09 2,2',4,4'-Tetra BDE (BDE-47) 4.0 1.5 6.1 0.1 7.4 0.23 0.04 2,2',3,4,4'-PentaBDE (BDE-99) 3.2 1.7 9.2 0.1 9.9 0.30 0.06 2,2',4,4',6-PentaBDE (BDE-100) 1.8 1.5 12.1 0.2 12.3 0.063 0.016 2,2',4,4',5,5'-HexaBDE (BDE-153) 2.1 2.6 12.1 0.2 12.6 0.047 0.012 2,2',4,4',6,6'-HexaBDE (BDE-154) 2.6 2.6 12.1 0.2 12.7 0.026 0.007 2,2',3,4,4',5,6'-HeptaBDE (BDE-183) 2.1 2.4 3.1 < 0.1 4.5 0.132 0.012 2,2',3,3',4,4',6,6'-OctaBDE + 2,2',3, 4,4',5,6,6'-OctaBDE (BDE-197+204) 2.7 2.6 8.9 0.1 9.6 0.076 0.015 DecaBDE (BDE-209) 1.8 2.3 6.3 0.1 6.9 0.65 0.10 DecaBB (BB-209) 4.3 1.9 5.4 0.1 7.2 0.63 0.10
Table 13: Uncertainty budget and certified values for ERM-EC591. uchar
[%]
ubb
[%]
ults
[%]
usts
[%]
uCRM
[%]
Certified value [g/kg]
UCRM (k=2) [g/kg]
Br 1.469 0.14 0.306 0.004 1.507 2.08 0.07 2,4,4'-TriBDE (BDE-28) 5.5 2.3 10.8 0.2 12.3 0.0025 0.0006 2,2',4,4'-TetraBDE (BDE-47) 3.3 2.2 2.2 < 0.1 4.6 0.245 0.023 2,2',3,4,4'-PentaBDE (BDE-99) 3.1 2.0 4.3 0.1 5.7 0.32 0.04 2,2',4,4',6-PentaBDE (BDE-100) 1.8 1.5 4.2 0.1 4.8 0.066 0.007 2,2',4,4',5,5'-HexaBDE (BDE-153) 2.4 2.3 10.8 0.2 11.3 0.044 0.010 2,2',4,4',5,6'-HexaBDE (BDE-154) 2.7 2.3 10.8 0.2 11.4 0.026 0.006 2,2',3,4,4',5,6'-HeptaBDE (BDE-183) 2.5 1.6 3.4 0.1 4.5 0.087 0.008 2,2',3,3',4,4',6,6'-OctaBDE + 2,2',3, 4,4',5,6,6'-OctaBDE (BDE-197+204) 3.7 1.5 6.8 0.1 7.9 0.052 0.009 DecaBDE (BDE-209) 1.8 1.8 4.8 0.1 5.4 0.78 0.09 DecaBB (BB-209) 2.9 1.0 4.4 0.1 5.4 0.74 0.08
A graphical depiction of all assigned values, together with averages and standard deviations and submitted uncertainties of the individual laboratories is shown in Annex E.
7.2 INDICATIVE VALUES Indicative values were assigned for Sb. Only three laboratories submitted results and all results were obtained by NAA-techniques. However, as two of the three laboratories had recently successfully participated in the characterisation of Sb in polyethylene and as INAA is now considered a primary method of measurement, the results were regarded as sufficiently trustworthy to assign indicative values. The uncertainty budgets were set up as for the certified values and are listed together with the assigned values in Table 14.

27
Table 14: Uncertainty budget and certified values for Sb in ERM-EC590 and ERM-EC591. uchar
[%]
ubb
[%]
ults
[%]
usts
[%]
uCRM
[%]
Indicative value [g/kg]
UCRM (k=2) [g/kg]
Sb-EC590 1.46 0.30 0.63 0.01 1.62 0.756 0.025
Sb-EC591 1.44 0.19 0.43 0.01 1.52 0.713 0.022
7.3 ADDITIONAL MATERIAL INFORMATION Some laboratories reported additional BDE-congeners. These values are listed in Table 15. Results from laboratories that were excluded from the value assignment were not taken into consideration. Due to the doubts on the coelution of BDE-196, -198 and -203, no information value is given for these congeners.
Table 15: Additional material information for ERM-EC590 and ERM-EC591. ERM-EC590 ERM-EC591 Congener Mass fraction
[mg/kg] Mass fraction
[mg/kg] 2,2',4-TriBDE (BDE-17) 0.9 0.9 2,4,4'-TriBDE (BDE-28) 2.4 2,2',4,5'-TetraBDE (BDE-49) 5.5 5.5 2,3',4,4'-TetraBDE (BDE-66) 4.6 4.6 2,4,4',5-TetraBDE (BDE-74) 2.5 2.4 2,4,4',6-TetraBDE (BDE-75) 0.3 0.4 2,2',3,4,4'-PentaBDE (BDE-85) 17.7 19.1 2,2',3',4,5-Penta BDE + 2,3',4,4',5-PentaBDE (BDE-97+118)
1.4 1.3
2,2',4,5,5'-PeBDE (BDE-101) 2.1 2.1 2,3',4,4',6-PentaBDE (BDE-119) 0.4 2,2',3,4,4',5'-HexaBDE (BDE-138) 5.6 5.5 2,2',3,4,4',6-HexaBDE (BDE-139) 4.9 5.1 2,2',4,4',6,6'-HexaBDE (BDE-155) 1.2 1.4 2,2',3,3',4,5,6'-HeptaBDE + 2,3,3',4,4',5,6-HeptaBDE (BDE-173+190)
5.9 4.3
2,2',3,4,4',5,5'-HeptaBDE (BDE-180) 5.4 2,2',3,4,4',5,6-HeptaBDE (BDE-181) 2.0 0.8 2,2',3,4,4',5,6'-HeptaBDE (BDE-182) 3.2 2.3 2,2',3,3',4,4',5,6,6'-NonaBDE (BDE-207) 90.3 43.8 2,2',3,3',4,5,5',6,6'-NonaBDE (BDE-208) 15.0 6.6
7.4 CONFIRMATION OF ASSIGNED VALUES Correctness of the calibration lines was verified by the quality control solution, a candidate CRM. On average, results submitted by the laboratories for this solution agree with the candidate certified value, as can be seen in Figure 1Error! Reference source not found.. The only deviation is for BDE-203, which coelutes with BDE-198 on various columns, which is also present in the solution.

28
0
1
2
3
4
5
6
7
8
BD
E-2
8
BD
E-4
7
BD
E-4
9
BD
E-6
6
BD
E-8
5
BD
E-9
9
BD
E-1
00
BD
E-1
53
BD
E-1
54
BD
E-1
83
BD
E-1
96
BD
E-2
03
BD
E-2
06
BD
E-2
08
BD
E-2
09
mas
s fr
actio
n [m
g/kg
]
candidate certified value mean of means
Figure 1: Comparison of results for the certified quality control solution. Error bars are expanded uncertainties for the certified values or confidence interval of the mean of means.
Two datasets from non-GC methods were received. One set was obtained by IA-MS, the other by HPLC. In IA-MS, the sample (almost 1mg) without pretreatment is introduced and heated directly, then the evaporated. BFRs are determined by mass spectrometry. This method gives the sum of each homologue group. Also measurements by HPLC give the sum of penta-, hexa-, hepta-, octa- and nonabrominated BFRs together with BDE-209 and BB-209. The two methods are both plagued by specific problems:
• IA-MS requires a matrix material for calibration. In the absence of other materials, quality control material IRMM-310 was used for calibration. As the assigned values of IRMM-310 are of an informative character only, the results by IA-MS cannot be included in the set of values for certification. After disclosure of results, a second set of results for BDE-209 using CRM NMIJ CRM-8108-a (Deca-BDE in polystyrene) for calibration was received.
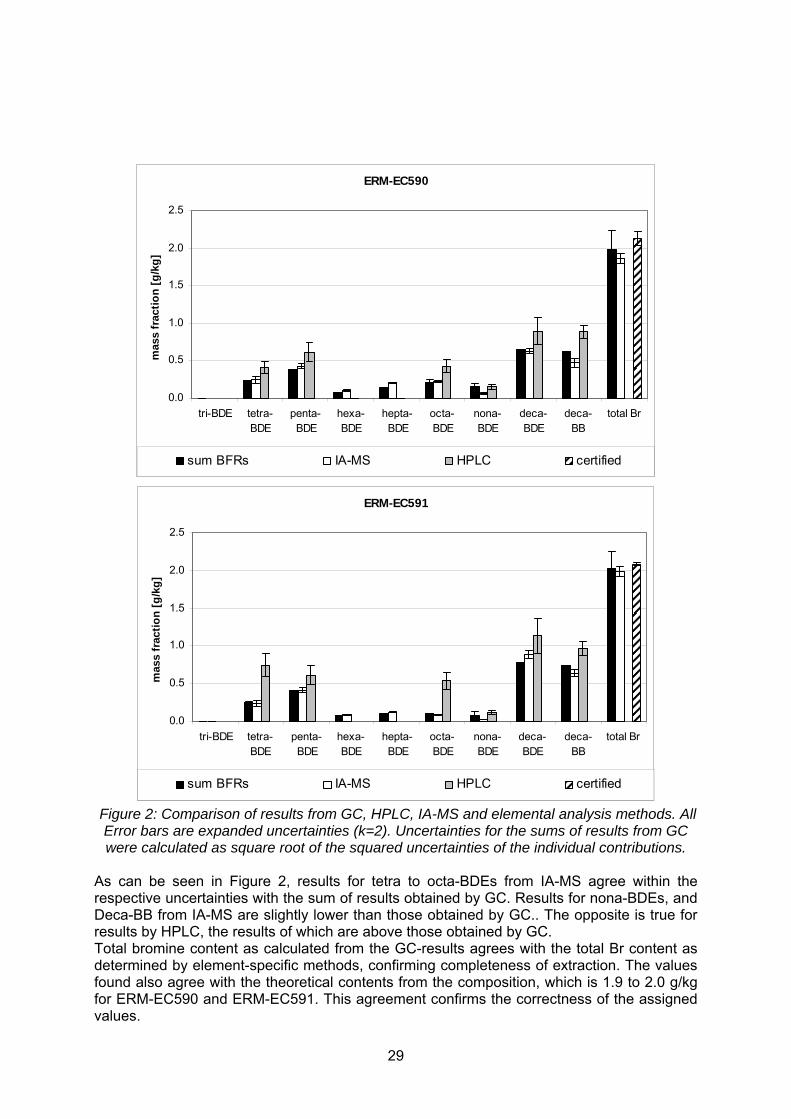
• The HPLC method was optimised for commonly occurring PBDE patterns. The pattern in EC590 and EC591, containing four technical mixtures of BFRs rather than only one, was highly unusual, thus leading to potentially biased results. Nevertheless, the results confirm that the order of magnitude of the values assigned by GC is accurate. Results from these two methods are compared to the results obtained by GC in Figure 2. Certified, indicative and informative values were combined for this comparison.
A second confirmation of the accuracy of the results comes from a comparison of the total Br values as calculated from the BFRs and from elemental methods. For this calculation, certified, indicative and informative values were used. The results are shown in Figure 2.
29
ERM-EC590
0.0
0.5
1.0
1.5
2.0
2.5
tri-BDE tetra-BDE
penta-BDE
hexa-BDE
hepta-BDE
octa-BDE
nona-BDE
deca-BDE
deca-BB
total Br
mas
s fr
actio
n [g
/kg]
sum BFRs IA-MS HPLC certified
ERM-EC591
0.0
0.5
1.0
1.5
2.0
2.5
tri-BDE tetra-BDE
penta-BDE
hexa-BDE
hepta-BDE
octa-BDE
nona-BDE
deca-BDE
deca-BB
total Br
mas
s fr
actio
n [g
/kg]
sum BFRs IA-MS HPLC certified
Figure 2: Comparison of results from GC, HPLC, IA-MS and elemental analysis methods. All Error bars are expanded uncertainties (k=2). Uncertainties for the sums of results from GC were calculated as square root of the squared uncertainties of the individual contributions.
As can be seen in Figure 2, results for tetra to octa-BDEs from IA-MS agree within the respective uncertainties with the sum of results obtained by GC. Results for nona-BDEs, and Deca-BB from IA-MS are slightly lower than those obtained by GC.. The opposite is true for results by HPLC, the results of which are above those obtained by GC. Total bromine content as calculated from the GC-results agrees with the total Br content as determined by element-specific methods, confirming completeness of extraction. The values found also agree with the theoretical contents from the composition, which is 1.9 to 2.0 g/kg for ERM-EC590 and ERM-EC591. This agreement confirms the correctness of the assigned values.

30
8 METROLOGICAL TRACEABILITY Bromine
Laboratories used instrumental as well as destructive methods, eliminating potential influences of method preparation. Quantification was based on completely independent measurement principles. Agreement between the results therefore confirms absence of any significant method bias and demonstrates the identity of the analyte being Br.
Only validated methods were used. Agreement with the certified value of the quality control materials proved absence of significant bias for the individual methods. This agreement also demonstrated the correctness of the individual calibrations. The certified values are therefore traceable to the international system of units (SI).
Antimony
Only NAA-methods were used. Although, based on the knowledge of the performance of NAA methods for polymer samples, a method bias is unlikely, absence of method bias cannot be unequivocally demonstrated. Identity of the analyte is therefore defined as "Sb as determined by NAA ".
The methods were validated. Agreement with the certified values of the control sample confirmed the absence of bias and the correctness of calibration (where applicable) for the individual resultss. The assigned quantity values are therefore traceable to the SI.
Brominated flame retardants
PBDEs and PBBs are chemically clearly defined molecules. The participants used different GC columns and different ionisation techniques. In addition, agreement with the certified mass fractions of the candidate CRM that was distributed together with the polymer materials confirms the identity of the molecules. Different extraction methods (Soxhlet, ultrasound assisted, PLE) and solvents (toluene, CH2Cl2, isooctane) were used. In addition, one laboratory dissolved the complete sample, hence avoiding extraction altogether. Agreement between the results therefore demonstrates absence of any systematic influence of the extraction technique on the assigned values. Results were obtained applying GC methods with different ionisation techniques (electron impact, chemical ionisation). While the agreement of the sum of assigned values with the results from IA-MS and the agreement of the total Br mass fraction calculated from the results with the certified Br mass fraction strongly indicates absence of method bias, this absence could not be demonstrated. Identity of the BFR congeners are therefore defined as "as determined by GC-MS".
Only validated methods were used. Correctness of calibration was confirmed by agreement of results with the certified values for the candidate CRM used as quality control. The assigned quantity values are therefore traceable to the SI.
9 COMMUTABILITY CRMs must exhibit the same analytical behaviour for given methods as a normal laboratory sample. The laboratories participating in the characterisation study have been selected such as to provide a large variety of analytical methods, regarding digestion/extraction, calibration and detection. The good agreement between the results obtained shows the commutability of the materials.

31
10 INSTRUCTIONS FOR USE 10.1 STORAGE CONDITIONS The material shall be stored at +4 °C in the dark.
10.2 SAFETY AND PROTECTION OF THE ENVIRONMENT The usual laboratory safety measures apply.
10.3 HANDLING OF THE MATERIAL Grinding of the materials to particle diameters < 0.5 mm if extraction methods are used is highly recommended, although the influence of particle size on extraction efficiency strongly depends on the extraction technique and extraction solvent. Milling conditions should be chosen so that the ground material remains coulourless to avoid potential changes of the analyte content. Especially for ERM-EC591, cryogrinding is recommended, as the polymer tends to become plastic when ground without cooling.
10.4 USE OF THE CERTIFIED VALUES The material is intended to be used for method validation and for demonstration of laboratory proficiency.
Comparing an analytical result with the certified value
A result is unbiased if the combined uncertainty of measurement and certified value covers the difference between the certified value and the measurement result (see also ERM Application Note 1 [18]).
Use in quality control charts
The materials can be used for quality control charts. Different CRM-units will give the same result as heterogeneity was included in the uncertainties of the certified values.
Use as a calibrant
It is not recommended to use these matrix materials as calibrants, unless the method in question requires calibration with matrix materials. If used nevertheless, the uncertainty of the certified value shall be taken into account in the final estimation of measurement uncertainty.

32
11 REFERENCES
1 Directive 2002/95/EC of the European Parliament and of the Council of 27 January 2003 on the restriction of the use of certain hazardous substances in electrical and electronic equipment, OJ L 37, 13.2.2003, 19–23
2 Decision 2005/618/EC of the European Commission of 18 August 2005 amending Directive 2002/95/EC of the European Parliament and of the Council for the purpose of establishing the maximum concentration values for certain hazardous substances in electrical and electronic equipment, OJ L 214, 19.8.2005, 65–65
3 Decision 2005/717/EC of the European Commission of 13 October 2005 amending for the purposes of adapting to the technical progress the Annex to Directive 2002/95/EC of the European Parliament and of the Council on the restriction of the use of certain hazardous substances in electrical and electronic equipment, OJ L 271, 15.10.2005, 48–50
4 Judgement of the European Court on Joined Cases C-14/06 and C-295/06, 1. April 2008
5 Ballschmiter K. Bacher R; Mennel A., Fischer R; Riehle U; Swerev M (1992) The determination of chlorinated biphenyls, chlorinated dibenzodioxins, and chlorinated dibenzofurans by GC-MS, Journal of high resolution chromatography 15:260-270
6 Certificates of of analysis TBDE-79RX Lot 0525DI08A (Great Lakes DE-79TM Octabromidiphenyloxide) and TBDE-71X lot 05500F16P (GGreat Lakes DE-71 Pentrabromodiphenyloxide), Wellington Laboratories
7 Hirai Y, Sakai S (2007) Brominated Flame Retardants in Recycled Plastic Products, Poster P103 at the BFR2007, 24 – 27 April 2007, Amsterdam (NL)
8 Kemmlein S, Bergmann M, Jann O (2005) Probenaufbereitungs- und Analyseverfahren für Flammschutzmittel (Pentabromdiphenylether, Octabromdiphenylether) In Erzeugnissen, Umweltbundesamt Texte 23:05, Umweltbundesamt, Berlin (DE), ISBN 0722-186x
9 Linsinger TPJ, Pauwels J, van der Veen AMH, Schimmel H, Lamberty A (2001) Homogeneity and stability of reference materials, Accredidation and Quality Assurance 6: 20-25
10 Sjödin A, Päpke O, McGahee E, Focant J.-F, Jones R.S, Pless-Mulloli T, Toms L.-ML, Herrmann T, Müller,J, Needham LL, Patterson Jr DG (2008) Concentration of polybrominated diphenyl ethers (PBDEs) in household dust from various countries, Chemosphere 73:S131-S136
11 National Industrial Chemical Notification and Assessment Scheme in: Polyrominated Flame Retardants – Priority Existing Chemical Assessment Report No. 20, Commonwealth of Australia 2001, ISBN 0 642 709874
12 Lamberty A, Schimmel H,·Pauwels J (1998) The study of the stability of reference materials by isochronous measurements, Fresenius Journal of Analytical Chemistry 360:359–361
13 Linsinger TPJ, Pauwels J, Lamberty A, Schimmel H, van der Veen AMH, Siekmann L. (2001) Estimating the Uncertainty of Stability for Matrix CRMs, Fresenius' Journal of Analytical Chemistry 370:183-188
14 Linsinger TPJ, Voorspoels S, Liebich A (2008), Results of an interlaboratory comparison on the determination of polybrominated flame-retardants in poly(ethyleneterephthalate), Analytical and Bioanalytical Chemistry 390:399-409
15 Korytar P, Covaci A, de Boer J, Gelbin A, Brinkman UA (2005) Retention-time database of 126 polybrominated diphenyl ether congeners and two Bromkal technical mixtures on seven capillary gas chromatographic columns, Journal of Chromatography A, 1065:239-249
16 International Organization for Standardization (1995) Guide to the Expression of Uncertainty in Measurements, Geneva
17 Pauwels J, van der Veen A, A. Lamberty, Schimmel H (2000) Evaluation of uncertainty of reference materials, Accredidation and Quality Assurance 5: 95-90
18 Linsinger T, (2005), ERM application Note 1, www.erm-crm.org

33
12 ACKNOWLEDGEMENTS The National Institute for Standards and Technology (NIST, US) for the provision of candidate SRMs 2257 and 2258 and Albemarle Corp. for the provision of the technical mixtures of Deca-BDE and Deca-BB are greatly acknowledged. The authors would also like to thank M. Ricci and M. Dabrio (IRMM, BE) for the reviewing of the certification report, as well as the experts of the Certification Advisory Panel ‘small organic molecules/operationally defined parameters in food analysis’, J. de Boer (VU-University, IVM, Amsterdam, NL), P. Finglas (Institute for Food Research, Norwich, UK) and P. Gowik (Bundesamt für Verbraucherschutz und Lebensmittelsicherheit, Berlin, DE) for their constructive comments.
13 ANNEX(ES) Annex A: Results of the homogeneity tests for ERM-EC590 and ERM-EC591
Annex B: Graphical representation of stability tests for ERM-EC590 and ERM-EC591
Annex C: Methods used for characterisation of total Br and Sb
Annex D: Methods used for characterisation of PBDEs and BB-209
Annex E: Graphical and tabular presentation of the results of the characterisation studies

Annex A page 1
Annex A Results of the homogeneity studies The graphs show bottle averages and their 95 % confidence intervals. Confidence intervals were based on the "within-bottle" standard deviation for each congener rather than on the standard deviation of the 4 replicates per bottle. Absolute values do not agree with the certified values, most likely due to different calibrations.
ERM-EC590
2.50
2.55
2.60
2.65
2.70
0 500 1000 1500 2000 2500 3000 3500 4000
Bottle Number
mas
s fr
actio
n B
r [g
/kg]
0.76
0.77
0.78
0.79
0.8
0.81
mas
s fr
actio
n S
b [g
/kg]
Br Sb
ERM-EC590
0
50
100
150
200
250
300
0 500 1000 1500 2000 2500 3000 3500 4000
Bottle Number
mas
s fra
ctio
n B
DE-
47
[mg/
kg]
3035404550556065707580
mas
s fr
actio
n BD
E42+
66 [m
g/kg
]
BDE 47 BDE-42+66
ERM-EC590
05
10152025
3035404550
0 500 1000 1500 2000 2500 3000 3500 4000
Bottle Number
mas
s fr
actio
n BD
E-85
[m
g/kg
]
200
250
300
350
400
450
500
mas
s fra
ctio
n B
DE-
99
[mg/
kg]
BDE-85 BDE-99
ERM-EC590
20
30
40
50
60
70
80
90
100
0 500 1000 1500 2000 2500 3000 3500 4000
Bottle Number
mas
s fr
actio
n B
DE-1
00
[mg/
kg]
40
45
50
55
60
65
mas
s fr
actio
n B
DE-1
27
[mg/
kg]
BDE-100 BDE-127
ERM-EC590
0
50
100
150
200
250
0 500 1000 1500 2000 2500 3000 3500 4000
Bottle Number
mas
s fr
actio
n B
DE-
183
[mg/
kg]
5060708090100110120130140150
mas
s fr
actio
n BD
E-1
96
[mg/
kg]
BDE-183 BDE-196
ERM-EC590
0
20
40
60
80
100
120
0 500 1000 1500 2000 2500 3000 3500 4000
Bottle Number
mas
s fra
ctio
n B
DE-1
97
[mg/
kg]
5060708090100
110120130140150
mas
s fra
ctio
n BD
E-20
3 [m
g/kg
]
BDE-197 BDE-203
ERM-EC590
0
20
40
60
80
100
120
140
0 500 1000 1500 2000 2500 3000 3500 4000
Bottle Number
mas
s fra
ctio
n BD
E-2
06
[mg/
kg]
120
140
160
180
200
220
240
260
280
300
mas
s fra
ctio
n BD
E-2
07
[mg/
kg]
BDE-206 BDE-207
ERM-EC590
0100200300400500600700800900
1000
0 500 1000 1500 2000 2500 3000 3500 4000
Bottle Number
mas
s fra
ctio
n BD
E-20
9 [m
g/kg
]
400
600
800
1000
1200
1400
mas
s fra
ctio
n BB
-209
[m
g/kg
]
BDE-209 BB209
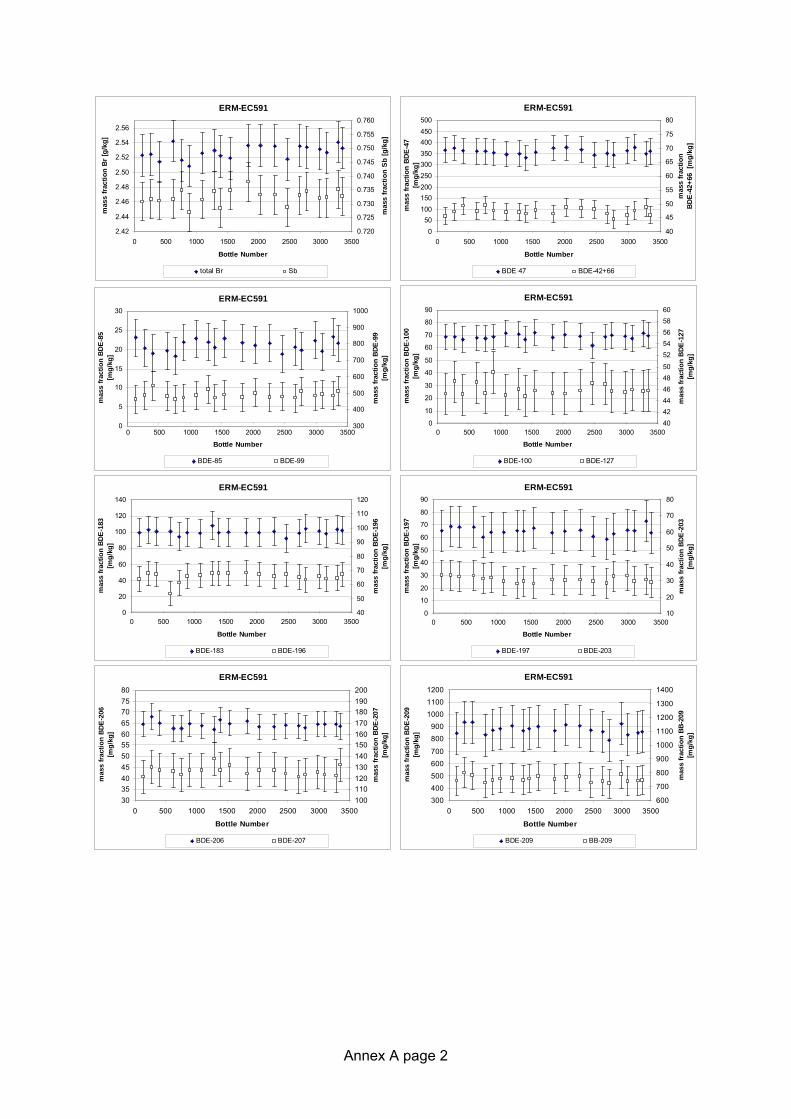
Annex A page 2
ERM-EC591
2.42
2.44
2.46
2.48
2.50
2.52
2.54
2.56
0 500 1000 1500 2000 2500 3000 3500
Bottle Number
mas
s fr
actio
n B
r [g/
kg]
0.720
0.725
0.730
0.735
0.740
0.745
0.750
0.755
0.760
mas
s fr
actio
n Sb
[g/k
g]
total Br Sb
ERM-EC591
050
100150200250300350400450500
0 500 1000 1500 2000 2500 3000 3500
Bottle Number
mas
s fr
actio
n B
DE-
47
[mg/
kg]
40
45
50
55
60
65
70
75
80
mas
s fr
actio
n BD
E-42
+66
[mg/
kg]
BDE 47 BDE-42+66
ERM-EC591
0
5
10
15
20
25
30
0 500 1000 1500 2000 2500 3000 3500
Bottle Number
mas
s fra
ctio
n BD
E-85
[m
g/kg
]
300
400
500
600
700
800
900
1000
mas
s fra
ctio
n B
DE-9
9 [m
g/kg
]
BDE-85 BDE-99
ERM-EC591
0
10
20
30
40
50
60
70
80
90
0 500 1000 1500 2000 2500 3000 3500
Bottle Number
mas
s fra
ctio
n B
DE-1
00
[mg/
kg]
404244464850
5254565860
mas
s fr
actio
n B
DE-
127
[mg/
kg]
BDE-100 BDE-127
ERM-EC591
0
20
40
60
80
100
120
140
0 500 1000 1500 2000 2500 3000 3500
Bottle Number
mas
s fr
actio
n BD
E-1
83
[mg/
kg]
40
50
60
70
80
90
100
110
120
mas
s fra
ctio
n BD
E-19
6 [m
g/kg
]
BDE-183 BDE-196
ERM-EC591
0
10
20
30
40
50
60
70
80
90
0 500 1000 1500 2000 2500 3000 3500
Bottle Number
mas
s fra
ctio
n BD
E-19
7 [m
g/kg
]
10
20
30
40
50
60
70
80
mas
s fr
actio
n BD
E-2
03
[mg/
kg]
BDE-197 BDE-203
ERM-EC591
3035404550556065707580
0 500 1000 1500 2000 2500 3000 3500
Bottle Number
mas
s fra
ctio
n BD
E-20
6 [m
g/kg
]
100110120130140150160170180190200
mas
s fr
actio
n BD
E-20
7 [m
g/kg
]
BDE-206 BDE-207
ERM-EC591
300400500600700
800900
100011001200
0 500 1000 1500 2000 2500 3000 3500
Bottle Number
mas
s fra
ctio
n BD
E-20
9 [m
g/kg
]
600
700
800
900
1000
1100
1200
1300
1400m
ass
fract
ion
BB-2
09
[mg/
kg]
BDE-209 BB-209

Annex B page 1
Annex B: Results of the stability studies The graphs show averages per time point and their 95 % confidence intervals. Confidence intervals are based on the standard deviations of the 8 replicates per time/temperature combination. Data for different temperatures were measured at the same time but are graphically separated to make the graphs easier readable. Only one set of results per measurand was measured for t=0, which was entered three times in the graphs. Absolute values do not agree with the certified values, most likely due to different calibrations.
ERM-EC590 Br
2.56
2.58
2.60
2.62
2.64
0 2 4 6 8 10 12 14
time [months]
mas
s fra
ctio
n [g
/kg]
4 °C 18 °C 60 °C
ERM-EC590 Sb
0.870
0.875
0.880
0.885
0.890
0 2 4 6 8 10 12 14
time [months]m
ass
fract
ion
[g/k
g]4 °C 18 °C 60 °C
ERM-EC590 BDE-47
200210220230240250260270280
0 2 4 6 8 10 12 14
time [months]
mas
s fra
ctio
n [m
g/kg
]
4 °C 18 °C 60 °C
ERM-EC590 BDE-42+66
41424344454647484950
0 2 4 6 8 10 12 14
time [months]
mas
s fra
ctio
n [m
g/kg
]
4 °C 18 °C 60 °C
ERM-EC590 BDE-85
20
25
30
35
40
45
50
0 2 4 6 8 10 12 14
time [months]
mas
s fra
ctio
n [m
g/kg
]
4 °C 18 °C 60 °C
ERM-EC590 BDE-99
200
250
300
350
400
450
500
0 2 4 6 8 10 12 14
time [months]
mas
s fra
ctio
n [m
g/kg
]
4 °C 18 °C 60 °C
ERM-EC590 BDE-100
50
60
70
80
90
100
110
0 2 4 6 8 10 12 14
time [months]
mas
s fra
ctio
n [m
g/kg
]
4 °C 18 °C 60 °C
ERM-EC590 BDE-127
414243444546474849
0 2 4 6 8 10 12 14
time [months]
mas
s fra
ctio
n [m
g/kg
]
4 °C 18 °C 60 °C
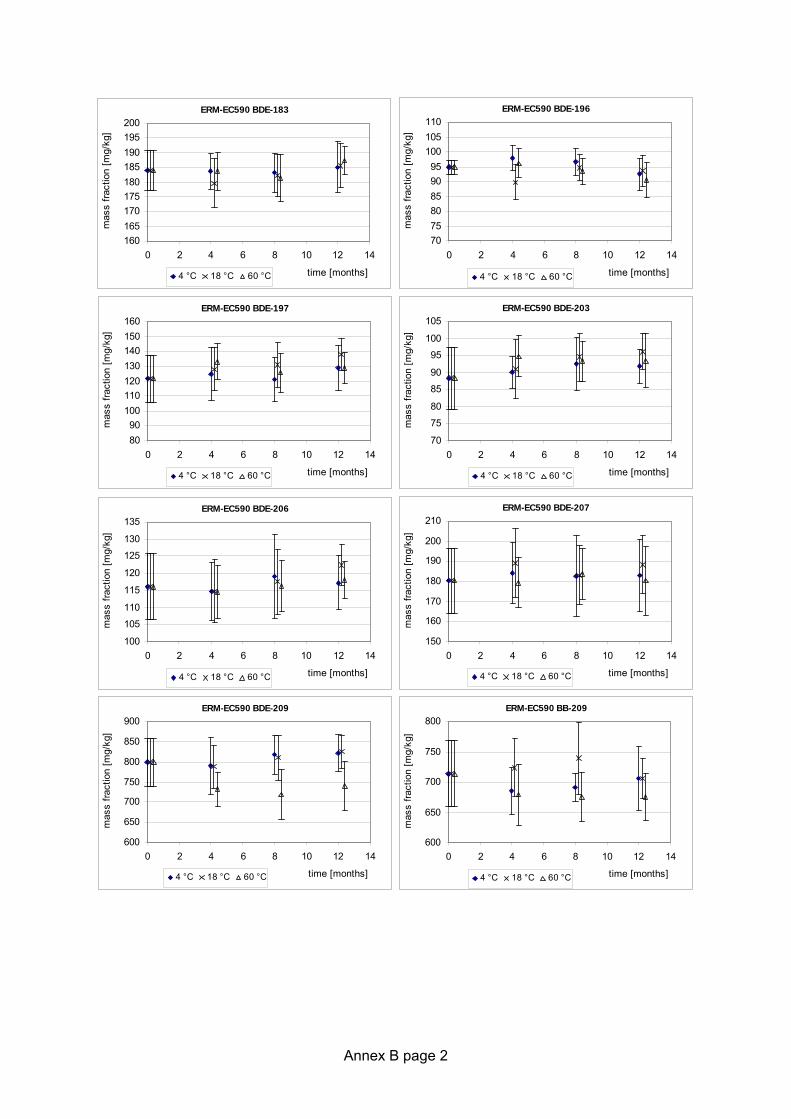
Annex B page 2
ERM-EC590 BDE-183
160165170175180185190195200
0 2 4 6 8 10 12 14
time [months]
mas
s fra
ctio
n [m
g/kg
]
4 °C 18 °C 60 °C
ERM-EC590 BDE-196
707580859095
100105110
0 2 4 6 8 10 12 14
time [months]
mas
s fra
ctio
n [m
g/kg
]
4 °C 18 °C 60 °C
ERM-EC590 BDE-197
8090
100110120130140150160
0 2 4 6 8 10 12 14
time [months]
mas
s fra
ctio
n [m
g/kg
]
4 °C 18 °C 60 °C
ERM-EC590 BDE-203
70
75
80
85
90
95
100
105
0 2 4 6 8 10 12 14
time [months]
mas
s fra
ctio
n [m
g/kg
]
4 °C 18 °C 60 °C
ERM-EC590 BDE-206
100
105
110
115
120
125
130
135
0 2 4 6 8 10 12 14
time [months]
mas
s fra
ctio
n [m
g/kg
]
4 °C 18 °C 60 °C
ERM-EC590 BDE-207
150
160
170
180
190
200
210
0 2 4 6 8 10 12 14
time [months]
mas
s fra
ctio
n [m
g/kg
]
4 °C 18 °C 60 °C
ERM-EC590 BDE-209
600
650
700
750
800
850
900
0 2 4 6 8 10 12 14
time [months]
mas
s fra
ctio
n [m
g/kg
]
4 °C 18 °C 60 °C
ERM-EC590 BB-209
600
650
700
750
800
0 2 4 6 8 10 12 14
time [months]
mas
s fra
ctio
n [m
g/kg
]
4 °C 18 °C 60 °C

Annex B page 3
ERM-EC591 Br
2.56
2.58
2.60
2.62
0 2 4 6 8 10 12 14
time [months]
mas
s fra
ctio
n [g
/kg]
4 °C 18 °C 60 °C
ERM-EC591 Sb
0.870
0.875
0.880
0.885
0.890
0 2 4 6 8 10 12 14
time [months]
mas
s fra
ctio
n [g
/kg]
4 °C 18 °C 60 °C
ERM-EC591 BDE-47
220
225
230
235
240
245
250
0 2 4 6 8 10 12 14
time [months]
mas
s fra
ctio
n [m
g/kg
]
4 °C 18 °C 60 °C
ERM-EC591 BDE-42+66
424344454647484950
0 2 4 6 8 10 12 14
time [months]
mas
s fra
ctio
n [m
g/kg
]
4 °C 18 °C 60 °C
ERM-EC591 BDE-85
15
17
19
21
23
25
27
29
0 2 4 6 8 10 12 14
time [months]
mas
s fra
ctio
n [m
g/kg
]
4 °C 18 °C 60 °C
ERM-EC591 BDE-99
290
300
310
320
330
340
350
360
0 2 4 6 8 10 12 14
time [months]
mas
s fra
ctio
n [m
g/kg
]
4 °C 18 °C 60 °C
ERM-EC591 BDE-100
50
55
60
65
70
75
0 2 4 6 8 10 12 14
time [months]
mas
s fra
ctio
n [m
g/kg
]
4 °C 18 °C 60 °C
ERM-EC591 BDE-127
424344454647484950
0 2 4 6 8 10 12 14
time [months]
mas
s fra
ctio
n [m
g/kg
]
4 °C 18 °C 60 °C
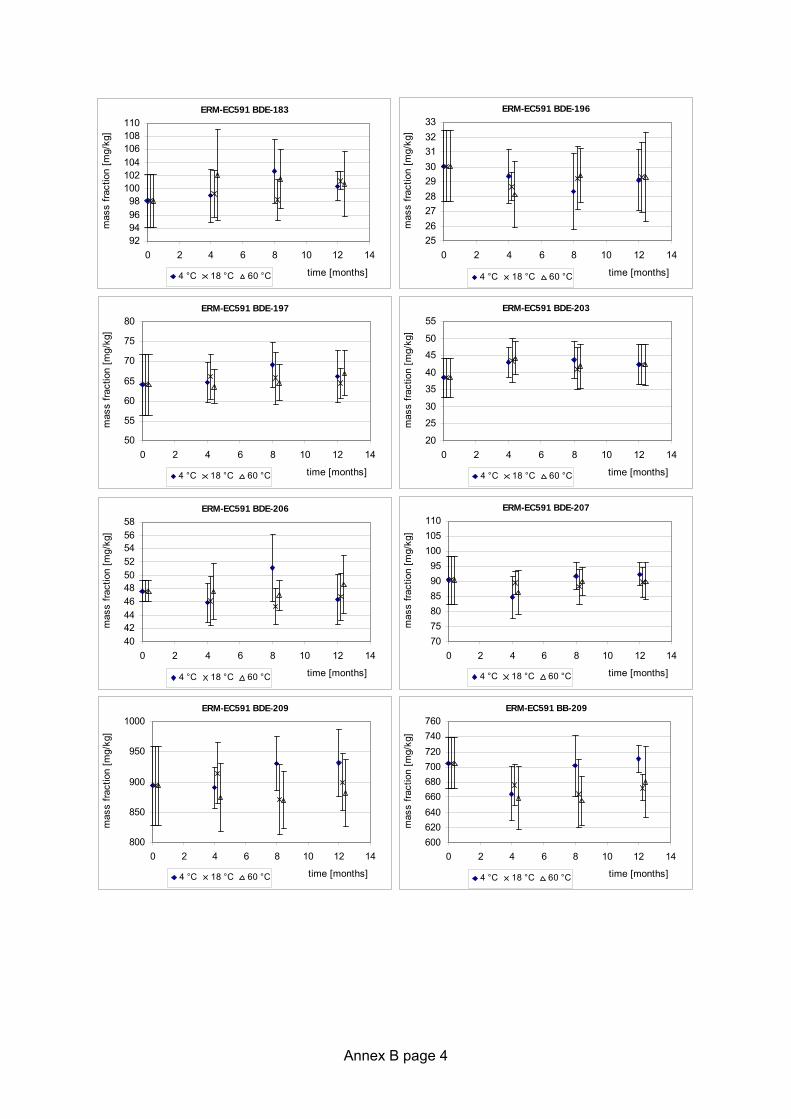
Annex B page 4
ERM-EC591 BDE-183
92949698
100102104106108110
0 2 4 6 8 10 12 14
time [months]
mas
s fra
ctio
n [m
g/kg
]
4 °C 18 °C 60 °C
ERM-EC591 BDE-196
252627282930313233
0 2 4 6 8 10 12 14
time [months]
mas
s fra
ctio
n [m
g/kg
]
4 °C 18 °C 60 °C
ERM-EC591 BDE-197
50
55
60
65
70
75
80
0 2 4 6 8 10 12 14
time [months]
mas
s fra
ctio
n [m
g/kg
]
4 °C 18 °C 60 °C
ERM-EC591 BDE-203
20
25
30
35
40
45
50
55
0 2 4 6 8 10 12 14
time [months]
mas
s fra
ctio
n [m
g/kg
]
4 °C 18 °C 60 °C
ERM-EC591 BDE-206
40424446485052545658
0 2 4 6 8 10 12 14
time [months]
mas
s fra
ctio
n [m
g/kg
]
4 °C 18 °C 60 °C
ERM-EC591 BDE-207
707580859095
100105110
0 2 4 6 8 10 12 14
time [months]
mas
s fra
ctio
n [m
g/kg
]
4 °C 18 °C 60 °C
ERM-EC591 BDE-209
800
850
900
950
1000
0 2 4 6 8 10 12 14
time [months]
mas
s fra
ctio
n [m
g/kg
]
4 °C 18 °C 60 °C
ERM-EC591 BB-209
600620640660680700720740760
0 2 4 6 8 10 12 14
time [months]
mas
s fra
ctio
n [m
g/kg
]
4 °C 18 °C 60 °C

Annex C page 1
Annex C: Methods used for characterisation of total Br and Sb Data-set
Sample intake [mg]
Sample preparation Calibration Quantification
1 170 -240
none IRMM-530 flux monitors (99.9 % Al, 0.1 % Au)
Blank: empty vial
k0NAA: Irradiation: 7 h (Br); 4 h (Sb) with a flux of 3*1011 neutrons/(cm2 s) Decay time 2-5 d (Br), 15-25 d (Sb), Measuring time 2 h Lines (keV): 554.3, 619.1, 776.5; 1044, 1317.5 (Br); 564.2, 602.7 (Sb)
2 150-220 none Al-Au (0.1%), Zn (99.99%), Zr (99.8%)
Validated using several BCR-CRMs
Blank: SPRONK 0908, supra pure polyethylene
k0NAA:Irradiation: 6 h with a flux of 1*1012 neutrons/(cm2 s) Decay time 3 and 4 days (Sb), Measuring time 35 min Lines (keV): 776.5 (Br); 564.2 (Sb)
3 400 none NIST SRM 3184 (Br anion- solutions) and NIST SRM (multielement standard solution)
INAA: Irradiation: 1 h with a flux of 2.8 *1011 neutrons/(cm2 s) Decay time 5 to 7 days, Measuring time 7200 s Lines (keV): 221, 554, 606, 619, 698, 776, 828, 1008, 1044, 1317, 1475 (Br); 564, 603, 646, 693, 723 (Sb)
4 20-30 Combustion in an oxygen bomb (Schöninger flask); Combustion gases trapped in an aqueous solution of sodium disulfite
Titer of the titrant is established from the analysis of characterized organic compounds with known content of bromine.
Potentiometric titration with 0.001 N silver nitrate in a suitable acetone/water solution
5 320 -400
Combustion in an oxygen bomb (10 bar O2); Combustion gases trapped in ultra pure water
Monoelement standard (Merck) traceable via NIST NaBr in water; calibration checked against an independent Quality control from SPEX Certiprep
sectorfield ICP-MS masses 79, 80 (79 reported) Internal standard Se
6 300 – 500
Combustion in an oxygen bomb (10 bar O2); Combustion gases trapped in ultra pure water
Monoelement standard (Merck) traceable via NIST, NaBr in water; calibration checked against an independent Quality control from SPEX Certiprep
Ion chromatography with UV detection Resin: strong basic low capacity anion exchanger

Annex D page 1
Annex D: Methods used for characterisation of PBDEs Data-set
Sample intake [mg]
Sample preparation Calibration Quantification
7 250 Grinding to < 0.5 mm Ultrasonic extraction (toluene, 70 °C, 3 h) Precipitation of dissolved polymer UV protection: not specified
Internal standard: PCB-209 Calibration with pure congeners from AccuStandard
GC-quadrupole-MS Column: DB 5HT (15 m x 0.25 mm x 0.1 μm) Injection: Pulsed splitless; 310 °C
8 100 Cutting to particles of 2 x 2 mm (scissors) Extraction (toluene, 100 °C, 4 h) No additional clean-up UV protection: use of amber glass vials
Internal standard PCB-209 Calibration with a custom mix from AccuStandard
GC-quadrupole-MS; resolution 0.3 amu Column: DB 5MS (15 m x 0.25 mm x 0.1 μm) Injection: 310 °C
9 110 Samples taken as is Dissolution in xylene/ dimethyl glutarate Precipitation of the polymer and subsequent filtration UV protection: not specified
Internal standards: 13C labelled BFR-mix, Wellington Laboratories Calibration: BB-209, PBDE-mix, Wellington Laboratories
GC-quadrupole-MS Column: ZB 5HT (15 m x 0.25 mm x 0.1 μm) Injection: Cold injection with subsequent desorption (90-320 °C)
10 1700-3800
Grinding to about 0.5 mm (IKA A11 analytical mill) Soxhlet extraction (toluene, 110 °C, 24 h) Dilution, addition of internal standard UV protection: Protection from light
(6 samples were re-extracted to check for completeness of extraction)
13C labelled BFRs from Cambridge Isotope Laboratories/Wellington Laboratories for all congeners Calibration: Native congeners from CIL/Wellington Laboratories
GC-SF-MS; resolution 8000-9000 amu Column: RTX5 Sil-MS (30 m x 0.25 mm x 0.1 μm) Injection: Splitless, 280 °C
11 1000 Information on grinding not given Extraction with 10 mL solvent (toluene, 100 °C, 1 h)
Internal standard: PCB-209 Calibration: Standards from Accustandard
GC-quadrupole-MS; Column: DB 5HT 30 m x 0.25 mm x 0.25 μm) Injection: not given
12 500 Samples taken as is Soxhlet extraction (CH2Cl2, 24 h) Dilution UV protection: yes
Internal standards: 13C labelled BDE 209 (nona-BDEs. BDE-209, BB-209), unlabelled BDE-58 (all others) Calibration: Native congeners from Accustandard, Chiron and Wellington Laboratories
GC-quadrupole-ECNI-MS Column: DB-5 (15 m x 0.25 mm x 0.25 μm) (nona and deca BDEs, Deca-BB); CP-SIL8 ( 50 m x 0.25 mmx 0.25 μm) (others); Injection: Splitless, 275 °C
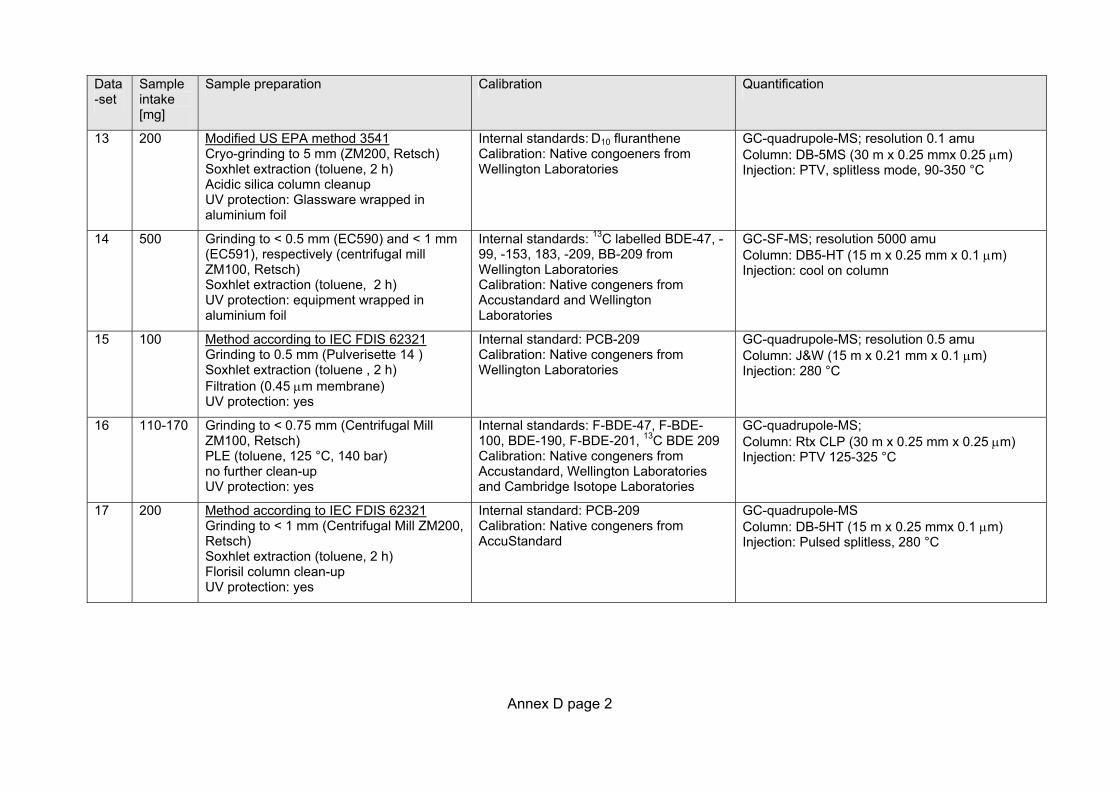
Annex D page 2
Data-set
Sample intake [mg]
Sample preparation Calibration Quantification
13 200 Modified US EPA method 3541 Cryo-grinding to 5 mm (ZM200, Retsch) Soxhlet extraction (toluene, 2 h) Acidic silica column cleanup UV protection: Glassware wrapped in aluminium foil
Internal standards: D10 fluranthene Calibration: Native congoeners from Wellington Laboratories
GC-quadrupole-MS; resolution 0.1 amu Column: DB-5MS (30 m x 0.25 mmx 0.25 μm) Injection: PTV, splitless mode, 90-350 °C
14 500 Grinding to < 0.5 mm (EC590) and < 1 mm (EC591), respectively (centrifugal mill ZM100, Retsch) Soxhlet extraction (toluene, 2 h) UV protection: equipment wrapped in aluminium foil
Internal standards: 13C labelled BDE-47, -99, -153, 183, -209, BB-209 from Wellington Laboratories Calibration: Native congeners from Accustandard and Wellington Laboratories
GC-SF-MS; resolution 5000 amu Column: DB5-HT (15 m x 0.25 mm x 0.1 μm) Injection: cool on column
15 100 Method according to IEC FDIS 62321 Grinding to 0.5 mm (Pulverisette 14 ) Soxhlet extraction (toluene , 2 h) Filtration (0.45 μm membrane) UV protection: yes
Internal standard: PCB-209 Calibration: Native congeners from Wellington Laboratories
GC-quadrupole-MS; resolution 0.5 amu Column: J&W (15 m x 0.21 mm x 0.1 μm) Injection: 280 °C
16 110-170 Grinding to < 0.75 mm (Centrifugal Mill ZM100, Retsch) PLE (toluene, 125 °C, 140 bar) no further clean-up UV protection: yes
Internal standards: F-BDE-47, F-BDE-100, BDE-190, F-BDE-201, 13C BDE 209 Calibration: Native congeners from Accustandard, Wellington Laboratories and Cambridge Isotope Laboratories
GC-quadrupole-MS; Column: Rtx CLP (30 m x 0.25 mm x 0.25 μm) Injection: PTV 125-325 °C
17 200 Method according to IEC FDIS 62321 Grinding to < 1 mm (Centrifugal Mill ZM200, Retsch) Soxhlet extraction (toluene, 2 h) Florisil column clean-up UV protection: yes
Internal standard: PCB-209 Calibration: Native congeners from AccuStandard
GC-quadrupole-MS Column: DB-5HT (15 m x 0.25 mmx 0.1 μm) Injection: Pulsed splitless, 280 °C
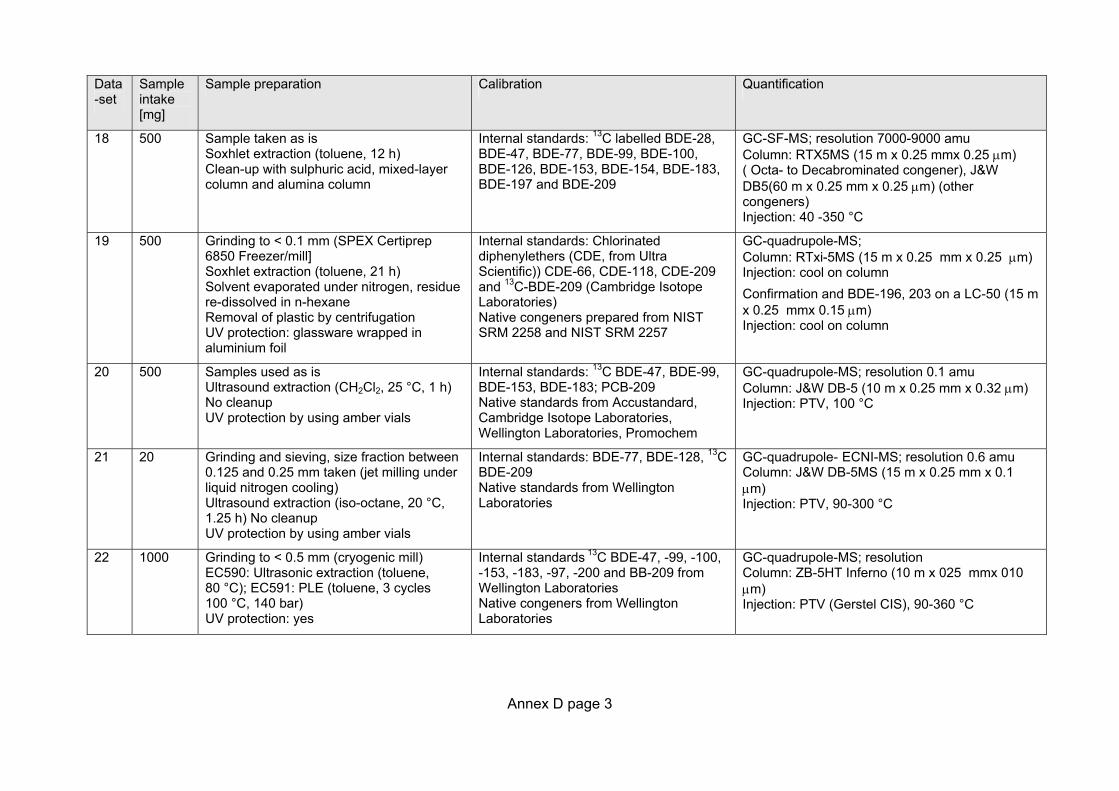
Annex D page 3
Data-set
Sample intake [mg]
Sample preparation Calibration Quantification
18 500 Sample taken as is Soxhlet extraction (toluene, 12 h) Clean-up with sulphuric acid, mixed-layer column and alumina column
Internal standards: 13C labelled BDE-28, BDE-47, BDE-77, BDE-99, BDE-100, BDE-126, BDE-153, BDE-154, BDE-183, BDE-197 and BDE-209
GC-SF-MS; resolution 7000-9000 amu Column: RTX5MS (15 m x 0.25 mmx 0.25 μm) ( Octa- to Decabrominated congener), J&W DB5(60 m x 0.25 mm x 0.25 μm) (other congeners) Injection: 40 -350 °C
19 500 Grinding to < 0.1 mm (SPEX Certiprep 6850 Freezer/mill] Soxhlet extraction (toluene, 21 h) Solvent evaporated under nitrogen, residue re-dissolved in n-hexane Removal of plastic by centrifugation UV protection: glassware wrapped in aluminium foil
Internal standards: Chlorinated diphenylethers (CDE, from Ultra Scientific)) CDE-66, CDE-118, CDE-209 and 13C-BDE-209 (Cambridge Isotope Laboratories) Native congeners prepared from NIST SRM 2258 and NIST SRM 2257
GC-quadrupole-MS; Column: RTxi-5MS (15 m x 0.25 mm x 0.25 μm) Injection: cool on column
Confirmation and BDE-196, 203 on a LC-50 (15 m x 0.25 mmx 0.15 μm) Injection: cool on column
20 500 Samples used as is Ultrasound extraction (CH2Cl2, 25 °C, 1 h) No cleanup UV protection by using amber vials
Internal standards: 13C BDE-47, BDE-99, BDE-153, BDE-183; PCB-209 Native standards from Accustandard, Cambridge Isotope Laboratories, Wellington Laboratories, Promochem
GC-quadrupole-MS; resolution 0.1 amu Column: J&W DB-5 (10 m x 0.25 mm x 0.32 μm) Injection: PTV, 100 °C
21 20 Grinding and sieving, size fraction between 0.125 and 0.25 mm taken (jet milling under liquid nitrogen cooling) Ultrasound extraction (iso-octane, 20 °C, 1.25 h) No cleanup UV protection by using amber vials
Internal standards: BDE-77, BDE-128, 13C BDE-209 Native standards from Wellington Laboratories
GC-quadrupole- ECNI-MS; resolution 0.6 amu Column: J&W DB-5MS (15 m x 0.25 mm x 0.1 μm) Injection: PTV, 90-300 °C
22 1000 Grinding to < 0.5 mm (cryogenic mill) EC590: Ultrasonic extraction (toluene, 80 °C); EC591: PLE (toluene, 3 cycles 100 °C, 140 bar) UV protection: yes
Internal standards 13C BDE-47, -99, -100, -153, -183, -97, -200 and BB-209 from Wellington Laboratories Native congeners from Wellington Laboratories
GC-quadrupole-MS; resolution Column: ZB-5HT Inferno (10 m x 025 mmx 010 μm) Injection: PTV (Gerstel CIS), 90-360 °C
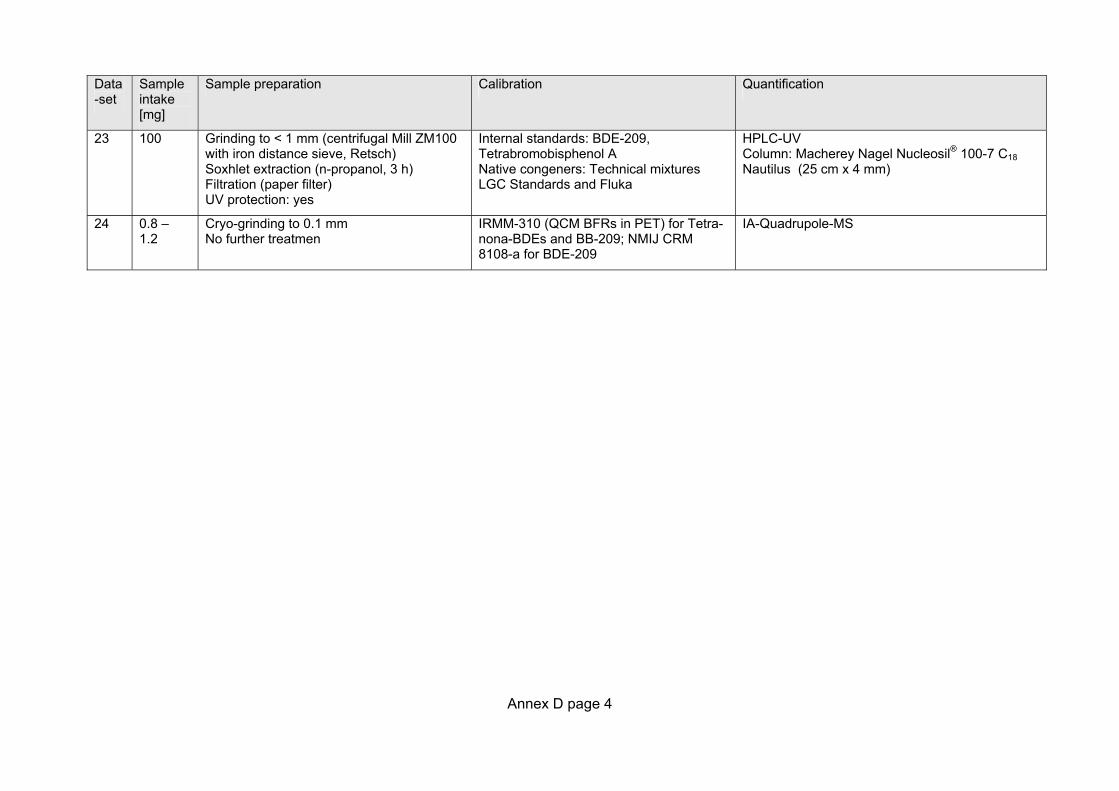
Annex D page 4
Data-set
Sample intake [mg]
Sample preparation Calibration Quantification
23 100 Grinding to < 1 mm (centrifugal Mill ZM100 with iron distance sieve, Retsch) Soxhlet extraction (n-propanol, 3 h) Filtration (paper filter) UV protection: yes
Internal standards: BDE-209, Tetrabromobisphenol A Native congeners: Technical mixtures LGC Standards and Fluka
HPLC-UV Column: Macherey Nagel Nucleosil® 100-7 C18 Nautilus (25 cm x 4 mm)
24 0.8 – 1.2
Cryo-grinding to 0.1 mm No further treatmen
IRMM-310 (QCM BFRs in PET) for Tetra-nona-BDEs and BB-209; NMIJ CRM 8108-a for BDE-209
IA-Quadrupole-MS

Annex E page 1
Annex E: Graphical depiction of the results of the characterisation study. Laboratories marked with an asterisk (*) are used for confirmation only (Laboratory 15; alternative column laboratory 19); Q-MS: Quadrupol-MS; SF-MS: Sectorfield-MS ERM-EC590 – Br
Lab Method Average s Expanded uncertainty
(k=2) [g/kg] [g/kg] [g/kg]
1 k0NAA 2.2207 0.0104 0.0999 2 k0NAA 2.2293 0.0303 0.1315 3 INAA 2.1752 0.0426 0.0326 4 titration 2.1613 0.0737 0.0497
5 ICP-HRMS 2.0210 0.0693 0.2627
6 IC 1.9810 0.0643 0.1842 ERM-EC590 - Sb
Lab Method Average s Expanded uncertainty
(k=2) [g/kg] [g/kg] [g/kg]
1 k0NAA 0.7340 0.0067 0.0360 2 k0NAA 0.7632 0.0074 0.0500 3 INAA 0.7700 0.0333 0.0490
ERM-EC590 BDE-47
Lab MS type Average s Expanded uncertainty
(k=2) [g/kg] [g/kg] [g/kg] 8 Q-MS 0.2417 0.0075 0.0335 9 Q-MS 0.2525 0.0692 0.0138
10 SF-MS 0.2531 0.0070 0.0140 12 Q-MS 0.1950 0.0055 0.0683 14 SF-MS 0.2515 0.0070 0.0140 16 Q-MS 0.2434 0.0100 0.0365 17 Q-MS 0.2400 0.0126 0.0149 18 SF-MS 0.2083 0.0454 0.0625 19 Q-MS 0.1657 0.0097 0.0150 21 Q-MS 0.2637 0.0116 0.0158 22 Q-MS 0.2576 0.0073 0.0245
15* Q-MS 0.2600 0.0260
ERM-EC590 - Br
1.501.601.701.801.902.002.102.202.302.402.50
1-k0
NAA
2-k0
NAA
3-IN
AA
4-tit
ratio
n
5-IC
P-H
RM
S
6-IC
Mas
s fr
actio
n [g
g/kg
]
ERM-EC590 - Sb
0.620.640.660.680.700.720.740.760.780.800.820.84
1-k0
NAA
2-k0
NAA
3-IN
AA
Mas
s fr
actio
n [g
/kg]
ERM-EC590 BDE-47
0.00
0.05
0.10
0.15
0.20
0.25
0.30
0.35
0.40
0.45
8-Q
-MS
9-Q
-MS
10-S
F-M
S
12-Q
-MS
14-S
F-M
S
16-Q
-MS
17-Q
-MS
18-S
F-M
S
19-Q
-MS
21-Q
-MS
22-Q
-MS
15*-
Q-M
S
Mas
s fr
actio
n [g
/kg]

Annex E page 2
ERM-EC590 BDE-99
Lab MS type Average s Expanded uncertainty
(k=2) [g/kg] [g/kg] [g/kg] 8 Q-MS 0.3017 0.0041 0.0418 9 Q-MS 0.3082 0.0411 0.00509
10 SF-MS 0.3246 0.0120 0.0240 12 Q-MS 0.3183 0.0041 0.1114 14 SF-MS 0.3079 0.0110 0.0220 16 Q-MS 0.2844 0.0100 0.0427 17 Q-MS 0.3167 0.0175 0.0323 18 SF-MS 0.2850 0.0647 0.0855 19 Q-MS 0.2167 0.0095 0.0120 21 Q-MS 0.3285 0.0062 0.0197 22 Q-MS 0.3306 0.0047 0.0565
15* Q-MS 0.3160 0.0316 19* LC-50 0.3150 0.0140
ERM-EC590 BDE-100
Lab MS type Average s Expanded uncertainty
(k=2) [g/kg] [g/kg] [g/kg] 8 Q-MS 0.0622 0.0010 0.0086 9 Q-MS 0.0628 0.0041 0.0008
10 SF-MS 0.0650 0.0020 0.0040 12 Q-MS 0.0627 0.0023 0.0219 14 SF-MS 0.0634 0.0016 0.0032 16 Q-MS 0.0579 0.0027 0.0087 17 Q-MS 0.0678 0.0026 0.0062 18 SF-MS 0.0652 0.0039 0.0196 19 Q-MS 0.0554 0.0059 0.0055 21 Q-MS 0.0671 0.0016 0.0054 22 Q-MS 0.0638 0.0020 0.0079
15* Q-MS 0.0650 0.0065 19* LC-50 0.0592 0.0035
ERM-EC590 BDE-99
0.00
0.10
0.20
0.30
0.40
0.50
8-Q
-MS
9-Q
-MS
10-S
F-M
S
12-Q
-MS
14-S
F-M
S
16-Q
-MS
17-Q
-MS
18-S
F-M
S
19-Q
-MS
21-Q
-MS
22-Q
-MS
15*-
Q-M
S
19*-
LC-5
0
Mas
s fr
actio
n [g
/kg]
ERM-EC590 BDE-100
0.000
0.020
0.040
0.060
0.080
0.100
8-Q
-MS
9-Q
-MS
10-S
F-M
S
12-Q
-MS
14-S
F-M
S
16-Q
-MS
17-Q
-MS
18-S
F-M
S
19-Q
-MS
21-Q
-MS
22-Q
-MS
15*-
Q-M
S
19*-
LC-5
0
Mas
s fr
actio
n [g
/kg]

Annex E page 3
ERM-EC590 BDE-153 Lab MS type Average s Expanded
uncertainty (k=2)
[g/kg] [g/kg] [g/kg] 8 Q-MS 0.0495 0.0016 0.0069 9 Q-MS 0.0441 0.0059 0.0012
10 SF-MS 0.0473 0.0026 0.0052 12 Q-MS 0.0435 0.0010 0.0152 14 SF-MS 0.0435 0.0023 0.0046 16 Q-MS 0.0441 0.0020 0.0088 17 Q-MS 0.0528 0.0021 0.0045 18 SF-MS 0.0515 0.0066 0.0155 19 Q-MS 0.0470 0.0006 0.0016 21 Q-MS 0.0506 0.0019 0.0040 22 Q-MS 0.0476 0.0011 0.0073
15* Q-MS 0.0530 0.0053 19* LC-50 0.0533 0.0026
ERM-EC590 BDE-154
Lab MS type Average s Expanded uncertainty
(k=2) [g/kg] [g/kg] [g/kg] 8 Q-MS 0.0260 0.0006 0.0036
10 SF-MS 0.0273 0.0017 0.0034 12 Q-MS 0.0245 0.0005 0.0086 14 SF-MS 0.0280 0.0016 0.0032 16 Q-MS 0.0227 0.0009 0.0057 18 SF-MS 0.0267 0.0065 0.0080 19 Q-MS 0.0250 0.0003 0.0009
19* LC-50 0.0257 0.0013
ERM-EC590 BDE-183
Lab MS type Average s Expanded uncertainty
(k=2) [g/kg] [g/kg] [g/kg] 8 Q-MS 0.1373 0.0032 0.0191 9 Q-MS 0.1433 0.0126 0.0025
10 SF-MS 0.1234 0.0034 0.0069 12 Q-MS 0.1200 0.0063 0.0420 14 SF-MS 0.1344 0.0151 0.0302 16 Q-MS 0.1271 0.0040 0.0381 17 Q-MS 0.1467 0.0082 0.0170 18 SF-MS 0.1402 0.0325 0.0421 19 Q-MS 0.1203 0.0056 0.0050 21 Q-MS 0.1274 0.0022 0.0089 22 Q-MS 0.1359 0.0018 0.0122
15* Q-MS 0.1490 0.0149
ERM-EC590 BDE-153
0.00
0.02
0.04
0.06
0.08
8-Q
-MS
9-Q
-MS
10-S
F-M
S
12-Q
-MS
14-S
F-M
S
16-Q
-MS
17-Q
-MS
18-S
F-M
S
19-Q
-MS
21-Q
-MS
22-Q
-MS
15*-
Q-M
S
19*-
LC-5
0
Mas
s fr
actio
n [g
/kg]
ERM-EC590 BDE-154
0.000
0.005
0.010
0.015
0.020
0.025
0.030
0.035
0.040
8-Q
-MS
10-S
F-M
S
12-Q
-MS
14-S
F-M
S
16-Q
-MS
18-S
F-M
S
19-Q
-MS
19*-
LC-5
0
Mas
s fr
actio
n [g
/kg]
ERM-EC590 BDE-183
0.00
0.04
0.08
0.12
0.16
0.20
8-Q
-MS
9-Q
-MS
10-S
F-M
S
12-Q
-MS
14-S
F-M
S
16-Q
-MS
17-Q
-MS
18-S
F-M
S
19-Q
-MS
21-Q
-MS
22-Q
-MS
15*-
Q-M
S
Mas
s fr
actio
n [g
/kg]

Annex E page 4
ERM-EC590 BDE-197+204 Lab MS type Average s Expanded
uncertainty (k=2)
[g/kg] [g/kg] [g/kg] 8 Q-MS 0.0790 0.0037 0.0110 9 Q-MS 0.0708 0.0078 0.010
10 SF-MS 0.0677 0.0026 0.0053 14 SF-MS 0.0789 0.0157 0.0315 16 Q-MS 0.0684 0.0032 0.0205 17 Q-MS 0.0872 0.0061 0.0132 18 SF-MS 0.0720 0.0115 0.0216 19 Q-MS 0.0830 0.0030 0.0032 21 Q-MS 0.0787 0.0034 0.0055 22 Q-MS 0.0745 0.0013 0.0091
19* LC-50 0.1000 0.0050 15* Q-MS 0.0670 0.0067
ERM-EC590 BDE-209
Lab MS type Average s Expanded uncertainty
(k=2) [g/kg] [g/kg] [g/kg] 9 Q-MS 0.5980 0.2235 0.306
10 SF-MS 0.6449 0.0246 0.0491 12 Q-MS 0.7050 0.0105 0.2468 14 SF-MS 0.6606 0.0739 0.1480 16 Q-MS 0.6301 0.0364 0.2835 17 Q-MS 0.6650 0.0327 0.0519 18 SF-MS 0.6417 0.0264 0.1925 19 Q-MS 0.6120 0.0273 0.0270 21 Q-MS 0.6975 0.0203 0.0349 22 Q-MS 0.6934 0.0164 0.0638
15* Q-MS 0.6950 0.0695
ERM-EC590 BB-209
Lab MS type Average s Expanded uncertainty
(k=2) [g/kg] [g/kg] [g/kg] 9 Q-MS 0.6497 0.0774 0.155
10 SF-MS 0.6335 0.0277 0.0553 12 Q-MS 0.5750 0.0459 0.2013 14 SF-MS 0.7157 0.0590 0.1181 16 Q-MS 0.5571 0.0337 0.2785 17 Q-MS 0.5267 0.0273 0.0685 19 Q-MS 0.6703 0.0604 0.0600 22 Q-MS 0.7442 0.0114 0.0607
ERM-EC590 BDE-197+204
0.00
0.02
0.04
0.06
0.08
0.10
0.12
8-Q
-MS
9-Q
-MS
10-S
F-M
S
14-S
F-M
S
16-Q
-MS
17-Q
-MS
18-S
F-M
S
19-Q
-MS
21-Q
-MS
22-Q
-MS
19*-
LC-5
0
15*-
Q-M
S
Mas
s fr
actio
n [g
/kg]
ERM-EC590 BDE-209
0.0
0.2
0.4
0.6
0.8
1.0
9-Q
-MS
10-S
F-M
S
12-Q
-MS
14-S
F-M
S
16-Q
-MS
17-Q
-MS
18-S
F-M
S
19-Q
-MS
21-Q
-MS
22-Q
-MS
15*-
Q-M
S
Mas
s fr
actio
n [g
/kg]
ERM-EC590 BB-209
0.0
0.2
0.4
0.6
0.8
1.0
9-Q
-MS
10-S
F-M
S
12-Q
-MS
14-S
F-M
S
16-Q
-MS
17-Q
-MS
19-Q
-MS
22-Q
-MS
Mas
s fr
actio
n [g
/kg]

Annex E page 5
ERM-EC591 – Br
Lab Method Average s Expanded uncertainty
(k=2) [g/kg] [g/kg] [g/kg] 1 k0NAA 2.1183 0.0130 0.0996 2 k0NAA 2.1258 0.0198 0.1275 3 INAA 2.1000 0.0510 0.0336 4 titration 2.1522 0.0717 0.0495 5 ICP-
HRMS 2.0555 0.1311 0.2672
6 IC 1.9445 0.0908 0.1808 ERM-EC591 - Sb
Lab Method Average s Expanded uncertainty
(k=2) [g/kg] [g/kg] [g/kg] 1 k0NAA 0.6923 0.0117 0.0353 2 k0NAA 0.7228 0.0059 0.0477 3 INAA 0.7233 0.0195 0.0412
ERM-EC591 BDE-28
Lab MS type Average s Expanded uncertainty
(k=2) [g/kg] [g/kg] [g/kg]
10 SF-MS 0.00255 0.0001 0.0001 11 Q-MS 0.00316 0.0001 0.00031 12 Q-MS 0.00252 0.0001 0.00088 14 SF-MS 0.00258 0.0001 0.00024 18 SF-MS 0.00225 0.0001 0.00007 19 Q-MS 0.00223 0.0003 0.00028
19* Q-MS 0.00222 0.0000 0.00020
ERM-EC591 - Br
1.50
1.70
1.90
2.10
2.30
2.50
1-k0
NAA
2-k0
NAA
3-IN
AA
4-tit
ratio
n
5-IC
P-H
RM
S
6-IC
Mas
s fr
actio
n [g
g/kg
]
ERM-EC591 - Sb
0.60
0.65
0.70
0.75
0.80
1-k0
NAA
2-k0
NAA
3-IN
AA
Mas
s fr
actio
n [g
/kg]
ERM-EC591 BDE-28
0.000
0.001
0.002
0.003
0.004
10-S
F-M
S
11-Q
-MS
12-Q
-MS
14-S
F-M
S
18-S
F-M
S
19-Q
-MS
19*-
Q-M
S
Mas
s fr
actio
n [g
/kg]

Annex E page 6
ERM-EC591 BDE-47
Lab MS type Average s Expanded uncertainty
(k=2) [g/kg] [g/kg] [g/kg] 8 Q-MS 0.2450 0.0207 0.0341 9 Q-MS 0.2510 0.0713 0.1426
10 SF-MS 0.2693 0.0066 0.0132 11 Q-MS 0.2325 0.0140 0.0231 12 Q-MS 0.2100 0.0000 0.0735 14 SF-MS 0.2586 0.0072 0.0144 16 Q-MS 0.2601 0.0064 0.0390 17 Q-MS 0.2517 0.0147 0.0156 18 SF-MS 0.2467 0.0234 0.0740 19 Q-MS 0.1752 0.0071 0.0151 21 Q-MS 0.2805 0.0095 0.0224 22 Q-MS 0.2604 0.0083 0.0247
15* Q-MS 0.2650 0.0265
ERM-EC591 BDE-99
Lab MS type Average s Expanded uncertainty
(k=2) [g/kg] [g/kg] [g/kg] 8 Q-MS 0.3183 0.0194 0.0442 9 Q-MS 0.3342 0.0293 0.0431
10 SF-MS 0.3476 0.0066 0.0132 11 Q-MS 0.2824 0.0099 0.0169 12 Q-MS 0.3400 0.0000 0.1190 14 SF-MS 0.3137 0.0100 0.0200 16 Q-MS 0.3035 0.0106 0.0455 17 Q-MS 0.3250 0.0207 0.0332 18 SF-MS 0.3167 0.0186 0.0950 19 Q-MS 0.2282 0.0056 0.0110 21 Q-MS 0.3507 0.0071 0.0281 22 Q-MS 0.3396 0.0099 0.0581
15* Q-MS 0.3200 0.0320 19* Q-MS 0.3240 0.0220
ERM-EC591 BDE-47
0.00
0.10
0.20
0.30
0.40
0.50
8-Q
-MS
9-Q
-MS
10-S
F-M
S
11-Q
-MS
12-Q
-MS
14-S
F-M
S
16-Q
-MS
17-Q
-MS
18-S
F-M
S
19-Q
-MS
21-Q
-MS
22-Q
-MS
15*-
Q-M
S
Mas
s fr
actio
n [g
/kg]
ERM-EC591 BDE-99
0.0
0.1
0.2
0.3
0.4
0.58-
Q-M
S
9-Q
-MS
10-S
F-M
S
11-Q
-MS
12-Q
-MS
14-S
F-M
S
16-Q
-MS
17-Q
-MS
18-S
F-M
S
19-Q
-MS
21-Q
-MS
22-Q
-MS
15*-
Q-M
S
19*-
Q-M
S
Mas
s fr
actio
n [g
/kg]

Annex E page 7
ERM-EC591 BDE-100 Lab MS type Average s Expanded
uncertainty (k=2)
[g/kg] [g/kg] [g/kg] 8 Q-MS 0.0655 0.0010 0.0091 9 Q-MS 0.0632 0.0075 0.0085
10 SF-MS 0.0704 0.0012 0.0024 11 Q-MS 0.0626 0.0016 0.0062 12 Q-MS 0.0673 0.0019 0.0236 14 SF-MS 0.0630 0.0021 0.0043 16 Q-MS 0.0619 0.0013 0.0093 17 Q-MS 0.0727 0.0029 0.0067 18 SF-MS 0.0688 0.0068 0.0206 19 Q-MS 0.0594 0.0026 0.0008 21 Q-MS 0.0711 0.0010 0.0064 22 Q-MS 0.0660 0.0026 0.0081
15* Q-MS 0.0710 0.0071 19* Q-MS 0.0613 0.0044
ERM-EC591 BDE-153 Lab MS type Average s Expanded
uncertainty (k=2)
[g/kg] [g/kg] [g/kg] 8 Q-MS 0.0447 0.0012 0.0062 9 Q-MS 0.0429 0.0039 0.0078
10 SF-MS 0.0436 0.0004 0.0009 11 Q-MS 0.0496 0.0016 0.0049 12 Q-MS 0.0398 0.0013 0.0139 14 SF-MS 0.0395 0.0013 0.0025 16 Q-MS 0.0399 0.0006 0.0080 17 Q-MS 0.0500 0.0019 0.0043 18 SF-MS 0.0473 0.0038 0.0142 19 Q-MS 0.0424 0.0007 0.0015 21 Q-MS 0.0463 0.0024 0.0037 22 Q-MS 0.0424 0.0013 0.0065
15* Q-MS 0.0500 0.0050 19* Q-MS 0.0501 0.0017
ERM-EC591 BDE-154 Lab MS type Average s Expanded
uncertainty (k=2)
[g/kg] [g/kg] [g/kg] 8 Q-MS 0.0262 0.0004 0.0036
10 SF-MS 0.0299 0.0020 0.0039 11 Q-MS 0.0245 0.0007 0.0013 12 Q-MS 0.0262 0.0008 0.0092 14 SF-MS 0.0284 0.0023 0.0046 16 Q-MS 0.0241 0.0005 0.0060 18 SF-MS 0.0245 0.0035 0.0074 19 Q-MS 0.0264 0.0004 0.0010
19* Q-MS 0.0274 0.0018
ERM-EC591 BDE-100
0.00
0.02
0.04
0.06
0.08
0.10
8-Q
-MS
9-Q
-MS
10-S
F-M
S
11-Q
-MS
12-Q
-MS
14-S
F-M
S
16-Q
-MS
17-Q
-MS
18-S
F-M
S
19-Q
-MS
21-Q
-MS
22-Q
-MS
15*-
Q-M
S
19*-
Q-M
S
Mas
s fr
actio
n [g
/kg]
ERM-EC591 BDE-153
0.00
0.01
0.02
0.03
0.04
0.05
0.06
0.07
8-Q
-MS
9-Q
-MS
10-S
F-M
S
11-Q
-MS
12-Q
-MS
14-S
F-M
S
16-Q
-MS
17-Q
-MS
18-S
F-M
S
19-Q
-MS
21-Q
-MS
22-Q
-MS
15*-
Q-M
S
19*-
Q-M
S
Mas
s fr
actio
n [g
/kg]
ERM-EC591 BDE-154
0.00
0.01
0.02
0.03
0.04
8-Q
-MS
10-S
F-M
S
11-Q
-MS
12-Q
-MS
14-S
F-M
S
16-Q
-MS
18-S
F-M
S
19-Q
-MS
19*-
Q-M
S
Mas
s fr
actio
n [g
/kg]

Annex E page 8
ERM-EC591 BDE-183
Lab MS type Average s Expanded uncertainty
(k=2) [g/kg] [g/kg] [g/kg] 8 Q-MS 0.0888 0.0044 0.0123 9 Q-MS 0.0818 0.0059 0.0117
10 SF-MS 0.0852 0.0016 0.0032 11 Q-MS 0.0795 0.0029 0.0079 12 Q-MS 0.0755 0.0079 0.0264 14 SF-MS 0.0910 0.0129 0.0259 16 Q-MS 0.0842 0.0019 0.0253 17 Q-MS 0.1033 0.0052 0.0120 18 SF-MS 0.0965 0.0175 0.0290 19 Q-MS 0.0810 0.0032 0.0032 21 Q-MS 0.0853 0.0009 0.0068 22 Q-MS 0.0863 0.0019 0.0078
15* Q-MS 0.1030 0.0103
ERM-EC591 BDE-197+204
Lab MS type Average s Expanded uncertainty
(k=2) [g/kg] [g/kg] [g/kg] 8 Q-MS 0.0527 0.0029 0.0073 9 Q-MS 0.0447 0.0046 0.0043
10 SF-MS 0.0475 0.0007 0.0014 11 Q-MS 0.0440 0.0015 0.0046 14 SF-MS 0.0608 0.0172 0.0345 16 Q-MS 0.0457 0.0013 0.0137 17 Q-MS 0.0628 0.0050 0.0096 18 SF-MS 0.0545 0.0083 0.0164 19 Q-MS 0.0562 0.0009 0.0016 21 Q-MS 0.0535 0.0014 0.0043 22 Q-MS 0.0480 0.0014 0.0059
15* Q-MS 0.0770 0.0077 19* Q-MS 0.0652 0.0023
ERM-EC591 BDE-183
0.04
0.06
0.08
0.10
0.12
0.14
8-Q
-MS
9-Q
-MS
10-S
F-M
S
11-Q
-MS
12-Q
-MS
14-S
F-M
S
16-Q
-MS
17-Q
-MS
18-S
F-M
S
19-Q
-MS
21-Q
-MS
22-Q
-MS
15*-
Q-M
S
Mas
s fr
actio
n [g
/kg]
ERM-EC591 BDE-197+204
0.00
0.02
0.04
0.06
0.08
0.10
0.12
8-Q
-MS
9-Q
-MS
10-S
F-M
S
11-Q
-MS
14-S
F-M
S
16-Q
-MS
17-Q
-MS
18-S
F-M
S
19-Q
-MS
21-Q
-MS
22-Q
-MS
15*-
Q-M
S
19*-
Q-M
S
Mas
s fr
actio
n [g
/kg]

Annex E page 9
ERM-EC591 BDE-209
Lab MS type Average s Expanded uncertainty
(k=2) [g/kg] [g/kg] [g/kg] 9 Q-MS 0.8383 0.6860 0.2280
10 SF-MS 0.8107 0.0288 0.0576 12 Q-MS 0.8133 0.0052 0.2847 14 SF-MS 0.7543 0.1024 0.2048 16 Q-MS 0.7512 0.0212 0.3380 17 Q-MS 0.8483 0.0299 0.0662 18 SF-MS 0.7183 0.0585 0.2155 19 Q-MS 0.7255 0.0267 0.0290 21 Q-MS 0.7947 0.0242 0.0397 22 Q-MS 0.7814 0.0191 0.0724
15* Q-MS 0.9220 0.0922 19* Q-MS 0.7240 0.0250
ERM-EC591 BB-209
Lab MS type Average s Expanded uncertainty
(k=2) [g/kg] [g/kg] [g/kg] 9 Q-MS 0.7785 0.0480 0.0960
10 SF-MS 0.7786 0.0113 0.0226 12 Q-MS 0.6517 0.0293 0.2281 14 SF-MS 0.7711 0.0713 0.1426 16 Q-MS 0.6736 0.0180 0.3368 17 Q-MS 0.7983 0.0293 0.1038 19 Q-MS 0.6883 0.0533 0.0551 22 Q-MS 0.8005 0.0148 0.0657
19* Q-MS 0.6430 0.0440
ERM-EC591 BDE-209
0.2
0.4
0.6
0.8
1.0
1.2
9-Q
-MS
10-S
F-M
S
12-Q
-MS
14-S
F-M
S
16-Q
-MS
17-Q
-MS
18-S
F-M
S
19-Q
-MS
21-Q
-MS
22-Q
-MS
15*-
Q-M
S
19*-
Q-M
S
Mas
s fr
actio
n [g
/kg]
ERM-EC591 BB-209
0.2
0.4
0.6
0.8
1.0
1.2
9-Q
-MS
10-S
F-M
S
12-Q
-MS
14-S
F-M
S
16-Q
-MS
17-Q
-MS
19-Q
-MS
22-Q
-MS
19*-
Q-M
S
Mas
s fr
actio
n [g
/kg]
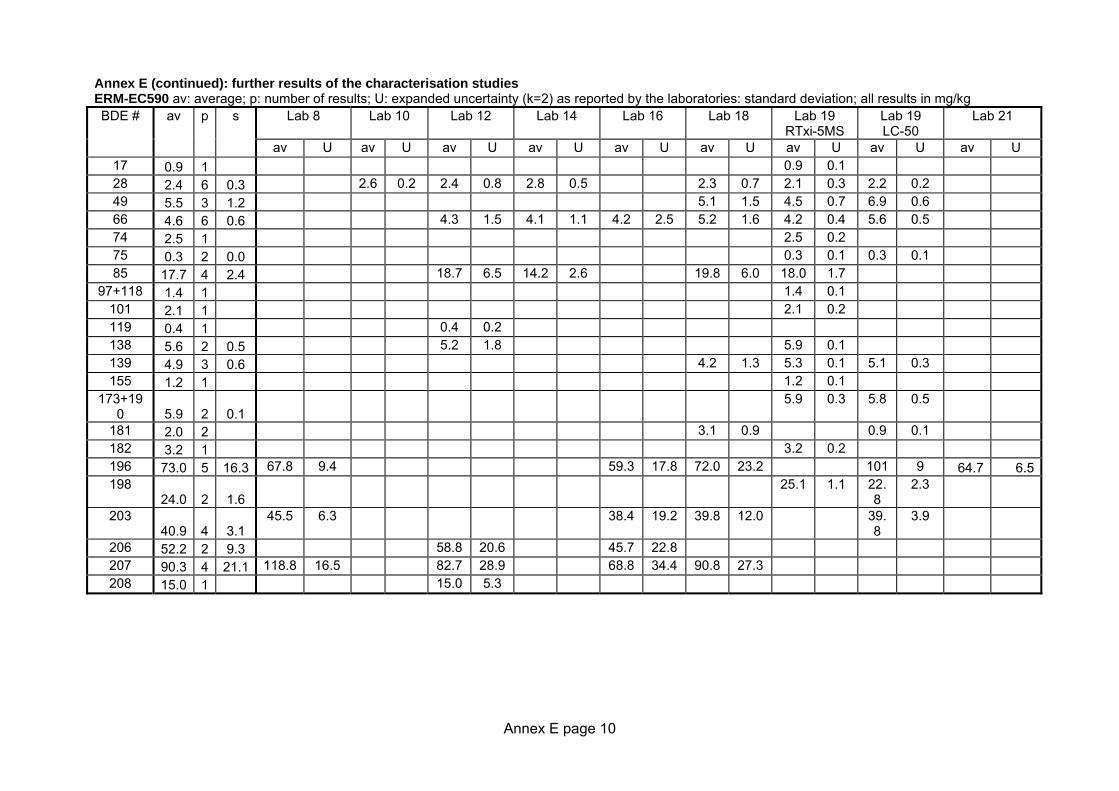
Annex E page 10
Annex E (continued): further results of the characterisation studies ERM-EC590 av: average; p: number of results; U: expanded uncertainty (k=2) as reported by the laboratories: standard deviation; all results in mg/kg
Lab 8 Lab 10 Lab 12 Lab 14 Lab 16 Lab 18 Lab 19 RTxi-5MS
Lab 19 LC-50
Lab 21 BDE # av p s
av U av U av U av U av U av U av U av U av U 17 0.9 1 0.9 0.1 28 2.4 6 0.3 2.6 0.2 2.4 0.8 2.8 0.5 2.3 0.7 2.1 0.3 2.2 0.2 49 5.5 3 1.2 5.1 1.5 4.5 0.7 6.9 0.6 66 4.6 6 0.6 4.3 1.5 4.1 1.1 4.2 2.5 5.2 1.6 4.2 0.4 5.6 0.5 74 2.5 1 2.5 0.2 75 0.3 2 0.0 0.3 0.1 0.3 0.1 85 17.7 4 2.4 18.7 6.5 14.2 2.6 19.8 6.0 18.0 1.7
97+118 1.4 1 1.4 0.1 101 2.1 1 2.1 0.2 119 0.4 1 0.4 0.2 138 5.6 2 0.5 5.2 1.8 5.9 0.1 139 4.9 3 0.6 4.2 1.3 5.3 0.1 5.1 0.3 155 1.2 1 1.2 0.1
173+190 5.9 2 0.1
5.9 0.3 5.8 0.5
181 2.0 2 3.1 0.9 0.9 0.1 182 3.2 1 3.2 0.2 196 73.0 5 16.3 67.8 9.4 59.3 17.8 72.0 23.2 101 9 64.7 6.5 198
24.0 2 1.6 25.1 1.1 22.
8 2.3
203 40.9 4 3.1
45.5 6.3 38.4 19.2 39.8 12.0 39.8
3.9
206 52.2 2 9.3 58.8 20.6 45.7 22.8 207 90.3 4 21.1 118.8 16.5 82.7 28.9 68.8 34.4 90.8 27.3 208 15.0 1 15.0 5.3

Annex E page 11
ERM-EC591 av: average; p: number of results; s: standard deviation; all results in mg/kg Lab 8 Lab 11 Lab 12 Lab 14 Lab 16 Lab 18 19
RTxi-5MS 19
LC-50 Lab 21 BDE # av p s
av U av U av U av U av U av U av U av U av U 17 0.9 1 0.9 0.1 49 5.5 3 0.6 6.0 0.0 5.7 1.7 4.8 0.7 66 4.6 5 0.7 4.6 1.6 3.9 1.4 4.2 2.5 5.9 1.8 4.5 0.4 74 2.4 1 2.4 0.2 75 0.4 2 0.0 0.4 0.1 0.4 0.0 85 19.1 5 1.7 19.5 1.9 20.2 7.1 16.4 2.2 20.7 6.2 19.0 0.8
97+118 1.3 1 1.3 0.1 101 2.2 1 2.2 0.1 138 5.5 2 0.3 5.3 1.9 5.7 0.1 139 5.1 3 0.5 4.7 1.4 5.6 0.2 5.0 0.2 155 1.4 1 1.4 0.1
173+190 4.3 2 0.2 4.1 0.2 4.5 0.5 180 5.4 1 5.4 0.5 181 0.8 1 0.8 0.1 182 2.3 1 2.3 0.1 196 25.7 6 6.5 23.0 3.2 23.0 2.3 19.6 5.9 36.3 10.9 28.3 2.5 23.8 1.9 198 6.1 2 3.7 8.7 0.4 3.5 0.4 203 15.3 5 3.4 16.2 2.2 14.4 1.4 12.7 6.4 20.8 6.3 12.6 1.2 206 30.4 4 11.1 40.3 5.9 39.3 3.9 23.5 8.2 18.4 9.2 207 43.8 5 22.6 68.3 9.5 15.5 1.5 38.5 13.5 31.4 15.7 65.2 19.6 208 6.6 1 6.6 2.3

European Commission EUR 23677 EN – Joint Research Centre – Institute for Reference Materials and Measurements Title: Certification of the mass fractions of various polybrominated diphenyl ethers (PBDEs), decabrominated biphenyl and total Br and Total Sb in two polymer reference materials, ERM®-EC590 and ERM®-EC591 Author(s): T. Linsinger, A. Birgersson-Liebich, F. Pellizzato, T. Venelinov, S. Voorspoels, A. Lamberty Luxembourg: Office for Official Publications of the European Communities 2009 – 55 pp. – 21.0 x 29.7 cm EUR – Scientific and Technical Research series – ISSN 1018-5593 ISBN 978-92-79-11105-1 DOI 10.2787/9764 Abstract This report describes the preparation and certification of the polymer certified reference materials (CRM) ERM-EC590 and ERM-EC591. The CRMs have been certified by the European Commission, Joint Research Centre, Institute for Reference Materials and Measurements (IRMM), Geel, Belgium. The CRMs were prepared from a low-density polyethylene granulate and polypropylene granulate spiked with technical mixtures of brominated diphenylethers (BDEs) and brominated biphenyls (BB). Technical Penta-BDE, Octa-BDE, Deca-BDE and Deca-BB were added. Certification of the CRM included testing of the homogeneity and stability of the material as well as the characterisation using an intercomparison approach. The CRMs have been certified for their content of Br as well as for several BDE congeners and decabrominated biphenyl (BB-209). Indicative values have been established for Sb. Additional information about several BDE-congeners is given. These CRMs are intended for use in quality assurance of measurements of BDEs. BB-209 and elements in polymers and related matrices. Uncertainties are expanded uncertainties estimated in accordance with the Guide to the Expression of Uncertainty in Measurement (GUM) with a coverage factor of k = 2, corresponding to a level of confidence of about 95 %. The following values were assigned. Certified values
ERM-EC590
[g/kg] ERM-EC591
[g/kg] Br 2.13 ± 0.09 2.08 ± 0.07 2,4,4'-TriBDE (BDE-28) 0.0025 ± 0.0006 2,2',4,4'-TetraBDE (BDE-47) 0.23 ± 0.04 0.245 ± 0.023 2,2',3,4,4'-PentaBDE (BDE-99) 0.30 ± 0.06 0.32 ± 0.04 2,2',4,4',6-PentaBDE (BDE-100) 0.063 ± 0.016 0.066 ± 0.007 2,2',4,4',5,5'-HexaBDE (BDE-153) 0.047 ± 0.012 0.044 ± 0.010 2,2',4,4',5,6'-HexaBDE (BDE-154) 0.026 ± 0.007 0.027 ± 0.006 2,2',3,4,4',5,6'-HeptaBDE (BDE-183) 0.132 ± 0.012 0.087 ± 0.008 2,2',3,3',4,4',6,6'-OctaBDE + 2,2',3, 4,4',5,6,6'-OctaBDE (BDE-197+204)
0.076 ± 0.015 0.052 ± 0.009
DecaBDE (BDE-209) 0.66 ± 0.10 0.78 ± 0.09 DecaBB (BB-209) 0.63 ± 0.10 0.74 ± 0.08
Indicative values
ERM-EC590
[g/kg] ERM-EC591
[g/kg] Sb 0.756 ± 0.025 0.713 ± 0.022

How to obtain EU publications Our priced publications are available from EU Bookshop (http://bookshop.europa.eu), where you can place an order with the sales agent of your choice. The Publications Office has a worldwide network of sales agents. You can obtain their contact details by sending a fax to (352) 29 29-42758.

The mission of the JRC is to provide customer-driven scientific and technical support for the conception, development, implementation and monitoring of EU policies. As a service of the European Commission, the JRC functions as a reference centre of science and technology for the Union. Close to the policy-making process, it serves the common interest of the Member States, while being independent of special interests, whether private or national.
LA
-NA
-23677-EN-C


![[PPT]PowerPoint Presentation - Event Schedule & Agenda …schd.ws/hosted_files/2016agripspring/97/Joint ERM... · Web viewOutline ERM Frameworks Why CIS is Involved in ERM CIS ERM](https://static.fdocuments.net/doc/165x107/5ac13a447f8b9a4e7c8cc305/pptpowerpoint-presentation-event-schedule-agenda-schdwshostedfiles2016agripspring97joint.jpg)