![TSAS.600.004 - Royal Commission into Institutional ...€¦ · TSAS.600.004.1984 Chap. XVII] Difficulties in the Corps Re-instate ment. 5. Names may only be removed from in harmony](https://static.fdocuments.net/doc/165x107/5b0e5d547f8b9a3a0d8ba049/tsas600004-royal-commission-into-institutional-chap-xvii-difficulties.jpg)
Certification Data Exchange Project: The Impact of ... · – The Certification Data Exchange...
32
Certification Data Exchange Project: The Impact of Industry Credentials Gretchen Koch, CompTIA Pradeep Kotamraju, Iowa Department of Education Scott Parke, Florida College System Catherine Imperatore, ACTE Data Quality Institute November 4, 2015
Transcript of Certification Data Exchange Project: The Impact of ... · – The Certification Data Exchange...

Certification Data Exchange Project:
The Impact of Industry Credentials Gretchen Koch, CompTIA
Pradeep Kotamraju, Iowa Department of EducationScott Parke, Florida College System
Catherine Imperatore, ACTE
Data Quality Institute November 4, 2015

The work reported herein was supported under the Improving Program Performance Technical Assistance to States project, Contract Number (EDVAE-11-O-023) as administered by the Office of Career, Technical, and Adult Education, U.S. Department of Education. However, the contents do not necessarily represent the positions or policies of the Office of Career, Technical, and Adult Education or the U.S. Department of Education and you should not assume endorsement by the Federal Government.

Assessment and Certification Under Perkins IV
• History – Developing a common measure for Technical Skills Attainment
indicators (2S1, 1P1) – Counting industry certification for completion/credential
attainment indicators (3S1, 2P1) – State efforts – Workforce Credentials Coalition – The Certification Data Exchange Project
• What we have … – A hodge-podge of ways in which TSAs are measured within
states – Lack of comparability of TSAs across states – Little ability to track industry certification attainment – Data for accountability requirements v. program improvement – No information about value-added

Certification Data Exchange Project
• Match third-party industry certification data with state education and workforce data to learn – which students are taking certification exams? – which students are earning certifications? – what are the characteristics of these students? – how are employment and earnings related to taking
certification exams and earning certifications? • Project grew out of a 2012 Illinois-CompTIA pilot • Expanded to more states and industry certifiers in
2014 and 2015 • Receiving technical assistance from the Office of
Career, Technical, and Adult Education

Illinois•and•CompTIA• pilot
Roadmap•Step•2:•Conducting•additional• state•pilot•projects•and• developing•use•cases
Technical•Assistance• grants•to•participating•
states
Demonstration•at•US• Department•of•
Education
Roadmap•Step•1:• Raising•awareness•and•
gaining•consensus
Expansion•to•other• states•and••new•
industry•certifiers
Development•of••••••••••• 4 step•roadmap Involvement•of•ACTE
Roadmap•Step•3:• Developing•common•
data sharing••protocols

Illinois-CompTIA Pilot
• Research question – Can we report on characteristics and employment
outcomes of students who took and passed certification exams?
• CompTIA shared data with the state – Individual-level records for Illinois test-takers – Includes testing incidences and certifications earned – First name, last name, geographic code (zip)

Data from Certifying
Organization to State
Match to State Education Data
System
Education Data Matched to
Employment Data
Illinois matched certification records with community college student data Used SSN to match with unemployment insurance wage records State reported back aggregate results

A Taste of the Results: Illinois-CompTIA Pilot
Certified:•814•SSNs Not•Certified:•574•SSNs•
3rd Post•Exam•Average Earnings
Certified: $7,537/Quarter Not Certified: $5,288/Quarter
3rd Post Exam Average Earnings were $2,249•greater•for•certified•students.
Average•Earnings Gains:•3rd Post•Exam•vs.•Exam•Quarter
Certified: +12.3% Not Certified: +2.7%
Source: CompTIA and Illinois Community College Board

Illinois•and•CompTIA• pilot
Roadmap•Step•2:• Conducting•additional• state•pilot•projects•and• developing•use•cases
Technical•Assistance• grants•to•participating•
states
Demonstration•at•US• Department•of•
Education
Roadmap•Step•1:• Raising•awareness•and•
gaining•consensus
Expansion•to•other• states•and••new•
industry•certifiers
Development•of••••••••••• 4 step•roadmap Involvement•of•ACTE
Roadmap•Step•3:• Developing•common•
data sharing••protocols

Roadmap
1 • Raise awareness and gain consensus on need
2 • Develop use cases and conduct pilot projects
• Develop standards and guidelines on data 3 sharing
• Establish national data exchange 4 clearinghouse

Illinois•and•CompTIA• pilot
Roadmap•Step•2:• Conducting•additional• state•pilot•projects•and• developing•use•cases
Technical•Assistance• grants•to•participating•
states
Demonstration•at•US• Department•of•
Education
Roadmap•Step•1:• Raising•awareness•and•
gaining•consensus
Expansion•to•other• states•and••new•
industry•certifiers
Development•of••••••••••• 4 step•roadmap Involvement•of•ACTE
Roadmap•Step•3:• Developing•common•
data sharing••protocols

Expanding to New States
• More states interested in • Of these, 6 states signed CompTIA data sharing – California – Kansas – Maryland – North Carolina – Ohio – Oklahoma – DC – Iowa – Kentucky – Washington – Florida
data-sharing agreementswith CompTIA – California – Florida – Iowa – Oklahoma – North Carolina – Kentucky
• Illinois also signed a new agreement with CompTIA
• Most states are matching postsecondary student data

Expansion Challenges
• Legal issues – Many states could not sign an indemnification
agreement • SOLUTION: Simpler data-sharing agreement with no
indemnification, based on a better understanding of FERPA
• Match issues – CompTIA had few variables: first name, last name,
geo code • SOLUTION: CompTIA is adding DOB (month/yr) going
forward – Records with same names – Zip code discrepancies (home or testing location)

Recent Findings & Types of Data Available

CompTIA Records Shared and Matched Across States
• 19,552 unduplicated records provided byCompTIA across CA, IL, IA
• 17,148 students matched • Certifications by exam:
– A+: 6,013 – Cloud+: 25 – Network+: 2,954 – Project+: 1,287 – Security+: 2,970

Gender & Age
Iowa: More test takers in the younger age ranges
Illinois: More male test takers than female test-takers

Race/Ethnicity: Illinois

160
140
120
100
80
60
40
20
0 1
Special Populations: California
Certified
Not Certified
Legend 1 Acquired Brain Injury 2 Developmentally Delayed Learner 3 Hearing Impaired 4 Learning Disabled 5 Mobility Impaired 6 Other Disability 2 3 4 5 6 7 8 9 7 Psychological Disability 8 Speech/Language Impaired 9 Visually Impaired
18

8000
7000
6000
5000
4000
3000
2000
1000
0
Enrollment Status
Iowa: The majority of students became certified
while they were enrolled N
Y
Certified Not Certified
California: More test takers not enrolled
19 than enrolled

CIP Codes: Iowa
CIP Students CIP•Description
110103 3 Information Technology 110202 2 Computer Programming, Specific Applications 110801 3 Web Page, Digital/Multimedia and Information Resources Design 110901 90 Computer Systems Networking and Telecommunications 111001 12 Network and System Administration/Administrator 111099 10 Computer/Information Technology Services Administration & Management 150000 1 Engineering Technology, General 150303 22 Electrical, Electronic and Communications Engineering Technology/Technicians 240101 9 Liberal Arts 490205 1 Truck and Bus Driver/Commercial Vehicle Operator and Instructor 520201 2 Business Administration and Management, General 520301 1 Accounting 521001 1 Human Resources Management/Personnel Administration, General Total 157
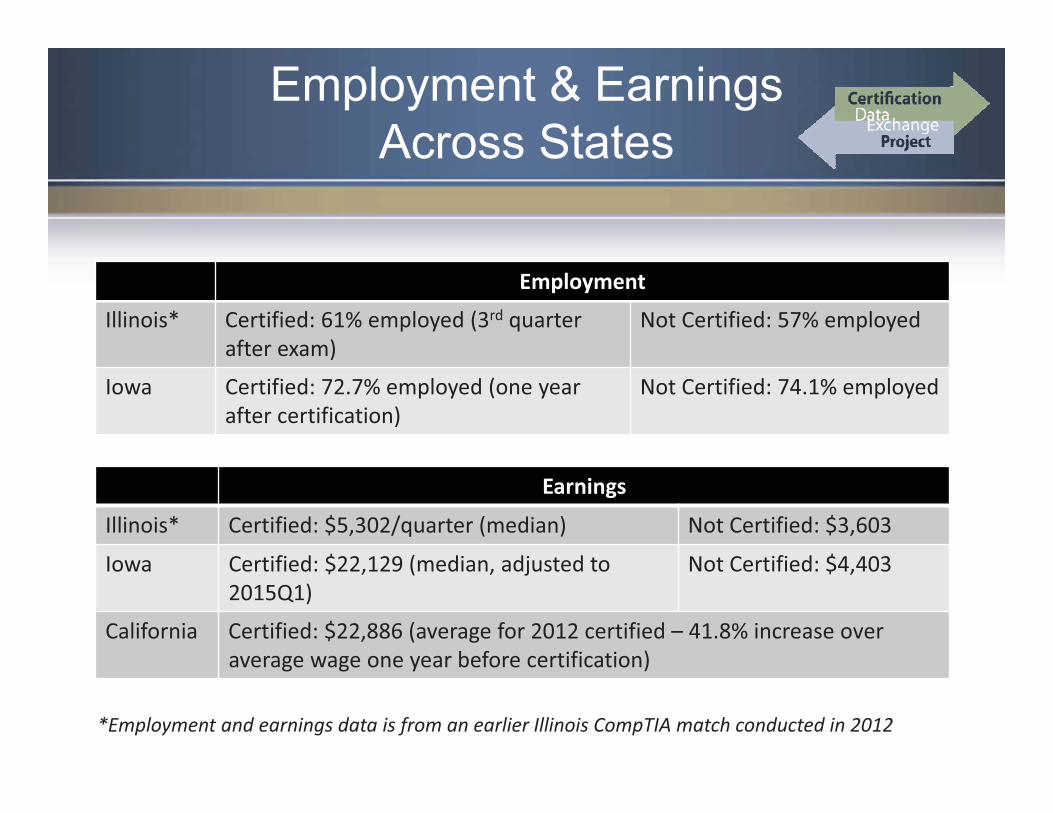
Employment & Earnings Across States
Employment
Illinois* Certified: 61% employed (3rd quarter Not Certified: 57% employed after exam)
Iowa Certified: 72.7% employed (one year Not Certified: 74.1% employed after certification)
Earnings
Illinois* Certified: $5,302/quarter (median) Not Certified: $3,603
Iowa Certified: $22,129 (median, adjusted to Not Certified: $4,403 2015Q1)
California Certified: $22,886 (average for 2012 certified – 41.8% increase over average wage one year before certification)
*Employment and earnings data is from an earlier Illinois CompTIA match conducted in 2012

Employment & Earnings by Industry: Iowa
Comp TIA | Certified Pre- and Post-Certification Employment by Industry Sector
Year Before Cert Year After Cert Most notableIndustry Sector Adj. Median Adj. Median employment # Matched Emp. Wage # Matched Emp. Wage
(to 2015Q1) (to 2015Q1) increases: Educational Services 11 $38,757 20 $30,064
Retail Trade 15 $11,962 12 $13,587 • Educational Professional, Scientific & Technical Services 3 $9,312 8 $33,866 Services Health Care & Social Assistance 7 $10,526 7 $44,712
• Professional, Manufacturing 9 $33,726 7 $38,843
Accommodation & Food Services 15 $6,767 5 $4,344 Scientific & Administrative & Support Services ***** ***** 5 $18,864 Technical Construction ***** ***** 4 $5,845
Services Public Administration 7 $5,012 4 $30,419
Wholesale Trade 0 - 4 $1,403 Most notable Arts, Entertainment & Recreation ***** ***** 3 $37,024
decrease: Finance & Insurance ***** ***** 3 $33,679
Information 4 $6,809 3 $10,957 • Accommodation Other Services 6 $12,919 3 $16,141 & Food Service Utilities 0 - 3 $13,892
Unknown ***** ***** 0 -
Management of Companies & Enterprises ***** ***** ***** *****
Transportation & Warehousing 3 $7,670 ***** *****
***** Insufficient data (less than 3)
22

Earnings By Industry: California
23

College & Geographic Location: Iowa
Matched Percent of Community College
Names Total Hawkeye (HCC) 63 36.8% Iowa Central (ICCC) 33 19.3% Kirkwood (KCC) 33 19.3% Des Moines Area (DMACC) 10 5.8%
Eastern Iowa (EICC) 7 4.1% Southwestern (SWCC) 6 3.5%
Western Iowa Tech (WITCC) 5 2.9% Iowa Western (IWCC) 4 2.3%
Northeast Iowa (NICC) 3 1.8% Southeastern (SCC) 3 1.8%
North Iowa Area (NIACC) 2 1.2% Iowa Valley (IVCC) 1 0.6%
Indian Hills (IHCC) 1 0.6% Northwest Iowa (NCC) 0 0.0%
Iowa Lakes (ILCC) 0 0.0% Total 171 100.0%
24

Not• Degree•Codes Certified Totals
Certified• Associate in Arts (AA) 7 25 32
Associate in Science (AS) 6 36 42 Associate in Applied Science (AAS) 58 254 312
General Associate Degree (AGS, ALS, AGE) 4 5 9 Associate in Arts and Science (A&S) 2 2 Basic Skills 3 7 10
Occupational Certificate of 30 Semester 1 41 42
(or 45 Quarter) Hours or More Occupational Certificate of Less Than 30
152 438 590 Semester (or 45 Quarter) Hours
Associate in Engineering Science (AES) 2 2 Totals 233 808 1041
Credentials: Illinois
25

Credit Hours: Illinois
26

Illinois•and•CompTIA• pilot
Roadmap•Step•2:• Conducting•additional• state•pilot•projects•and• developing•use•cases
Technical•Assistance• grants•to•participating•
states
Demonstration•at•US• Department•of•
Education
Roadmap•Step•1:• Raising•awareness•and•
gaining•consensus
Expansion•to•other• states•and••new•
industry•certifiers
Development•of••••••••••• 4 step•roadmap Involvement•of•ACTE
Roadmap•Step•3:• Developing•common•
data sharing••protocols

Technical Assistance
• From the Office of Career, Technical, and Adult Education
• Two years (Fall 2014 to Summer 2016) • Awarded to a consortium of states for the first
year: – Iowa – Illinois – Oklahoma – Florida – California – North Carolina
• New states and certifiers joining

Illinois•and•CompTIA• pilot
Roadmap•Step•2:• Conducting•additional• state•pilot•projects•and• developing•use•cases
Technical•Assistance• grants•to•participating•
states
Demonstration•at•US• Department•of•
Education
Roadmap•Step•1:• Raising•awareness•and•
gaining•consensus
Expansion•to•other• states•and••new•
industry•certifiers
Development•of••••••••••• 4 step•roadmap Involvement•of•ACTE
Roadmap•Step•3:• Developing•common•
data sharing••protocols

Expanding to New Certifiers and States
• New certifiers that joined this year – Automotive Service Excellence/National Automotive Technicians
Education Foundation – Manufacturing Skill Standards Council – ACT (National Career Readiness Certificate)
• Additional states and certifiers to join in second year • Moving toward a common process
– Standard data-sharing agreement (CompTIA template) – Minimum match criteria (first name, last name, birth month/yr,
geo code) – Secure data transfer (FTP) – Ensuring state has the analytical bandwidth – Uniform reporting template (Excel spreadsheets)

Questions to Explore
• What are the outcomes over the long term for certified v. non-certified students?
• How do certifications impact outcomes forstudents who complete a postsecondaryprogram of study v. those who do not complete?
• How does the impact of certifications vary bysub-populations?
• What is the marketplace value of specific certifications?

Questions?
• Web site https://www.acteonline.org/certification_data
• Gretchen Koch, [email protected]
• Pradeep Kotamraju, Iowa Department of Education [email protected]
• Scott Parke, Florida College [email protected]
• Catherine Imperatore, ACTE [email protected]