Certain Factors of Mortality From College as Determined by ...
98
Utah State University Utah State University DigitalCommons@USU DigitalCommons@USU All Graduate Theses and Dissertations Graduate Studies 5-1933 Certain Factors of Mortality From College as Determined by a Certain Factors of Mortality From College as Determined by a Study of the 1925 Freshmen Class at the Utah State Agricultural Study of the 1925 Freshmen Class at the Utah State Agricultural College and Replacements as Determined by an Analysis of the College and Replacements as Determined by an Analysis of the 1929 Graduating Class 1929 Graduating Class Dean F. Peterson Utah State University Follow this and additional works at: https://digitalcommons.usu.edu/etd Part of the Education Commons Recommended Citation Recommended Citation Peterson, Dean F., "Certain Factors of Mortality From College as Determined by a Study of the 1925 Freshmen Class at the Utah State Agricultural College and Replacements as Determined by an Analysis of the 1929 Graduating Class" (1933). All Graduate Theses and Dissertations. 1605. https://digitalcommons.usu.edu/etd/1605 This Thesis is brought to you for free and open access by the Graduate Studies at DigitalCommons@USU. It has been accepted for inclusion in All Graduate Theses and Dissertations by an authorized administrator of DigitalCommons@USU. For more information, please contact [email protected].
Transcript of Certain Factors of Mortality From College as Determined by ...

Utah State University Utah State University
DigitalCommons@USU DigitalCommons@USU
All Graduate Theses and Dissertations Graduate Studies
5-1933
Certain Factors of Mortality From College as Determined by a Certain Factors of Mortality From College as Determined by a
Study of the 1925 Freshmen Class at the Utah State Agricultural Study of the 1925 Freshmen Class at the Utah State Agricultural
College and Replacements as Determined by an Analysis of the College and Replacements as Determined by an Analysis of the
1929 Graduating Class 1929 Graduating Class
Dean F. Peterson Utah State University
Follow this and additional works at: https://digitalcommons.usu.edu/etd
Part of the Education Commons
Recommended Citation Recommended Citation Peterson, Dean F., "Certain Factors of Mortality From College as Determined by a Study of the 1925 Freshmen Class at the Utah State Agricultural College and Replacements as Determined by an Analysis of the 1929 Graduating Class" (1933). All Graduate Theses and Dissertations. 1605. https://digitalcommons.usu.edu/etd/1605
This Thesis is brought to you for free and open access by the Graduate Studies at DigitalCommons@USU. It has been accepted for inclusion in All Graduate Theses and Dissertations by an authorized administrator of DigitalCommons@USU. For more information, please contact [email protected].

CERTAIN }1'li.C:TORS Ot' hlOm'ALITY FROM COUJWE
:.8 DETlmMINED BY
A STUDY OJ!' THE 1925 YRESH!.lE.N CLASS AT THE
UTAH STAT}: AGHICULTUHAL COU •. F.GE
Jum
RE.pL,l,CEMENTs AS DtTERMlNED BY AN ANALYSIS OF
'l'Hl!: 1929 GRADUN;'IUG CLASS.
A THESIS
'::i'UBMITTh1> IN PA :1TIAt SATISFACTION O~~ Tim HE-
Q.tTI REi;llm~ }'OR THE DEGmm OF i.~STEH OF SCIENCE
IN EDUCATIONAL ADMINISTHATION.
by
DEAN 11'. PYTE!{SON
Logan, Utah May 1933

111.
Aclou)1fledge!l1e n t 11
List or Tabl.es IV
List of Figu1"es Vlll
Part 1.
Mortality ot 1925 Freshmen
Chapters
1. Introducti()n 1
11. fP.:-.e Data 4
111. Time of Di scont1nus.noe~
.Di.sta:lCC ~.e fJ. It(i:.ctor of :Mt>rtalt't'.I. 13
v. College fl:r~Hles 8.!S a lI"1artor of MortF:li ty. 20
VI. 50
Replnc8ments
58
61
tx. 12
81
1'..l. • .;.iumt"l.fl.ry of Conclusions. 85
Appendix
1. Mathematical Formulae. 89
11. Bibliography gO
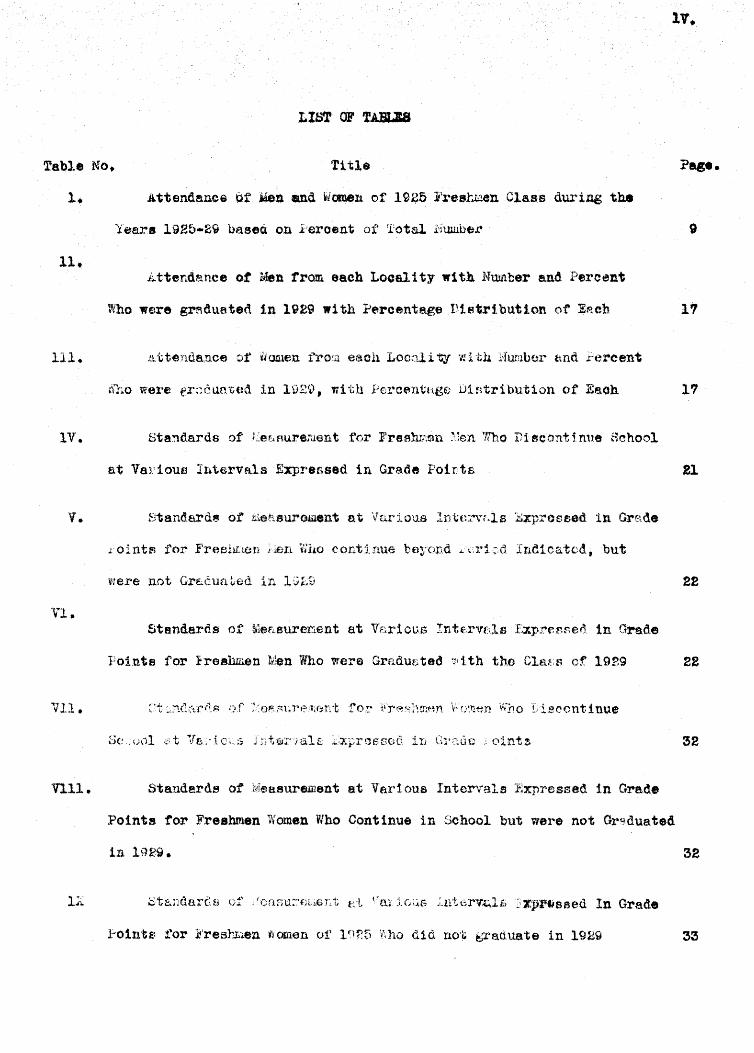
lV.
LIST OF 'rABLIS
Table No. Title Page.
Attendance tit ~ll end ~iomel1 of 1925 }'res.r..L1en Class duri.o.g the
9
11. .Attendance of Men from each Locality with Number and Percent
~Vho were gr~dl.lated in 1929 wi th Percentage Distribution of ERCh 17
111. lL-ctendance of tJomen fro:.il eacll Loc:11i"t;J' '11:1 tb Humbor ttnd .z.:':ereent
17
IV. stsTI(lards of' r~er:.Hur.eJ;lent for Frearu;'.en :\'[en 'lrho Di. eeont j nlle School
at VS1'ioUB Irltcrvals Expressed in Grade Poirts 21
l"oints for Freshrten ~~e:n Vnl0 conttnue berond .dri::d Ind1ca'tod,but
were not GrE;.cunLed in. 101,0 22
'1:"'1 v ....
Standards of MeF.dsurement at Veri OtiS Intf,rVf;ls :Lxp:rer.r,eo in Grade
Foi.nts for l+reehUien lilen Who were Graduated 7·1.th the CleEs cf 1929 22
VII.
32
Vlll. Standards of Measurement at Various Intervals E:xpressed in Grade
Points tor Freshmen Women Wbo Continue in School but were not Gr~duated
in 1929. 32
11:
Pointe: tor l!'resrLen Women of 1(}25 V~ho did no'~ t;l'a.duate in 1~J2~ 33

v.
x. Ccmparisonof Grad. Pointe ot rr •• hmea Mea Who CoJlt1nue11l School
But are act Graduated with thoae Who Dt.oontinue at Suo •• sa1Te Period.. 4S
n. OO'Mp~r1"on of Fr.~hmen Women Who Continue in School but Who are not
G1"~.dunted in 1929 with Those Who Di(4C0trttnu~ et S1.lecflsf'ive Periods. 44
Xll. Conmar.ieon of Grftae POints ot 1925 ]'reshmen Men Who were Graduated ... "
in 19!9 .,,1'th Those Who Disoontinued fit SuecestdYe Periods. 45
Ull.
XlV. Comrari son of Grade .Fo:1.nts 01' 1925it'realunen Men Who were Graduated
in ).929 with lrhoaE) tlno Continue but were not GraduAted in 1;29 8.t
Sucoessive Periods. 47
T'i!. CornJ)~ri~~oTI cl~ Cra.de Pointr: of 1925 Freshrrcn. V:om.en Who ',':ere
Grat1uated in 1929 with Those Who Cont1Ill).8 but 'liiGJ'"e not Grpo'nateC! in
51
XY'1.1.
53
XVlll.
54
A-l.X.
55

xx. Comparison ot Agee ot Mell altd WamtD. in Difterent Group. ot the
U"ah State Agr10ul turalCollege Fre.hmen Class. Age in Yeare
September, 1925
XXl. Replecemente to the 1925 J.t'reslunen Class, considering only 1920
XXll.
XX111.
XXlV.
Graduates.
Replacements to the 1925 }'l"eshn!en Class on the Basis of Home
Residence for Men.
1eplac6men.ts to the 1925 }i'r·esp.men Class, on Basis of" Home
3tSJ,ldsl'tda ot MeSaUJ'elitEHlt tor' 1 929 ?~:.an Graduates nt Compara.ble
Periods.
x:rI. ~3tandards of:,~e8aurement tor 1929 'riom-an Graduates at Comparable
Per·lods.
XXVl. COrrJpArison ot "rndes of Different Groupe of 1929 tIen Graduates.
XXVll. Comparison of Grades of Different Gr()lxps of In!'9 ~liomen ~rAduates
wi th Those ~no Entered HS Freshmen 1925.
XXV111. St.findarda 01" Measurement of Age, for 1920 GraduateD as Determined
'Yl.
57
59
62
86
74
76
77
79
for September, 1925~ 81
XXlX. Comparj_son of Heplacement Groupe wi th 1925 Freshmen. Men Vina
Graduated in 1929, Basis of' Age September, 1925 82
xxx. Standards of ~easurement of 1929 Women Graduates, Age as Determin-
ed, September 1925. 83

111. '
XXXl. Co.m.pa.rleoa ot Replacetflentswlth the 1925 Freahmen W<D.en Who
Graduated in 1989, Basis of Age S.ptember 1925.
XXXll. Comper1 ~on of tami18r Groups or 1~n and '\Homen of 1929 Graduating
Clase, Beais of A€18 September 1925. 84

LIST 01 lIGURES
Fisure No. TItle
1.
2.
3.
4.
IS.
7.
8.
Enrollmeni . by Q.uarters of Freshmen Men. entering the taah Stat.
Agr1ou1tur~1 College in 1~25 for the Teare 1925-29.
Enrollment by quarters of' Fresh1:en Eomen 'Ent~ring the TJt~h Stete
Ag.ri cul t.uPfI.l College in 10.25 ft)r the Yec.I's 1925-29.
Atton,dftnea by ~u~ters of 1925 Freshmen Men from Different
Local it 1es.
Attendance by ' .. ~uarters of 1925 Freshmen Wom~n from \)1tferent
Localities.
Percent of 1925 Freshmen Who were Graduated in 1920 b8$ed up
on Res:ldence.
Graphical Bepresentat10n of the Grade .Foints of lS25 !i'reslur...en
Men, Utah Stato 1:..gr1culturel College nt End of }l"1rfJt ~,luFrte:r.
(h~apb.ical .\()PJ:'€!f.ont~'ttion of Crude :Coints of 19B5 FroshIlJ811 i,/IAn,
Utah State Agr'icul tllral Coller.,e !itE~1d of ,seoond (iun.!"tcr.
Graphical Representation ot Grade Points of 1925 Freshmen men.
Utah State Agrioul tural College at End of Third (~ua't'ter.
10. GraI'h1cal Hoprescntat:lon !)f Grode Points of 1925 Frol!hruen lClen,
Utah State J.gl'1cul tural i')ollege at end of ;3ixth !.~aJ."ter
Vlll.
Pap
7
8
14
15
16
26
27
28
29

lX
11. Graphical Repre.entatioll ot Grfta,Poln'. of lISts Fre"baen Me., Utah State Agrloultural 0011ege at .a. or Nlath Quarter. 80
12. GraphIcal Hepr •• enta:tlon \It Grade Pointe ot192! l'resbnluu Uen,
Utu State Agrioul tur6l, College 8t end of Tweltth . Quarter. 31
13. AT.~. Ouawl.ai1ve Orade Points of 1925 Freshmen Women by '-c.uartere. 35
14._ Graph1c81 Hopresentf.1tion ot the Ormo.e :-'oints 01' 1925 Freshmen Women
37
16. Graphical Htypreaentat10n of the Gre.de Pointe ot 1925 Freshmen Women
Utah state -Agrioultural College at end of Thirt'. l-~.uH!"ter. 38
39
18. Grsphtoalqeprosentation of the ')rade Polnt~ ot 1925 ,l-;'reshmen War-nan
40
41

CBAP'l'iR 1
INTHODUCTION.
-MaiDie'rotors aDd UnlT$ralt,. profe.nora who hay ... T1ta1 lntereB' in
10W18 pe01)le f!~nd who belie". tbat 8 four 7ear'. oollege OOUN8 f. good prep-
aration tor 1It. t • &ct1T1t1.8 today are wonderina why 80 many etudeni. leay.
college.
The •• teachers and adm1n1etra'tors. be"oil the amo.ll ·~!ereen'a!.". ot uTiper
clasemen on the e~unpu. and the superfluity or tirst and second year men. The1
want to know wby 1 t 18 that 80 £i18ny atud(llntB leave and what oan be done nbou'
1t." (1)
Ceorge R. Moon of the University ot Chicago ill "Students Who Drop Out of
College," concludes:
"!*"acts ahow that students lenT. tor chief re880ns nslde fronl scholarshlp,
theae being 1'lnanoe, heAlth, Lome conditions, and some from dissatisfaction."
(2)
!J. It!. Jordan, 1n the article referred to eb<Yf'., "Student MortalIty", (1)
shows that students leaving oollege are inr.riol'" in 8ohol!u"shl, to those who
rer,18in. This 1s true 01: bo1;h previous Uleb. t~chool 1llnrk8 and those obtAined
ot the University.
He 8180 conclu,des that they ure inferior in oertaln types of aCftduu1c
tntel11ft onoe A8 ;;8tHlJured by the Otis Intelltpenoe 'reste. In "Problems ot
ElImination from Colleee" it 18 shown that a olose 1"elatlon.blp exists be-
tween elimination from collu~7G and low intelligence and erf!~.e8 recelved. (3)
Notes: (1) tfStudent I40rtn11ty"' by A. ).:. Jordnn. ~3chool and boclety, Vol.2~. n. 8rl-~4. i)ec. ~?6tht 19r5.
(2) "Stooents tiho Vrop out of Gallego" by Geo. n. l'·(oon, University ot Chi.ca;'o, School end Dociety, Vol. 27 t P. 5'16-?B1, May 1?. 1~J28.

a.
A.Social and Economic faotors that oause .l~netlon thla ssm. author
11at. the tollowin@: a1Z8 ot tamily. rural or city ori~ln. with aortall', ot
rural student. le8A ~h~ln that ot the city atudent .. ; t1me .pent in school;"
intent to remain In 8cho' 11; and certIficate or degre~ 8ought.
E. r. roolhotr shows that ultimate tallure ot colleee 8tude~t8 may b.
predloated on thair first quarter recorda. Fftl1ure ultimately leads ot mor-
tality. (4)
There are many tactors influencing mortality trom college. 88 In~loBted
by the few studies available on this question, and 88 referred to above. It
would be impossible to live consideration to all or them in thie study, which
is Ilm1ted by aYal1able reoords and limited resources.
This study 1f111,ther"efore, be confined to the study of the taetora or:
time or mortality from Qolleee, sex, age, dietance from 8chool, and schol:rshlp.
It also proposes to go furthe1' th1'Jn other studies of these questions by taking
into conaiderntlon the 1~eI)lacemonts that occur to the natural losses of the
given C1U88 and the statistioal signIficance of the factors or mortality and
replacement.
This study, as indicated by the tItle, 18 divided into two rather die-
tinct parts!
fl.'irat: A study ot tbe mortality of the 1925 };4"reshmen Class of the Utah
state Africultural College wIth rSBpect to the relatIon of mortality from .
school to home resIdence, collefe i~r8deA. B.t:o. and sex.
~)econd: it study of rep18cement~ 8.8 determIned by en analysis of the
l0?9 graduatinr class.
Notes: (3) "Problems of }211nllnatlon from Collage tt SChool and SocIety. p. 550-52. Oct. l~~t 19?9.
(4) ":Predicting ul tlDlate failure of collage ~::tudentson their first :4ilnrter reoords" by E. F. toolhoff, School and ~;oclety, P. P.?3-4. Februory 7, 1931.
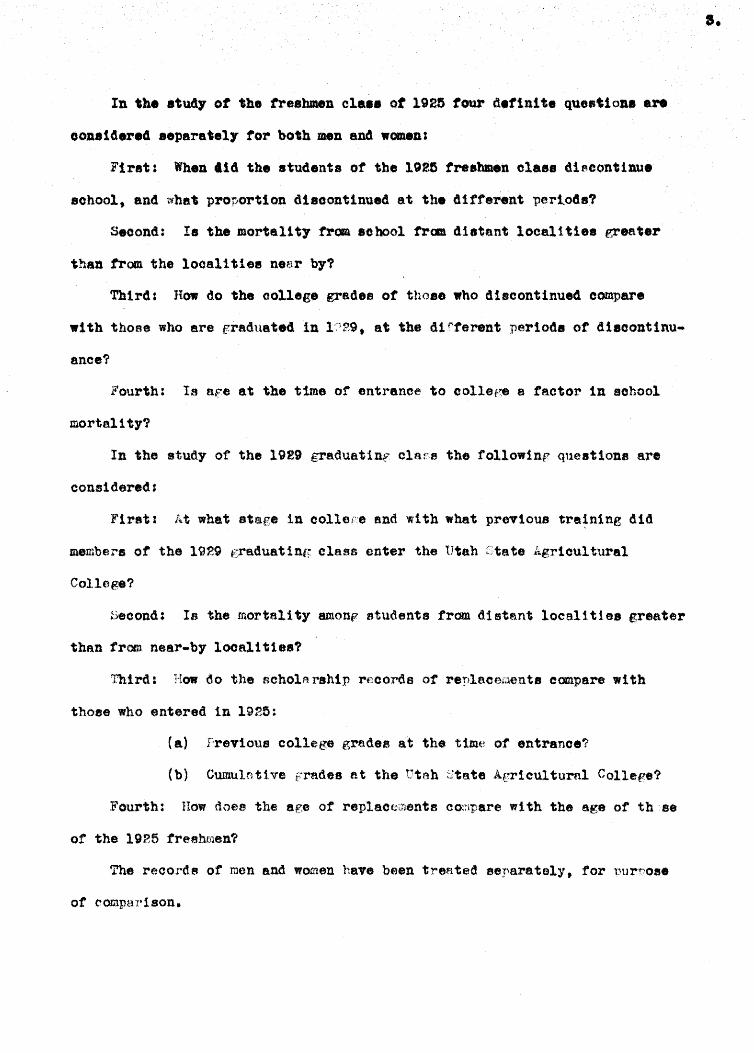
In the study ot the treshmen cl ••• ot 1925 tour definit. questioaa are
oona14erea •• para'ely tor both men and wamenl
Firat: When '14 the students of the 1026 freshmen cla.8 dl~contlnu.
school. and ~hat proportion di800ntinued at the d1fferent perioaa'
Second: Is the mortall ty trom. ,ohaol fran dleto.nt local! t1ea greater
than from the localities near by?
Third: How do 'the college grades ot tIloae who discontinued oompare
wi th those who are graduated in 1')29 t at the different periods of disoontinu
ance?
F'ourth: Is afe at the time of entranoe to college 8 factor 1n school
mortalIty?
In the study of the 1929 graduatlne olafe the :followinr questions are
considered:
Firat: At what stage in coller-e end with what previous tra~n1ng did
members ot the 1929 graduatIng class enter the Utah Ctate .Agrioultural
College?
!3econd: Is the mortality amonp students from distant localities greater
than trom near-by 100alit1es?
Third: How do the echolA rahlp recorda ot reYllaceiaents compare with
those who entered in 1925:
(a) Previous college gredee at the t1uw ot entrance?
(b) Cumulnttve frades at the t1teh ~.:t8.teA.rr1culturnl College?
Fourth: How does the age at replacc;:T~ent8 eO::lpare wl th the age of th'se
ot the 1925 treehmen?
The recor.d.s of men and women have been treF.ited ee!'arately, rornur1",~ose
ot comparison.
a.

CHAPTIfll 11
THE DATA
TIro 11 .. ,\. ot name" were ob"ained. The first include all tho •• 118ted aa
treshmen in the Utah State Agrlcul turnl College Catalogue ot 1028 tor the
.ohool year 1925-26. It was tound, lateX', that a t .. ot these students had
entered -previously but were only granted freahmen standing. 80 theee 'fJere re-
mOTed tram the l1at. The name. of 207 men 8l1d 115 women were retained ut'on the
l1st.
The second list tncluded the tle:ne8 of the 1~~29 gre.duatc8 as reported in
the collere oatp.;lo~e published in 1929. lOP men and 72 women were included.
Tbe followinr: date, concerning each student, were obtained from the reoot"de
of the 8egietrnr t s offioe and tabulated. Not all of the data, however, have
boen used 1n this study.
Nrune of student.
Date of birth.
Eane :rae i. dence.
~;chool or departruent registered In.
Deficiencies of col1f'ge ent'r'8Dce requi.remente.
number of uni ts of hi p,h school (~redi t •
• ;:,uarter by quarter cumullltive record ot quarter hours nredit at the Utah
ftate Ae;ricul tural Colleve wIth p!1"ades. The latter> were tabulated in terms of
totel oumulative f:rede pointe. 1
Note 1. Grade points were oalculated u;:on the rollowlnf! baeis: One quarter hour with A grede 3 points: with B grade 2 points; with ('; grade 1 point; D prade none: F' f.rade (- ) 1 poi nt •

&.
A,.an .. &r.4e points .... caleui.atea at the .114 ot each Interftl •• lec"'et
tor compartson. b,. dlyldlag the total grade points by the total number ot
quarter-hours recorded.
A Bu"~"rough. Rapid Calculating Adding maohi ne was us.d la cOIBlputlng the
cuml1atlve record from the date obtained 1n the Registrar'. ottlce.
It 18 pos.ible that a tew minor errore tr.l.8y hay. orert into the record.
of the 1925 freshmen group, as no complete re-check "'as Ma.4e. A number ot
ca •• s, however, weo. selected at random and re-checked without fIndIng error.
In the CAse of those who were graduated, 1t was possible to oheck s€1'linat
computations and records on ftle in the Hepietrarts ot.flce.
The silde-rule has been used In :'ractical1y all cooputatlons of mul t1-
pltcation, division, aquRres, and squnreroot nec6ssary in this atudy.

P.i.RT 1
MORTALITY OF 1925 FrfEaHMEN CL/~
~lll
(TlUE OF DISCONTIllUAliCE)
When did students of the 1025 freahoen cls88 discontinue school?
This question oan. best be anne:red by e. graph ot aetua! attendance
during the yeare 1925-20 as found on the following pages. (Figures 1 and
II.)
In order to made El better eom!I;;>;rlson the rrttendf\DCe has been l'e~uced to
a pe:roente~ b~s1a and so tabul~ted in T~b16 No. 1 an y8p;e 10. The total
nUlilber ot t'resh&nen llsted representfnrf 10~ equals 20'1 !!len and 115 women.
l;"r'om Tnble No. 1 1 t will be seen that the Attendanoe or men 18 m.ore
erratic tllnn that of women during any single yerlr. They ftn~er more otten
with the winter quarter and disoontinue betore the erring qU8rter. This 18
not to be unexpeoted. 8S men. especially farm. men, mny ~,e needed at home
during the tall nnd s11ring months more than the women.
In totallnp. the qUfirters attended it 18 fOUl .. C· oounting summer school
attendance 8S one qUf.irter, that the 20? lIit~n attended 1193 quarters durIng
the four ye~ra, mnkinf' the nVel"l\l~e attenda.nce of the 207 men during the four
yeers 5.76 quarters.
The women attended a total of 820 qua.rters durln{~ the same perIod znakI.ng
their average total attendanoe 7.13 qUft,rters, or 1.37 quarters more than the
men.
6.

11 eure No. 1 Baroilmen" bJ q,u8Mera ot· Freshmen It1e1l en ".rl III the Utah Stete Apioultural College in 1925 tor the Yeare 1925 8114 1920.
No.'
190
100
170
-
160 I \"-':i
150 ·
140
130
120
110
100
90 ·
80 -'0 · 60
·
·
·
· 10
· o
...l 1 Year.
, t ,
-\ C\\
-\'-''")
-\ \<."
~
\o\..
r--i
2 3 88 .L 8t
P5-26
t , t , t
--<is,
~
~'\ r-- -~
Iw"l. l..~ ~
r--- '5'-\ '6~
-~
'\
;,:) 8S ~ E .., 88 J.. ,~
" e.
1:

No.
110
100
90
eo
70
60
1igure Mo. U Ial'ollment b7 Q.uarter. of lNahmen w~ Baterlns (h.U~ State Agrioultural Coll ... 1_ 1915 tor the year. 1915-29.
. . ... t t t , t , , t t , , t t
... ----- \0,\ .---\01 \O~ ·
· .~
....---r--- '7 r--1'$ ,~
· · r----
'S't> -\\"7 --I> ~~
• , ,
- '1."" ~~ ~, 40
· 30
.. 20
· 10
t o 1 Years
•
~
\~
t • • 2 3 8. 1 25-26
t
r---\1 -\\
, • t , t t • 2 3 88 1 2 3 .8 1 t t , 2 3 88
26-27 a7-p~ 28-29
,
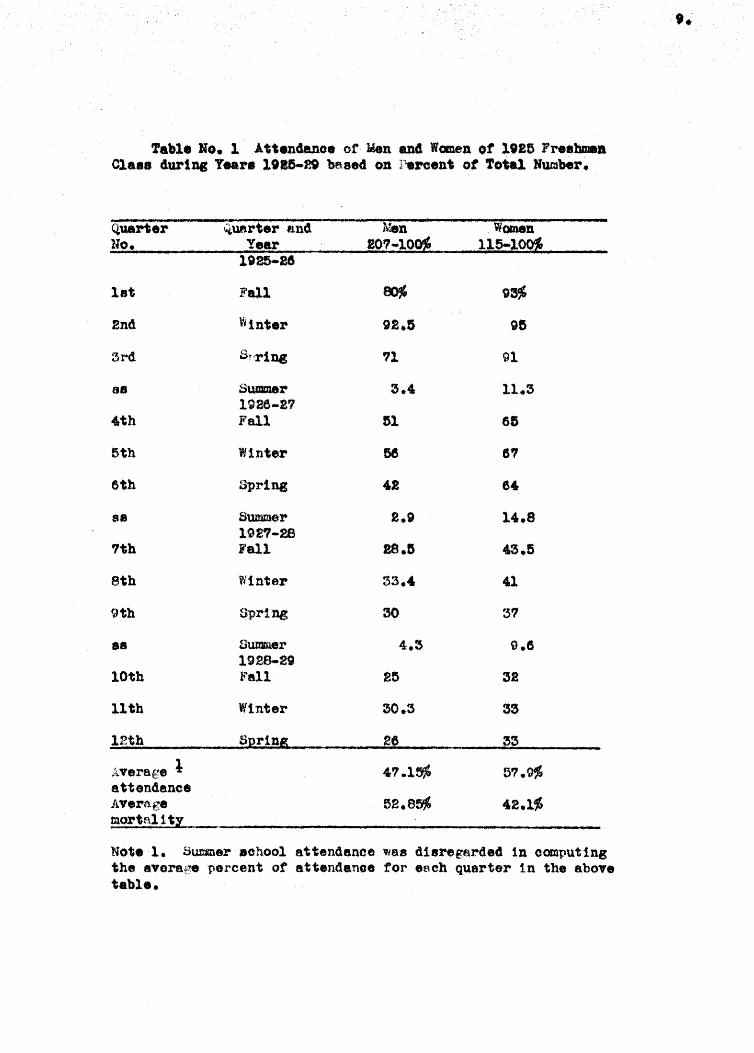
Table No. 1A "tendenoe or Wen 04 Wcmen of le25 lr •• bmea 01.8. clurlDi Yeare 1188-20 baaed on Percent ot Total Number.
Q,uarter "uert.r and )Io8n Women 110. Year 207-10~ 115-1Q9j
1925-8&
lat Fall ~ g~
2nd YJln"er 92.5 9&
3rd or':rlns "11 91
8a Summer 5.4 11.3 lQSe-27
4tth Fall 1\1 6&
5th Winter 5e 67
6th Sprl118 42 64
se Suwnel' 2.9 14.8 102'1-28
7th Fall lS.rs 4.3.5
8th Winter 33.' 41
9th SprIng 30 37
8a Sumn4er 4.5 0.6 19aa..29
10th Fall 25 32
11th Winter 30.3 33
12th S~rlns 26 33
Average 1 47.1~ 5..,.9" attendance Average 52.a~ 42.1~ martali'til _
Note 1. SUIW18r .ohool attendanoe 'Was disregarded In oomputing the 8VOr8~!e percent of at"endanoe tor each quarter 1n the abo". table.
9.

The fir_" two :rears 1. both group. ahow relat1".lJ hip mortal 1 t,-. f1tt, percat of the men all4th1MJ-t1 ft 'Percellt ot the women ha.,.
elIminated th818elT •• by tbe • ., or the tire" rear. (Did Dot enter -second
,.enr~ By the end. ot the •• cond "enr ..... nt1 percent or t11e men and 8Ixt,.
peroent ot the women firO lODe. The •• may heTe entered other schools. By
the en4 of the third yen%" seventy-three peroent of the JnHJ1 and sin7-
seven percent ot the women haTe discontinued.
The mortality 01' Ulen 1. high at the end ot the 2nd, 3rd, 5th and 61;h
Q.uarters. That or women at the end or the 3rd and 6th quarters. Propor
tionately the luorta11 ty of .. omen 1s L1~her than men between the third and
fourth yeare.
The averege attendance of the women i8 higher than that of the men,
and the A,versge percent ot the total number registered as freshmen in 19215
durlnp<: the regular school yeera (excluding the summer school fJfuutlons) being
47.15% tor the t3en and 5'1.90;;·~ for the women.
Thus the avera{",e mortalIty tor the tour yeAr period is 52.85% for the
men, and 42.10% tor the women.
GEN1~RAL CONCI. USI ONS
';'tearly twioe 88 many men entered 1n 1025 a8 women, 207 men compared to
115 women.
The total mortAlity in percentage W8S higher amo~~ men than women, 83%
88 against 7~~t to the tinal quarter of' 1929. The Byerage mortAlity for the
tour year period betng 52.85f}; tor men ftl'l.d 27.1o--,1b tor the women.
iLortallty or both sexes 1s high during the first two yenre, '1()l1, tor
m.en and 60% tor womon tor the two y.~}r period; while in the first year 50j~
of the men and 35;0 of the women discontInued.
The high Illortallty Jlflrlods for ,men are the ends of the 2nd. :Srd, 5th
11.

and 6th quarter. belDS 11 •• , ~. l4~. aa4 13.~ reapeoti •• 17 w1'1I. • total
mortality of "~ tor the wllole per-loci and an aftrage of 52 •• tor 'the
whole perlod, while the percentagee to!" _.en at the ends of the bd and
6th quarter. are 28~ and 23%, reapect1"ly as compared to the total. mortel11 '1
ot e7')ttor the total period and average of 42.1~ tor the whole period.
The aTer&ge leng\h of collef!8 attendance for the men was 5.'6 quarter.
8.e compared 1f1 th 7.13 quarters tor the women. On this basia the attendanc.
o! the 1925 freshmen women h8 }~~.e% longer during the four yefir period than
that ot the 1925 freshmen men.
18.
~RIV
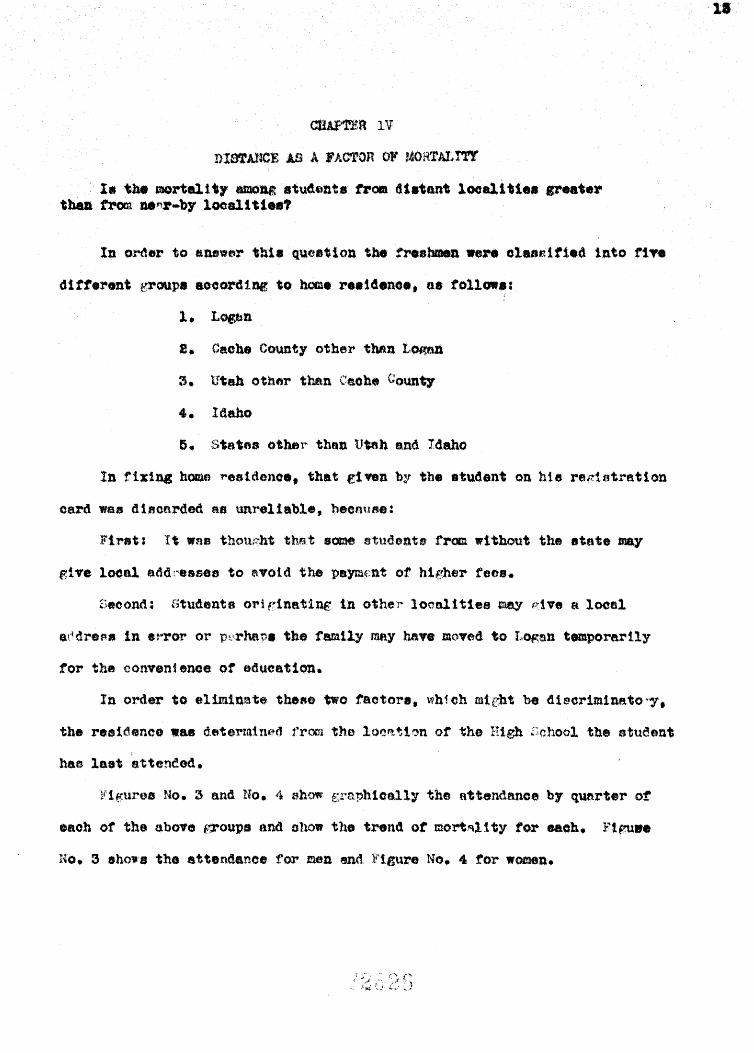
DISTAllCE AD A 'ACTon OF MORTAI~rrr
1. the mortal!.1 amoq 8tu4onts trOlltJ. 4'nant locall'l •• are.tar tbaa f'l'tora ufI'!r-br local! tl •• '
In ort\.r to till"Vler thl. qUfJ8tion the fr •• braen nreolunltied into tt..,.
d1fteront group. aocordlDg to home r •• 14eno •• 0.. tollow.:
2. Cache County other than L~
3. U'tah othfJr tk'..an Caohe County
4. Idaho
5. States other than U~h and Idaho
In fixing home ~e81deno •• that given by tbe atudant on his reriatr8tlon
card waa dlaca.rded fl8 unreliable. because:
First: It "as thou:mt th~.t aome stud,eats from 11'1 thout the at.ate may
gl'V'. l00nl e.dd:~.8se8 to avoid the p8ymE~nt of hie-her feee .•
Sttcond: Students orirlnat1ne in other locn11t1es may Edve 8. local
addretHIi in error or perMP8 the famlly mnYMve moved to L~an temporarIly
tor the convenienoe or education.
In order toel1mlnste these two faotor., whioh might be discrim1nato'.,..
has la.t attended •
• aoh of the nbo..,.., *,~()Up. n.nd allOW the trend otmortR11ty tor each. Yl~ ..
NO. 5 sho ... tho attendanoe for men end l"1gure No. " ror WOl!l8n.
11,

F1pre No.3. Attendance by 'C,uartera ot 1925 Freshmen Men frOB Different Looa11~1.8.
No.
100
90
80
70 ....
60
j 50
40 I
30
20
10
0
lciuarters 1 ' 2 ' 3 4 ' 5 t 6 ' 7 t 8 ' 9 '10 '11 2'
Year. 1925-26 1926-27 1927-28 1928-29

o.
0
40
30
I:
1
0
0
0
flaue Ho. ,. AtkDClallC. b7 Q.u.rter of 19. lnabMJa W--. troa 4itteren' 10hlltl •••
t 1 , •
----- --- '~Q\ ~'" ~"to "" 0 , ----'----' .....
I tl ........... "----~ r.. .....
~<!c --
"-"'-Q "-" <:0..<:,.\ C:O " ~ ~C! Co
~ ... --.....
~ . ~ut~ \.cl.e ~'"\..o --~ -\~-; ---- ---
,",0. ---- ------ --- - --e~'"' =3,0." - - - ----Q.\r-- e.,. ----- -- -- - ----' --- -------- ---- -- --- ---
~~uarter.. t 1 • 2 t :5. , " t 8 t 6 t , , 8 ' 9 t 10 t 11 tiE t
lOP.B-20 • F ••
FrOID tho aDalys1s or F'lBUre No.5 It wll1 be seen thet the total
m.ortal! ty amonf, the Idnbo students 1s rel1!!t1"ely hither than trom other
100811 ti$s.· Only 6<; or the 1025 Freehmen men Rnd 12'% of the women
+~raCiuo. tIns.
Ut~h reuu:8BBeond ln total uwrtallty. Only l~ or the FreSM18n men
and 11';~ of the women pradWltl~ in 1929.
Logan seer:l1'l to lUf9'. 6 deeided ad"anttige ewer otll$r loonl! tiee tor the
.ulan ,,1 th 26% f~·duntlng, while Caohe Countr does for thewOO1en ,,1 th 59%,
except from tho t'lore eli,tant stntes which 1s vary bigb. 55% tor !:len and 5~
for WOlXI('th '!'he number from other stntes 1s so amell; heweve'l", that the
results iM)' not be signifloant. Ferhape the oriteria tor detf'rm1nlng :r'e8-
ldenee 1s a150 at fa.ult tor this nroup. It 18 not difficult to believe
that 'thoso students who came from other atlltes !.~y ha.ve had ~ "lory deoided
reAson, in the first ple.ce. tor attenCi1ne this institution; and whatever

'that lI.Oi1.8 ..... it would tend to inf1uence the student to remain until
graduation.
Figure Ho. &. Percent ot 1925 Freahmen who were graduated in 1929 baaed upon residenoe. M.-Wetl and W.Women.
Percent It M • W ,
M t W t M • W t M t 'II t M , W
gO ..
80 ...
70 ~ ..
60
" 50 .. 'S"\ 0), SL:)q" ~
40 W N\ ""CJ~ ',~I • .
30
· ..---
'l.16\1) 2..,-"" .1> W
r--
"" ':l. ).1~ '48'1.1)
· M ~ \"l. d\~ ~
vJ ~ \N
10
o · fV\.
t ,
Logan Idaho Cache2 Other Co. st.
,
Note 1. Utah does not include students listed trom Cache Co. and Lognn. 2. Cache Co. does not include students listed from Logan.
16"

Table U. Attendance ot Me. troea ... eh Locality .1th Hwaber and Peroent tho waretTraduate4 111 19_. with Peroentage DSatrlbution or Eaoh.
Locality :No. of Pe:rcent ot No. ·'peroent Fercent ot d
1925 totsl graduat- ,"dua"- total padua'. Freshmen. ina- 1~ Ins-
U'ah( except 99 47.8 10 18 43.9 Cache Co.)
Logan .42 20.3 11 26 26.8
Idaho 34 14.4 a (\ 4.9
Cache Co. 23 11.1 5 22 12.2 (except I#ogttn)
Other St •. 9 4.4 {5 55 12.2
20'1 lOOJ; 41 100 " Total.
Table 111. Attendance of' Women from each Local 1 t1 with 'Number and Percent who •• re grft~u8ted in 1929 w1 th j)ereentage I)1atrlbut1oD of Each.
l~callty No. ot Percent No. Peroent Percent of 1925 ot graduet- graC!uet .. total
Freshmen Total lug. ing. erAduatlng.
Utah(except M 29.6 , 11 13.8 Cache Co.)
12 2' 41.4 Logan 44 38.3
Idaho 1'1 14.8 2 12 6.9
Cache Co. 18 15.6 10 54 34a5 (except Log8n)
Other St. I 1'1 1 3.4
115 10b% r:g 100% Totals
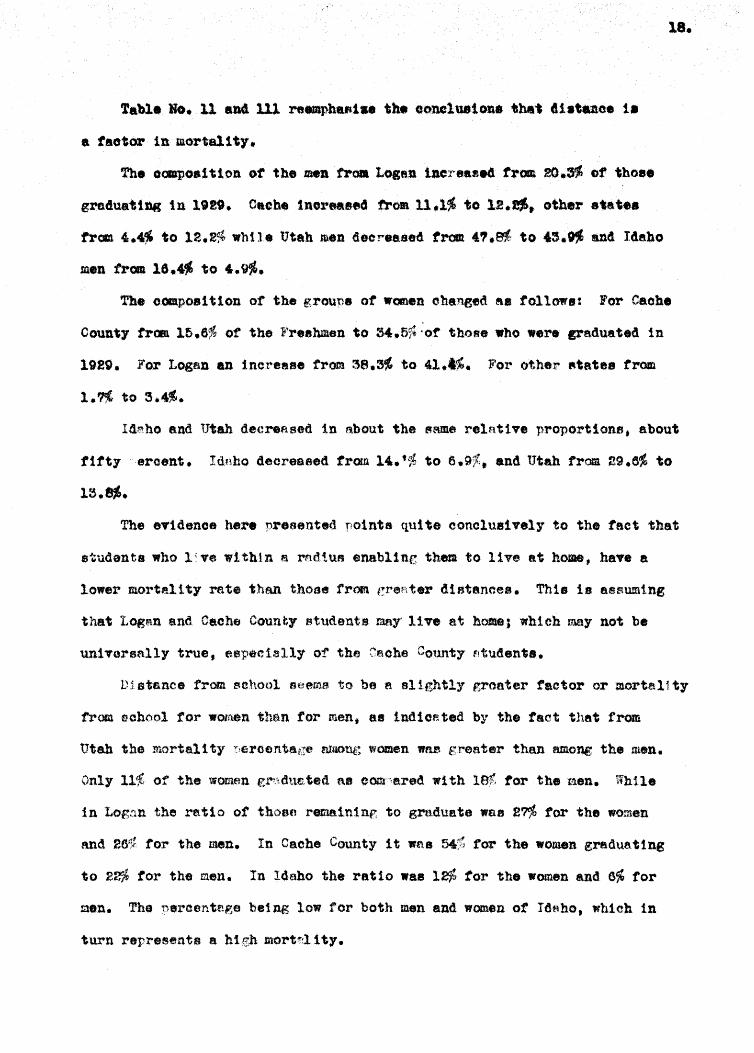
Table No. 11 04 Ul re_phalll •• th. ooncluaione the" 41atuoe 1 •
• tactor iDmor~al1t1.
The oOllpo811tlon of the mentl"'oa Logan increased trca 20.9 of thoe.
graduating in 1919. a.the inoreased trom. 11.1~ to 12... other .".,. ••
trca 4.'~ to 12.!;.t whIle Utah men deereased from "'.~ to '3.~ 04 Idaho
men from. 1&.'_ to ,.~.
18.
The oompos1 tiOD of the groun8 of "(Clen chaneed ~a follows! For Cache
County trOOl 15.6% of the F'r •• hmen to 3'.5~ :or those who .ere uaduated in
1920. lor Logan an increase trom 3e.3~ to 41.1~. For other "tate. trom
l.~ to 3.4~.
Itl~ho and Utah de(!reASeil in about the A8D'1e relnttve proportions. about
t1ttyeroent. Idnho decreased trOtl'l 14 .. t % to 6.9%. and Utah from ag.e~ to
13._. The GTidence here presented points quite conclu81.,.ly to the fact that
students who l:v$ within ft rnd.iu.s enabllne them to live e:t home, haY. a
lower mortality rate th611thoBe from {!r'e!''<ter distances. This 18 8sEmm1.ng
that Logan and. Cache County studen.ts may live at home; which may not be
unlTorsally true, etrpeels11y of the Caohe County Ifltudents.
D1st-&nce from 90hoo1 f.H~a.ol8 to be 8 sl1.ghtly groater factor or morta11ty
from echool for WOfaen then tor men. 88 lndlc~ted. by the tact that from
Utah the mortal! ty :!eroerrtsire NMUg women WBe greater than runong the men.
Only ll( of' the women gt":.\due.ted a8 com "-ared with let tor the "'len. While
InLog:''1n the ratio ot thoso remain1np, to graduate was 27% tor the women
and 261;:' tor the men. In Cache County 1 t ..,na 54::; for the women graduating
to 22% tor the men. In Idaho the ratio was 12% tor the women and G% tor
~en. The percentage being low for both men and women ot Id9ho, whlch in
'turn repreeent8 a hIgh mortr'llty.

"Coll.~8 18 Utah," aocor41ns '0 t.turrql • ., are la.rf~ly local in-
8tltuttona." Hl@her mortality ret •• tram the more dletant loaal1t18aten4
to make them .oreso.
Mr. Murrey'. oonolusion. l~elat1v8 to attendance at .ollege •• related
1'_
to dietano. e.r.e 1n agreement wi th the tln41nc in this etu4)t. ~uotlq trOll hi.
the.ls, page 17.
"The 402 (Junior College ~::tud.nt.) who 11T8 in Caohe Count)" oom'P1"I ••
55.n ot 721. These students can practlcnlly live at home. and conau:te '0 an<'l from 8ohool. ,. of the '121 are 8 non to 11 T8 j n Box Elder County. the
cont.1 EUOU8C ounty or the west. 'rhea. students 11.. w1 thi n 30 to 40 milea
01' the oollege. w1 th the exception of ft tew students. Transportation tor
these ~tudents doel not Bner.1 fefl,sable due to barriers ....
"If those of Box .Elder County are added to thoae tr om. Caohe County 1t
18 SPGn that e.pproxl.mately 6~'; of the .Junior Gollere r;tudents live w1 thin 8.
rstUua or 40 miles of the eollogG. althOugh 1 t 1s revenled that the college
does dr'3.w students trom 'PractIcally every corner ot tJtah.'"
:":n conclusion: l;;'1.nditlf:a show that distance from college ' •• IA to be
ft tactor tor mortal1.ty. This coupled with the fact, th~t distance reduces
the proportiorJ.ste nWilber of High Schoc;l pupils who etton(l college; 1s a
dect,ded hand1<!ap to young tnen and women 1n communitIes located more than
30 to 4rO m11ft$ from 0011e£'8_ This 'Works, dec1dedly. to a greater dia
advant6qe to w~n than men.

COLLJ:G.& GRADES .AS A FACTOR or MO~JJ: .. lft
Bow 4Q the colle~ grade. of those who d1scOl.ltinne oarq)are wlth 'tho ••
who remall4 but are not pr8dU8.te4J 8M witb those w110 {i)"e £re4uated 1n. 19130,
at the 41ft.rent perlo~8 or discontinuance?
It waa the 1n'ten'tlon to make comparison between these group. at the
ead of each quarter t but the DUillber 41aGGntlnu1nB was eo small atter the
th,.rd quarter" that 1. t f/ft8 neae888.!'Y to combine them. into le.rp:er ~roup ••
The 4th, 5th, and 6th were combined; the 7th. 8th and Slth, and the 10th,
11th. end 12th.
1. 'End of first quarter
3. End of third 4uartEtr
4.. End of sixth. quarter
5. En" f)f ninth quarter
In order to make oOO1J'ftrlsonl the rollo"in,! et6tietlcal rt:t.ent"lUreUlI, which
are briefly d.ef1ned, were cOrTrputed for eHch g,roup at each interval:
.3econti; Ste.:tdard D~T1atlon, referred to In tabl ••• e S. D., 18 one ot
the most generally used meR8urea of "f'ar1tibillt1. It is a :rtlea.8ure of. d.18tance r
from the mean. in a frequence cUl-ve; which it taken in both direotion. woold
1nclude about two-thirds ot the eases in tbe population rep.resen~ed. It is
ayvbollzed by the notation (sigma).

!h1fth 8te.n4u4 DeT1at1oDot the M ...... t.rnA ",0 .a S. I)-a+ t la
dlo.t •• the proba'ble '9'ariatlon ot ftd41tloMl .. :pl. mean. trcmtu -.1n of
fourth: Go8rrlo~ent pt Val<iatlon, c. or v. J 1. a measure or variability
abaolute hOltlogenl ty.
In ret.l~ring to Table No. lV ltehould be under8tooa that 1t 1. a
d1tfer.oent e;roup of students referred '0 at eflch lnte"al. It 18 the taor ...
tell ty group. The group of each elecocso1'1e intorYe.l lB 8. segregation trom.
thoso who disoontinue.
Table. Uo •• lV. V, and Vl 8W!ll1Hrize the Ante about grades tor each of
Table lV. Standtrrds of 1lee.nuXtement for Fr8ahl'uen Men Who Discontinue School at Veri 0'15 Intervals t Expresved in Ozaade Foints •
M,ean.. .
orY. InterTal s. D. Ii!l D·u C • ..... end
1st. 1.327 .91 .140 el
2nd.. .925 .57 .114 61.5
31'd. 1.225 .71 .152 58
6th. 1.49 .498 .066 Z3.·~
9th. 1.57 .58 .13& 34.1
12th. 1 1.61 .455 .126 30.1 .... ,."'~*' .
note. 1. None discontinued during this interval. The nleaeuree for th1. interval are of thirteen students who were in attendance during the sohool yeor 19r.9-2v but, .. ho had les8 than nine quarters or work in :residence.

Tabl. T. S.-.t'daot"' &nra.nt at Vulou tnterre1- Esp:;. ..... .,. 1. G1"64. I-oint;. tor FnMme Uft· Who Continue be)'Oncl Period Indioa".' but •• " DOt G.n4Wlted ill 1 29.
Interval ~u s. D. S. D-m C. of V. end
lat. 1.32 .61 .053 46
2nd. 1.48 .U .052 36.6
3rd. 1.153 .53 .056 54.!
6th. 1.64'1 .535 .016 32.4
9th. 1.8...,7 .31 .083 le.8
1!th.2 1.858 .33&5 .OM 18
Noie 2.Thia group in the 2th tluarter includes 611 enrolled 1n the year 1028-29 who haTti compl ted nine or mnl". qUftrtere or work but wh.o did not. graduft'te in 19119.
Table n. stancs.rde of! 1"!t'F~8U!·.tJlen·t$ at Ver10us InterT8la Expressed ill GrAde POints tor Fres.ruhen Men Who were Graduated with the Class of 1~29.
"'!""""'--~--~-.----"'""""'!'---~-.....---.. ~-.~.-Interval i1.1ean S. D. S. D.m C. ot V. end
lat. 1.406 .555 .088
1.637 .51
6th. 1.705 .41 .065
9th. .067
l?th. 1.785 .40
.1.

Itw111 be .oe. by reterdCe to Ta))l. lV'that, wI'tlitbe _OftJ;ttcm. ot ,he
lat. quarter, the nftl'flp Kt'adQ polnb ot 'hoe. who dt •• u.t1I1ue,'a. aoe ••• 1,..
lntel"ftlB ria.. Th1s augseata the poaa1b111 ty thnt the poorer .tude.'. drop
lout tiret and that the I)roC(~8. continuo. at eaoh succ*,ast..,. ported.
~"h18 tact ia further en'.rpb",.1atld whe'll fl ecapar1&ol1 113 me de w1 th Table V.
The fi"r.,dea heN ahow an i.t'101"'e8.s. at successive atages sa the interior are
eliminated.
:.rho •• who oontinue to graduation a8 rev.ttled in Table Vl show the s ....
gent.,rdl. upward trend and ia at $very1ntGrTol higher than thoee who discont1nue.
It is also hifb,er th811 tlloaewbo oontinue but are not grcduated except at the
last tW() intervale.
kheh ~';l'(}UP tendo to btdCClorne t1iCl):-e bOlllOretlSOU8 as 18 h~d:toatod by 8 stead)"
reduotion or the standard deviation in the successive periods. That of the
mortali ty E~roup ueorttuf.!illg i.rregulbry at the six SUCCGfHl'ive intervala trom
.Bl, .!)7, 171, .4~8J .5H. to .455. The standf'lrd deviation of thoat) who eon
tinue hut do not grp:<"uet8 de-CU"'Ml!Jfl8 .. a tollows: .61, .54 •• 63, .5315 •• 31,
and .336. The st811dcrd 00'."111t1011 of those who eu". p:raduated In ll){~ decu"eaae8
sa tollows: .t555, .4'75, .51, .41, .485, and .40.
There is also e fairly un1i()~1 reduction ot the coeft'101ant of variation
in snoh group. The g""'eatoet ..-ariab111ty 1s always to be round in the group
that dlsoonttnuee.
Theee ~e9ul te! can le~.d. ae to but one q,eneral conclun10n:
A few of the bette:r students 81"0 <11"0: pine out p..lor..g w1 th the interior
ones. This terlds to raise the u"leangrades of the group and. diminishes the
tlJJparent 8ign1ficanoe or low gl'udes 6.$ a contr-ibutery facto1' of mort,~~lt ty
fro.D sohool.

A. I1'8phical ccaperlaon of tho i;hr •• eroUl)$ on 'tho basie of aV.Nse
grade points w111betound ill l11guN V1 on the following rq.. w. tind
upon exam1nstf on of thle grn,h and froll the e:boye teblea that tho •• who
con:ttnue. average better than the aratluates at the last two interval ••
This Is probably duo to the fact thet those ~!..ll the group who eoD.
tinue but are not graduated ha'1e 1n most c •• ee dropped out or 8ohool
temporarily tor 8. Q.uarter or more, thus poat:ponlng their El~ndua'tlon date.
Undoubtedly. since they have returned. it indiontes a dtiterm1natlon and
perhaps superior ablltt;y_

J'lsun Vl.. AVeftp Gurn.ulattT~) Grade Points of 1926 x'reabllell __ by Q;u.art8ra.
, Gr ~ .0
ade 1nt,~
1. ~
1. a
1. " 1. G
1. 5
1. 4
3
1. 2
1. 1
1
• 9
e
, t t
----~ / . . "'~ ~<;:
r:....,--
// .... '
/'
,.' ... / ;<.,,0'
_I
r--,0 /' \ -.:: ./ \ '" -+-- ~ --/
\ I \ I
I \ I \ I \ / \/
t t • • t • t I t
/---- -----/'
,
o..\tC!..C / -------~, >; ....
~ ~ ,,-\. ,,-
).': ......... ' ---- ---- -- -"2. -- --<: • --0-/ -
(~~/ ./
.~")-" ~ ./
/
~-----
--_. ---~ --------
• --'-t , , • t
~uart.r8 1 2 3 5 «) 7 8 0 10 U 1~
f----
----- -
-~~~-
-~--
Notes: l.'rhe srt~des tor the twal th quarter 1aclude those who were enrolled dtH·lng the school yesr lO!8-f:9 wi th nine or more quarters oredit but d1 d not gl"8dua. te.
a. The grndea tor the twal th qual't51~ of thoee ttl Rttandance in 1928-29 with less thnn nine quarters ored!t.
The following Figures Nos. 7. 8. 0, 10, 11, and 12 show, by grnph.
the distribution of the three groups of Freshmen, at the dIfferent inter-
yal periods. Grade pointe ere represented on the x-axis, and num.ber on
the y-axis.
25,

Ho. a:s
Leg4
130
15
10
5
," " " o
Grade Points (-).8'1
,/
Fipre No. 'l Graphical Representation ot the Grade-Points o~ lG25 Yreeluaen }.fen, U. S. A. C. a.' End of First Quarter
m.d / / \ .--.... "'" / \
.Ll1uW s .. IlINI!!I \ Oonti LU8 ---- --- v/ \ Disco] ltinue "
~ ----- -- \ /" . " ~/ \ ,
..... .......... I
I ........
I \
I I \ I \
I \
I \ I \
I \ I \
I \ I \ I \ I \ _.--.
I ~ I \
I / \ I \ \ I ,
/ \ / '\ \
... ,." , ... I"
... \
/ , / 1, ___ /"~ ~, 1-\-
\ / ........ I
/ ~ .. " / ,/ ' ... , / A
, ... , i ,-
V \ /
\ V .. i
........... ~ / / ',I / ""-. ... //
~ ~ ".
~ ~ ~'" - ~--/' ... ~
(-) .3'1 .12 .62 1.12 1.62 2.12 8.68
..
i
, ..
...... ~~ -....
8.12
t\:) Q') .

-' ---" -~----",,"
,/
"" V--'" ,,' ----./
..... ~- ------ I----. ..... --..... _ .... ........ , , ,
~ " " ~
/ ~ I
1/ ~ 1'"-- -- .............. --... -- .... .... ....
1"- .... - 1--- --- --I I , : I I I f .
I i I ,
t~
Ji ,.. ., ~ t1
'C t;;;
& ;~ ~ : ~ ~ g~
~~. ~ ~A
" .:l
, ., .,--:/ 1\
L.----"' ~
r-----. ~ ~
I--"'" -~-~ ......
1\ \
\\ I
~ ~ ...................
......... 1'-.. .... ---... - ...................
I I I I I ",
' .
/ I
I
/
V l?'
/ /
1// ;" ,
',,----- ......
\ II
\ I I
I "', '" ''\ ,
I I I I I I
I I
I I \/
'v
/\ I I
i \
\
'\
= •
&) • -I -
".. • -t -0jj
a ~ • J
·27 <

No. ao
16
12
J'1gur8 Ho. 9 Graphical Representat ion or Grade Poiats of 1925 Freshmen Men, U. S. A.. o ... t .End ot Third Q.uar'ter
Legt+nd 1929 Graduate. ..... -~..&..~
..... ---Disoontinue +-----+- --
f
I T I i I
1 I ,
'\ I \
I \ I \
I \
I I I
\ \
\ \ \
T I' \ , \ I \ I
T \
I
I I
I I
I , f \ \
\ \ \
\ \ \ \
\
8 ~I----~----+--- I
Z1 \[/f\ I '\
/1\ I I I'" I I
4~--j----T--~----~--+---~~-+--~~--~--~--~--~~--~~~--J----
o Grade Points (-).87 (-) .37 .12 .62 1.12
,
1.62 2.12 I.U •• 1&
A-
I ,

No. 20
16
11
8
"
LegeJ 192 .... vv.u.
Dla
o Grade Points (-).8'1
1. t Grad
J
' ... .u.u.v
Ftgure No. 10 Graphical Representation of Grade Points of 1925 Freshmen Men, U. S. A. C. at EIld of Sixth Quarter
~ates
--- --- f-
~ant1nl let - --- ~
" , / 1\
/ \ I
,/ ............... / \ /,,/ / .... "'" ~
\
\ ,
V \/ \ / I \ I \ 1\ I VI /\ 1\ /~
~~ It'/ / . , /
/ /
/ ,,/ , / ,,~ /
I V / I
'~\~ / / I I
,/ V/ \~
/? ----// ~/ \ ........... ' .......... ///
,?/ ........ ........ /'" ,
(-) .3'1 .12 .62 1.12 1.62 2.12 2.62 3.1&
I •

No. 10
Lege
8
a
"
2
o Grade Pointe {-).87
19 1'1"" --D1
n4 ~g Gre "'-LA
~--.... -.... ~cOl.lti
Figure No. 11 Graphical Representation of Grade Points of 1925 Freshmen Men, U. S. A. C. f\t End of Ninth Quarter
,,"nate. - --- - -
~u.. - .. -- - / \ / \ / \
/ \ / \ / \ / - -
/ /\ I~ \ \ 1/ I , j'
\
I , \ \ ,
/ I I ", \ ,/
\ \ /
I I 'I \ , I I " \ I
" ~/ , I I '~ \
// y, // \ I \
\ ' \ / / \
V \ ,,I \ V , //
---
1/ \ II \ kl '" ,
1/ ~
(-).3'1 .12 ,,62 1.12 1.62 2.12
\ \
~\ \ \\
", \\ " \ '~
2.62 3.l.a
8 ..

Bo. 10
Ji&~r8 No~ 12 Graphical Representation of Grade Points of 1025 Freallmen Men. U. Sf' A~ C. at End of Twelfth QUarter
Lett;ead
~!~~4 f:~iuates Di;~~;rt1nu-* -_ .. r-._-
8
6
4:
a
o Grade Po1nts (-).87 (-) .37 .12
Note 1. HaTe completed more than. 9 quarters. 2. Be-entered with less than 9 quarters.
/ /
I'
/
.61
~\ I \ Ir\ I \-1 V 1 \ J \ L11\ !~V \ J ,'i\ I I \ ~ ;j\j \~~, I ~
/ \" \ ' , \
V l ' ~-\T~I-~----
/ I \V" I ,,~ " 1.12 1",62 2.12 2.62 S.12
~ •

The followillf Table., Nos. 'J, St and .. au.t"."I'lariZ8 tbe t;tat1st1e~::1 deta tor •• oh of lhe 'b:r .. groupe of' lref.!i"ll!e. WOllen at the eM or each period.
Tabl. Vll. a'tu4arda ot Meawr_t tor Fr •• h_n WCl'4e1l Who DiNonttnue school at V8:l"l()ua lnt.r"fala expNl ... 4 in Gr-sA. 1';;01n'8.
8. o. • .. "5'; '0. c. of V. m ......!~~, .... ~ ............... I"'*' • I ................. ~, .......... ~,.\_, _, ___ .........., ......................... __ • • ... .,
let. .8'15 1.0376 .46& 119
!nd. 1,E25 .582 .26
31"d. 1.(.25 .~O .11A
6th. 1.rm .49 .096
9th. 1.75 .46 .l?";'.,
12th. 1
-----------------,.--.--------~
Note 1: None d1flcontlnut!\~ only one ral"'~ent .,1 th les8 than g~~,uar"er8 of (n"edit.
Table Vlll. Stan(1,arde of iJ&8surement at various lnteM"al., expressed tn grade poi.nts tor r: ... i:1shnitn :';Oi:len ffbo Continue in SChool hut wore not Graduated in 1929.
~ ~e*r\n D. s. D.ro. C. of V. ..
Interval .,;.,. end. ...... ................. ~_ ........... ., ___ ........... _t.,...._ ..... ~ .... ~~_"~
let. 1.403 .65 .072 46.4
2nd. 1.47' .5f)5 .0&4 3'1.2
3rd. 1.6 .575 .0'19 35.9
6th. 1.785 .49 .098 27.4
9th. 1.693 .52 .15.., 30.6
12th. 1 1.'16 .515 .154 30
}Iote 1. Those r.8l'orted 1.n the l~th 4~unrte:r are thor'$ who were in attendance during the 8chool yenr 1928-29 with nine or more quarters ot credit, but were not gr~duated, in 1929.

SI.
'ttt.bie lX. Stlltldarda of MeReurement at Vf\.riou~ !n'te:.,.."..le 'f~qlres.e4 in uede poln". tor l!reehm .. n "oaten ot ·1\)23 Olf\$e tho Were Oraduatee! in 1~!9.
B. n. O. of v.-
l.ut. 1.634 .115
.101
1.815 .1
.50 27
9th. 1.9£7 .086
.0'12
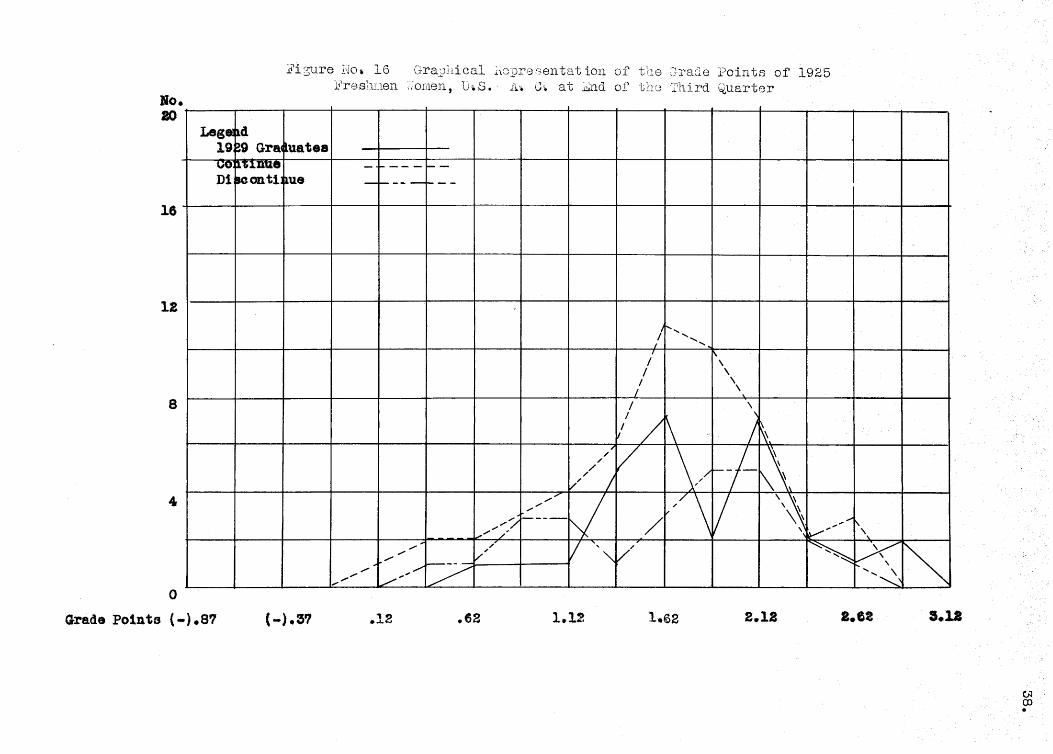
Nos. Vll, Vlil, and 11: we find the 88l:ile general condl t10ns 88 amon~ the
men.
In e1fGry grou:p the average grade rises In the 8uoeeRs1ve int.rYe-ls t
t'1ere being ~ut 't""ln ~:xcentlnns. At the end of tbe third quarter tor the
but ure not ts,rHdu~,ited thore if! n fll1.;;ht decline troQrn the elxtll to the
ninth ',lu!~l"'tftr r111in.f~· ti~ln in the twelth.
As arncn~ :nan, th.)se who disoontin.ue have lower 'lvere.!?e grade. than
e1 the::- of' the oth~r t~oU;:8. ono exco~,t1Qn be1!1$ noted in the ninth qU8,rter
pnrlod for elimination of women with low grades. Among the men, the end
of the second quarter eetG1ed to be the moat stgn1.flcant.
Ar:. "''' th i.1en, eBch rrroup ten.ds to beoome m.Otte h.omogenous at eaoh
eUOCfJss1.ve intervnl. 'The bHsie of meB~llrement tor homo~eniety b&ing the
standard devia.tion and the coe:ticient of variation. Tl18 difference be-

tween tho •• who d18c{)nt1.nu~~, anil ··chO$."ho :r-oll'iAin hnt I..re X1(')t ~.r!'l;4Ut\ tfl4
1$ not iJ.sLllarke<i ... it .8.8 between the similar t.;t'Oup. of men. Both of
the,.e UQ\lPS eh().lll.,~ A W~lder varifit10n than t.he greilua ting group •
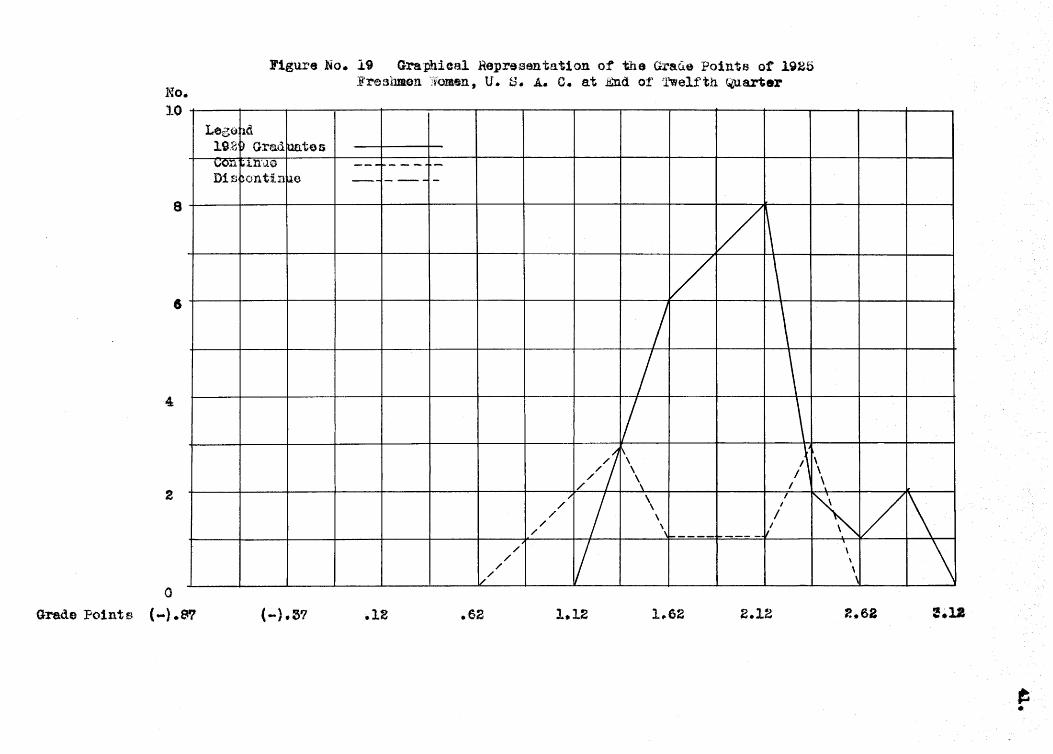
. i1gur··e ;:z-o. l:S. nn thfJ tollow1ng_n8€:$t .hows ,~1.'.")h1cal1Y th. cam
'pari80n otthe three groups on tha b&.81$ or aVer8~j:e f':l'l1de pointA through
out ,he four year p€~rtod8, 1925.1l9.
'llhe ~Nlde$ of tIle d1ncontlnuing group only crags tho ~1'~8d. line of
thowe who r8llUlin at t1fO :pQ!nts t tho thlr4 nnd mix'h quarters.
As ncted tInder '.:'able 1"11 +,hGT"f) were no etudentA discontinued h(1;tween
Qth aud 12th (lUnrter~, lJnd only one in attend.ance during 1)H~s-.29 .,,1 th loss
thnn n1 ne :~uartc.r$ orad 1 t •

Fisure' No. 13. ATernge elumll~t!."e GrAde J'o:tnta ot lft2e '[.~1"'oBhmen WOHl&l1, by quartf7rs t
, t • '-,...._ ... - • Grad. • t , , f •
POi.!lte
--2.0 .. ----I--
" 1 .. 9 \ '\ "'l.. C
Cs..V( I>--~ ~ . --I----
1.A / ~ . ' ----- . ...: ~ ......... --- " .. ... "" .... ~- -~
• t
- --1.'7 V c:,...' ""'" , ... ,.. 1--------v' .,..".'" ... -...
<{' ... r--.,..>c:'" !vi .Q' :,.." 1.6 J. - ~Y' J. ~ti)..)'_ ~:..'
~ /'/ " ,..
,
1.5 ,/ I ".". ....
- 1,..--- f 1.4 I
I
1.3 I
I I
1.2 I I
1.1 I , -' 1.0 , ,. ,. ,.
.9 iI'
.. 8 --.... -.-... -- .. ---,--.. --~ ... --_ .. - ..... -~-~- ".,...,~-..... -~ (~uartera.. .: 1 t 2. '3 '" t 5 t 6 ,t 7 t 8 '9 t 10 t 11 ' 12 t
----------'-

Bo. 20
16
1£
8
•
Lege
i', ,.. .. ......... ~ ..... ,
o Grade Points (-).87
J1gure No. 14 Graphical Representation of the Grade Points of 1925 Freshmen Women, U. S. A. C. at End of First Quarter
p.d ~g2g G ~aduat las ~Olllim 11. - - --- --p1seon tinue -t----- --
I~ I \
I ' / \ II', / \
I " / \ "-I '"l
\ I \
I , I \
I \ I
I \ I \
I \ I I I'
/"" \ \
" \ ,.. /" I \
I \ / / ~
\
l\ / / f\ \ L
/ \ /
/ ~ V \ / I\,-~ /
/ \
" .... v \ / \ ./ / / \ £_"
I
V / "', \ " /
~" ///X ~, /
,.../ ' ... // ...
" _.......... ~ //_ _ _ _ L" '~ ./"'" .... ,
-
(-) .5'1 .12 .62 1.12 1.62 &.12 1.'2
I
, , "
~ " 3.18
I •

No. 20
Lap
11
12
8
4r
o Grade Points 1-).8'
192~ -"""'oW. D18~
Figure No. 15 GraphIcal Representation ot the Grade Points ot 1925 Freshmen WOmeD, U. S. A.. C. at End of Second Quarter
~ Gradt Late • .
~LU"U' -- -tontin't 8 ----------
/\ I \
I \ I \
1 \ , ... ' 1', I
, ." I \ ~ ... ,
I I " I 1\
I '\/ \ I
\ I I \
I \
I \
I / ~ \ I \
I \ I / \\ I \ I I , f \ I
, I J
, , I '\ I :/ \ \
I \ \ I / ~ / l\ \\ I
/' " ...... I v- \ ...... / / ...........
/
~ ~~ ........... ",/ ' .. ,/ ' ... /
~/ ' ......... v' ............. /' .............. -- V ,',
(-).37 .12 .02 1..12 1.62 2.18 I.a ~
S.lI
51 •
)10. BO
1&
12
8
4
Legal 19 vv; Di
o Grade Pointe (-).87
:?i3ure ~{Oi 16 Gra)hiea1 ~\3:9n38entat ion of the C;rac1e Points of 1925 :B'reshI,len;;-omen, lJ .. S.' .i~'~ G,. at ~nd of thrJ 'l'llird Q.uarter
14 ~ Gra ~uat.a l.1J.lIlUG - ---- ~-!JCont1 ~U. - ----r---
/ 1"-- ..... ' ......
I ,
;' " \ I \
I \ / \
/ \
'/ ~ \
/ / ~ /.1 / \/ ~/-\\, /
/ /
/ /' ""'./
V ,/\ V \~ ./ \ ~ /
\~ , ---- / ... / /,/,/ \ v ..... 1', v' / -"
""' .... / V ",,-V' " X "'" v' r/
/ "." .... ,,/ .......... \ "","'" .....-""' ... ~ / L _____ -
(-) .37 .12 .E2 1.12 1.62 2.12 2.ta
I
~ 1.11
C:N OJ .

No. 10
16
12
8
fr
o Grade Poin ta ( -) .81
LegE 19~ ... VV.l
D1~
nd 9 Gra(
~
tit.&..u.u.'P
contil
I1gure 110. 17 Graphical Representation of the Grade Points ot 1925 Freshmen Women, U. S. A.A. at E.1ld of S1xth Quarter
nates - I- - ....
~e - ------
/ 1\ /1)" \
\ I ~ \
/'j ,
\ I'" '" II;
...
'" ~,,>« " ..... ..... ..... , , W "-
/ "' ... --~'" ~", ' ......
D< V --",~ /
/
V V "" y , ,
(-) .~7 .. 12 .tl2 1.12 1.62 2.18 2.$2
i
~ S.lI
I •

So. 10
8
•
"
2
o
Leg 1 l .. l
D
Grade Pointe (-}.8'1
Figure No. 18 Graphical Representation or the Grade Point. of 1925 Freshmen Women, U. 6. 1l. G. at :iSnd of Ninth "lUarter
~ ~29 Gr :tduat88
."1; 't II'. - --- i----
~scont ,.nue ---- -~--
I ~ I ~ I \ I \ I \ 1/ \ ;( ~\j \ \ I
\
P }/ ~ /\ ,/~ /\ ~ \ " /
" J
~/ \ \ ,,/ I
'\~ / \ \ I I / \ \ " / \\
1-. - -=-_-- \ \V" / \' .\
~ ~1 \ //
~ '\ ~;/
\
" " ,,~ \ / \ /,
\ " \ v
(-) .37 .12 .62 1.12 1.62 2.12 2.12
I
I
I
\ \ :!.12
$ •
No. 10
a
I
4
2
a Grade Points (-).Et'l
Leet) 19,2 \.ion Diz
Figure No. 19 Graphical Reprasen tat10n ot the Gra,6.e Points ot 1925 Freshmonjomen, U. S. A. C. at End 01' l~elfth Quarter
p.d ~ Grad IU£l,tos '''In'i.l0 ---1---- -~onti:n ~o -.- ----
V \ V \
/ \ / \
II \ //1 1\ /' \
~ I
, , \
,I
/ \ I
.~ V / I
/ \ / /
\1- / / -/'
V \
\ / \
/ \ 1// ,
(-) .57 .12 .62 1.12 1 .. 62 2.12 ~.62
\ \ 2.11
e; •

In ort1er to ~}~f; Q,t10!"e {t~tt1ilfjd C0I11HU·;t'-:Oll of thf.l VtU"i0t18 groupe
of freshmen mefin and women .'i 9ucaeSf 1 ve 1nteroval.: the date of ta.bl ••
Boa. 1 V. V. a.nd n ror men end Vll. Vill, f'tn~ lX fnr women .. ere p,Nd in
mak111g oot:putetious or other J.4'aaeures se tollow8:1
.4t.
'11~': 3tandt:\rd TJ",iation of the :"'1ftertlnce 18 fit, meaaure tor
determining the 8i(;nltlcance of the difference of the mean. in comparltl1
two groupe.
Second: CrItical aatio.
Cr1 tioal 1'"at1o ae here interpreted represents the ratio of the diff
erence of 'the two L18ens to the standard deTi(\t1on of the differenoe.
'l~lrd: J'robab!li ty.
As the term probability 1s here used, it repr •• enta the reliability
of the d 1ffarence between the two Sl"oupe eomptlrad t and has been detenuined
ff}i"und.e.mentellJ! of
:::ttttist1oa" by L. I,. 'Thurstone, on the btluis or the number of ca.ses tn
10,000 in wh1ch one ~~oup mA7 be expected to exceed the other.
The cDmT>utat1onr; tIre Sutr,it4&.r1zed in the table-son eOln:rarison that
tollow:

a.
'fabl, x. Ccaparlaon ot Grade rolnt. ot F~ ••• Who Otm\iuue ill Sohool but are not gradu4te4 with tho •• Who Dt.oontinue at Successive Perlo4a.
.. Quarter. h!.an of Mean of Dirt. S. D. C. R. Probe
thowe tho •• of mean of in remainly dla •• M, .... y2 Dlft.
t ,. 10.000
J, 1.32 1.32'1 .00' .155 .004 ,gSa
2 1.48 .925 .555 .125 4.4" 99t8
3 1.53 1.225 .306 .181 1.80 9"06
6 1.6"'1 1.49 .1.5'1 .lle 1.36 Q131
9 1.83' 1.5' .267 .152 l.se 9535
l~ 1.959 1.51 .M9 .153 r.2'1 gee~
...... '"~~.
Note 1: !he oompa.rlaon in the twal th qUJl:r"t~~ t a bt;rt'~)f)·en th:'Jff8 in a.ttendenee in 1928-29 who ha-re cor.o;plete{l nine Qr r:l()l*. quarters of' work. with thow in attendan<.'e who hnv~ c~l$ted :n1n6 ~~11'!:~'terB of' l~ss.
From the ttbOTe table No. X it will be eeen th~t the d.1fference in the
grfl.oe 'points 0110 thoe8 who l·~in in school is si{m.1f1eantly hirher than
those who discontInue, at e~ch interval. exce~t tho f1rRt quarter, when
there 18 'practically no difference.
factor in school mortn11ty ,. men 5-8 the end 'Of the se.cond quarter.

quariert.t. 1t:.oot of the atudtinta in 'his lat"el' group lui". been out at
echool t<aI'1porar11y.
Tftb16 Xl. COCiiH'!rleon of Freshmen Yioo:e.n Who Cont1!lu~ 1:'1 ~~hool bu1;hllO li.ra not Gra.(tuated in 1929. with 'l'hose '11bo Discontinue flt Succtlss1ye Periods,
-.... I
o't-~ ... j ,,;l" Dlff:- h. ~tu8.rters ~',la!l:n Mean ~ 1). of G. "". those those ot ai~; .. t.
.r.~i1!Jl!!!,G •. ~1f.c .. menno 'J ,-" .. ......... ,.. JI'l-:::P
1 1.403 .e7 .5a3 .47 1.17
2 1.477 1.225 .252 .278 .914
0 1.6 1.625 .025 .018 .142
6 1. "182> 1.52 .265 .13'1 1.93
g 1..t)~9 1.75 .057 .200 .285
1:.21
:tlotel: Ineufflcent number to consider, '
,
-F'rob. in.
10,9990
8'190
8196
4920
9132
38'1S
discontinued are l~w~:t" tlulln those who oontin.ue. Thel~robttb11.1 ty betn~
from school of wom.en at the end of 'the first, Etecon.d and &ixth que.rt~r8.

41tt.renoe betw •• n the ,raa.. ot 'the two groups Ie ira t ... or of tho ••
who 41aecmtlnue at the en4 of 'he third and l1inth quar"hra. It 18 rela'1Tel,
In oompa.rl ng the l"eElul ts otthe Table. l-~o.. 1;. and Xl 1 t appear. that
low grades are e ;;101'8 ei~"1l1rieant i'actor in 8chool mortality among _n than
!ablta X11. COJ1;,r,.2u:"1ann ~)f ~l'~de t'o1:ntsot 1925 ,F'resl:w.en Men Wbo were graduated in 1029 wIth Those Who i)iscont1nu(Jd at Suoc8ftslvtl I\)t1oda.
llean ot Mtl'll of nitf'. G. D. c. R. Frob. Quarters thoBe tl10R0 or ot in
____________ ~Pl~i djnc •. _"_.m.e!tn!!" ____ ~tf1" ... _____ lO, O~j()
1 l.406 l.3~? .O?9 .1'7 .47 eooe
I 1.819 .925 .694 ~13!3 5.15 QP1)l9.9
3 1.t337 1. '?t'.5 .41P .laa 2.45 9'J2g
6 1.705 1.49 .315 .O?z ~ ~t,~~ If, ..... 0,) g900
\} 1.'13'7 1.57 .157 .161 1.1 94311
121
~~-~-~------------------

mortf};11 ty group.
Tsble •. :tlil. Contpariaon of GrHde l'oints of 1~}25 Freshmen Woa,e.n ??!10 were Gl~·i~.i~\tec. ill 1\129 'N'itb. \It.c~!;e 'fiho l)1ecanttrl,1.l ai Successive Poriods •
... ~ __ .....,._ .. _,_t ____ • ___ _
1
2
3
1",1
'V.ern ::>1 1929
1.654
l.?'?
1.815
1.f:5
1:-t~~" - .,_.;.,1
.. ....... • •• .. ol': ....... "... ... lIIIWt~~-:. ~ • ..........:~_~, _"'!-_,_ :,~efln of [1.tt. B. D. C. R. Prob. 'hose of of in
.. "._.-lQI.OOO .. "
.670 .'164 .4613 1.6::!'1 9481
1.2~5 .!547 .e'78 2.~iJ 9890
1.825 .19 .155 1.2f.!5 8801
l.b~ .203 .lZ1 2.5~ 994P.
1.75 .177 .150 1.18 8810
.......... .....,...~~,..t
su~·)atantiat. the conclusion previously drawn, that low c:r1.ldee 1s a factor
H.

1. determ1rdng mortality frO!!l sChool. Slif,htl,. more a. foetor for men
than for women.
Table XlV: Compar18onot Ghde Polnte of 1925 :rresh!neu lien iho Were Graduated 111 1929 with Those Who Continue l'Iut Were n.o", Graduated in 1929 !~t Suceeseive J:>eriode.
MeCin -ef-:'-~ birr .. r J
Moe.n of S. D. c. R. Prob~ Quarters 1929 those at ot in
sraduates continue means dirt. 10.000
1 1.406 1.32 .086 .102 .84 7996
2 1.619 1.48 .139 .091 1.53 ~370
3 1~()37 1.03 .10'1 .Og, 1.11 8665
6 1.705 1.647 .058 .115 .51 6950
9 1.737 1.837 {.).10 .130 (-}.?8 20'17
121 1.785 1.858 (-).073 .10B (-l·es 2492
Note 1: Those who con t 1 nus in the twel th quarter ~i"e those who are in attend3t'.ce in 1\:B9 with nine 01' more quarters cr-ed1 t but are not grad,uated in 1929.
This comparison between tb.e graduates and those who, oontinued is made
bec$Sluse the graduates 5.1"e considered to be ~tr1ctly a non-mortality group,
while those who continue but were not gracluated is a feeder group I for
those who continue, and thus may be classified as a mortality group with
the exception to be noted below.
Here again, as in the two previous. oomparisons of men, there is a
difference ot grades in favor of those who were graduated. during the
first four interVals of compa.rison, when the reverse is true, The re-
versal. however, at the end of the ninth a.nd twelth quarters tends to
$UbAtantiate the previous conclusion, that low grades is a. significant
factor in school mortality.

nln'h and ' •• 1 th quarters conststs largely or students who for 80M reaeon
or other haTe w1thdrnwn temporarily tor 6 period of one to thr •• quarter_,
and haTe return",d to continue their t1J4ucatlon. and in all -probabilt ty M.J1Y
ot them w111 be graduated in 1930. In reality the ones compared with the
e;raduatea are nut a m.ort~l t1' group, but rather a hift.hly selected group ot
ind1viduale who are oontlnuing their education, seemingly. 'under adverse
c 1 rCU!flste nee ••
Table XV. ComparIson ot Grade Pointe or 1025 Freshmen Women Who 'Were Graduated in 1929 with Those Who Continue but were not Graduated in 1929, at Duoce~slve Intervals.
D~"'" "ean of ~i~ean of TJit!. ..... C. R. Frob. ~).
Quarter. 1929 thoes8 of ot in ~IAY!te8 ggQt1nue meana dirt. 1,0.000
1 1.634 1.403 .P31 .135 1.72 9573
2 1.'172 1.47'1 .295 .119 3.23 999.
3 1.815 1.8 .21G .12'1 1.89 9545
6 1.85 1.7ee .065 .135 .48 6844
9 1.987 1.693 .234- .1 '19 1.31 9449
lait 1.974 1.11& .258 .170 .152 9357
Note 1: Those who continue In the twelth quarter but do not graduate includes any in attendanoe with more than nine qunrtere credit. OnI,. eleven students are considered in this group.

In all UOGpt th. toUl"th period, the enet of tho 8ixth quarter, there
18 a .1pttlcant 41fterence ot the grad.. ot ~he two ,roup_ in raTor ot
tbo •• who eontlnue.
Low sr&de$ are in almost eV8ry oomparison 0108ell relete4 to the
hleb .ohool mortal1tr of the 1925 freshmen 01a08 both among men and women.
rlnd.1nge show that low grade. 18 an important tactor 1n Bchool mortal! ty.
This etudy does not at'_r>t to determine the causes or low grfldes, but
auggeeta the possibi11ty of their further InvestIgatIon •
. /~notheT" qH8stlon that naturally a,rletul. of primary importance, in 8,"
democracy like ours 1e!
noes not the colle,s tail to adapt Itl) ourrioulum and m.ethods ot
teachlne to 8 larp,e ~iroportlon ot students who enter £LS freshmen.
One is led to believe ·t}~at colleges are meroly actins ae selectt TO
agents on the basis of the abl11t1 of the stud.nte to con.form *0 present.
and large17 pa.~. traditional ideas of oauent1on rather than s8rT1ag aa
construetl'Ye aids to better and more effioient citizenshIp by adapting
themselves to the Heeds of the majority.

Ia arunreftll8 tM qu •• Uo... .... 40.. .. ea. ot _0" .. 4i_oattaue ooapa:n With tho .. who ooat1JltW1- ~. ~el_
... ala .. 1fte4 1ato the toUow1DC s-upe. tor oomparl80JU
J'1r." Tho ... 41lOOnt1rm. at thaend of the tire" quarter.
SeooD41 fto .. *0 dlacontiau,. •• the en4 ot ,~the .. ooAd. t'U.rier.
Thir4l Tho .. *0 41800ntl._ at the ead. of the ~ q\l8l"Mr.
quarters.
fitth: '!ho •• who d1aoont1D.u •• " the end or the •• Yea»&, eighth,
or J11ath quarter ••
Sixths Thos. who eli8Con tlnv.. at 'the en4 ot the teJ1~h, alevath.
or twalth quart.ra.1
8eTa.1;h, Tho. who oon'tinv.. to cra4uatlon 1». 1929.
DIstributIon tables were then made tor each croup, U81D.g as8 ..
oomputed. tor eaell grotlp.
NoM 1. The .'tude t. in thIs group 1& nall V do DOt 41800n tlnue at 'the per1oc1.a, 'but represent student. 1Jl at'.ndanee durlDc 1928-21 who do no", creduai.. In the major! 'ty ot caM. the7 haTe W1 thdra1Q3. t1"Ol1 school, t_porarily, for one to three quartere, an4 in all probability W1U sraduaw Wi th \he cl.... ot 1930.
50

The tolloriDi Table .0. m. g1'v.. • euamry of the S",a'tstlcal ...
tor the Tarlou8 group. of 190 ·Fr ••• en 148n. 0Jl the baei. of ... at the
'1me ot entrance Septembor 1'85.
'l'ableXVl. Stanctarcla of Mea.u1'Wl8nte 111 Yearl tor FreehMa Men OD Baate of AS- Septeber, 1125.
r: I I • Group Mean a. D. B. n·m c. or v.
i P..l .~~ IO.M .625 10.2
2 19.05 1.7(\ .~6 8.85
3 20.13 2.38 .546 11.6[\
4. 5. 6, In.7! 1.57 .'.18 '1.95
'. 8, 9. 19.1t 2 .6 10.4
10, 11, l~ 10.48 1.3'1 .368 7.43
Oraduate. t 29 ~t,!5 1,~3 •. 259 8.!2
1Iote1: In school in 1~29 but not eradue.t1ng.
From the abO'9'G table 1 t appears that there 18 a tendenoy for age
to be a t~c'or in school mortality amonr mona The older students who
enter ft. 1~'re8httien tend to drop out of 8c1:001 earlier than the younger
ones.
fc:ach .uce(uu~1'Ye mort811ty @:'t"oup 18 younge,!" tl"dlll the rreT1ou8 omr
with the except10n of the end ot the second quarter. The ase teetor,
unlike gre.de. begins to man1f.'est itself at the end of the tirst quarter.
The graduates oonnist of the youngest group to enter with the ex-
c8ption ot tho 1 eet t':"tO in the 11st. This 18 in 8-p1te ot the tact thet
there .ere B~'~.ersl students in this group r-slr .. tlvely old, ~hlcll tended to
raise the £tli"'an t)ge or the group.
Ii •..

II.
The CK'IIl'paratlTel7' low ap ot the mortality go.p 1. the 10,11, an4
11th. quartera, whloh in reality 1. aot a mora11t1 group at all, a.
pr8vlouely noted. indloet88 tbat students who ent~r at relatl ... elJ low area
8.re likely to continue their .4uoatiOll e,.8n though the,. haTe been torced
to w1 thdre.. at some period or other. tor fran ODe to three quarter ••
It would appear alao trOll ooaparlaon w1 th the graduate grQUP. tha,
the younger students are more likely to withdraw t~porarll1. than those
who nre older.
In cOOlparing the V'tlrlabi.11ty of the groupe, those d1ftcontlnuln@ in the
third quarter show the greateet variability with a coer1clent of 11.615,
the ninth quarter group next with 10.4 sucoeeded in turn by the tire' quarter
10.2, ~he seoond quarter 8.86, the graduatee 8.42. the sixth quarter group
at "'.95. 'l:hos8 w1 th the least varabl11 ty ot 1.63 are those who are in
school in 19!8-2t but were not gradufIlted in that ~'e8r.
To show in mor.e detail the significance or the differenee in age of
the various groups. addItional computations were made 01' standard deY
iatlon of the differenoe, oritical ,ratio and probabi,11ty.
The 6dd1t1.Gnal date. and the comparison 01' the various mortalIty groups
wi th the graduates will be summarized in the follo"illt? Table I~o. m.l.

Table XVll. Ccmpari80n of ace ot 1925 Fre8hmen M •• Mortal 1 "'1 Group. "1"th Those Who t.tere Graduated in 190.
T1_ 0"* ... ··Mean ot. k4an · oT rait • . 'D~ O".1f;-Prob. s. Mortality others grad. of of 1n
;'!6:~ means d1tt!
l.A lOeOOO 1 19.I& 1.31 .6'1' fie
2 19.85 19.26 .60 ."" 1.35 9115
3 P.O.l! 10.85 .87 .605 1.44 9250
4, 5, 6. 19.72 19.26 .4'1 .342 1.3'15 9159
". 8, 9. 19.19 19.25 -. 06 .583 -.011 49&1
10, 11, 12. 18.46 19.215 -.79 .448 -1.76 302
.
This table shows thttt 8fre 1.. 8 Rien1tlcf1nt factor in mortalItY'
among \lollege !4enetudenta during thel.r first two years.
During the third yen,.. it 18 Inslf.1,n1tloant.
The mortality after the third year 1s small, but when graduate.
are compared w1th those in re~idence who did not F~aduate in 1929 .e rind
that the age ot the lette:· group 1. 8i6%l1t'leantly lower than the graduates.
If' additional sam-ples could bEt obtained the~e would. be a p:robab ~ 11 t:: ot only.
302 cases in. 10 ~OOO the t the age of' the graduates woul d be lower than th'.>se
listed as hav'l1R completed nine. ten, eleven. Or' twelve quarters end are in
residenoe.
n t ·

Table XVIll. S;andar4s ot M.a8ureme~t in Years ot Freshmen Women on Basis ot Ale September. 1925.
Group Mean S. D. S. D.m P. E.m C. of V.
1 20.'15 1.3' .&815 .462 6.72
2 19.35 1.39 .59 .39A 7.2
3 19.34 1.89 .403 .272 9.77
6 19.27 1.78 .364 .245 9.25
9 18.5 1.22 .326 .215 5.6
121 1'7.75 .53 .167 .115 2.98
Grads. '29 18.58 1.16 .216 .146 6.25
Note],: This group consists of 1925 Jfreshmen students in residence, who have onlY' completed nine or more quarters of work, because of temporary withdrawal, for trom one to three quarters.
Age among women, 8S well 8S men, seems to be a factor in sohool mor-
D4.
tal1ty. In every Case except during the third year the age of the ffiorta11ty
group 1s higher than the age of the graduating €roup. The age ot each
sucoessive morta11ty group is below the one preceeding i~. The older
stUdents who enter as Freshmen withdraw first.

1'r01m, one to three quarters and baTe 're-entered and will probably gr8du~t8
This tendency tor the youn«er students to take more thfiD tour )feel's
The v~r1~b1,l tty Qf the Dlortal1.ty groups during the firat two years
18 greater then that o-r the third and fourth year. and the graduatelll.
Tht;~t~ 11. t!ted in the f'ourth yea1'" show th~ least vurtabill ty In a~e.
'l'able. Xl;:. ;~(.}j"r:"ll'},HOn or :,ro or 19f!5 ;;':'''ets:nen Women i.,::ol·t~11 ty Gl"Olr:rH'J wi. th 'Ttnne V"ho Y,'ere GretJur:ted in l~~~.
"'~_'-""_»I>"\_' ......... ___________ . ____ .:r.> ____ ~._, ......... _ .... __ ........................ ~
L;<:~.;.tl ':::Qt~ n ot DiN". S. D. ~)~ D. - Probe of Gred's ot or ot in _
_____ (;;;..)t;;,;;l_~t::;..,·'!;..,;.·s,jo.;.:...-__ ...... W2'--""~...;;;;;..;;...-,~onn. (1 i. f.'f. 10 .. 000 PoO .. ~~ ~..,,~. ~2 --~'~~87' .,~-1
2 19.35 .528 2.82 9976
3 .4~'1 1.66 'bi5
4. 6. 6. 19.2" .42 1'!'f34· 94-96
7, 8 t 9. 18.5 .391(-) .02 49~J.
.273( .... ) 3.04 12 . -,..
The QOnelllsions 'interreii from this te.ble are thep81ne for Women
t\8 1nd1csted for men in Table XV'll.
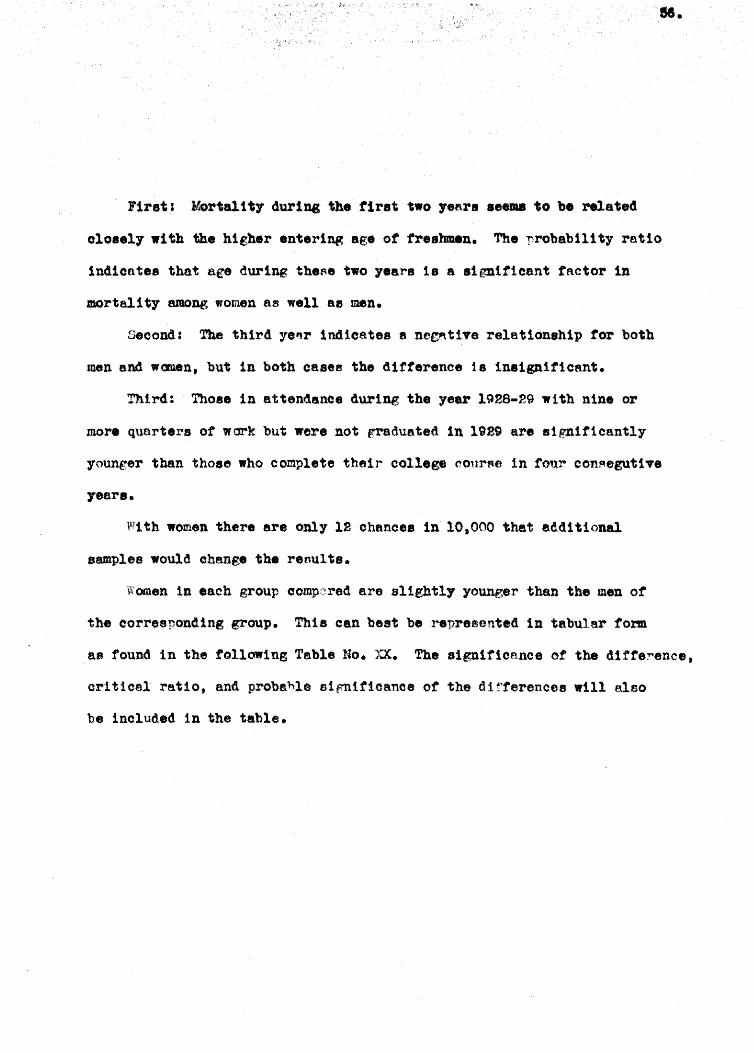
First: Mortal!t, dur1nsthe tirat 'two yeftrs 88_ to be related
0108.17 with the hieher entering age ot freshmen. The probabilIty ratio
indicates thnt age during th.~e two fears 1s a significant factor in
mortality among women am well a8 men.
Second: The third ye'!r Indicates a ne~t1Te relationship tor both
men and wanen, but 1n both cases the dlfterence 18 in81gnificant.
Third: Those in attendance durIng the year 1928-29 with nine or
more quarters ot work but were not gradunted In 1929 are signlfioantly
younger than those who complete their college ~our,.e in four conAegut1T8
yeare.
With women there are only 12 chance. in 10,000 that atdltional
samples would change the results.
Women in each group cOlllp:.n"ed are slIghtly younger than the men or
the eorr$8pondlng group. This can beet be represented In tabular tor.m
aa found in the following Table No. )~. The signIficance of the difference.
critical: ratiO, and probahle eifflllf1eance of the differences w111 also
be included in the table.
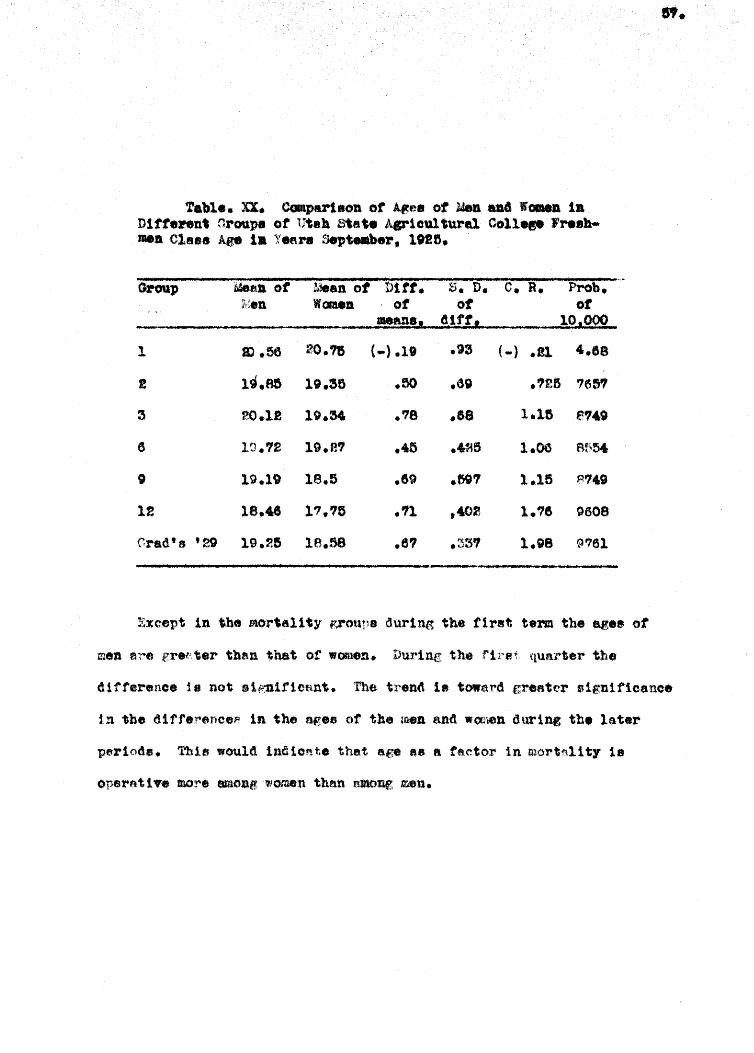
Table. XX. C.part801l ot Agee of Mea oel w... 1a Difterent Groupe ot Utah st6~. Agloul ,ural. 0011_ 7"811-men el ••• Aee 1. YeetN Septeaber. 1025.
Prob_ ..• Group Mea. of Mean of Ditt. "" D. c. R. i:l.
hien WOIdIl of of of 11I88l18. 411ft! 10.222
1 m.56 20.'1tS (-).19 .93 ( -) .11 4.18
2 19.85 19.35 .50 .e.9 _726 765'1
3 PO.le 19.34- .'8 .68 1.18 e,4,9
a 10.72 19."' .45 .41i5 1.00 R~;M
t 19.19 18.5 .69 .597 l.le 8"149
12 18.46 17.'15 .'11 ,402 1.'18 9608
(';rad's '29 19.25 18.58 .67 .3:i'1 1.98 ~7el
Except in "be mortality f".,rtOU!'8 durl11g the first term the agee of
dirterence 18 not sl~lrlCtlnt. The trend 1. toward grefttt"r signIficance
in tbo dltrerenc8P< in the ages of the 1I18n and WCli~n during the later

PART 11
REPLACEMiNr IN 1925 FHESBMEN CLASS
CHAl"TER Yll
lR!YlOOS COLLEGE TRAINING OF RErL~ ··ae:NTS.
When and with wha' previous treining did meabera or the 1929
Graduating cla88 enter the Utah State Agelcultural College?
An examination of tbe data reveals the fact that of the one hundred
two listed a.s 1929 graduate. t torty enter$d 8S Ij'l"8shtnen in 1825 ana com
pleted their college work tor the B. S. De€ree in the tour con •• cutive
yeftrs. Twenty-seven had entere(i. the collese at an earlier date, but the
mfljorl t)' of those caRes ha.d drofped out tempor~rl1y, to re-enter and join
the clas8 ot 1~29. SIxteen had completed one year of college work at 80me
other Ineitutlon, nineteen had completed two-years of college work else
where.
or the women, numbe~lnr.seventy-two graduate., twenty-nine entered
wi th the elt\f~s of 1025. }'our ~li.tered the Utah ~)tt:,te Agrieul tural College
as Freshmen 'Previous to 19f',5. Ninett~en entered w1 th one yfrr junior
CollI'; t"e atandlng. Twenty entered. w1 th two ye1i rs Junior Collf:ge stand1ng
tram other Inet1tutione.
ThesE reI,lacementa ot the mortality losses of the 1925 Freshmen el8.Ss
reduce the totHl mort"·lity of the. cls.ss as reported in Chapter 111.
No attempt wlll be made to show the exact quarter in which the re
placeraent took place.
The totel mortnllty of the 1925 Freshmen class, as reported in Chapter
111 was 74;:~ for men A.nd 6'/% tor women. Several were included in the attend
ance analys1., who were not porflaunted. They w11l likely become members of

the 1910 pr 1931 gredueting 0188"' •••
The tollowine table will aummarl_ ill numbers aDd percen'A" the
aurvt.al aDd mort~lit1 of the Fre.hmen Cla.8 a. tinall, d.ter.alned by
the replacement. abOTe reterred to.
TableXll. Replacement. to the 1925 ~'r.8hm.n Clae. t
Considering only 1929 Graduates.
Wen Women No. ~ Mort- No. " al1tZ alitl
1925 Freshmen 207 100% 11& 100%
Craduate 1929 40 19.5 80.7 29 25.2 74.8
iieplacementa.
!~nter before tet> 2'1 13 4 3.5
One yr. Ur. Col. 16 '1.75 19 lei.!;
Two yr. Jr. Col. 19 9.2 20 17.3
Total Grad. t2g 102 49.25 72 ae.5
Total l~~ortali ty 50.75 3'1.6
The total mortall ty of the Frestunen claRa 18 much lesR than indicated
by the analysi. gIven in Chapter 111. When replacements are taken into
considera t 10n it 1s reduoed to 50. '15% f·or ruen and. 37.55t, tor ?l0111en, 8.S com-
"'nred with '14~ and 67% respcot1valy.
When sticdents, who entered the Utah Stute Ageicul tUTal College 88
ltreehtnen lire considered, the total, represented 1n theH:~cond and third
linea of the sbO'9'e table. we find 8 higher mortality among women th,:-,n
Rmong men. The percentage rate of mortal 1 ty tl 6'7.7% tor men and 71.~
tor women. This reversal is due to the tendency for men to temporarily

drop out ot sohool more trequently, thus 10081ng their etandlrc with the
01 ••• with which the entered. Twenty-seven men and on1r tour women are
accounted for in this group. When reduoed to a percentAge b1'l818 1 t 1.
13~ tor men end 3.~ tor WOOlen. Replncl'mente by those who w1 thdraw
temporarily ere thus nef3rly four times a8 frequent amont men as among
wanen.
The above tflcts justify the following FenerRl conclusions:
......
"F'lrst: A larger T'lercent of women who enter the Utah State .Agricul tural
College 88 Freshmen graduated in four years than wen.
i:3econd: More men drop out ot echool tem. ... )ol"sl"11y. then do wallen •
thus requJ.rlnr more than tour yoars tor grn.duatlon.
Third: A larffF' percent ot men who enter the Utah State Agrieul tural
College as1<'reshmen e'9'entually fTaduate with the B. S. Degree than wanen.
32.3( tor the men end 2e.&~ for women.
,f"ourth: Helattvely more women enter the collef?:e w1 tb previous
Junior College tra5uing than men.
11'1ftb: The total !)lortn11ty. when all replAcement. are considered,
is ereater amonp men then women. 50. 7St% fo j' men and :3 7 .5< tor women.
sixth: 'rhe replacements from Junior Colleges 18 proport1onfl);ely
(,reater for women than men. Be1ng respectively 3:'.~ and 16 .O~ tor the
total number ot those graduating in 1929.

CHAl~ VUl
INP'I.UENCE OF Dlb'1'ANOE UPON REPLACru.errS
Do Replacements troca d18tant looal.lt1e. occur in grenter propor
tion than from near-by local1 tie.?
The origIn of 8tuden~8. a8 1n Chftpte~ lV has been determine! by
using the High School last attended as the baei. tor t1xlD.8 home
residenoe.
Students were clsf'Alfled into five groups acoord1ng to ref!lldonce as
tollows:
liret: I .. ogan
~)econd, Cache County (outo~d. of Lof'an)
Third: Utah (other than Cache County)
Fourth: Idaho
}'if'th: Other ftates.
In Chapter IV it 'If'. concluded thAt the mortflli.ty ra,to among, 1925
Fr~:ahmen was highel' for Ut~h and Idaho than tor Logan end Cache County
and lowest from other etate~. The .':ueet1on that concerns us now 1s: Do
replacementfl from distant 100('1.11 ties o('cur :f 11 ftr~8ter !'roportion then
from near-by localities?
61.
Table No. XXll eUlJwar1zes the data necesaary to aMwer this qU~~8t1on
in regards to men. while Table 1;0. SBlll .umr~er1zes the data tor the wanen.

6 ..
Table lXll. 1leplacement8 to the 1925 ,"_hulen Cl ••• on the Beat. ot Home ;lealdenQe. tor Men.
Compoaition ~ 11 16
t 25 ?reehffien 11 18 18 6 5 Oraduated In 1929
Composit1on ~ 45 10
Replacements . F'reTlou8 1925 9 21 30 2 6 0 o
Composition ~ 33 e 1
One yr. Jr. Col. 2 8 4 (\ 18 e 11
CO!npoflltlon~ 12i 25 1
Two yr. Jr. Col. 1 3 13 10 10 12 5 11
C,.;;;;om;;;;,olo;..;;}Q;;..;;s;,;:;;.I._tl_o:;,;;;~;. ..... i~ .. _~ . ____ ~"'--. ____ 1;;.,.; .. 6;.... ____ _M._. __ ,_ .• __ ?-...... It!~ ____ _ Total replRcement 13
Composition <fb 21~
All ·29 Graduates 24
ComposItion tp.,
!<?jiA ~·~or:t~'lll. 'f
31 12
20
57 17
16%
431~ ::.
51 23
37
"4 41
26 , .. :
23
41
12
19
14 41
14%
59
:3
7 78
22
When replacements are taken lnto conei<h:re:t1on, the mortal 1 ty of student.
of ,the Utah State Ageloultural Colleee 18 not nearl,. so great Be indioated when
the F'rt1shmen Class ot 1925, lll)ne, wes considered.

II.
fte tlu1 ualya1., h ..... er, 'I ... laO' tall •• 'e ..,. _t_tal ..... til the
,"",loWl ctoaclualcll. tht the IIOMalt tr 1. srtater trom. 41.t8at .. trca
Dear 100811 tl... other .ta, •• thu Utfllh and I4flho betas ,he exoeptl_ •• lHttore.
S'tudentes trOll CfIlehe County show ,he low •• ' rate ot total JaOrtallt7 "' ••
*1 th tbe exceptloa ot o1her nat.", ft. not" e'boYe. l'OE~Jl lwfl • nt. of ~.
nt.1s and I<1I:~ho MTln.f the hlff,he"t ral. both equaling~. V.ell af14 Idaho
h •• 1rtG the hlt!lles't rate both equallae 5~. H~lao .. n". troa.:dabo han b.oll
relfttlTely fP'fjater than from l1tah, 3e~ [ina 23~· respeot1ve1y. The mortalt ty
rate of the >reshmen elaa. ot 19~5 .. as 9'% tor 14Rho com.pared w1th 8P.% tor
T"tah.
J,ogt"n $IItudent8 OOD81atitute a~ of there 'hmAm (;1&88 of lO!& whtle 2'1·lt'
of thoe. oontlnult to sra4U1lte til l')~ arefl"'otll l,()enn. frnl7. alight increase
wtll be noted 1n the perocntaee oompost tlon from Caahe Count,.. '1he ehan.ge
b,lne from 111~ to 12~~{ fJ :tdAho shows a hMVY aort~'11 ty I"llte. 16~ or tbe
elas8 of 1.925 ... re tram Ida:h\l. 'Wfiil. oJ\ly '!if" of" tbose who remained to gra.duate
in 1029 W-6>re trCll'la !{l~,ho.The proportion ()f l;tnh Stud(;;v,te devTea •• d .11~ht17
trom ~. \0 45~~. t..5tber et!!toD doubleathe1r",roportlol1 from ·the 1~ai10 of ~
to 10'1'-
/"ft*n' conai(ler'ng all rf):plecements. Gaohe Countf e.ud Xd!lho see. to haTe
gained re18.tlvelr the moat. I.O£aft., Utah and other f\uteu .• following tn the order
named.
Caohe Co. stUdonts conat1tute IGfj of the total 1929 !radttatlft@ elflf!8 ",h1}f'
but 1.1~ of the 1925 ilreBhm.n Cla~. t "ere from. Cache Co. Logen baa 23*J& ot the
graduating 01a88 of 1925atft. 11nt~ with ~, or the 1025 Y're81w1eJl Cl&s8. Other
statea incr'eued .heil" percentage from 5% to ~.Idaho in .pi t. nf her ft
latl",ely high rate of reple.cetlliGnt still 10S8 on a percent~\g8 bAsis trom le;i

, u..
to 1'~. U'\ah 10at moat •• "'117 deor_ins trca .. to ~ on • percen'a ..
b.e1e.
The r.plaoemente are classitied 88 tollow.:
firat s Those haTing entered the Utah Su.1ie Agrloul 'ural Colle .. prior
to 1925.
Second I Tho •• entering with one year lunlor Coll.'ge standius.
Third: Those enterlna with two year junIor College standing.
'l'wenty-ee'Ven men belong in Group 1., 8txteen 1. Xl group 11. and nineteen
in ,,roup 111. Theee are sub-alassitted according to HIgh SChool ori8in or
local1 ty. The number becomes rather am.all in the sub-classes and tends to
reduce the reliability or the conolusions, but perhaps indicates the general
truth.
It 1s shown in the table No. XlJ.l that :3:$ of group 1 came from Logan,
~6~ from. Caohe County, 3~~~from Ut8,h snd 8% from Idaho.
RelAtively; ba . .,ed, on the o~1gil181 number or the Freehmen claRa, the
replncements tree. Loean 8nd Caoho County. trom thIs source, Were much h1rher
than trom the other looRl! t1es. The 1"8'\10 being Logan. 211&, Cache County 30J',
Utah ~. and Idaho 6%.
Cache County end Logan students, withdrawing trom the instItution, are
more lIkely to return, later. than Utah and Idnho students. Stated in other
words, they are more likely to withdraw, temporerily, than Utah and Ideho
student ••
Logan students are three and one-half time. as likely to return to the
Utah StateAgrloultural College after wIthdrawal as Idaho studc.;:nts, Cache
County students five titles ee frequent end tltah one and one-half times 88
frequent as Id'ho students.

The o_poeltloD ot the croup entftine with OM year lunlor Coll_p .,and-1nS 1 •• l~ trail Lopa. 1~ fran. Caohe COUllV. 2~ trara Utah,- Z'~tr_ Iaeho,
aDd a~ trom other atat •••
Tha relat! •• repla.cements, baaed on 'he oOllpoQ1tioa ot thelQ8& rr.abua
cla ... it: Locan '1%, Caohe Count)' ••• Utah 4r~. Idaho l~ anA other stst •• 11~.
Thi. indicate. tb8.'t replacements with 0118 ,enr of Junior College oredit tram
Logan a.nd Cache Countl are twice 8.8 likely to occur 8,8 from utah. rroa Idaho
the probability 18 four and one-half t1rr.ea as frequent .8 trom Ute.h.
It 18 very probable, that replacements trom this souroe would be lees in
Logan and Cache County at the present tIme, s1noe the abandonment of the
Brig.ham Young College, whioh at that time Jtl8de junior College work available
to lo,~n and Cache Count1 student ••
The oomposit1on or the group 191th two yeArs Junior Goll.ge trainil1l 18 as
tollows: Logan ~, Cache Count, l~, Ut~h 53~, Idp,ho 21j{ and other States ""
Helatively, the repl~cem8.nis ocour as tollowa: LOIe.ft 2f1t Cache Count;Y13~,
Utah lot. Idaho 12% and other states ll~.
Replac8tttent trom Logan in thle group ralls to the lowest in the list, while
there 1s not 8 great oeal of difference between the other groupe. In general
the replucet'iente f.rom. Logan, with two-years of college tra1ni.ntt, 1s lIkely to
occur only about one-fourth to one-fifth as frequent as fran either of the
tour other sources.

.... ;
'fable XXlll. neplao.ento to the 1928 !freshmen Clase, on the Basl* ot Hor.a.e Re.idence, tor Wamen.
Other state.
~ Cache Utah idahO
No. ! No;' ! :. : , Jlo, ! No;: 1925 Freshmen 44 100 18 100 3' 100 17 100 22 100
Composition" ~ 16" 2w,C l~ ~
192~ F'reehmen 12 2'1 10 515 , 12 2 12 1 ~o graduatIng in 19~
Ca,npo8i t1 (~n % 41% 34~~ l'~
Heplecemenia
:reviou8 1925 3 '1 0 0 0 0 1 S~ 0 0
ComposItion ~ 75% a~ 0
One yr. 3'1"'. College , 1e 1 " 21 4: 24 0 0
CompositIon ~ 3~ 6% 37~ 21~ 0
bo yr. Jr. College 2 4rll 2 11 14 41 2 12 0 0
~nQ8ItI(;n ~ l~ lQ'A l()l~ lQ! 0
Total Replacements 12 27 3 16t 21 62 7 41 0 0
CompositIon % 2~ ~ 4~ 16~ 0
All 1929 Graduates 24 54 13 78 25 "4 9 53 1 50
CompositIon ~ 35~ 1_
3&~ l~ l~
Total Mortal! tZ::: : 46~ 2@ : :: 2e~ - 4?! ¢!
Among women t n8 will be noted in the above table, the total tllortel j tJ re te 1.
somewhat dIfferent than when the 1925 1~'rf),8bmen Class, elone, was stuOied.

Repl.a_-..nta trOll Utah and Idahn are greater, proportionately, 'baa trca
LooaD aDd C.che CountT. Tbi. haa the .tteat ot placing Loaaa with Idako •• a
o'her Stete. in the p081'1on ot highest total mortality tor women.
There 18 11 ttl. dIfference between Cache CountrJ and Utab, tha latter
haying the loweat rete ot the tive g"oups, 16~. Cache haTing e. rate of ••
Idho rate exceed. LOg61l rate by but one perceat, 4"~ and 46~ "8peet1 .... 11.
Other stet... involving but two etuilents ranking at 501&.
Replaoements from Utah aDd Idnhn have been proportionately greater than
from LOllsn e.nd Cache County. From Logfin the replacements hn"le exceeded the
Caohe County rate, but not sufficient to orreetthe higher mortality rate amoDS
the 1 925 }f~re8htnen Class.
UsIng the 1925 Freshmen clftBS 88 a baeis tor co~arlsont the replncementa
tram the dl 'terent localities are aa follows: logan 2~, Cache County 16!~.
U'tflh &2%. Ide.ho 41%. and Other states, none.
I~ogan students compose 38% of the 1925 Freshmen class and 41~ of those
who 1·ema1n to gI-adU8te in 1929 yet only 33" ot the total 1929 graduating class.
CHche County stu.dents represent only 1~ of the 1;'25 freshmen class and 341'
of those remaining to fraduate but 18% ot the total 1929 graduatIng class.
Utfth students renresent ~ of the 1925 Freehmen class and l4~ of those
who remain to (':rHduate in 1929 and 35% or the total 1929 graduatIng ola~8.
Idr",ho students compose 1t1% of the 1925 Freshmen Class, "'1% of' thOfll e who
rerr4l1n to gradu8:te in 1:129 and 1~"f6~~ of the total 1920 Graduating claes.
Other states oompose ~~ of the 1925 Freshmen Class, g% ot those who re
main to ~d ete 1n 1929 and l·i% of the total. 1920 G-rndllatlng Cla.a.
Replacelnen'ts are proportionately greater .from. U't',h, Idaho, logan and
C~ehe County in the order n~ned.

Fire" Thoe •• ft •• ring a8 rreahmea prior to 1915.
Becone)" Tho .. ent.l'1q with 0118 Jear J'unlor College nud1D6.!t
Third: Tho.. enter-tng w1 th ftc 18ftr-$ of J'un,lor College .tu41 ....
On.lytour women are listed .a having entered tbe lnst1tu"ton l.rlor to
1025 aa Fre.hmen. Thre. of tho". were from Logan and one trom Idr.ho·.
18.
Nine'.en entered With one year J'ull1or College e.rodl t. The compo81 tion
of thts group 1., L6sau sn. Cache County I 'S'/;, Utflh 3";. and Id8ho21".
RelatiTe11 It bsmed on the 19~5 r.'re8hmen olass, the replacement. are greater trom
Id·~lho and Utah than from. Logan and Cache Oounty. The ratio 18 as follows:
Logan l&i%, Cache County *, Utah 211', !U1d Id ''iho M~.
Reduced to a 1)robab111ty retI0, replacement. from Loge,n with one year
Junior College credit are nearly three t1I!le8 as frequent aa trom Cache County.
Frca U'tah tour t 1:llea ae frequent and frOOl Ideho about four a.nt one-hdf t 1mes
8f't trequent as from Cache County.
Twenty women atudentn entered wi th two Y(Jars Junior Collegtl stand! ng. 'I'll.
oomposition of this group consists of l~ each. from Logan. Cflehe County. and.
Idabo and 70% tram Utah.
Belat1 vely t the replacements occur as follows: Logan ~~, Cache County 11%.
Utah '1St,. and Idaho l~ •
. Heplacement8 in this group are ahr.mt two and one-half tiEes ns frequent
tram Cache County and Idaho as from. Loga.n. e.nd nearly nine and one-half t1me.
aSfraquent from Utah 8.8 from Caohe County and Idaho.
MEN pJJD W(l.~ C (l ¥ A!u;;D
.. \ relatively higher percent ot women trom Logan and Cache County entered
the Utall state Agricultural College w1 th the 1925 FresmnenClsf'8 than did men.
A decidedly lower proportion entered from other Utah 'Points, wh1le, from Idaho

.,-.
&ad Other S •• t •• there w.e little dift.reDOe.
In aotual number the Mil aJ14 w.en troa Logan alld Caohe Couaty.ere
Pfto'teall,. equal, wh11e tr. other parts ot Utah the mea exoee4ed tbe w_en
thr •• to one. From Idaho the :ret10 we8 two to one, while tr(8 other _tate. the
ratio was nine to two.
The mortaltt,. ftJ:D.On, 1986 FreabDlen, whell using only thoae who sra4uated 111
1929 tor comparison, W88 81'; tor men and '15% tor women. When to,al replaeem.ent.
a:re taken into consideration the mortality among men 18 reduoed to 5~ and that
or women to 38;(.. Th1A indioatee that the replacements among WOD'lf)R 18 :-elati",ely
greater than among men 31% a8 against 30%.
1:n comparing the d 1ft.rent Ir:"oups of replaoements:
Firat: Those who entered a·8 ;'r8shmen prior to 19215.
TwentY-Beven .men are included (13%) and but tour women, (4%). A 'great
proportion of thelie were trom Logan end Cache County, ~ ot the men and 7~
ot the WOt1ien. This indicates that students fran near 10ee11 tie. are fIlore like.
17 to return to school atter withdrawal than are those fram more distant
locelit1ee.
M_n are about three times .ore lIkely to return, after withdrawal, than
women.
Second; Thoee entering the Utah ~)"81;e Agrioul tural Collepe with one
year ot junior College ered1t.
There were 19 .omen (1(\#) find 16 men (8%) included 11'1 this group. This
indicates that on e percentage b,:'sls. WOluel1 with ,·)ne yenr ot 1unior Col18~
oredit are twice as likely to enter the Utah State Ageicultural College a8 men.
Among both men and. women Id:-iho leads tho list on the percentage baeis, while
tor .m.en Logan flnd Cache rank second f1nd third respectively. Utah And LOFran
rank second and third respectively for WOOlen in this group.

Thlr41 Tho.. en, .. lac "1 til 'wo 1_". lul110r 0011_ work.
'1'here ••• ~. 19 mea (.-) oct SO WOIHD (1~) 11\ ,\hi. group. As lathe
group above. wcmen a.em twi" .. likely to 8.ter ,be oollege with two 7-r.
eollep 'r-aln.1ng than men. In aotual n_ber 1 t .-111 be aCt_ that tbe7 are
preotioelly .qual.
On a p~'jrc~:,ntl;,g6 'basi. thl. ratio tn Utah 1. about tour to one. SeYent7
percenl of the.omen 111 thl. group came trom the 1Jt~h l\ll1'trlot oU"81d:o or
Logan aDd Cache. Id;v1bo turtllshes the next lsree.t 'S'(\rcent while I..o~n for ,both
men and WOln$n Ie at tbe botta'll or the lillt, b~8ea on per'1Etrtt"e~h l':tf't7-o1'1e
percent of the mell In this tV0up are t~ the Utah territory.
It was indioated in 8 pre'Vlou8 Chaptor. tha on the who18, n&a,rneS8 to
the oalleg.. was R factor in rnortHllty and also ft tactor' 1n determtn1ne whether
or not the ot\~(!ent a.tten<ls coll&€ ...
r"t mit3ht h,ar. be suggeate4 that the 8$tablle.."lment of J'unior Collf:'ge 1.
more generally in the 8~8t. would help to rea11ze our ideal or equal educational
opportunity to all.
Thi8 pilrt of the ~tudy indlcatee,sJ;:ec1 f10a117. tht!t 1 t t 8 the women more
tha.n the men v;ho a.re barred from the o'p~:ortuni. tle~ of a c oll~p;c edueat10n by
the barrIer of d1atance.
As wa~ noted in a previous parngraph, men ftn~:iwomen tr~ the nes.r 1008.1-
1 ties enter the Utah ~)t8t./\ A«rloultural College in about equal number whtle
fran the d1stt'U)t loeal1t1es. Utoh. !d,:ho end Other Dtf!16R the'roport1on
shrinks to leS8 than on&-half 08 mnny wOit,en flit mell. '!.11i& {)ecu;rt~ 'in cpite of
thli't tact that the factor of distanoe is operHt1ng upon the attendance ot ,nen
to ft rmu-ked rl~~ee.
The establishment o't more Junior 00110808 in Utah 'Would, it 808m8. ~pnd

",oequal1 •• 'better the opponuni.l. of WOMIl with tho .. of .... tor 3'unlor
Col1~ e4uoailon.
It w111 be noted that song the croups enterine with lu1l1or College
trainins. tbatthe number of •• n and women 1. nrActloally equal.. 'lbis in
dicate8 that th~ ra(~tor of fliftte~oe is no longer or·f'rnt1196 upon tne wcmen
st'tott they have cotllplfrted their Junior College work.
General ConclufJ1ona:
First: ~:{e19ti vely teWf;)"r women than XJlen enter fl8 E''ra81:unan trm'l 1;he
distant localit1es.
Seoond : Replace'11ents altiOlH? women are equal in. nuU'~berto that ot .DHlll
and relet 1 vely gt'Et6.ter on a p(t;rcentage benis excerJt amone: thone who entered
88 Freshmen prior to 192b.
'l1ttrd; He1')lac6uh:-nis, on the whole, fire relHt1Yely g,I'eater frcm the more
outlying dlstr1cts; Utah and Idaho; than traIn Lo;:an and Cache County, tor
both {net! an(l WOOlen.
I;'our1th: HeplRcer;H:lnta from the g;'-~()\1p than e~,tered Jlrior to 1925 occur
in greater p1.'oport1onrrom Logan and Cache County. then from t;tah ~nd l'L~ho
tor both tIlen and women.
Fifth: Heplncell16nts lI1 th one year 01' Junior ~ollege (:1'"0<11 t oocur in
greater "roportion from Idf\h.o than frorr~ other 100ft11 tiU8 1"01' both men and
women.
S1xt!1: \eplecements with two YOf<{rS of 1unior Golleve work occur in
gre:-:ter pro:!,)ortlon from Utqh. thAn trclt>lother local i t1 ea. lOgfUl furnisbes
the smil!lllefilt proport ion of this group, runong both r:len nnd women

c~u:
mE SCliOl.ARBHIP RrCO!~S O)~ Rl;PUCn~Jm.
How do the Scholarship Recorda of HeplaoGi1lOnts compare with
tho •• who entered_ B8 rreahulen in 19251
11' Ch.apter V it wart flhown; that tbere traE> e. marK.&d relatiofl bet ••• n
low grades and .rrtortali ty t fie r.v~al~d in the stv.ay ()i" the 1;25 7reelimen
C1a88.
The qll.,stlon naturall7 ar1838; "Are th~ grades of the rcrla.cemente
corres-yondlnely low f or 1$ 1 t e. different t,YJ.;fp of stadent t~lat en.tar" to
rep1.~ce the one .ho diseontinues before gra~uatlon from college?" In
order to an.tJwer this, thecOO1TJll.r-isona will be «lade wi th tllo~e who entered
in J;;':l25 ,,300 l'emaln$(j to t~l"e.duate in 1929. l'his EJ:'OH!" h<'~Tlnet, previouely.
been oODl~,al~ed_ lti th thos$ who cl1th1O ntl nUG.
A.!lot.her rel~t.€~d question that :,-~rll'6s an .. \ becomes answerable with the
S80le data 1$: 'tHor;; (1.0 tbe 5ChOl~\rd8tiG reco:r'ds of Btad\;~nt-8 obt~ining. all
of their work at tlle Ut:,~h ~;tate Ag"1 cul tural COl16f$~ COlflpa.i.'L .",d.bn those
iflho recf;1-ve .I:-Hrt or till of their Jun10r Coll~ge 'Jork clsowilt~re'("
lhree dlff'&ront r~rOUPB of l"el).tac6idf.ttlta w111 be COUl:Jz::;.re<{ S~}rf'll'ately for
1U&n and wowrn.
;:'lrst, fr'ho~6 who 811ttll'etlthe Utah ;.)tate Agl"1cul tural College prior to
Oompnr1aollS will be m.ede "r their a"ferage ,HU;'lU1SJjbl "Ie grade points;
(a) At the end ot the Junior College per1otl.
(b) At the time or" graduation ,in lQ29.
{;8oond: l.~oae who entered the Utnh State Agr1cul turnl College with
one year of Junlo~ College oredit.

CoaIperisou to be _de or the e:verap oumulntl'Ye 1J'tl4. po!n'. at:
(a) At the end of. the FrflshraeD. 7.~r or one year of Junior Coll ...
(b) At the time of grsduatlon in 1910.
Third; 1!ho8e who entered the Utah state Agrioultural College with
two y.ars of lutllor CollfJ@:e credit.
Comparison to be made of e:verage oumulattve {tt'e.d,e pOinte e.":
(a) The en~ of the junior Colleg$ period.
(b) At the time of grt\du~tlon in 1":29.
Table No. XXl. V on the following pnge s~rl~ea the data of Dl08s:ure
mente for eAch of the rou~ f),;roupa of 1~;129 men grad\18.tez at the end of
each Ct')mparable period.

Tabl. XXlV. S"an4arde of M.aurement tor 1929 Men Graduat •• · .... Ocapa.re.bl. Period ••
Group an4 L. • I
1)er1od i
Me. ,a. D. S. D'm c. 0&1. 6926 FreBbeen OrouE
End of 1st. 'Jr. 1.637 .151 .075 31.!
End or 2nd. yr. 1.70B .G .08fS P.4.1
End ot 4th. yr. 1."185 .40 .0&4 ~?~
1~ntGn·.d u. Col A. C. prior to 1~29 ilJ e ,
Ind Jr. Col. 1.846 .61 .119' 33.1
End 4th yr. 1.99 " .535 .105 26.8
End 1st. yr. .14
End 4th. yr. .42 .105
It'.ntered U. s. A. .£ •. with two Y!'FJ3 JUlli..9 .. t ... .c.o1•1ttl8 Cred1;t
i.nd.lr. Col. 1.9£'1 .52 .119 27
End 5th. U· . E.Ol\ ,43 .108 u~Q.t8 . , •• ,............~~~·I
than th2se who entered the Utah State Ageioultural Collego as Freslunen in
grtflduat1ng ;:n lSi2011QS Sig,nLf1cantly higher than those who discontinued $t
The answ~:r to ou-r key qu(~ation, then :1SI The er'ades of the replace-
, .... , •.

Ye •• tudent. from lUD10r Col1",8 who •• 'ar the Utah st_,_ A.&rloul tural .
Collep are superior to those who enter aa rrenhMn 'both at the tl_ of
en1raue and dur1ag thel r attendance at 'he oollege a8 determined ",. their
oompara .. l .... grad. point ••
Thi. COJl.olusion 1a in eubstantial ~ement with the study conduote4
a" Leland stanford UnlTera115,..1
"Their abil1 '7 (Student. trom Jun10r Colleges) as measure,d by the
Thorndyke Intelligence 'feet 1s slightly superior to that of students from
tour collese yeer., and J'Q8:Ii[edly superior to the students who were admitted.
8.8 Freshmen. 'lihen their abill ty 1e mcaeured by their rrev10ue academic
reoord. the results erc similar.
In their two years or residence the jun10r College group, after the
ti ret quarter, show a(:periori ty to 8 oomparable group ot etu(Jenta who he ... a
had their provious noadHltLlc work at the UniversitY'. this superlo:r1t,. in-
oreases markedly in eaoh aucoessive quarter of re8idenoe.~1
Students 'Who cmtered previous to 1025 and, failed to gr~e.d.uate before
echolastic grades to those who oontinued throngh to ~1Taduation in tour years.
One might. be eate ill coucluding that, in th$ majority 0:(' cases, only
the 8uperior students of those who dlecof4tlnuo. (the r~ortt\11 ty g-roup) ever
re-enter to complete theil- oOllette course.
The T,roblem flpe.ln presents 1 teel!' to Colle~e Admln1etrators: "What 18
to be done about those students ~ho enter a8 heshmen with inferior aendemic
ability?" ShHll ~heyb8 rejeoted from a.dmission. oa.rly eliclinnted, or shall
Note 1: "The University Heeo!"'ds of Utudentetran Junior Coll.e~~es" John Fierce ,<,':\ tchell a.nd :kaltcl' Crocbl#" !11ia. Bulletin of the American Association of Amerioan 1~eglstrar8. New ~3f:1'"1e8, Vol. 111, NO.4. April 1928. }-'ubl1shed by the J'ohne-HoTlk1ns Press.

tbe 0011 ... exert! ,, •• If mo" to adapt It. work to thi8 tne of ."114 ••••
od help the etudent adJuat hwelf to the work 'that he 18 cal-labla of
40101 .ell? Inoldtntal17 we misht 8ax "Wb7 nota Fersonell Direc'or tor
student. and " Bureau of Hosearoh in the Oollege?" This qu.silon i.not
propo.ed with the inten"ion of oe.ating any retlfJctlon UpOB the Dflana ot
the various 80hoo1:, but marely suggesti'!}'e that WMY they are do1ne; aay be
reaearoh department and a personell dIrector.
Table lio. ~UV 81.l2!1U8.riz8S the data of nteaaure¥nts for e~H~h of the tour
~~1"OUp8 of 192; women grHduate. at the end ot each e01rlparable period.
Table X.XV. Ste.ndards ot M888ul'cmlent for 1~Hi!9 Woru.en (~radu6te8 at Comparable Periods.
a:roup and }:~~riod ___ ~i4Aa_\Ma_", _____ S. D.
1925 Freshmen Group
L:nd l~t. yr. 1.815 .54
End 2nd. yr. 1..85 .50
End 4th. yr. 1.97' .09
Entered U. S. A. C. prior to 19251
Znd 2nd. yr.
s· D ...
.1
l~nt.red U. S. A. C. wi th one year junior College Credlt
.End lat. yr. .118
End.4th. yr. .35
tntex+ed U. S. A. C. with two .years J"uulor College Credit.
End 2nd. yr. 2.B14 .4'7 .105
2'1
17.4
End 4th. yr. 2.214 .3? .083 16.'7 Note.: 1. There are only four women 1n this group.
2. 2.20 recorded mean is the arithmetic average. ~. 2.24 recorded ill6an 1s the ~,rl thmetl0 average.
,.

"-Wi'hout aeepttt.'1IICma ._ ...... 'u with ua, the "Pl ..... '. baTe
,.,tv graa •• tban t. lOll 11' •• bmea &;rOUp that pduaW 1alO.I'. '1'hta ia
true at each lnter"lal mea.urea. It. theretore_ follows; tbat tlMt "'Plac.mentl
aH .,.riQt- to thoBe who ateoontl1l\le. (thrmortalit,. grOUl'1).
The .. tudents tra Junior College. fihow n supertorlty O'f'el" those 60 haft
been 1. residence at the Utah State Agricultural Collep since 112&.
While only tour a1;udGnts entarect . ''Prior to 1925 their averas. gr&de.
indicate superiority. for aoademic work. ern",:- tnoee 'Wbo were In conttnuoU8
reeidence.
To show and Ct~phtH~iatl the oign1t1oance of tho rliffoi:"onCf.lS that have
been pOinted, out In ~ gen~rr\l "'8.)" in prevtotl~ part t:'f thi" chapter, table.
Table ;:xvl. Ct)tl~e.r:t.,on o-r Oreden of:' l1:ttferflnt Groups of 1929 Men (}rttduatslJ.
a'roup and 1;1'I1me
End 2nd .• yr.
End 4th. yr.
l.;nd 1st,. ~..,. . End 4th. yr.
Comparison of
End 211d. }T.
End 4th. y!:.
Men ot 'JOfr:lparable
1.99
1.953
2.01.5
tho •• "J11th
1.92'1
2.06
two
Mean ot .. DIN. 1925 ot
Grad'lI '.29!!t:)ane
1.705 .141
1.785
1.83" .316
1.'185 .~5
, .. J D !.J • .•
of Menns
.169
.159
.123
~rr.o. J'1-. 001. w1th 1;925
1.705 .2f!~ .169
1.'181 .2'5 .12'1
.eo
1.99
1.8'
~rcftll"Jnen
1.33.
2.16
:Prob. in
10,000
8133
9525
8'64
9693
0049
9846

78.
Aa pointed out 1naprey1oU8 pa~ph •• ery srC'tup ot replac.ent ••
aIIODS men. exceed tho •• -ho entered ae fre.hmen in 1925 in so)a.olt1rah1p. The
orittoal ratio in every caee except oae exceeds l.f end the probabl11t7 in
~v.ry cae., that 81ml1er results woulll be obtn1ned by addltional 8.p11D88.
18 aboTe 81 ohances in each lOOt whioh medea the results eeem 91gntt1oent.
To restate the general conclusions with regard to the men e:raduat •• of
the 1929 Class.
F!1ret: H.pl8.oe~'ttents to the 1925 olaps from all sources have better
8chol~:lr8hlp. t-eeords then d.o clerlbrrs of the s;arae clello who entered as Freshmen
in 1925 ~lld erah~ated in 1929.
aecond: Men students who enter the Utah State .t~~icu1tur81 College with
preTioua J'U.n1or College training. either one or two Yf'!'!\rs, are superior 1n
aon4em1c wOl·k to th'~lse who entered 88 'freshmen e.nd were graduated in four
ye&.rs.
Thlrt: Those ntltdentm who toke more than four ye6ra in which to f.U"flduate.
are superior to thop.e ... he complete their course in four years, andere alightl,.
interior to thoBe who hey. had Junior College worlC elsewhere.
Fourth: Tbe lower grades ~;1ven to students who htl .... done allot their
work at the Utah State Agricultural College can not 'On at*ributed to a more
rigid !'.Vlrklng system than among Junior Colleges, beoause theae same stud.ent.
tl·Om. the Junior Coll!!ge$ eO!lt1nue to obtain bl~)1er gr€l('1,8s"h11e at the Utah
Stete Agr1cultural Colle!!4' than thon8 1)110 were continuouely in attendance tor
the tour ye~:r8 19!!5 .... ~O.
The following '},table No. X.x.Vll, s\l.l'tJCi6rlzes and ocm~ rei.'! the duts tor the
l'ariOU8 groupe of 1029 wonlengraduates and C~1)Flrf:8 the siRnlf1cance ot the
difterences, in grr,des.

'fabl.e anl. Oca,(\p18on ot Grat.. of Dirt.ND.' Croup. of 1'. Women Graduat •• with Thoee Who EIl~.re4 ae Freahmen 1989.
Kean tit COIIp.
qoup
~ln ot Dirt. 1926 of
9nA 'I! ¥tanl
S. D. C. R. ot
Pi"~·
Prob. ill
10,000
CO!!]?ariaon ot tbo •• _'tr1na prev1oueto 1tsm1 with 1185 ,"ehmen. '29
End 2nd. yr.
End 4th. yr.
G nn2 ... a,:::v 1.85
Compr.r18on of tb,ose entering wi th one lear Jr. Col. w1 th 1925 Group
EDd 1st. yr. 1.08 1.815 .162 .154 8531
End 4th. yr. 2.02 1.974 .048 6704
Com:ter1son ot t~oae ~lth two :ra. Jr. Col. with 1925 Entrancee
End 2nd. yr. 2.214 1.850 .364 .140 2.6 9ge1
F..nd 4th. U· 2.214 1.974 .24 1110 2.18 geM
Note 1. There were only tour in thei. group 80 that statistical measures were not computed.
2. 2.20 represents the aritbmetic average. Z. 2.24 repreaente the ~r1thmetto average.
f. ••
There were too few students in the gro up who entered prey! oue to 1025 tor
statistical treatment; but. seemingly. they (Clj. re superior to the women who
The s1fn1t1olllnoe of the dlrrerer\Ce 88 indicate'" by the Cr1 tical Batio 18
sign1flce,nt in at If~t'8t three ot the tour compnr18ons'. The probab! 11 ty 18
lowest tn the final e rmpar180n of those wi tb one ye r Junior College ,,1 th the
1925 lt~eshmen group where It 18 68 chances in 100 tha.t the res;zl t8 would be
the S8me it other samnle. were taken.
Surmnr~rizing the genernl conclusIons relative to the Ucholersh1p of the . 1929 Women grndu8tes.

Fira't. Like the _at all l'epl.ao_at poup. haft batter pad •• thaa
do 'he member.of ,It. same 1 •• gradu.'iUS olaa., who entered 1ft 1.25 .a
Freshmen.
[Aoon!: Vl"ome1'l -1 th Junior 0011ege training surpass 111 Boholas\10
standing. 'hoe. who entered 1n 1925. and g!"nduated in four year ••
Third: Wblle the nUilber is too rew to ~18e. a great aeel of rellab111",.
on 'he r-eeults, thoSG who take bOre than tour years to graduate are superior
to those who cCfi\'pletc their OQur.e 1n tour years continuoua residence.
FOl'trth. Since the tinal. standing ot the junior College f6'TOUp haa app
ronohed neerer to that of the 1925 Freshmen ~roup it ~~y 1ndicete that the
marking 8ystem tor "omen 119 8 little 11)01"0 rigid e.~ the UtshState Agricultural
College than in the {nat1 tut1Clno where the WOtJ4en obte.ln.~ their previous
training. This did not seem true or the men, and may not be considered 8S
cO!1.clusl ve tor the women
COMF},RISON OF TIiE GRArrF:S OF ~,;Ji;N ANn OMEN
The grades of women are higher than thoae of men 1n e very group studied
at every interval. T.his tendency haa been prevalent in all comparieons made
or greldee throughout ·this study.
'l'he difference among those who entered'll 1 th one year ot Sunio:r College
ored1t 18 80 ~11, however, that 1t is probably lnsip;n1f1oant.

11.
Thr •• sroupa or replacements pr .... lou.1J oona1deret1 will be ocmparea w1 til
the 1925 Fre.hmen _he 8~adu8te4 1n 1925.
They are:
1. 'rho.. entering preT10ue to 1926 ae Froshmen.
I. Those with one yea.r of jUnior College previous to entranae.t the
Utah State Agricultural 9011ep.
3. Those with two year. ot J'un:or College work previous to entranCft at the
Utah State Agricultural College.
Separate comparisons w11l be made tor men and women.
Table No. XXVlll. Standards ot Measurements or age. :tor 1929 Graduates ftS Determined for September, 1925.
Oroup ot :Mean S. If: 1-' ~. D.ro. C:-Ot v.
Grad's f29 J. -
'25 Freshmen 19.2e 1.62 .259 a.4~)
.Previous to 21.54 2.915 .59 13.'1 '25
1 yr. Jr, Col. 21.79 3.'12 1.0'{4 1'1
p.yrs. Jr. Col. 2~.64 2.58 .905 15.8
Each of the three grours of rcplecements oX06ed in age tho8·e who entered
in 1925 as Freshmen end completed their college com-a" in the tour consecutive
years. While the older students or the 1925 }"reshmen Clas. h8:~e been e11m-
instea from college. thay hAve been replaced by atill older students.
The replacements ahow a greeter variability in their ages, also. than
any of the 1925 FreShman groups.

It woul4 be 1at .... '1na to know tile ... ot th .... tud.llt~ ., ,he tl_
'h.,.tl~.t en'.rect 0011_ ae Fre8~. but ~he Noorn of 80 MIl7 .en DO'
aw.l1abl.. ,bat tbe comparison 8an not be .''tempt_. !'h.e following Table No. Y..X3.X, c.~re. in more deta11 the •• Mplaoe-
MDt P"OUP. w1 th the loaD Freshmen who were '~fldWlt.4 In 1929.
Tuble No. XXlX. Compari8on ot Replaoement Groups w1th 1025 Freahmen Men Who Graduated in 1929. Baaia ot Age Se p'ember. 1925.
Replnc8!1ent Rionn ot Mean of Ditt. or .(, .:1·. D. of c. R. l'oob. of
EO~P; rOEl..,cepI8nt ',.5 r--reah. m.w. Ditt, ... 10.000
1;',.. ... '2ft Pl..54 19.25 2.29 .e3~ 3.6 9.'" 1 yr. 3r. Col. 21.'9 19.25 f,.M 1 .. 109 2.20 9,889
2 'TI!. Jr. Col. ~2.&' 11.85 3.39 1.0S ~.3 9,eOl5
Replacements, aceordlne to the £~"ouP. are trom =oro than two to more
than three yt7~r$ older than thee who car.fpletfld theIr worle Jilt 'the oollege 1n
.a.
tour conseout!ve yeare. It thoy began their college ~Rork at the 88lT1$ age, 1t
lndj cates that they have bec.tn out of scbool 'temporarily, two Qr three years.
From. the aTe.l1~ble reoords thie seems to oonform. w1th the taeta. The 81gn1f-
toanoe ot this ditterenoe 1a .... 18 ft17 hleh for men, 6.8 Indian ted by the
Crt tioa.l Ratio aD.d the f"robe.b1l:1 t1' in the nboye '1.'8'b1e •
Table l{o. }CO\, aumm8rlz&e the data for the tour groups of 1929 graduates
tor wo:nen.

Table No. xxx. 5taMa.r4. at lieuur.eat of 19. 1'_ Gra4uat... Ape u Detua1ned Sepiaaber leU.
GroU! Mes 8. D. St D •• C, ot V,
t25 Fre."11 18.158 1.18 .21a 6.215
Fr ..... f2U' 1O.,e 2.03 1.011 9.' 1 yr. :Tr. Col. 19.0'1 2.'12 .68 13.8
~8. Jr. Col. 21.25 4.16 1.04 10.5
The replacemente among .'·,men, a8 with men ... e older than tlloll.
who entered in 1085 end gr'·duated in 1029, and are ol~er than t hoa.
whom they replace or the nrloua mortall ty groups. The replacement
groups also show greater 'Yariatlon in ages than oither or the groups
ot 1925 Freshman.
The following 'able No. XXXl compares in more detail the re-
placement with the 1915 Fr~8hm.n group.
Table no.:x:IXl. Comp~lri8on of aepln,oemen:ts with ,the 1925 Freshmen Women "14110 Gro~uat.d in ],929. Basis of Age SeIJtcmber. 1925.
Ruplacomen1;' Mean of ",: ' Ditt. o! s. D. c. n. Prob. ,
".~sn
group. replace of t2t> mean. of in Fresh. d1.':i~t .. ;1,0,000
;'rev. '25 20.75 18.58 2.17 1.04 2.1 9B21
1 yr- Jr. Col. 19.6' 18.58 1.O~ .11 1.53 9569
2 yr. lr. 0<>1 21.25 la.58 ~.67 1.08 2.<-7 g934,
81.
The three groupe ot replacewAnt r&n~e from slightly more than one
year to over two and one-halt years more than those Who complete their
course in tour C01taecutive ;rears at the Utah state Agricultural College.

It their .... _" _.parable with 'bo •• 'ot'. 1181 he,. __ po.))
., the ,_ ~ ttt-at 'beI8Il their ooUeae work, whleh ..,. be ........
tt.2l they haft Mea out of .. hool __ pore!"!l" frca one to two u4 OM-
halt yeare.
The C1'1 'teal ratio aD4 probab111 " oolU1&ft8 in Tabl.· XXX1 ln410.'.
tbat ,tbe . 41tternoe 1& ... a 1. blBb17 atpitteqt.
Thecoaparl8011 o:t tMag •• ot .1milar group. of men and WClMft of
the 1029 gra4uatlnp' cla.1I 18 eum.7d\rlM4 1. the tollowiq Trlbl. No.XXXll.
Table XXXll. CCS!parleon ot SlmUar Group. or ~en aDd Women ot lilt ONduatlna Cl •••• Baa18 ot 1\.pe Sept_ber 1985.
Uean ~ !Jitt. 6. D. f'rob. Group of of of ot O. H. of
-p W9MD !!!1M. Alrt. 10,000
.. 2~ Itresm.n 19 •• 18.59 .67 .3:57 1.98 9'161
i)rev. '25 P~.&6 20.7& .'19 1.1'1 .696 '1501
1 yr, ~rr. Col. 21.79 1\}.6'1 1.12 1.1"1 1.G'7 068B
2 yr. 3r. Col. 22.'" El.25 1.8~ 1." .9&0 838' 44 t
III eaoh oampal"laon the age ot the men 18 fP'88"er than that of the
wom.en of the corresj)ondlng sroup. Allons the replaO«ftente the aotual
difterenoe In )'eft!'. ie greater thall bet .... n men ana women of the 1985
rr •• bmen group, but the eif-Ditleanoe of thla difterence 18 18a8. Th1e
1. probably broulh" e.bou~ by the I"ftter Tariab111 t,. 0'1 agee 8mont! the
CH.lPDR Xl
8U'!f¥J!I O! o_lIl9I,
Nearlr hio. a • .., cum •• ". enrolled. .a Freshmen 18 1016 .. waneD.
lOG Mil aDA 115 w<aen.
Total IIOrt€\11', tor tbe Y8", lOe-n .... ~ tor the DeD an4 ,.
1'01'" tM .......
'1'he a •• rap mortality w •• 52.S&;£" tor _ aDd 2''31~ tor the wacneD.
The greateat £loMe 11 ty oooure<l during the tiret two yenra equal.lua
1M tor the men and 10% tor the women. At the end ot thf) flrot year ~
ot the mean an4 35~ of the .omen d18conttnueA.
II.
The a •• rage length ot attendance tor ell who entered wa. 5.'1& quart.rs
tor the men .a aomperea with '.1S Q.uar~.r8 tor the WOM11.
The hlgh £41Ort,~11t1 periods tor the l'Uel\ were the ends or the 2nd •• 51'4 ••
5th. t and 6th. Q,'WlX"tere while the 3"_, and the ~)th. quertera were the
h1Sh perlQ4a tor tho W~D.
Distance tr-om col1s~. 18. 4ec1dedly, a tBctor ()f mortality trom 0011 ...
~8 well as a tnotor in d.eterm1nlrw: tn1 tid tlttendnnce.
A dietanee of 85 to 40 mile. bocomes 8 stgn1tioant factor in mortall,,_
Diatanoe, 88 e factor or mortAlIty, 18 o~erftt1Ye more with .~en than .1~h
meft. It also 11m! ta the int tial a'ttendenoe of "omen more t~n men.
Low {!o11~ge grndfUI sbow 010". relat10nehlp to mort~11ty flrom coll.~
and may be considered a tactol" 1n mortnllty.
While nome students .ith hi~h srades discontinue, it !s found thai
the fl"'erapd Rrfl4e -of those who dt.continue (the mortfl11tr group) •• ra.a'
moat 1nter"n11s, s1m'11t1cantly lower than the ;;rOU1' who •• re grfu'hlf!ted ill 1920.

II.,
The cra4 .. of .. ob. mortality srOaP ... lower, elec, thaD thoa. who
coattJlued be7on4 the In"erTal ... suret. but who later 4ropped out ot 80hoo1.
Thi8 lncl1cate., that t11,otI. with tho lower grades are among the t.1ftt to
4iaaont1nue and that it 18 an operatt". factor tor mortality throqhout the
0011e8. period.
The moat significant: period at whlch low grade. operate aa a tac"or of
mortali ty i8 at the end of the 2nd. q~ar1ier tor men. Ii continueo to be
al&nltlcant at each suoceeding !.nterTo.l.
For 1I\lWan "he end of the. first. seoond and sixth quarters aG(UllS the
moet s1~~lt1cant periods.
A grOi1P ()t students who droJ)'ped out of school, tor brief intervale. but
had returned ahowed hl6hei;- grades than thceeffho corrc!nlted eon..",eoutlv.ly
tlu'ough the four 1"lll-8 to grnduatlon.
Age at the time Qt entranoe to col1e~e, 8S Frenhmen., 10 another positive
factor 1 n mortal:1. ty from. college.
Wi th both tll8tt and women, et',chmort[~ll ty group during the first two
year., averaged older than those who re.mnino(l beyond the interval !f~e88uredt
and .ere signltloe.ntly older than theee who were graduated in 1920 at the
aema lntel"'Ysls. Dur1ne, the third and fourth years the stgn1fioanoe c't Elge
practioally dieapI)earS 6S (\ factor in mortal! ty.
~j~:::ny ot the youngest etudent8 dro:pped out t temnorarl1y t for a per10d
01." from one to three quart-ers, but were in a.ttendance in 1'l2S .. 29, which
indicated, that they woult1 probably rracuete the follow1nt~ year t tllua take
ins tive years instead of the usual four for gradUQtion.
;ieplaC6mente to the If reshtt.wn class reduced the total IllO'rtall t'Y' tram

, .. ,. eo.,. tor mea u4 t~ en to Sf._ tor 1f0Mll.
Abou' halt of 'the _n !'eplaeement. to tbe graduatllltt 018.88 of 1910
were tltu4ent. who b.sa entered. previously to 19~. The othfn"'8 ."eN about
equally divided bet .. e. on. ,.ear and two ,.eer's PreYl0U8 lunlor Coll.~
tralnins. elsewhere.
Nearl,. all of the wCRlen replacements wel~ 1un1or Colle8&tra1n$d.
only 4 out or 43 entored the Utah Stn'. Agrloulturel College vrlQr to
1925.
The ntmlber ot lfOnien to enter if! ~h 1un101'' ('!ollege trtd.n1ne was 'Praot
ioally oque.l. to tho number of men.
H.en 'tend to iirop out. tem-porflr11!', ruuCll more trcCl.uently than wOlnfln.
and by returninE rod_l~eC' tl~ teaM mortality of men who !'ecelve all of
their i;-_rf:inlng at the Utrih Stato /1..gr1cttl tural. ColleEte to lecis the.n that
of Wclt1$n.
~;ou. Ell-fl about four times 6.8 likely to return aftfl!"' wi thdl"awal as
w()tl&n.
\n~11e fewer women onter the Utah state Agr1eu.l"!ru-r1\l Gallege thaD men.
'tho re?lact'tnentn of men end womon are about O'1ual in nunber.
Th. relst1 Tely replacements or women 8l:"e greater on 8 percll'nttlgtt ber.1s.
Replacements tram distant localities are re18t1~ely greater, than fran
near loca15,tl~fi, tor both men ana women. This 1A :markedly true tor thofle
.1 th one ttnd two Y01.\rf' Junior C!ollege tratntnf olptm'bere.
ThE~ teotor of dia'bance dOi'Hl not a~~001 opeJ"'~tlvt,j f,&-a1::ltt ~'()men w110
enter with junior College ~raln1ng.
j,~he sohollfPf,h1p reCOI-a tlS I,'ioauurod by {trade ro1nts: s.re sign1f1cantl,.

ea.

APPDDII NO.1
!be tollowing "'hematloal ForDlllae were u •• ' 1. the Statlatloal
Caloulation. for 'hi. the.te.
NO.1
No.2
No.3
No. 4,
Measure
Standard DeYiatlon ot th. !~1ttt\ n
Coefficient of V!lriRtton
S. D.: rAP.; ... (tj!)x 1
c. ot V _: 5., D,L)( 100 JA
w.
No. 5
No.6
Standard Deviation ot the Dlfterence
Orit1.oel Ratto
a.n, D1rt.:~(a.n'm}2- (S.D.m)2
C.R. - 'M .. - M., _ TJ. It.
S.D. 'Dirt.
No. 7 lrobebl11t:r
As the term. probability 1s here used, it repre8ents the :reliability
of the d1fterence between the two groups oom:pared and has been determined.
8tatirrt1ce" L. L. Thurstone t on the bast. of the number ot e~llUU!l In 10,000
~IDIX NO. !A
BIGLlOORAPHY
ttstudent MortalitY''' A. M. 1ordan. Sehool andSoe1ety; Vol. 22,
"Students Who Drop out ot Oollege" Geo .. R. Moon University-ot
Chicago. School and Sooiety; Vol. 27, p. 576-78. <
"The Need for Publio J'Qior College in Utah" Even B. Murray,
HProbleme in El~inat1on trocl College" Sohool and Society,
p. 550-52. :Jotober 19, 1929.
J oh!l Pierce Mi tcholl and WRl te:- Crosby Elle. Bulletin of the Amerioan
A.saoointion of College Registrars, Ne?] ik;riee, Vol. 111 No.4 •. April
1928. Johns .... Hopkins Press.
'fPrEH~iot"tng Ul tir!ltlte Ji'ail'.1.re of. Gollege <3tudon.ts on their first
Quarter Heoords" E. 1'1'. Pollhofr. School and Jociety, Vol. 33. p. 203-4.
February 7, 1£'31.
1928.
"Retention and Lis:missal" Dchool end Sooiety, October 23, 1926.
The Ji'und,.1J.llentals of Sta.tietics" L. t. 'rh'tll'st~)nEh 1925. Published
by the !:c!~illen Company t }Jew York.