MiFID/MiFIR briefing (05/03/2015) - Profile Dynamism and Profile Drift (by Prof. Hubner)
Upload
mick-hubnerCategory
view
176download
0
Mick Hubner, FACHE
Client Development Indiana 816-885-4576 [email protected]
[email protected] 13, 2016
The Shift from Inpatient to Alternate Care Settings
Center for the Business of Life Sciences: Kelley School of Business: Indiana University

© Cerner Corporation. All rights reserved. This document contains Cerner confidential and/or proprietary information belonging to Cerner Corporation and/or its related affiliates which may not be reproduced or transmitted in any form or by any means without the express written consent of Cerner.
21299466134_CernerOverviewStandard_v15 Updated: 03/30/16
Client Needs: Navigating the new normal
• Transparency
• Standardization
• Aggregation/Consolidation
• Integration
• Coordinated programmatic care-
delivering right care in the right location
• Transition from fee-for-service volume to
value-based reimbursement
© Cerner Corporation. All rights reserved. This document contains Cerner confidential and/or proprietary information belonging to Cerner Corporation and/or its related affiliates which may not be reproduced or transmitted in any form or by any means without the express written consent of Cerner.
31299466134_CernerOverviewStandard_v15 Updated: 03/30/16
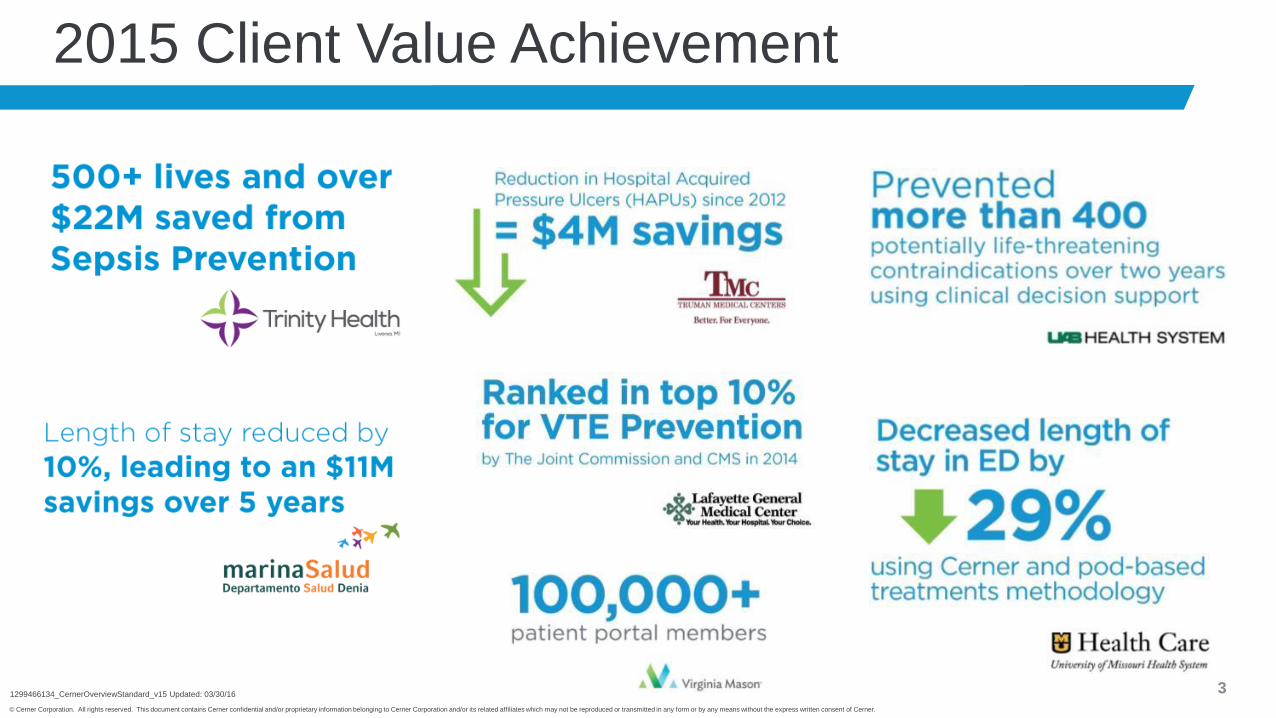
2015 Client Value Achievement

© Cerner Corporation. All rights reserved. All Cerner trademarks and logos are owned or licensed by Cerner Corporation and/or its affiliates. All other brand or product names are trademarks or registered marks of their respective owners.
4
Cerner – at the Intersection of Health Care and IT
Founded in Kansas City in 1979
• Largest standalone health care IT company in world
• 22,000 associates worldwide
• 18,000 client facilities in over 30 countries
• 18 of 30 largest health systems have Cerner footprint
• Annual R&D investment ~$700M
• $4.9B cumulative R&D
• 5,000+ person IP org
• 2,000 clinicians
• 350 patents
• $4.4B 2015 revenue
• 14% 10-year CAGR (mostly organic growth)
22% 10-year Operating Earnings CAGR* Operating earnings reflects adjustments compared to results reported on a U.S. Generally Accepted Accounting
Principles (GAAP) basis in our 2015 annual report on Form 10-K. Non-GAAP results should not be substituted as
a measure of our performance but instead should be used along with GAAP results as a supplemental measure
of financial performance. Please see the Appendix for a reconciliation of these items to GAAP results.

© Cerner Corporation. All rights reserved. This document contains Cerner confidential and/or proprietary information belonging to Cerner Corporation and/or its related affiliates which may not be reproduced or transmitted in any form or by any means without the express written consent of Cerner.
51299466134_CernerOverviewStandard_v15 Updated: 03/30/16
Cerner today

© Cerner Corporation. All rights reserved. This document contains Cerner confidential and/or proprietary information belonging to Cerner Corporation and/or its related affiliates which may not be reproduced or transmitted in any form or by any means without the express written consent of Cerner.
61299466134_CernerOverviewStandard_v15 Updated: 03/30/16
Fortunate to work with leaders

© Cerner Corporation. All rights reserved. All Cerner trademarks and logos are owned or licensed by Cerner Corporation and/or its affiliates. All other brand or product names are trademarks or registered marks of their respective owners.
7
Total acquisitions*
Same EHR vendor
Potential wins
Potential losses**
Potential net wins
Acq
uire
d H
osp
ita
ls
*Total acquisitions – total acquisitions by clients
**Potential losses – total acquisitions by competitors clients
Source: HIMSS Analytics 2013-2015
Cerner clients accounted for nearly 50% of buying activity
Historical Hospital M&A Data2013-2015 Top Vendor Activity

© Cerner Corporation. All rights reserved. This document contains Cerner confidential and/or proprietary information belonging to Cerner Corporation and/or its related affiliates which may not be reproduced or transmitted in any form or by any means without the express written consent of Cerner.
81299466134_CernerOverviewStandard_v15 Updated: 03/30/16
Investing in innovation

© Cerner Corporation. All rights reserved. This document contains Cerner confidential and/or proprietary information belonging to Cerner Corporation and/or its related affiliates which may not be reproduced or transmitted in any form or by any means without the express written consent of Cerner.
91299466134_CernerOverviewStandard_v15 Updated: 03/30/16
Investing in innovation
Focused on the Now and Next
• 4,300 associates engaged in R&D
• Rapid development in mobility, open systems and interoperability
• Revenue management is 20 percent of Cerner’s total R&D
• Regulatory about 11 percent of R&D FTEs

© Cerner Corporation. All rights reserved. This document contains Cerner confidential and/or proprietary information belonging to Cerner Corporation and/or its related affiliates which may not be reproduced or transmitted in any form or by any means without the express written consent of Cerner.
101299466134_CernerOverviewStandard_v15 Updated: 03/30/16
Open Developer Site: http://code.cerner.com
“Cerner has taken a
significant leadership role in
the SMART on FHIR effort …
Cerner’s efforts will educate
the rest of the industry.”
John Halamka, MD, CIO
Beth Israel Deaconess Medical Center
Health Data Management, 2/12/2016

© Cerner Corporation. All rights reserved. This document contains Cerner confidential and/or proprietary information belonging to Cerner Corporation and/or its related affiliates which may not be reproduced or transmitted in any form or by any means without the express written consent of Cerner.
111299466134_CernerOverviewStandard_v15 Updated: 03/30/16
Impactful innovations
© Cerner Corporation. All rights reserved. This document contains Cerner confidential and/or proprietary information belonging to Cerner Corporation and/or its related affiliates which may not be reproduced or transmitted in any form or by any means without the express written consent of Cerner.
121299466134_CernerOverviewStandard_v15 Updated: 03/30/16
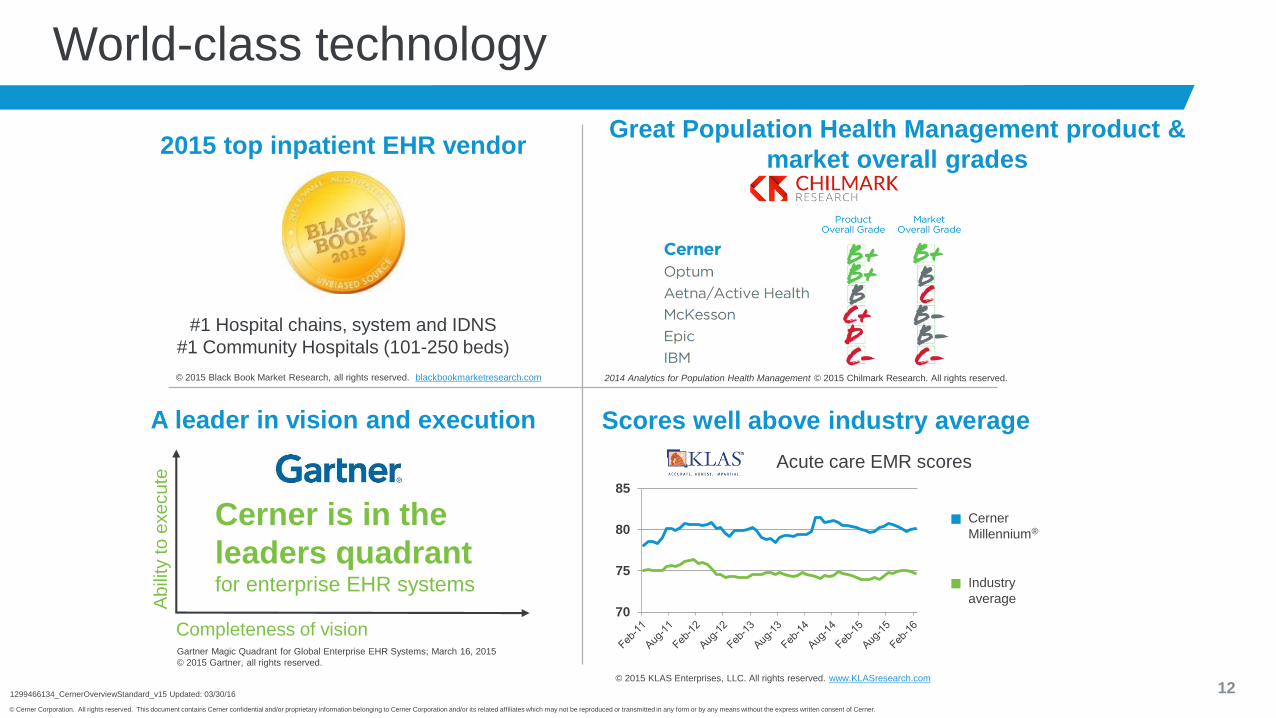
World-class technology
2015 top inpatient EHR vendorGreat Population Health Management product &
market overall grades
#1 Hospital chains, system and IDNS
#1 Community Hospitals (101-250 beds)
Completeness of vision
Ab
ility
to
exe
cu
te
Gartner Magic Quadrant for Global Enterprise EHR Systems; March 16, 2015
© 2015 Gartner, all rights reserved.
A leader in vision and execution
Cerner is in the
leaders quadrant for enterprise EHR systems
© 2015 Black Book Market Research, all rights reserved. blackbookmarketresearch.com 2014 Analytics for Population Health Management © 2015 Chilmark Research. All rights reserved.
Scores well above industry average
Acute care EMR scores
Industry
average
Cerner
Millennium®
© 2015 KLAS Enterprises, LLC. All rights reserved. www.KLASresearch.com
70
75
80
85

Why the Move to Alternate Care Settings?

© Cerner Corporation. All rights reserved. This document contains Cerner confidential and/or proprietary information belonging to Cerner Corporation and/or its related affiliates which may not be reproduced or transmitted in any form or by any means without the express written consent of Cerner.
141299466134_CernerOverviewStandard_v15 Updated: 03/30/16
“Our” vision aligns with the Triple Aim
Betterpopulation
health
Betterindividual
care
Lowercosts
We help our client perform by
executing the vision.

Month 12Month 6
Month 12Month 6
Fragmented and reactive FFS care delivery approach
$45,000+ spent in health care costs
Month
1
67-year-old patient with a history of heart failure, poor understanding
of disease, poor compliance with diet and medications.
Readmission(6 days)
Heart failureAdmission
Nursing homeQuality of life decreases
High risk –
taking anticoagulants
PCP Visit ED Visit Cardiology
New onset atrial fibrillation
Overall decompensation of
Health
Heart failureAdmission (11 days)
$24,000+ spent in health care costs
$7,000+ spent in health care costs
Good
health
Poor
health
Cri
tical
care
ED
Vis
it
General medical care
(3 days)Cardiology
Consult
Day 1 Day 5 Day 11
Longitudinal, proactive and personalized care delivery approach
• Paper Clipboards
• Siloed Record
• Prolonged ED Visit
• Heart Failure Order Set
• Redundant Assessments
• Nursing Documentations
• More …
TYPICAL CARE
EVIDENCE DRIVENLONGITUDINAL CARE
Episode of Care
• Care Process Models
• Adaptive Order Sets
• Smart Referrals
• Readmission Risk
Prediction
• Transition of Care
• More …
Home
Health
Cardiology
Remote Monitoring
Critical care(4 days)
Cardiology Consult
General medical care
(6 days)ED Visit
Day 1 Day 11
WITHOUT EVIDENCE DRIVEN CARE
WITH EVIDENCE DRIVEN, COORDINATED CARE
Longitudinal Personalized Care
• HealtheIntent Programs
• Longitudinal Record
• Longitudinal Lifetime Plan
• Proactive physician visits
• Continuous Surveillance
• Admission Risk Prediction
• Medication Adherence
• Shared Decision Making
• More …
$5,000+ spent in health care costs67-year old patient with personalized plan for health that includes education,
nutrition, maintenance meds, quarterly PCP visits and proactive surveillance.
Month
1
PCP Visit PCP Visit PCP Visit PCP Visit
Continuous surveillance | Care coordination | Shared decision-making
2D EchoCardiology Cardiology
Daily weight and blood pressure monitoring
Placed on a heart failure program – Surveillance and proactive
management© Cerner Corporation. All rights reserved. This document contains Cerner confidential and/or proprietary information belonging to Cerner Corporation and/or its related affiliates which may not be reproduced or transmitted in any form or by any means without the express written consent of Cerner.

Health Care Cost Growth Eats Both Middle Class Take Home Pay Growth and Corporate Productivity
Five years later
Real wage growth impacting electoral politics
The productive pay for the those who cannot pay
Medical bill bankruptcies

0
5
10
15
20
25
30
35
High Performance Integrated Provider/Insurer Payer Industry Average
Acute Spend as Percent of Medical Loss Ratio
All Commercial Plans
Source: Interview CEO Integrated Provider/Insurer

Leapfrog Hospital Grade Distribution 4/25/201633,459 Avoidable Deaths Saved If All Hospitals Performed at Grade A
BRNDEXP 2.0 0714 © 2016 Cerner Corporation. All rights reserved. This document contains Cerner confidential and/or proprietary information belonging to Cerner Corporation and/or its related affiliates which may not be reproduced or transmitted in any form or by any means without the express written consent of Cerner.
18
0
200
400
600
800
1000
1200
A B C D F
Findings point to a 9% higher risk of avoidable death in B hospitals, 35% higher in C hospitals, and 50% higher in D and F hospitals, than in A hospitals.

The Complexity of Healthcare Reform • Alternative payment modelsdo not act in isolation andmust be flexible in careDelivery
• CMS is offering Medicareproviders greater incentivesfor alignment
• The interaction betweenAPMs may createunintended consequences

Economics of Health Care Reform

A Deeper Cerner Overview
More than an Electronic Health Record and Revenue Cycle Management Supplier
The Cerner Healthe Intent Population Health Platform
BRNDEXP 2.0 0714 © 2014 Cerner Corporation. All rights reserved.
This document contains Cerner confidential and/or proprietary information belonging to Cerner Corporation and/or its related affiliates which may not be reproduced or transmitted in any form or by any means without the express written consent of Cerner.
21

”“
22This document contains Cerner confidential and/or proprietary information belonging to Cerner Corporation and/or its related affiliates which may not be reproduced or transmitted in any form or by any means without the express written consent of Cerner
1299466134_CernerOverviewStandard_v15 Updated:03/30/16
While EHRs have successfully digitized some health care
information, convenient and personalized care will only be
achieved through integration of data from sources within
and outside the EHR platforms – it is about time for the
health care industry to begin taking advantage of cloud-
based, big-data analytics, like HealtheIntentSM, to manage
patients.
Dr. Alistair Erskine
Chief Clinical Informatics Officer

Cerner’s approach to population health management
Person EHR Device HIE Payer Pharmacy Post-acute Open data
Contract
management
Patient record NetworkingScorecards
Risk
modeling
Care
management
Medication
managementRegistry
HealtheIntent
EDW and
analytics

24© Cerner Corporation. All rights reserved. This document contains Cerner confidential and/or proprietary information belonging to Cerner Corporation and/or its related affiliates which may not be reproduced or transmitted in any form or by any means without the express written consent of Cerner.
ACO Growth At-Risk Contracts Growth Drivers
2010
Today
2020
Hospitals Percent of Revenue
Risk-Based
6%
16%
40%
5,100,000
23,200,000
105,000,000
2011 2015 2020
Growth in ACO Covered LivesBelief at-risk models are a better way
of achieving triple aim
Federal/State incentives & penalties
Growth in Commercial Plans – Aetna
estimates 70% of contracts value-
based by 2020
Success of initiatives tied to value-
based care
Global phenomenon – triple aim will
not be limited to US healthcare marketSource: Leavitt Partners, Projected Growth of Accountable Care Organizations, December
2015
Source: Leerink Partners MEDACorp Survey, June 2015
Growing Need for Population Health

© Cerner Corporation. All rights reserved. This document contains Cerner confidential and/or proprietary information belonging to Cerner Corporation and/or its related affiliates which may not be reproduced or transmitted in any form or by any means without the express written consent of Cerner.
25
Cerner Acute Transitions of Care
Model Development
• Model suggests 30% of the population could be sent to a more optimal venue and achieve better outcomes
• Venue shift and readmission reduction accounts for ~$200 million in savings from total cost of care
Analysis
• CMS analysis estimated that by better management of post-acute episodes and sending more beneficiaries to home health, Medicare could save $34 billion to $100 billion over 10 years
Discharge
locations
Actual
(historic)
Model
recommends
higher level
Model
recommends
lower level
Model
Home 67.1%
11% 19%
66.4%
Home Health 13.2% 15.5%
SNF 14.7% 14.2%
Rehab 2.4% 1.6%
LTAC 2.6% 2.3%
Analyzed 535 variables for inclusion
• Age
• Falls history
• Functional status score
• Hip, knee, ankle, joint
replacement/revision
• Insurance
• LOS
• Medical service category
• No social support
• Patient lives alone
• Psychotic disorder
• Admitting facility
• Service needed at
discharge
• Sepsis
• Spine surgery
• Stroke
• TPN
• Trauma

© Cerner Corporation. All rights reserved. This document contains Cerner confidential and/or proprietary information belonging to Cerner Corporation and/or its related affiliates which may not be reproduced or transmitted in any form or by any means without the express written consent of Cerner.
26
Analysis
ACC’s All Cause Readmission model outperforms, and continues to improve, other peer reviewed predictions:
Cerner All Cause Readmission
Source C-statistic
Early collaboration model 0.77
Average models reviewed in JAMA 0.66
Yale NHHS/CORE for CMS 0.66
Disclaimer: Not all clients will realize similar benefits due to scope of
solutions and capabilities, business implementation models or
organizational attributes.
What Advocate and Cerner are
doing together around
readmissions is about 15-20%
better than anything that exists in
the industry today.Dr. Rishi Sikka
Senior Vice President of Clinical
Transformation
Advocate Health Care
Monitor
Readmission risk is
monitored and updated
every 2hrs to better align
care
21%
Reduced high risk
readmissions by 21% for
heart failure patients
Manage
Patients that receive high
risk education have a 20%
lower readmission rate

© Cerner Corporation. All rights reserved. This document contains Cerner confidential and/or proprietary information belonging to Cerner Corporation and/or its related affiliates which may not be reproduced or transmitted in any form or by any means without the express written consent of Cerner.
271299466134_CernerOverviewStandard_v15 Updated: 03/30/16
Client success with population health
21%Reduced high-risk
readmissions by 21% for
heart failure patients
ManagePatients that receive high-risk
education have a 20% lower
readmission rate
MonitorReadmission risk is monitored and updated
every two hours to better align care

© Cerner Corporation. All rights reserved. This document contains Cerner confidential and/or proprietary information belonging to Cerner Corporation and/or its related affiliates which may not be reproduced or transmitted in any form or by any means without the express written consent of Cerner.
28
39unique data
sources
Drives business results
11 acute care hospitals
• 2 children’s hospitals
• 5 level 1 trauma centers
• 4 teaching hospitals
• 4 magnet designations
• More than 250 sites of care
14,670+unique users
5,000+providers
Second-Largest clinically
integrated ACO in the nation
700,000+at-risk covered
lives
Enabled
capabilities
• Registries
• Scorecards
• Analytics
• Outreach
• Pharmacy management
• Announcements
• Prediction models ”“
…real time performance…resulted in more
proactive care and performance targets being
achieved six to ten weeks earlier in the year.
Physicians received needed interventions
sooner….and…were able to reach out…to
develop plans of care …or link patients to
care management programs….*
*Advocate Physician Partners 2015 Value Report
www.advocatehealth.com/valuereport
35/39Population-Specific
Benchmarks Exceeded
25/39Measures Exceeded
Savingsvs. Plan Targets:
Blue Cross PPO: 1.4%
Full-Risk HMO: 2.7%
MSSP: 0.2%
$100M+Bonuses Paid to Providers
Outcomes48% Higher Asthma Control Rate vs. National Average
Expanded Early Diabetic Intervention by > 50%
136/155Organizational KPI Targets ExceededClinical | Efficiency | Care Coordination | HCAHPS

Health care is too importantto stay the same.TM