Cereal Price Stabilization in East Africa:Implications of International Experience
21
Cereal Price Stabilization in East Africa: Implications of International Experience Paul A. Dorosh, Bart Minten and David Stifel IFPRI Economics of Malawi (ECAMA) 2015 Research Symposium Lilongwe, Malawi June 4 and 5, 2015
-
Upload
ifprimassp -
Category
Presentations & Public Speaking
-
view
17 -
download
0
Transcript of Cereal Price Stabilization in East Africa:Implications of International Experience

Cereal Price Stabilization in East Africa:
Implications of International Experience
Paul A. Dorosh, Bart Minten and David Stifel
IFPRI
Economics of Malawi (ECAMA) 2015 Research Symposium
Lilongwe, Malawi
June 4 and 5, 2015

Page 2
Cereal Price Stabilization in East Africa• East Africa: Evolution of Maize and Wheat Prices
• Price Stabilization: Competing Approaches
• Utilizing Trade to Stabilize Prices• Bangladesh 1998• Madagascar Rice Crisis 2004
• Principles of a Price Stabilization Strategy• Utilize international trade, not just stocks• Promote private sector trade• Ensure transparency and predictability of policies

Page 3
Domestic cereal prices in East Africa: 2006-2013
0
200
400
600
800
1000
1200U
S$(2
014)
/ton
Ethiopia Wheat Ethiopia Maize Kenya Maize Uganda Maize

Page 5
Cereal Price Variability in East Africa• Domestic prices of maize in Ethiopia and Kenya and
of wheat in Ethiopia were more stable than border prices (international prices converted to local currency units using nominal exchange rates).
• This is largely due to the large spike in international prices in 2007 and 2008.
• Domestic prices in real local currency units were most stable for wheat in Ethiopia (c.v. = 0.139) which at times actively used imports to stabilize markets, and least stable in Uganda, which had relatively connection with major international markets.

Page 6
Cereal prices in East Africa: Average 2000-2012
Pworld($) Ex rate Pborder Pdom Pdom($) Pborder/CPI Pdom/CPI$/ton lcu/$ lcu/kg lcu/kg $/ton Lcu (2000)/kg Lcu (2000)/kg
Ethiopia wheat Mean 291.14 15.89 5.21 6.25 395.03 1.42 1.75 CV 0.173 0.165 0.298 0.195 0.127 0.182 0.139Ethiopia maize Mean 240.01 15.89 4.34 4.13 259.82 1.17 1.13 CV 0.262 0.165 0.354 0.285 0.154 0.226 0.174Kenya maize Mean 240.01 83.21 22.69 29.69 371.20 25.28 34.92 CV 0.262 0.063 0.275 0.237 0.178 0.152 0.176Uganda maize Mean 240.01 2364.45 650.85 639.26 268.35 322.35 283.90 CV 0.262 0.106 0.312 0.334 0.297 0.165 0.291
Domestic prices of maize in Ethiopia and Kenya and of wheat in Ethiopia were more stable than border prices.Domestic prices in real local currency units were most stable for wheat in Ethiopia (c.v. = 0.139) which at times actively used imports to help stabilize prices.

Page 9
Price Stabilization: Competing Approaches
Model 1 Model 2 Model 3
Rely on markets with Primary reliance on Role for markets withlimited role of state markets with rules-based discretionary state
role of state intervention
• Role of state limited to • Role for rules-based • Based on premise that the State operations private sector cannot ensure
• Public goods investment adequate food supplies in• Buffer stock release response to production
• Regulatory framework in response to defend shortfalls stated ceiling price
• Strengthening of institutions • Justification for and property rights • Marketing board unconstrained role for
purchases at stated state intervention in• Policies supportive of floor price announced markets to correct for private sector entry and in advance market failures competition
• Transparent rules for Initiating state imports
• Public goods invest- ments
Source: Jayne and Tschirley (2009).

Government Cereal Market Interventions in Bangladesh, India and Pakistan
(averages for 2000-07)
Pakistan India India Bangladesh Bangladesh Wheat Wheat Rice Wheat Rice Production (mn tons) 20.33 70.51 87.23 1.21 25.68 Procurement (mn tons) 3.89 16.09 22.52 0.11 0.88 Share of production 19.2% 23.0% 25.7% 6.7% 3.4% Stocks (mn tons) 1.16 17.06 16.40 0.23 0.54 Stocks (kg/capita) 7.6 16.2 15.4 1.7 3.8 Distribution channels Subsidized Subsidized Subsidized Targeted Targeted sales to sales through sales through Distrib Distrib; flour mills PDS PDS (FFW, etc.) Sales
Source: Dorosh (2009).
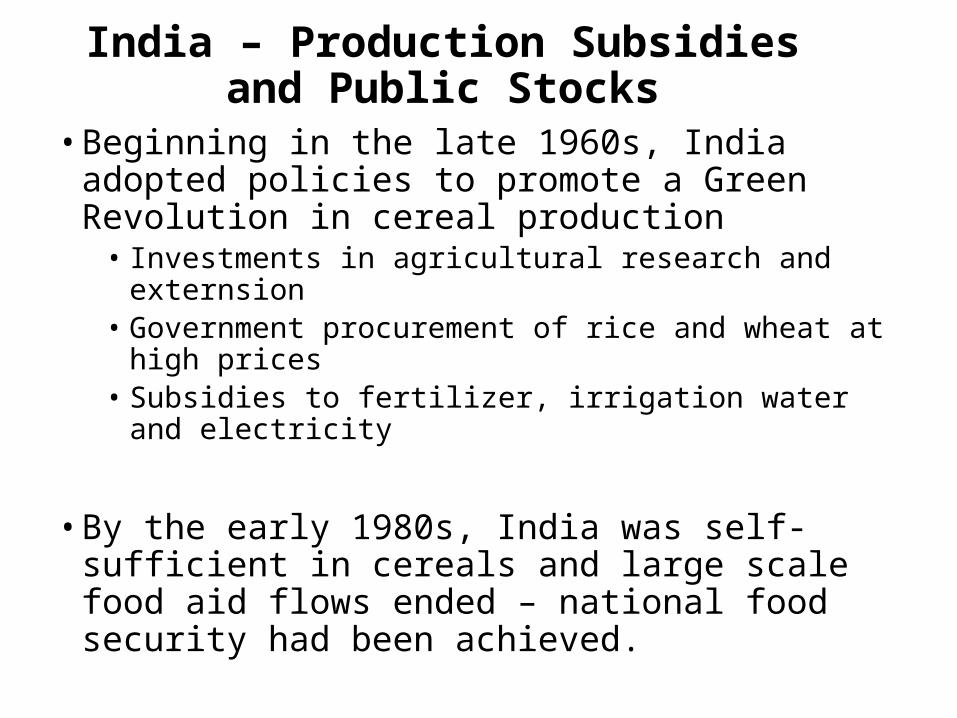
India – Production Subsidies and Public Stocks
• Beginning in the late 1960s, India adopted policies to promote a Green Revolution in cereal production
• Investments in agricultural research and externsion• Government procurement of rice and wheat at high prices• Subsidies to fertilizer, irrigation water and electricity
• By the early 1980s, India was self-sufficient in cereals and large scale food aid flows ended – national food security had been achieved.
• Political pressure to increase support prices led to a sharp increase in the volume of procurement in the early 1990s and in public stocks.
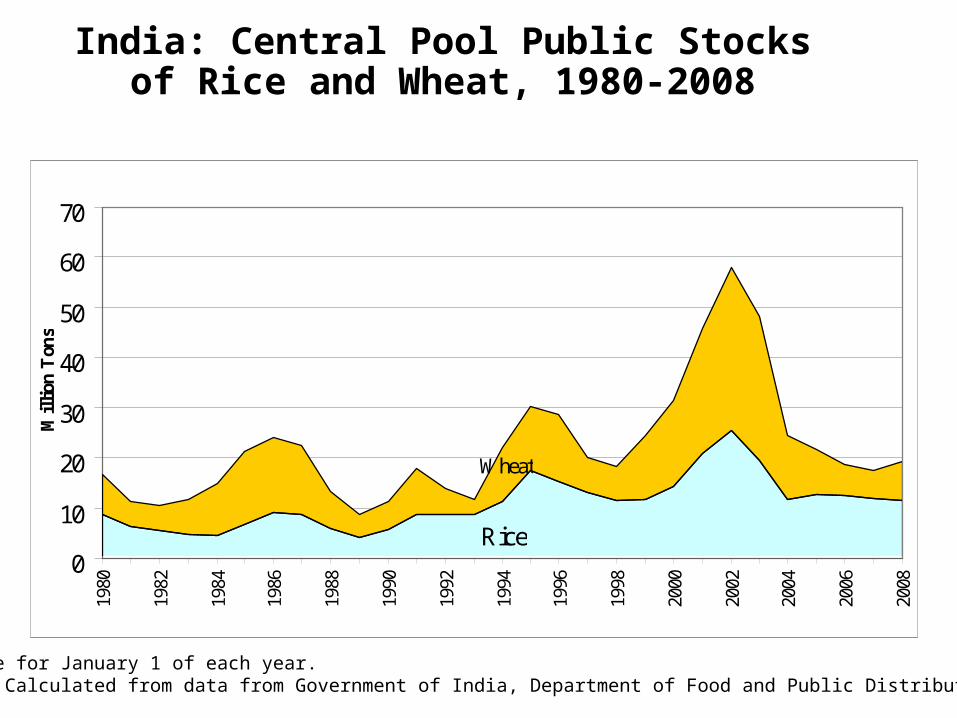
India: Central Pool Public Stocks of Rice and Wheat, 1980-2008
Rice
Wheat
0
10
20
30
40
50
60
70
1980
1982
1984
1986
1988
1990
1992
1994
1996
1998
2000
2002
2004
2006
2008
Mil
lion
Ton
s
Data are for January 1 of each year. Source: Calculated from data from Government of India, Department of Food and Public Distribution.

Managing the 1998 flood in Bangladesh
• Reforms in the early 1990s allowed private trade in grains
• Private imports responded to domestic supply and demand conditions as reflected in the domestic price
• In 1994-95, the private sector imported rice from India, stabilizing prices at import parity levels
• In 1996-97, domestic prices were below import parity levels and private sector imports were essentially zero
• Following a massive flood in mid-1998, 2.4 million tons of private sector imports stabilized domestic prices at import parity levels
• At the same time, the government scaled up public safety net programs (Vulnerable Group Feeding and Food for Work)

Rice Prices and Quantity of Private Rice Imports in Bangladesh, 1993-2000
0.00
2.00
4.00
6.00
8.00
10.00
12.00
14.00
16.00
18.00Ju
l-93
Jan-
94
Jul-
94
Jan-
95
Jul-
95
Jan-
96
Jul-
96
Jan-
97
Jul-
97
Jan-
98
Jul-
98
Jan-
99
Jul-
99
Jan-
00
Pri
ce (
Tak
a/k
g)
0
50
100
150
200
250
300
350
400
Imp
orts
('0
00 M
T)
Private Sector Imports Import Parity(ex: Bongaon) Dhaka Wholesale Price Import Parity(ex: Delhi)
Source : Dorosh (2001).
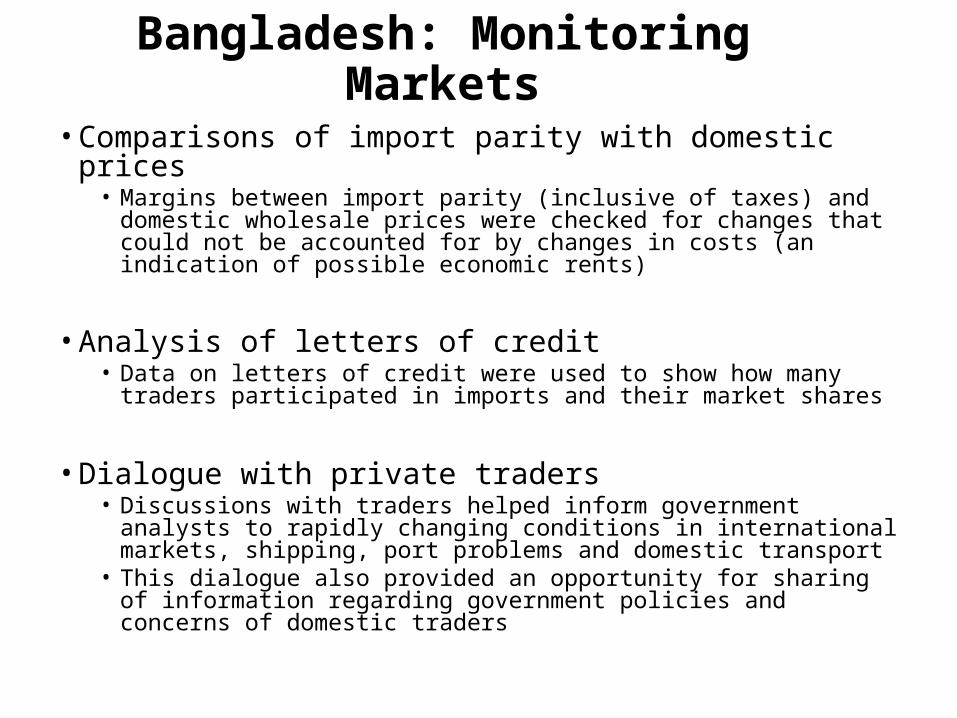
Bangladesh: Monitoring Markets
• Comparisons of import parity with domestic prices • Margins between import parity (inclusive of taxes) and domestic
wholesale prices were checked for changes that could not be accounted for by changes in costs (an indication of possible economic rents)
• Analysis of letters of credit• Data on letters of credit were used to show how many traders
participated in imports and their market shares
• Dialogue with private traders• Discussions with traders helped inform government analysts to rapidly
changing conditions in international markets, shipping, port problems and domestic transport
• This dialogue also provided an opportunity for sharing of information regarding government policies and concerns of domestic traders
Madagascar’s Rice Policy
• Madagascar liberalized rice markets in the mid-1980s
• Over the period 1995–2003 private sector imports averaged about 5% of total supply each year, stabilizing rice prices in the months before the major rice harvest.
• Nonetheless, over this period, the country retained high import tariffs and taxes to protect domestic producers

Madagascar: Rice Prices and Imports, 1995-2004
0
1000
2000
3000
4000
5000
6000
Jun-
95
Dec-9
5
Jun-
96
Dec-9
6
Jun-
97
Dec-9
7
Jun-
98
Dec-9
8
Jun-
99
Dec-9
9
Jun-
00
Dec-0
0
Jun-
01
Dec-0
1
Jun-
02
Dec-0
2
Jun-
03
Dec-0
3
Jun-
04
Dec-0
4
Fm
g /
kg
0
5
10
15
20
25
30
35
40
Th
ou
san
d M
etri
c T
on
s
Imports in '000 tons (3 month moving average) Retail Price Local Rice
Retail Price Imported Rice CIF Price (3 month moving average)
Source: Minten and Dorosh (2006).
Madagascar 2004: Mixed Signals Contribute to a Crisis
• A production shortfall in early 2004 coincided with a rise in world prices and a sharp depreciation of the currency.
• The slow pace of private commercial imports led the government to float tenders for commercial imports of rice BUT
• They left open the possibility that tariffs on these imports might be waived or rebated.
• And set an official sales price below the tariff-inclusive import parity price.

Madagascar: Rice Crisis 2004
The Result
• Private sector import trade was discouraged,
• The government did not have sufficient rice to meet all demand at this official price, so it had to ration sales, and a parallel market at a price above import parity levels developed.
By destroying incentives for private trade, the government unintentionally exacerbated price instability.

Page 20
Principles: Stabilization Strategy
1) Utilize international markets, not just public sector stocks
2) Promote private sector international trade
3) Maintain transparency & predictability of policies

Page 21
Utilize International Markets
1) Utilize international markets, not just public sector stocks
o Import when domestic autarky (no trade) prices are high relative to international border prices
o Export when domestic autarky (no trade) prices are low relative to international border prices
o The alternative is to rely on public stocks – but this can discourage private trade and can be very costly
o A judicious mix of public stocks and international trade is often best.
Page 22
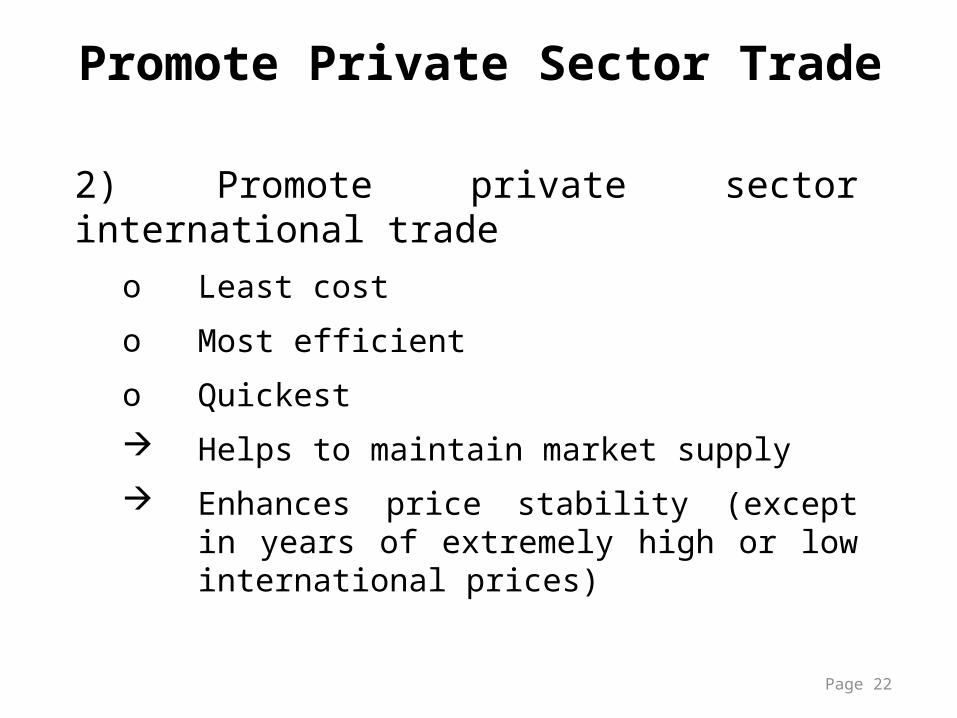
Promote Private Sector Trade
2) Promote private sector international tradeo Least cost
o Most efficient
o Quickest
Helps to maintain market supply
Enhances price stability (except in years of extremely high or low international prices)

Page 23
Transparency and Predictability
3) Transparency & predictability of policies
o Uncertainty over government policy discourages:
o Private sector investment
o Domestic and international trade
o How to reduce uncertainty?
o Establish a platform for discussion and information sharing between government, traders, millers, etc.
ReferencesDorosh, Paul A. 2001. “Trade Liberalization and National Food Security: Rice Trade
between Bangladesh and India”, World Development, 29(4): 673-689.
Dorosh, Paul A. 2008. “Food Price Stabilization and Food Security: The International Experience” Bulletin of Indonesian Economic Studies 44(1): 93-114.
Dorosh, Paul A. 2009. “Price Stabilization, International Trade and National Cereal Stocks: World Price Shocks and Policy Response in South Asia”, Food Security 1(2):137-149.
Dorosh, Paul A., Bart Minten and David Stifel. 2015. “Cereal Price Stabilization in Ethiopia: Implications of International Experience”, (manuscript).
Jayne, Thomas, and David Tschirley. 2009. “Food Price Spikes and Strategic Interactions Between the Public and Private Sectors: Market Failures or Governance Failures?” A paper presented at the FAO meeting on Institutions and Policies to Manage Global Market Risks and Price Spikes in Basic Food Commodities, Rome, 26–27 October 2009.
Minten, Bart and Paul Dorosh (eds.). 2006. Rice Markets in Madagascar in Disarray: Policy Options for Increased Efficiency and Price Stabilization. Africa Region Working Paper Series, Number 101, September. Washington, D.C.: World Bank.

![11.[57-69]Price Behaviour of Major Cereal Crops in Bangladesh](https://static.fdocuments.net/doc/165x107/577d1e5a1a28ab4e1e8e556f/1157-69price-behaviour-of-major-cereal-crops-in-bangladesh.jpg)