![Microwave Sintering of Thermistor Ceramics · 2018. 9. 25. · Microwave Sintering of Thermistor Ceramics 87 3.1.2 Microwave sintering of NTC thermistor ceramics Jin et al.[12, 13]](https://static.fdocuments.net/doc/165x107/5fc1c5bde14383042a0edfab/microwave-sintering-of-thermistor-ceramics-2018-9-25-microwave-sintering-of.jpg)
Ceramics: Sintering and Microstructure - Semantic Scholar · Practical classes "Ceramics ... TP3 -...
15
Practical classes "Ceramics & Colloids ": TP3 Sintering 1 TP3 - Ceramics: Sintering and Microstructure Responsable: Abhishek Kumar (MXC 230, Tel: 36888) 1. Introduction After the initial molding of the ceramic, whether by slip casting or dry pressing, it is still necessary to densify the compacted powder samples (green bodies) to form a continuous 3D structure and thus to get ceramic pieces appropriate for the selected application. Usually this is done by a sintering process which is a consolidation and densification step of the granular compact through the action of heat. During this stage, the microstructure of the samples evolves (see Figure 1). Figure 1 Sintered Powder and microstructure. Source Krell et al.[8]. Pores, second phases and grain size have all an important influence on many of the final properties of ceramics. In general, the porosity has a more pronounced effect than a second phase or the grain size, because most of the desired properties (e.g. elasticity or thermal conductivity) are zero or close to zero in the pores. Thus porosity is often detrimental to important properties such as elastic modulus, tensile strength, hardness or the thermal and electrical conductivities. The desired final properties depend on the final application of the sintered piece. For example for a hip replacement a very high mechanical strength is required, so the residual porosity of the sintered part should be very low. However, for a catalyst, a high specific surface area is usually essential and therefore the porosity after sintering should be high while still ensuring a good cohesion of the piece. There are three types of sintering with different densification mechanisms: 1. Solid phase sintering: all components remain solid throughout the sintering. The densification is carried out by a change in shape of the grains. Mass transport occurs by volume and grain boundary diffusion. 2. Liquid phase sintering: formation of a viscous liquid (usually an eutectic with a low melting point) that fills the pore spaces of the initial green body (e.g. porcelain). Densification occurs mainly by dissolution and reprecipitation of the solid which allows a rapid mass transport. 3. Reactive sintering: two or more constituents react during sintering. The densification is carried out by the formation of a new compound. From a technical perspective, the densification during sintering can be improved by applying an external force. The most common techniques are the application of a uni-axial pressure (HP = hot pressing) or isostatic pressing (HIP = hot isostatic pressing). Additionally, there is a variety of techniques to influence the microstructural characteristics of the final piece by changing the heating and cooling rates. An example is spark plasma sintering (SPS) where very high heating and cooling rates are achieved
Transcript of Ceramics: Sintering and Microstructure - Semantic Scholar · Practical classes "Ceramics ... TP3 -...

Practical classes "Ceramics & Colloids ": TP3 Sintering
1
TP3 - Ceramics: Sintering and Microstructure
Responsable: Abhishek Kumar (MXC 230, Tel: 36888)
1. Introduction
After the initial molding of the ceramic, whether by slip casting or dry pressing, it is still necessary to
densify the compacted powder samples (green bodies) to form a continuous 3D structure and thus to get
ceramic pieces appropriate for the selected application. Usually this is done by a sintering process which
is a consolidation and densification step of the granular compact through the action of heat. During this
stage, the microstructure of the samples evolves (see Figure 1).
Figure 1 Sintered Powder and microstructure. Source Krell et al.[8].
Pores, second phases and grain size have all an important influence on many of the final properties of
ceramics. In general, the porosity has a more pronounced effect than a second phase or the grain size,
because most of the desired properties (e.g. elasticity or thermal conductivity) are zero or close to zero
in the pores. Thus porosity is often detrimental to important properties such as elastic modulus, tensile
strength, hardness or the thermal and electrical conductivities. The desired final properties depend on
the final application of the sintered piece. For example for a hip replacement a very high mechanical
strength is required, so the residual porosity of the sintered part should be very low. However, for a
catalyst, a high specific surface area is usually essential and therefore the porosity after sintering should
be high while still ensuring a good cohesion of the piece.
There are three types of sintering with different densification mechanisms:
1. Solid phase sintering: all components remain solid throughout the sintering. The densification is
carried out by a change in shape of the grains. Mass transport occurs by volume and grain
boundary diffusion.
2. Liquid phase sintering: formation of a viscous liquid (usually an eutectic with a low melting
point) that fills the pore spaces of the initial green body (e.g. porcelain). Densification occurs
mainly by dissolution and reprecipitation of the solid which allows a rapid mass transport.
3. Reactive sintering: two or more constituents react during sintering. The densification is carried
out by the formation of a new compound.
From a technical perspective, the densification during sintering can be improved by applying an external
force. The most common techniques are the application of a uni-axial pressure (HP = hot pressing) or
isostatic pressing (HIP = hot isostatic pressing). Additionally, there is a variety of techniques to
influence the microstructural characteristics of the final piece by changing the heating and cooling rates.
An example is spark plasma sintering (SPS) where very high heating and cooling rates are achieved
Practical classes "Ceramics & Colloids ": TP3 Sintering
2
with the help of a pulsed electric field which leads to a high density in a relatively short period of time
(5-10 minutes) while keeping a relatively small grain size. [12]
The subject of this lab is natural, solid phase sintering (i.e. heating in a conventional oven without
applying an external force). Various factors influencing sintering will be discussed. The objective is to
understand the driving force and the mechanisms of sintering and to get an idea of how they can be
influenced. The influence of the particle size and of the addition of dopants on sintering will be studied.
As the experimental methods can only provide limited information on the topics we will use digital
modeling techniques to better understand what happens during sintering. To follow the progress of
sintering we use a dilatometer which tracks dimensional changes in a piece during sintering. The density
and residual porosity of the final piece is then studied with an experimental method called the
immersion or Archimedes method.
2. Density and Porosity Measurements
2.1. Density and Porosity - Definition
As mentioned previously the porosity has a huge impact on the final properties of a sintered ceramics.
However the total volume of the porosity is insufficient to understand the sintering behavior and the
final properties of the material. There are several additional characteristics that will influence the
porosity:
1. The connectivity of the pores: there exists open and closed porosity. In the first case, the pores
communicate with the outside of the material, they can theoretically be filled with a fluid by
immersion of the piece. In the case of closed porosity the pores are isolated inside the material.
2. The pore size: the pore size is important for the final properties as well as during the sintering as
small pores are much more difficult to eliminate than large ones.
3. The shape of pores: the pores can have different shapes which influence their behavior. Open
pores are typically thin, elongated and irregularly shaped. The closed pores are typically more
equiaxed.
4. The distribution of the porosity: the global special distribution of the porosity can be of
importance. For example during the production of ceramic layers, the porosity is not always
uniform throughout the thickness of the layer.
The evolution of fractions of open and closed porosity versus the fraction of theoretical density is shown
in Figure 2a) for different spinels (SiC and SiB4). This shows the replacement of the open porosity by
closed porosity. On a fracture surface (Figure 2b)) we can see different types of pores for Al2O3: flat (1-
4), elongated (4 and 7) and of more complex shape (5-6). If one maximizes the porosity for a given
application, one can obtain a foam (Figure 2c)). Such foams are typically used for filtration or as a
catalyst because of their high surface area.

Practical classes "Ceramics & Colloids ": TP3 Sintering
3
(a) (b) (c)
Figure 2 Illustration of porosity: (a) evolution of open and closed porosity. (b) different shapes of pores. (c)
ceramic foam with high porosity.
2.2. Immersion Method / Archimedes Method
The absolute densities calculated from crystalline structures or measured using Pycnometry [6] as well
as the dry, wet and immersed masses can be used for the calculation of apparent densities and the
volume fractions of the open and the closed porosity. The solvent used during this TP is deionized water
without additive. However the same procedure can also be done with alcohol or other solvents wetting
the material studied. In the case of alcohol, solvent evaporation can greatly affect the quality of
measurements due to evaporation and the time between the different stages of measures must be strictly
controlled.
In general one can distinguish between two different types of porosities:
Open porosity, po: pores that communicate with the outside of the material, they can
theoretically be filled with a fluid.
Closed porosity, pf: the pores are isolated inside the material
This means that the apparent volume Vapp is equal to the sum of different parts of the sample: The actual
volume of the solid Vs, the volume of the open porosity, Vpo and the volume of the closed porosity Vpf
(see equation (1)).
app s po pfV V V V (1)
If we assume that the solvent wets the entire surface of the open porosity, the open porosity can be
estimated from the impregnated (m2) compared to the dry mass (m1) divided by the water density ρeau
(equation (2)).
2 1po
eau
m mV
(2)
The volume of the closed porosity can be determined via the buoyancy PA or the immersed mass m3
(equation (3)): We consider that this force is exerted on the volume of the solid (Vs) with a material
dependent density ρabs (e.g. 3987 g/cm3 for alpha alumina) and on the closed pore volume (Vf) with
essentially zero density (equation (4)). This means that the volume of the closed pores can be calculated
according to equation (5).
3AP m (3)
Practical classes "Ceramics & Colloids ": TP3 Sintering
4
As pf
eau
PV V
(4)
3 1Apf s
eau eau abs
mP mV V
(5)
The percentage of open pore volume (Po) and closed (Pf) can be calculated as follows:
PoVpo
Vapp
100
PfVpf
Vapp
100
And finally the effective density of the sample 2 (closed pores included ....) is:
1 1 12
eau
As pf A
eau
m m m
PV V P
Samples
The ceramic studied is alumina (chemical formula Al2O3) with and without dopants. We will measure a
series of three sintered pellets (natural sintering in air) at three different temperatures will be used: 1400
°C, 1500 ° C and 1700 ° C (ramp 10 ° C / min).
Operation mode
The liquid used for immersion must be stable and controlled. Water must be at a constant temperature to
avoid variations in density, this is why the water used for soaking the samples (cooler than the ambient
temperature) should not be used. Number the pellets using a felt pen (water resistant).
2. Set the balance to zero (tare) with the immersion basket in water. Weigh the dry samples (dry
mass, m1)
3. Place the samples in a small beaker and create a void
4. At the same time put enough water into the beaker to immerse the samples completely
5. Keep the void until no more air bubbles are observed (~ 30 min)
6. Take the samples out of the water and dry them carefully then weigh them (impregnated mass
m2). When working with alcohol, e.g. isoproanol this last step must always be done in the
same time e.g. within 30 seconds.
7. Tare the balance and then weigh the sample in water (immersed mass, m3) (can be repeated 2 or
3 times to check reproducibility). Measure the temperature of the water for each sample.
8. Calculate the apparent density, the relative density and the effective, open and closed porosity
according to the equations above. Use the value of the density of water from the table given in
the annex.
3. Sintering
3.1. Driving force of the sintering
The driving force for sintering is the reduction of the interfacial free energy of the system, both by
replacing the solid-gas interfaces (surfaces) by grain boundaries (densification), and by reducing the
Practical classes "Ceramics & Colloids ": TP3 Sintering
5
ratio of the interfacial area per volume of the grains (grain growth). Thus there are always at least two
phenomena that compete during sintering: densification and grain growth.
Densification can be looked at at three different scales:
Global scale
Microstructure scale (grain)
Atomic scale
On a global scale the densification is due to a minimization of the surface energy by replacing the solid-
gas interfaces by grain boundaries. In other words the overall driving force for densification is the
global surface energy reduction.
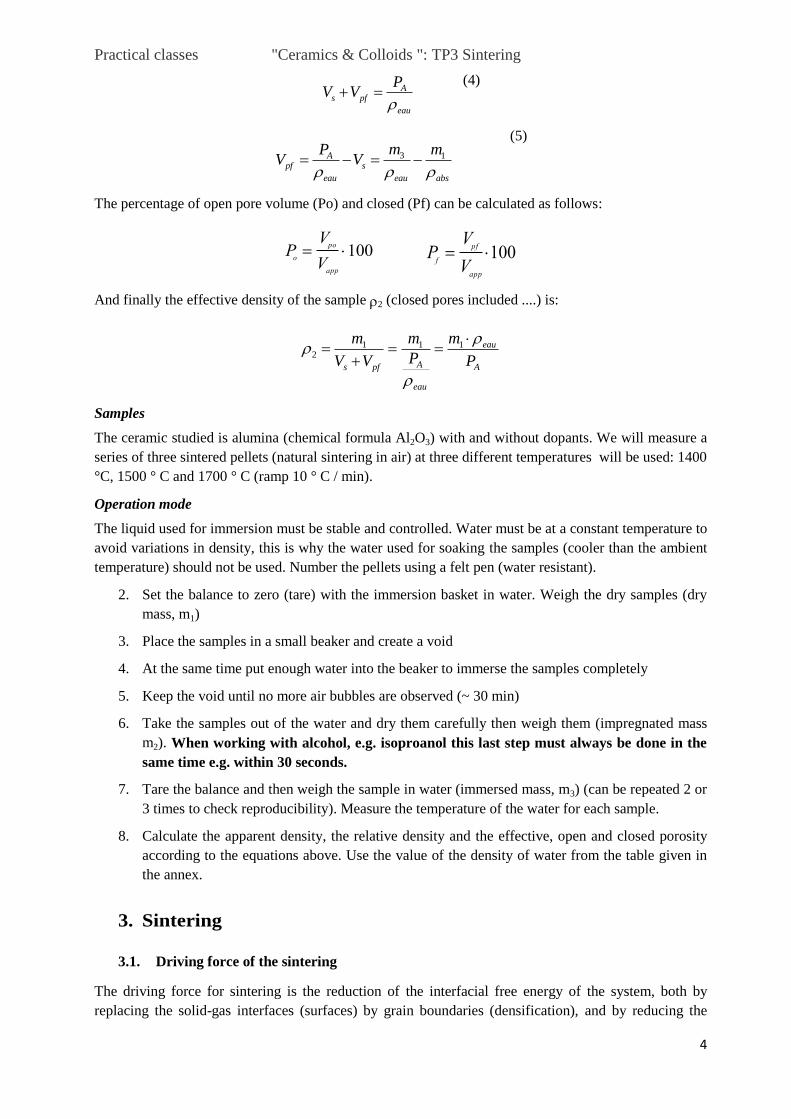
On the scale of the microstructure, the driving forces for mass transport are the differences in pressure
and concentration gradients of point defects (e.g. vacancies) due to differences in radius of curvature in
the microstructure. The relationship between pressure and the radius of curvature can be illustrated by
imagining an elastic membrane that can stretch and bend under the influence of pressure at the place of
the grain surfaces. A flat membrane exerts no pressure on either side (conversely, a membrane does not
bend if there is not a pressure difference between the two sides). On the other hand, a curved membrane
exerts an overpressure on its convex side (conversely, a membrane bends if there is a pressure
difference between the two sides). This effect can be observed for example when one takes a pot of
yoghurt from sea level high into the mountains (the cover is bent outward because of the overpressure
inside the pot). Figure 3 illustrates this effect. It is noted that the pressure exerted by a membrane is
inversely proportional to its radius of curvature (Young-Laplace Equation [6]).
Figure 3 A decrease in the radius of curvature of an elastic membrane requires an increased pressure.
Source: MIT Non-Newtonian Fluid Dynamics Research Group.
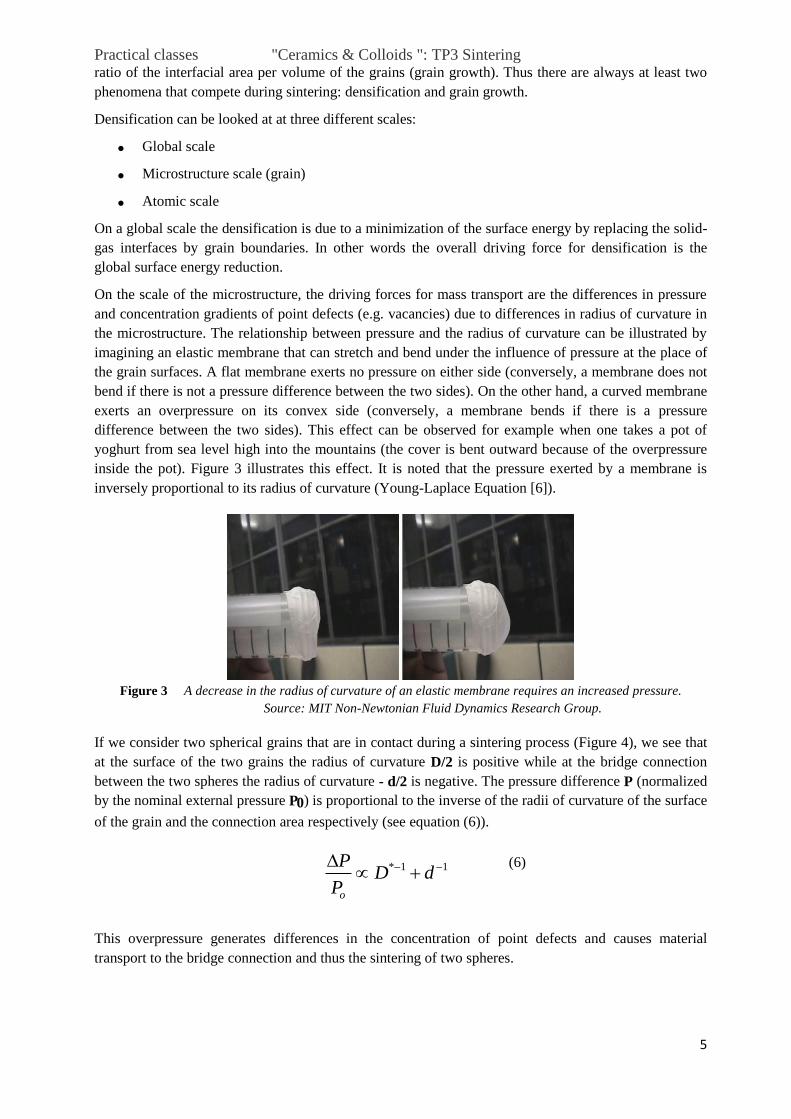
If we consider two spherical grains that are in contact during a sintering process (Figure 4), we see that
at the surface of the two grains the radius of curvature D/2 is positive while at the bridge connection
between the two spheres the radius of curvature - d/2 is negative. The pressure difference P (normalized
by the nominal external pressure P0) is proportional to the inverse of the radii of curvature of the surface
of the grain and the connection area respectively (see equation (6)).
* 1 1
o
PD d
P
(6)
This overpressure generates differences in the concentration of point defects and causes material
transport to the bridge connection and thus the sintering of two spheres.
Practical classes "Ceramics & Colloids ": TP3 Sintering
6
Figure 4 Schematic representation of the shape evolution of two spheres in contact during a sintering process.
D* and d represent the diameters of curvature in two different local areas of the overall. Source: Yu
U. Wang [11].
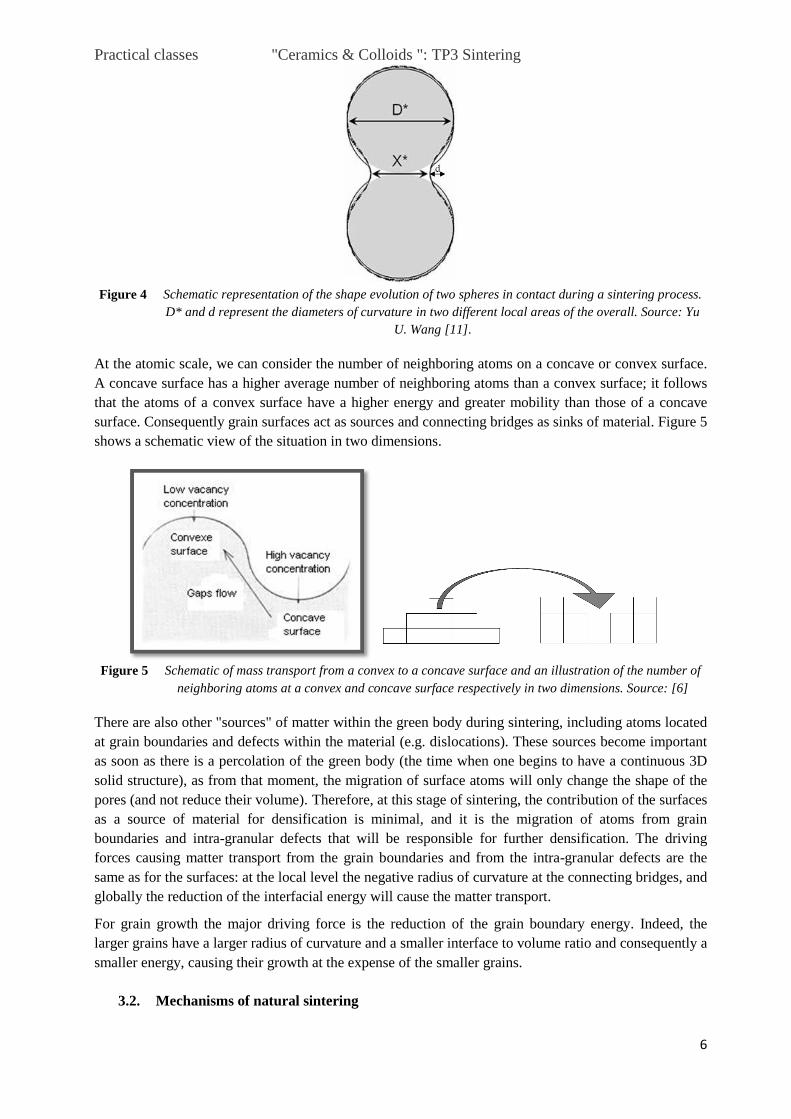
At the atomic scale, we can consider the number of neighboring atoms on a concave or convex surface.
A concave surface has a higher average number of neighboring atoms than a convex surface; it follows
that the atoms of a convex surface have a higher energy and greater mobility than those of a concave
surface. Consequently grain surfaces act as sources and connecting bridges as sinks of material. Figure 5
shows a schematic view of the situation in two dimensions.
Figure 5 Schematic of mass transport from a convex to a concave surface and an illustration of the number of
neighboring atoms at a convex and concave surface respectively in two dimensions. Source: [6]
There are also other "sources" of matter within the green body during sintering, including atoms located
at grain boundaries and defects within the material (e.g. dislocations). These sources become important
as soon as there is a percolation of the green body (the time when one begins to have a continuous 3D
solid structure), as from that moment, the migration of surface atoms will only change the shape of the
pores (and not reduce their volume). Therefore, at this stage of sintering, the contribution of the surfaces
as a source of material for densification is minimal, and it is the migration of atoms from grain
boundaries and intra-granular defects that will be responsible for further densification. The driving
forces causing matter transport from the grain boundaries and from the intra-granular defects are the
same as for the surfaces: at the local level the negative radius of curvature at the connecting bridges, and
globally the reduction of the interfacial energy will cause the matter transport.
For grain growth the major driving force is the reduction of the grain boundary energy. Indeed, the
larger grains have a larger radius of curvature and a smaller interface to volume ratio and consequently a
smaller energy, causing their growth at the expense of the smaller grains.
3.2. Mechanisms of natural sintering

Practical classes "Ceramics & Colloids ": TP3 Sintering
7
There are different sintering mechanisms (Figure 6), or in other words, different modes of matter
transport from sources (surfaces, grain boundaries, defects) to the sinks (bridge connection). The
different mechanisms are:
Surface diffusion
Volume diffusion
Vapor transport
Grain boundary diffusion (intergranular diffusion)
Figure 6 Sintering mechanisms and dependence of the dominant mechanism on the sintering temperature.
Source: [6]
Not all the mechanisms are active for all sources of material. To transport material from intra-granular
defects the only active mechanism is volume diffusion. For the transport of material from the interior of
the grain boundaries both volume diffusion and grain boundary diffusion are active. To transport
material from the surfaces, all mechanisms are active. For all the different modes of transportation we
can define different diffusion coefficients D and their temperature dependence (Equation (7) [1]).
Q
kToe
D D
(7)
Where Q is the experimentally measured activation energy.
If we suppose for example that we have a vacancy diffusion mechanism (see Figure 7) we can define the
diffusion coefficient depending on the vacancy concentration c, the number of neighboring sites γ, the
frequency of vibration of atoms ν, the distance between neighboring sites λ and the activation energy for
vacancy jump ΔG (equation (8) [1]).
1 2 1 2
G S H
RT R RTc e c e e
D
(8)
The only term of this equation that depends explicitly on the temperature is e∆H /RT
and thus at first
approximation, the experimentally measured activation energy corresponds to the enthalpy of a vacancy
jump ΔH.

Practical classes "Ceramics & Colloids ": TP3 Sintering
8
Figure 7 Schematic view of the vacancy diffusion and the activation energy for the vacancy diffusion.
In reality, there are other parameters, such as the concentration of vacancies c, which varies with the
temperature and therefore influences the experimentally measured activation energy Q. This means that
Q corresponds only approximately to ΔH.
As the crystalline structure is disturbed at the interfaces of the grains (surfaces, grain boundaries), the
activation energies for diffusion are most of the smaller solid interfaces than for scattering into volume
(∆Hsurf < ∆Hgrain b. < ∆Hvolume and therefore Qsurf < Qgrain b. < Qvolume see Table 1).
Table 1 Diffusion coefficients for different diffusion mechanisms in α-alumina and ZnO.
α − Al2 O3 [2] ZnO [3, 4]
Qsurf [kJ/mol]
Qgrain b. [kJ/mol]
Qvolume [kJ/mol]
399 ± 122
464 ± 49
616 ± 102
∼ 158
282 ± 46
376 ± 68
For densification, there is often a diffusion pathway dominates, so that the variation of the speed of densification ρ ˙ with the temperature depends on the activation energy of diffusion path Q dominant. Because of activation energies of difference it is
There is often a diffusion mechanism that dominates the densification process. Thus the variation of the
densification rate with the temperature depends on the activation energy Q of dominant diffusion
mechanism. Because of the differences between the activation energies it is possible to determine which
diffusion mechanism is dominant by measuring the density evolution under different conditions (e.g.
different heating rates) using a dilatometer. A dilatometer measures the change of one of dimensions of
the sample during sintering. Assuming that the densification is isotropic, we can then calculate the
density and the densification rate from the change of dimension L observed (equations (9) & (10)
).
3
1
o
o
L
L
(9)
4
3
1
o
o
d dL
dt dtL
L
(10)
It has been shown by several authors [7, 10] that one can separate the influences of temperature, density
and grain size on the densification rate (equation (11)):
Practical classes "Ceramics & Colloids ": TP3 Sintering
9
. ( )Q
RT
n
e fA
T D
(11)
Where A is a material parameter, f(ρ) is a non specified function which depends only on ρ and n
depends on the dominant mechanism. In other words, if we measure the densification rate at different
temperatures and roughly equal densities and grain sizes, we can estimate the activation energy by
measuring the slope of ln (T ρ˙) versus T-1 (equation (12)).
,
.ln ( )D cst
QT
RT
(12)
Apart from the material transport by diffusion there are also stresses that develop during sintering and
thus a movement of grains that helps densification.
The main mechanism responsible for grain growth is the movement of grain boundaries (in normal
direction to the grain boundary) by local rearrangement of atoms. Indeed, at the grain boundaries there
is the same phase at either side of the interface, no material transport is necessary for their movement. It
is "sufficient" that the crystal structure near the grain boundary changes to be conform with the
crystallographic orientation of the other grain and thus the grain boundary advances. However the
situation changes if there are pores at the grain boundaries. As the energy of the pores is generally
smaller at the grain boundaries than within the grains they often move with the grain boundaries. The
movement of the pores is controlled by surface diffusion, a process much slower than the movement of
grain boundaries by local rearrangement of atoms.
3.3. Important parameters influencing the sintering
Grain size distribution and shape
The characteristics of the grains, that is to say the particle shape, size distribution of average grain size
as well as the factor of agglomeration of the initial powder, strongly influences the sintering behaviour.
The driving force and the kinetics are influenced by particle size. The total driving force for the
sintering is proportional to the total surface energy per volume ( /V) incorporated in the material.
/V decreases with increasing grain size and when the shape of the grains approaches the
equilibrium morphology (Wulff shape).
The densification kinetics is mainly influenced by variations in distances between sources and sinks of
material. For example, an irregular shaped grains or a large factor of agglomeration decreases the initial
density of the green body, increasing the distance between the sources and the sinks. Consequently the
rate of densification decreases. In addition the dominant diffusion mechanism can change with particle
size and/or shape: the higher the specific interface area, the more the interfacial diffusion mechanisms
(surface diffusion, grain boundary diffusion through the grain boundaries and vapor transport) are
favored compared to volume diffusion.
The kinetics of grain growth is mainly influenced by the grain size distribution. If the distribution
is large, the pressure difference between the smaller and larger grains is very high and
consequently the growth of larger grains at the expense of the smaller ones is much faster than for a
narrow size distribution.
Temperature

Practical classes "Ceramics & Colloids ": TP3 Sintering
10
The temperature generally increases the rate of all sintering mechanisms. Also, as the activation energy
(Q) is not the same for each diffusion mechanism, the rates of the different mechanisms might vary
relatively to the rates of the other mechanisms. As in general Qsurf <Qgrain b.<Qvolume a higher temperature
accelerates volume diffusion compared to interfacial diffusion. Thus the dominant densification
mechanism may change with temperature. In addition, since grain growth is often controlled by surface
diffusion while densification is controlled either by volume diffusion or by grain boundaries diffusion, a
higher temperature often leads to higher densification compared to grain growth.
Dopants and impurities
There are often impurities and dopants present in the material. Dopants are added for various reasons
such as changing the electronic properties (e.g. α-Al2O3 doped with Ti), to facilitate sintering (e.g. α-
Al2O3 doped with Mg), or to improve the mechanical properties of the final product (e.g. α-Al2O3 doped
with Y). These dopants and impurities can affect the sintering in different ways:
Formation of precipitates: If the concentration of impurities or dopants exceeds the solubility
limit, a second phase will precipitate. As in the case of pores, the precipitates have an smaller
energy at the grain boundaries than within the grains. Consequently second phase precipitates
can decrease the mobility of grain boundaries and slow down grain growth.
Increase of the concentration of vacancies or interstitial atoms: If the impurities / dopants have a
different charge than the ions of the crystalline lattice there are often charged point defects such
as vacancies or interstitial atoms that are created to compensate for the missing or excess
charge. For example, in α- Al2O3 doped with Mg, the magnesium ions have a charge of +2
while the replaced aluminum ion in the crystal have a charge of +3. The charges thus created are
compensated by oxygen vacancies:
2MgO Al2O3
> 2Mg’Al + V¨O.
Therefore dopants and impurities can influence the rate of diffusion by changing the
concentrations of point defects.
Immobilization of defects: the incorporation of a foreign ion in a crystal leads to the creation of
a stress field around the defect. Bringing another defect with an inverse constraint field closer
can therefore reduce their energy. For example the incorporation of Y3+ ions, which have a
much larger ionic radius (0.9 Å) than Al3+ ions (0.54 Å), in α-Al2O3 creates a compression field
around the Y. A vacancy on the other hand is surrounded by a tension field. Thus the total
excess energy due to the presence of the two defects decreases when they approach each other.
The resulting combination of an Y ion and a vacancy reduces the mobility of the two defects
and thus dopant ions can decrease the diffusion coefficient.
Segregation to interfaces: many dopants can be incorporated more easily at the interfaces of the
material where the crystalline structure is already disturbed. Therefore dopants often segregate
to interfaces. Similarly to pores and precipitates, the presence of segregated dopant ions at
interfaces will decrease the mobility of grain boundaries as the dopants must migrate with the
grain boundaries to maintain their low energy. In addition, the effects of eventual changes of the
concentrations of point defects or of immobilizing the defects will be more pronounced at the
interface due to the higher dopant concentration.
In summary, the exact effect of a dopant or impurity is complex, difficult to predict and depends on the
ion type and concentration.
3.4. Simulation of Sintering

Practical classes "Ceramics & Colloids ": TP3 Sintering
11
Because of the complexity of sintering, it is often useful to use numerical simulations to estimate the
influence of different factors on sintering. Therefore we will use a two-dimensional sintering model to
simulate the influence of shape of the grains. The simulation is done on a cubic grid. Each grid cell can
be occupied by a solid particle. Each particle has eight possible neighbors (see Figure 8). A number of
neighboring solid particles can form a grain. The energy of a particle Epart depends on the number of
neighbors belonging to the same grain ngrain and on the number of neighbors belonging to another grain
nboundary (Equation 13).
Epart= ngrain · ΔEgrain + nboundary ·
ΔEboundary (13)
Where energies are adimensionalized: Eadim = ∆H /RT. If at least one neighboring sites is not occupied,
the particle can move. To move the particle must pass a transient state with a higher energy Etrans than
the starting energy (see Figure 7). The average time the particle needs to move to a nearby site depends
on the activation energy ΔHsaut = (Etrans – Ebef)*RT of the jump.
Figure 8 Neighborhood of a solid particle
Indeed time needed for a jump follows an exponential distribution that depends the activation energy
(equation 14).
saut
trans bef
HtE E t saut RT
trans bef
Ht E E e e
RT
(14)
Where Ebef and Eaft are the energies before and after the particle jump. In addition, if the particle has
neighbors who do not belong to the same grain it can change the grain. The time distribution for a
change from one grain to another is the same as to move from one site to another (equation 14). If the
solid particle has no neighbors, and is thus in the vacuum, it behaves like a random walker with a
constant speed Vvaccume.
3.5. Simulation of Y dopants in a-alumina
To estimate the influence of dopants on sintering we must use a model with atomic resolution. For
example, to estimate the driving force for the segregation of dopants to interfaces, a model based on a
pair potential can be employed, which enables the calculation of the energy contained in a specific
structure. The analytical form of the pair potentials is composed of an electrostatic part (Coulomb) and
an short-range interaction describing the interaction of electron clouds (Van der Waals) (see equation
15).
der Waals 6
2
04
ij
ij
r
Pi jcoulomb van
ij ij ij ij
ij
q qV A e C r
r
(15)

Practical classes "Ceramics & Colloids ": TP3 Sintering
12
Where A, ρ and C are empirical parameters determined by fitting the calculated properties of alumina
and YAG (Y3Al5O12) (such as the Young's modulus or the crystalline unit cell dimensions) to the
experimentally observed [13]. Summing over all pairs of ions, we can obtain the total energy contained
in a specific structure. As the exact structure is often unknown, we try to minimize the energy by
adjusting the position of the ions to obtain an equilibrated structure. Thus we can compare the energy of
a dopant within the grains with the energy of a dopant at a surface or a grain boundary to calculate the
driving force of segregation ΔHseg (equation 11).
seg doped interface pure interface dopantH E E E (16)
Where E doped interface is the total energy of the interface containing the dopant, E pure interface is the total
energy of the interface without dopants and E dopant is the energy of the dopant within the grains. There
are several programs that were developed for this kind of calculations such as METADISE [9] and
GULP [5].
4. Objectives
The objective of this lab is to understand the driving forces and mechanisms of natural, solid phase
sintering and to developed an understanding of how they can be influenced. Sintering will be studied by
different techniques. Firstly the Archimedes method will be used to study the porosity of samples
sintered at different temperatures. Then experimental dilatometer results will be used to calculate
activation energies. Thirdly numerical simulations of sintering with differently shaped grains will be
performed. In addition we will look at the behavior of Yttrium dopants in α-Al2O3. The energy of the Y
within the grains of α-Al2O3, calculated with an atomistic model, will be compared with the energy of
the Y at the α-Al2O3 interfaces. The simulation results will also be compared to experimental
observations. Finally some ideas how to incorporate the results of atomistic simulation into the
sintering simulations will be developed.
5. Work
Measurement of the density of 3 sintered samples by the Archimedes method.
Discussion of the densities (absolute and relative) as well as the open and closed porosity
fractions of the three samples sintered at different temperatures.
Launch of two simulations (with spherical and irregularly shaped grains). It is important to note
input parameters of the simulation and to periodically save an image of the current
microstructure.
Calculation of the activation energy using experimental dilatometer results for different heating
rates. Comparison with the energies used for the sintering simulation.
Calculation of the segregation energy of Y in Al2O3 using atomistic simulations. Comparison
with experimental observations (micrographs). How could the effect of dopants be included in
the sintering model?
6. Requirements
6.1. Structure of report

Practical classes "Ceramics & Colloids ": TP3 Sintering
13
The report must be structured as a scientific text, i.e. the content should be divided into several chapters
that contain :
A brief introduction that provides context and clarifies the objectives of the work done.
The theoretical basis used for calculations and discussion.
A description of the methods used.
Results.
A discussion of results.
Conclusion.
Some of the points above can be combined into one chapter if preferred (e.g. Results and Discussion or
Introduction and Theory …).
6.2. Content of report
The report should contain the following points:
Effective density, percentage of open and closed porosity calculated for the three samples
sintered at different temperatures.
Description of the sintering model. For which such a model can be useful? What are the biggest
limitations of the model?
Calculation of the activation energy using experimental results for different heating rates.
Comparison with the energies used for the sintering simulation.
Results (microstructures, energy graphs, grain boundaries and surfaces based on the number of
time steps) and discussion of the sintering simulation of varying particle size (spherical and
irregular shaped grains). What are the phenomena observed? How the initial shape of the grains
can influence the results? Comparison with experimental results for different particle sizes?
How the porosity changes during sintering?
Results of atomistic simulation (ΔHseg vs depth for the grain boundary and surface) and
experimental observations (micrographs) for a α-Al2O3 doped with Y. Discussion of results.
How dopants could be included in the model of sintering?
References
[1] Y. M Chiang, D. P Birnie, and W. D Kingery. Physical ceramics. Wiley, 1997.
[2] E. Dörre and H. Hüner. Alumina: processing, properties, and applications. Springer-Verlag Berlin, 1984.
[3] K. G Ewsuk, D. T Ellerby, and C. B DiAntonio. Analysis of nanocrystalline and microcrystalline ZnO
sintering using master sintering curves. Journal of the American Ceramic Society, 89(6):2003–2009, 2006.
[4] H. J Fan, M. Knez, R. Scholz, D. Hesse, K. Nielsch, M. Zacharias, and U. G\"osele. Influence of surface
diffusion on the formation of hollow nanostructures induced by the kirkendall effect: the basic concept. Nano Lett,
7(4):993–997, 2007.
[5] J. D Gale and A. L Rohl. The general utility lattice program (GULP). Molecular Simulation, 29(5):291â˘A
¸S341,2003.
[6] J. M Haussonne, C. Carry, P. Bowen, and J. Barton. Céramiques et verres: principes et techniques
d’élaboration. Presses Polytechniques et Universitaires Romandes, 2005.

Practical classes "Ceramics & Colloids ": TP3 Sintering
14
[7] D. L Johnson. New method of obtaining volume, Grain-Boundary, and surface diffusion coefficients from
sintering data. Journal of Applied Physics, 40:192, 1969.
[8] Andreas Krell, Paul Blank, Hongwei Ma, Thomas Hutzler, and Manfred Nebelung. Processing of High-
Density submicrometer Al2O3 for new applications. Journal of the American Ceramic Society, 86(4):546–53,
April 2003.
[9] S. C Parker, D. J Cooke, S. Kerisit, A. S Marmier, S. L Taylor, and S. N Taylor. From HADES to
PARADISEatomistic simulation of defects in minerals. JOURNAL OF PHYSICS CONDENSED MATTER.,
16:2735â˘A ¸S2750, 2004.
[10] Jenqdaw Wang and Rishi Raj. Estimate of the activation energies for boundary diffusion from Rate-
Controlled sintering of pure alumina, and alumina doped with zirconia or titania. Journal of the American Ceramic
Society, 73(5):1172–1175, May 1990.
[11] Yu U. Wang. Computer modeling and simulation of solid-state sintering: A phase field approach. Acta
Materialia,54(4):953–961, February 2006.
[12] M. Stuer,
Z.Zhao, U. Aschauer, P. Bowen, ”Transparent Polycrystalline Alumina using Spark
Plasma Sintering: effect of Mg, Y and La doping” J Eur Ceram Soc. 30 (2010) 1335-1343
[13] G.V. Lewis, C.R.A. Catlow, Potential models for ionic oxides, J. Phys. Chem. C 18(1985) 1149–
1161.

Practical classes "Ceramics & Colloids ": TP3 Sintering
15
Annex - Density of Water (g/mL) vs. Temperature (°C)
(from Handbook of Chemistry and Physics, 53rd Edition, p. F4)
Whole degrees are listed down the left hand side of the table, while tenths of a degree are listed across the top. So
to find the density of water at say 5.4 °C, you would first find the whole degree by searching down the left hand
column until you reach '5'. Then you would slide across that row until you reach the column labeled '0.4'. The
density of water at 5.4 °C is 0.999957 g/mL.
0.0 0.1 0.2 0.3 0.4 0.5 0.6 0.7 0.8 0.9
0 0.999841 0.999847 0.999854 0.999860 0.999866 0.999872 0.999878 0.999884 0.999889 0.999895
1 0.999900 0.999905 0.999909 0.999914 0.999918 0.999923 0.999927 0.999930 0.999934 0.999938
2 0.999941 0.999944 0.999947 0.999950 0.999953 0.999955 0.999958 0.999960 0.999962 0.999964
3 0.999965 0.999967 0.999968 0.999969 0.999970 0.999971 0.999972 0.999972 0.999973 0.999973
4 0.999973 0.999973 0.999973 0.999972 0.999972 0.999972 0.999970 0.999969 0.999968 0.999966
5 0.999965 0.999963 0.999961 0.999959 0.999957 0.999955 0.999952 0.999950 0.999947 0.999944
6 0.999941 0.999938 0.999935 0.999931 0.999927 0.999924 0.999920 0.999916 0.999911 0.999907
7 0.999902 0.999898 0.999893 0.999888 0.999883 0.999877 0.999872 0.999866 0.999861 0.999855
8 0.999849 0.999843 0.999837 0.999830 0.999824 0.999817 0.999810 0.999803 0.999796 0.999789
9 0.999781 0.999774 0.999766 0.999758 0.999751 0.999742 0.999734 0.999726 0.999717 0.999709
10 0.999700 0.999691 0.999682 0.999673 0.999664 0.999654 0.999645 0.999635 0.999625 0.999615
11 0.999605 0.999595 0.999585 0.999574 0.999564 0.999553 0.999542 0.999531 0.999520 0.999509
12 0.999498 0.999486 0.999475 0.999463 0.999451 0.999439 0.999427 0.999415 0.999402 0.999390
13 0.999377 0.999364 0.999352 0.999339 0.999326 0.999312 0.999299 0.999285 0.999272 0.999258
14 0.999244 0.999230 0.999216 0.999202 0.999188 0.999173 0.999159 0.999144 0.999129 0.999114
15 0.999099 0.999084 0.999069 0.999054 0.999038 0.999023 0.999007 0.998991 0.998975 0.998959
16 0.998943 0.998926 0.998910 0.998893 0.998877 0.998860 0.998843 0.998826 0.998809 0.998792
17 0.998774 0.998757 0.998739 0.998722 0.998704 0.998686 0.998668 0.998650 0.998632 0.998613
18 0.998595 0.998576 0.998558 0.998539 0.998520 0.998501 0.998482 0.998463 0.998444 0.998424
19 0.998405 0.998385 0.998365 0.998345 0.998325 0.998305 0.998285 0.998265 0.998244 0.998224
20 0.998203 0.998183 0.998162 0.998141 0.998120 0.998099 0.998078 0.998056 0.998035 0.998013
21 0.997992 0.997970 0.997948 0.997926 0.997904 0.997882 0.997860 0.997837 0.997815 0.997792
22 0.997770 0.997747 0.997724 0.997701 0.997678 0.997655 0.997632 0.997608 0.997585 0.997561
23 0.997538 0.997514 0.997490 0.997466 0.997442 0.997418 0.997394 0.997369 0.997345 0.997320
24 0.997296 0.997271 0.997246 0.997221 0.997196 0.997171 0.997146 0.997120 0.997095 0.997069
25 0.997044 0.997018 0.996992 0.996967 0.996941 0.996914 0.996888 0.996862 0.996836 0.996809
26 0.996783 0.996756 0.996729 0.996703 0.996676 0.996649 0.996621 0.996594 0.996567 0.996540
27 0.996512 0.996485 0.996457 0.996429 0.996401 0.996373 0.996345 0.996317 0.996289 0.996261
28 0.996232 0.996204 0.996175 0.996147 0.996118 0.996089 0.996060 0.996031 0.996002 0.995973
29 0.995944 0.995914 0.995885 0.995855 0.995826 0.995796 0.995766 0.995736 0.995706 0.995676
30 0.995646 0.995616 0.995586 0.995555 0.995525 0.995494 0.995464 0.995433 0.995402 0.995371
(Updated by C.R. Snelling, 6/14/08)