CERAMICS IN NON-THERMAL PLASMA DISCHARGE FOR HYDROGEN...
116
CERAMICS IN NON-THERMAL PLASMA DISCHARGE FOR HYDROGEN GENERATION By Ramona Roxana Vintila Department of Mining, Metals and Materials Engineering McGilI University Montreal, Canada A Thesis Submitted to the Faculty of Graduate Studies and Research in partial fulfillment of the requirements for the degree of Master of Engineering © Ramona Roxana Vintila August 2005
Transcript of CERAMICS IN NON-THERMAL PLASMA DISCHARGE FOR HYDROGEN...

CERAMICS IN NON-THERMAL PLASMA DISCHARGE FOR
HYDROGEN GENERATION
By
Ramona Roxana Vintila
Department of Mining, Metals and Materials Engineering McGilI University Montreal, Canada
A Thesis Submitted to the Faculty of Graduate Studies and Research
in partial fulfillment of the requirements for the degree of Master of Engineering
© Ramona Roxana Vintila August 2005
1+1 Library and Archives Canada
Bibliothèque et Archives Canada
Published Heritage Branch
Direction du Patrimoine de l'édition
395 Wellington Street Ottawa ON K1A ON4 Canada
395, rue Wellington Ottawa ON K1A ON4 Canada
NOTICE: The author has granted a nonexclusive license allowing Library and Archives Canada to reproduce, publish, archive, preserve, conserve, communicate to the public by telecommunication or on the Internet, loan, distribute and sell th es es worldwide, for commercial or noncommercial purposes, in microform, paper, electronic and/or any other formats.
The author retains copyright ownership and moral rights in this thesis. Neither the thesis nor substantial extracts from it may be printed or otherwise reproduced without the author's permission.
ln compliance with the Canadian Privacy Act some supporting forms may have been removed from this thesis.
While these forms may be included in the document page count, their removal does not represent any loss of content from the thesis.
• •• Canada
AVIS:
Your file Votre référence ISBN: 978-0-494-22680-3 Our file Notre référence ISBN: 978-0-494-22680-3
L'auteur a accordé une licence non exclusive permettant à la Bibliothèque et Archives Canada de reproduire, publier, archiver, sauvegarder, conserver, transmettre au public par télécommunication ou par l'Internet, prêter, distribuer et vendre des thèses partout dans le monde, à des fins commerciales ou autres, sur support microforme, papier, électronique et/ou autres formats.
L'auteur conserve la propriété du droit d'auteur et des droits moraux qui protège cette thèse. Ni la thèse ni des extraits substantiels de celle-ci ne doivent être imprimés ou autrement reproduits sans son autorisation.
Conformément à la loi canadienne sur la protection de la vie privée, quelques formulaires secondaires ont été enlevés de cette thèse.
Bien que ces formulaires aient inclus dans la pagination, il n'y aura aucun contenu manquant.

Dedicated to:
the memory ofmy parents, Aurelia and Valerica Vintila, whom 1 miss very much •••
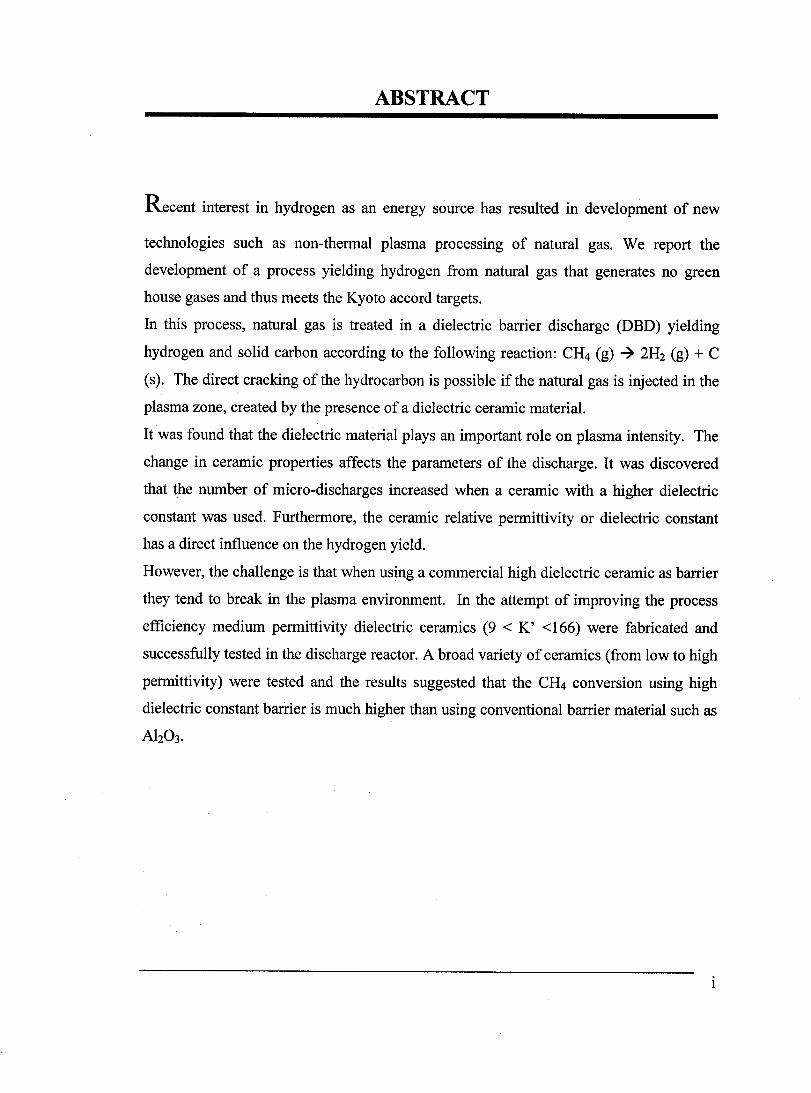
ABSTRACT
Recent interest in hydrogen as an energy source has resulted in development of new
technologies such as non-thermal plasma processing of natural gas. We report the
development of a process yielding hydrogen from natural gas that generates no green
house gases and thus meets the Kyoto accord targets.
In this process, natural gas is treated in a dielectric barrier discharge (DBD) yielding
hydrogen and solid carbon according to the following reaction: CH4 (g) ~ 2H2 (g) + C
(s). The direct cracking of the hydrocarbon is possible if the natural gas is injected in the
plasma zone, created by the presence of a dielectric ceramic material.
It was found that the dielectric material plays an important role on plasma intensity. The
change in ceramic properties affects the parameters of the discharge. It was discovered
that the number of micro-discharges increased when a ceramic with a higher dielectric
constant was used. Furthermore, the ceramic relative permittivity or dielectric constant
has a direct influence on the hydrogen yield.
However, the challenge is that when using a commercial high dielectric ceramic as barrier
they tend to break in the plasma environment. In the attempt of improving the process
efficiency medium permittivity dielectric ceramics (9 < K' <166) were fabricated and
successfully tested in the discharge reactor. A broad variety of ceramics (from low to high
permittivity) were tested and the results suggested that the CH4 conversion using high
dielectric constant barrier is much higher than using conventional barrier material such as
Ah0 3.
RÉSUMÉ
Le récent intérêt concernant l'hydrogène en tant que source d'énergie a favorisé
considérablement le développement de nouvelles technologies telles que les procédés de
plasma non thermique du gaz naturel. Le présent mémoire traite donc du développement
d'un procédé produisant de l'hydrogène à partir du gaz naturel sans la génération de gaz à
effet de serre, rencontrant ainsi les objectifs de l'accord de Kyoto.
Ce procédé permet en effet de fractionner le gaz naturel suite à une décharge dans une
barrière diélectrique, produisant de l 'hydrogène gazeux et du carbone solide, suivant la
réaction suivante: CH4 (g) ~ 2H2 (g) +C (s). Le fractionnement direct des hydrocarbures
est possible lorsque le gaz naturel est injecté dans un plasma créé par la présence d'un
matériau céramique diélectrique.
Il a été démontré que le matériel diélectrique joue un rôle important sur l'intensité du
plasma. Le changement des propriétés de la céramique affecte les paramètres de
décharge. Il a par ailleurs été trouvé que le nombre de micro-décharges augmente lorsque
qu'une céramique possédant une constante diélectrique plus élevée est utilisée. De plus, la
permittivité relative ou la constante diélectrique a une influence directe sur la production
d'hydrogène .
. De plus, dans l'intention d'améliorer l'efficacité du procédé, une nouvelle famille de
matériel diélectrique, titanate de bismuth sodium, a été investiguée. Une large gamme de
matériaux céramiques (de basse à haute permittivité) a été testée et les résultats obtenus
suite à ces analyses suggèrent que la conversion du CH4 en utilisant une haute barrière
diélectrique est plus élevée qu'avec l'utilisation de matériaux à barrière conventionnelle
comme l'alumine.
ii

ACKNOWLEDGEMENTS
Sorne people are lucky enough to have one exceptional advisor. 1 have had two.
Prof essor Robin A.L. Drew and Professor Janusz A. Kozinski. They have helped me to
overcome the grief of my parents passing and get back on track. They have always been
overwhelmingly generous with graduate students, but working with them 1 realized how
committed they are to training, supporting and encouraging their students. They never
gave up on me, and 1 would like to thank them both for how fast they corrected my thesis.
1 am grateful for aIl their effort and aIl their support.
1 am also grateful to my dear and close friends Fabian, Farzad and Ozzy, for the good
times and the bad times. They are pretty much co-authors of this work, and 1 consider
them to be my second set of advisers. 1 love you guys very much! Million thanks to
Guillermo (Memo) for aIl the unrestricted advices and for his great help and suggestions!
Mathieu (Prof. Brochu) 1 want to thank you so much for such a great sense of humor,
your vibrant spirit and for including me into McGill team from the early beginning.
There are a lot of friends that helped me and with which 1 shared grateful moments:
Claudia, Juan, Pierre-Lois, Jesse, Xhin, Laura, Nasser, Raed, Fadi, Tom, Andrew, Amr,
Hassan, Mirela, Farmaz, Ahmad, Rocco, Haled ...
1 also want to thank everyone from McGill that helped me and supported my: Monique,
Edwin, Ray, Hellen, Barbara, Carol, Nicky, Linda, and Jenny.
Special thanks to Precison H2, for those brainstorm meetings, to David Fletcher, Bonnie
and Dan for their encouragements and their positive attitude. 1 am grateful to Alexis,
Robert and Boutros for taking care of the electronic equipment. Everybody at UNB, Tom
and your team thanks for great discussions and encouragements.
111

Many thanks to Gregg K.rumme, from FERRO Corporation, for supplying the powders
and for aIl your great help and for useful suggestions
A special mention goes to my little sister Diana for everything that you are, for your
unconditional friendship and love.
My final thanks goes to Michael, my dissertation graphie artist, my husband and my best
friend. Thank you for being the shoulder to cry on and for loving me and supporting me
so much. 1 would have not done it without you ...
iv

TABLE OF CONTENTS
ABSTRACT ..................................................................................................... i , , ..
RESUME ......................................................................................................... Il
ACKNOWLEDGEMENTS ........................................................................... iii
TABLE OF CONTENTS ................................................................................ v
LIST OF FIGURES ........... , .......................................................................... viii
LIST OF TABLES ......................................................................................... xi
CHAPTER 1 .................................................................................................... 1
INTRODUCTION ....................................................................................... 1
CHAPTER2 .................................................................................................... 4
LITERA TURE REVIEW ............................................................................ 4
2.1.Alternative Hydrogen Production; Environmental Effect ..................................... .4
2.2.Non-Thermal Plasma .............................................................................................. 6
2.2.1.Definition ......................................................................................................... 6
2.2.2.The Chemistry ofNonequilibrium Discharges ................................................ 8
2.2.3.Dielectric Barrier Discharge (DBD) ................................................................ 9
2.2.3 .1.Effect of Applied Voltage ....................................................................... 11
2.2.3.2.Effect of Discharge Gap .......................................................................... 12
2.2.3.3.Effect of Dielectric Capacitance or Dielectric Constant.. ....................... 14
2.3.Ceramics for dielectric barrier discharge reactors ................................................ 19
2.3 .1.Dielectrics; Polarization ................................................................................. 19
2.3.2.Capacitance, Dielectric Constant, Permittivity .............................................. 20
2.3.3.Dissipation Factor (D.F. or tanô) ................................................................... 21
2.3.4.Dielectric Strength ......................................................................................... 23
2.3.5.Ferroelectrics ................................................................................................. 24
2.3.5 .1.Definition, Properties, Perovskite Structure ........................................... 24
2.3.5.2.Structure - Properties Relationships in High Permittivity Ceramics ...... 26
v
CHAPTER 3 .................................................................................................. 28
OBJECTIVES ............................................................................................ 28
CHAPTER4 .................................................................................................. 29
EXPERIMENTAL PROCEDURES .......................................................... 29
4.1.0verview of Approach ......................................................................................... 29
4.2.Experimental Set-up: Hydrogen Production ........................................................ 31
4.2.1.1.Dielectric Barrier Discharge Reactor .......................................................... 32
4.2.1.2.Power Supply .............................................................................................. 34
4.2.1.3.Microdischarge Analyzer ............................................................................ 35
4.2.1.4.Gas Chromatograph .................................................................................... 36
4.2.1.5.Functioning of the DBD System ................................................................ .37
4.3.Experimental Method-Ceramic Fabrication ........................................................ 39
4.3.1.Sample Preparation ........................................................................................ 39
4.3.2.Chemical Composition .................................................................................. 40
4.3.3 . Preparation of Ceramic Compositions .......................................................... .40
4.4.Characterization and Analysis Techniques ......................................................... .41
4.4.1.Particle Size Analysis .................................................................................... 41
4.4.2.Density Measurements ................................................................................... 42
4.4.3.Dielectric Characterization ........................................................................... .42
4.4.4.Dielectric Strength Measurement .................................................................. 43
4.4.5.Scanning Electron Microscopy ...................................................................... 44
CHAPTER 5 .................................................................................................. 45
RESULTS .................................................................................................. 45
5.1. Ceramic Testing in Dielectric Barrier Discharge Reactor ................................... .46
5.1.1.Alumina Ceramic Performance ..................................................................... 48
5.1.2.Performance ofK-3100 ceramic .................................................................... 56
5.1.3.Performance ofK-60 ceramic ........................................................................ 58
5.1.4.Performance ofK-IIOceramic ....................................................................... 61
VI
5.1.5.Performance ofK-166 ceramic ...................................................................... 63
5.2.ceramic fabrication ............................................................................................... 69
5.2.1.K-60 Ceramic ................................................................................................. 69
5.2.2.K-110 ceramic ............................................................................................... 72
5.2.3.K-166 ceramic ............................................................................................... 74
CHAPTER6 .................................................................................................. 76
DISCUSSION ............................................................................................ 76
6.1. Effect ofElectrical Parameters on Plasma Discharge ......................................... 77
6.1.1.Influence of the Applied Frequency .............................................................. 77
6.1.2.Influence of the Applied Voltage .................................................................. 78
6.1.3.Influence of the Input Power ......................................................................... 80
6.2.Effect of Residence Time on Plasma Discharge .................................................. 81
6.2.1.Influence of Discharge Gap ........................................................................... 81
6.2.2.Influence of Gas Flow ................................................................................... 84
6.2.3.Influence of Discharge Area .......................................................................... 84
6.3.Effect of Ceramic Properties on Plasma Discharge ............................................. 84
6.3 .1.Influence of Dielectric Strength ..................................................................... 85
6.3 .2.Influence of Dielectric Thickness .................................................................. 87
6.3.3.Influence of Dielectric Constant .................................................................... 87
6.4.Solid Product: Carbon .......................................................................................... 94
CHAPTER 7 .................................................................................................. 96
CONCLUSIONS AND FUTURE WORK ................................................ 96
7.1 Conclusions .......................................................................................................... 96
7.2 Recommendations for Future Work ..................................................................... 97
REFERENCES ............................................................................................ 99
VIl

LIST OF FIGURES
Chapter2
Figure 2.1 The reaction A+B ~ C+D [5] ............................................................................ 8 Figure 2.2 Dielectric barrier discharge electrode configuration [7] ................................... 1 0 Figure 2.3 (a) Discharge voltage profiles and (b) discharge energy consumption for
different voltage values [28] ...................................................................................... 12 Figure 2.4 The dependence of transferred charge value vs. gap width for oxygen [29] .... 13 Figure 2.5 Effect of gap distance on conversion and microdischarge current [30] ........... 13 Figure 2.6 Effect of gap size on microdischarge current and on ignition voltage [30] ...... 14 Figure 2.7 The dependence of the transferred charge on the specific capacitance of the
dielectric (d-discharge gap, ~-thickness of dielectric, E -relative permittivity) [29] .15 Figure 2.8 Dielectric permittivity influence on microdischarge current for different
operating voltage values [32] ..................................................................................... 16 Figure 2.9 Influence ofbarrier capacity on: a) current, b) the number ofproduced oxygen
radicals, c) photons reaching the dielectric [33] ........................................................ 17 Figure 2.10 Ceramic polarization when placed in an electric field .................................... 19 Figure 2.11 Phase diagram for a perfect capacitor (a) for a real capacitor (b) [39] ........... 22 Figure 2.12 The prototype perovskite crystal structure [41] .............................................. 26 Figure 2.13 Changes in dielectric constant of BaTi03 as function oftemperature [39] .... 27
Chapter 4
Figure 4.1 Flowchart of experimental procedure ............................................................... 30 Figure 4.2 Schematic Diagram of the Experimental Set-Up ............................................. 31 (1) Helium; (2) Natural Gas; (3) PPD reactor; (4) Ceramic Plate; (5) Power Supply; (6)
Step-Up Transformer; (7) Oscilloscope; (8) Microdischarge Analyzer; (9) Data Acquisition System; (10) Gas Chromatographer ....................................................... 31
Figure 4.3 Photo of the experimental setup ....................................................................... 31 Figure 4.4 Structure of Dielectric Barrier Discharge Reactor (DBD) ............................... 32 Figure 4.5 Dielectric Ceramic in DBD Reactor ................................................................ .33 Figure 4.6 Different electrode configurations ................................................................... .33 Figure 4.7 Pulser (a) Electrical waveform; (b) Apparatus ................................................ .34 Figure 4.8 Microdischarge analyzer ................................................................................... 35 Figure 4.9 View ofplasma ................................................................................................. 37 Figure 4.1 0 Dielectric ceramic inside the PPD reactor ...................................................... 37 Figure 4.11 Flow chart of the ceramic processing techniques ........................................... 39 Figure 4.12 Horiba Particle Size Distribution Analyzer LA-920 ..................................... .41 Figure 4.13 A schematic diagram of the apparatus used for the capacitance measurements
.................................................................................................................................... 43
Vlll
Chapter 5
Figure 5.1 Alumina coupons before (a) and (b) after the experiment.. .............................. 50 Figure 5.2 Influence of applied voltage on microdischarges ............................................. 50 Figure 5.3 Influence ofapplied frequency on the number ofmicrodischarges for alumina
ceramic at different applied voltages ......................................................................... 51 Figure 5.4 Plasma intensity for two different discharge gaps ............................................ 52 Figure 5.5 Influence of applied voltage on hydrogen yield for K-9 ceramic at 3500 Hz .. 54 Figure 5.6 Variation of ceramic and gas temperature for 6 hour operating time at 7000V
and 3500 Hz ............................................................................................................... 55 Figure 5.7 Number ofmicrodischarges versus time for K-9 ceramic ................................ 55 Figure 5.8 Influence of electrode area on hydrogen yield at 3500 Hz and various voltages
.................................................................................................................................... 56 Figure 5.9 Number ofmicrodischarges versus time for K-3100 ceramic .......................... 57 Figure 5.10 Effect of Frequency on microdischarges for K-60 ceramic at 5000V and
RND-2 electrodes ....................................................................................................... 58 Figure 5.11 Frequency influence on hydrogen yield at different applied voltages for K-60
ceramic ....................................................................................................................... 59 Figure 5.12 Influence of applied voltage on microdischarges for K-60 ceramic at 3500Hz
.................................................................................................................................... 59 Figure 5.13 Applied voltage influence ofhydrogen yield for K-60 ceramic at 3500Hz ... 60 Figure 5.14 Frequency influence on microdischarges for K-IlO ceramic at 4200 V ........ 61 Figure 5.15 Influence ofapplied frequency for K-II0 ceramic at 4200 V ........................ 62 Figure 5.16 Influence of applied voltage on hydrogen yield for K-II0 ceramic ............... 62 Figure 5.17 Discharge gap influence on plasma ignition for K-166 ceramic at 2500 Hz
and RND-2 electrodes ................................................................................................ 64 Figure 5.18 Discharge gap influence on gas temperature for K-166 ceramic at ignition
voltages and 2500Hz electrodes RND-2 .................................................................... 64 Figure 5.19 Influence of applied frequency on power consumption for K -166 ceramic at
3250V and RND-2 electrodes .................................................................................... 65 Figure 5.20 Frequency influence on plasma intensity for K-166 ceramic at 3500 V and
RND-2 electrodes ....................................................................................................... 66 Figure 5.21 Effect ofapplied voltage on hydrogen yield for K-166 ceramic at 3500 Hz
and RND-2 electrodes ................................................................................................ 67 Figure 5.22 Variance of microdischarges versus time ....................................................... 67 Figure 5.23 Partic1e size analysis and cumulative size distribution for K-60 ceramic ...... 70 Figure 5.24 Firing profile for K-60 ceramic ...................................................................... 70 Figure 5.25 Change in capacitance for K-60 ceramic ........................................................ 72 Figure 5.26 Partic1e size distribution for K -110 ceramic ................................................... 72 Figure 5.27 Firing profile for K-II0 ceramic .................................................................... 73 Figure 5.28 Change in Capacitance for K-IlO Ceramic .................................................... 74 Figure 5.29 Partic1e size distribution for K -166 ceramic ................................................... 74 Figure 5.30 Firing profile for K-166 ceramic .................................................................... 75 Figure 5.31 Change in capacitance for K-166 ceramic ...................................................... 75
IX

Chapter6
Figure 6.1 Hydrogen yield as a function of applied voltage for K-9 ceramic ................... 79 Figure 6.2 Influence of power consumption of hydrogen yield for different ceramics ..... 80 Figure 6.3 Influence of gap distance on plasma generation for K-9 ceramic for Smooth
(SQR) and Coarse (SQR-l) electrodes ...................................................................... 83 Figure 6.4 Breakdown for commercial ceramics ............................................................... 85 Figure 6.5 Breakdown for phase II dielectric ceramics ..................................................... 86 Figure 6.6 Influence of dielectric thickness for K-166 ceramic at different voltages ........ 87 Figure 6.7 Onset voltage versus ceramic dielectric constant.. ........................................... 88 Figure 6.8 Influence of ceramic permittivity on the number ofmicrodischarges .............. 89 Figure 6.9 Hydrogen yield function as dielectric constant and power consumption ......... 90 Figure 6.10 Influence of relative permittivity on hydrogen yield at 5000 V, 3500Hz, 0.63
mm gap ....................................................................................................................... 92 Figure 6.11 Influence of applied voltage on hydrogen yield for different permittivity
ceramics ..................................................................................................................... 93 Figure 6.12 Carbon particles characteristics as observed from SEM ................................ 95
x

LIST OF TABLES
Chapter 2
Table 2.1 Microdischarge characteristics [7] ..................................................................... 11 Table 2.2 Plasma onset voltage for different ceramic relative ........................................... 15 Table 2 3 Dielectric constant of different materials at 25°C .............................................. 24 Table 4.1 Geometry ofmetallic electrodes ........................................................................ 34 Table 4.2 Parameters varied in the process ........................................................................ 38 Table 4.3 Phase II - Ceramic Compositions ...................................................................... 40 Table 4.4 Ceramic oxide compositions .............................................................................. 40
Chapter 5
Table 5.1 Commercial ceramic used for Phase 1 testing .................................................... 47 Table 5.2 Medium permittivity ceramics used for Phase II testing - Compositions ........ .48 Table 5.3 Medium permittivity ceramics used for Phase II testing - Properties .............. .48 Table 5.4 Values of electrical properties ofvarious grades of alumina ceramic .............. .48 Table 5.5 Experimental results with different grades ofalumina ...................................... 49 Table 5.6 Discharge gap influence on number of microdischarges ................................... 52 Table 5.7 Reaction area influence on the number ofmicrodischarges .............................. 53 Table 5.8 Experimental conditions for K-9 ceramic .......................................................... 53 Table 5.9 Experimental results for K-9 in optimal conditions ........................................... 53 Table 5.10 Power consumption for K-9 ceramic at various applied voltages and
frequencies ................................................................................................................. 54 Table 5.11 Experimental conditions for K-31 00 ceramic .................................................. 56 Table 5.12 K-3100 plate performance ............................................................................... 57 Table 5.13 Experimental conditions for K-60 ceramic ...................................................... 60 Table 5.14 K-60 Performance ............................................................................................ 60 Table 5.15 Experimental conditions for K-II0 ceramic .................................................... 61 Table 5.16 Optimum experimental conditions for K-110 ceramic .................................... 63 Table 5.17 Performance ofK-110 ceramic ........................................................................ 63 Table 5.18 Summary of the power value statistics for different frequencies ofK-166
ceramic 3250 V and RND-2 electrodes ..................................................................... 65 Table 5.19 Optimum experimental conditions for K-166 reactor ...................................... 68 Table 5.20 K-166 ceramic performance ............................................................................ 68 Table 5.21 Densities ofK-60 ceramics .............................................................................. 71 Table 5.22 Relative densities of the KIlO sintered disks .................................................. 73
Xl
CHAPTERI
INTRODUCTION
The increasing demand in hydrogen due to economics and environmental considerations,
encourage development of nonconventional technologies such as plasma direct
conversion of methane into hydrogen and carbon black. Plasma discharges, either in
thermal or non-thermal regimes are expected to allow fuel flexible on-site hydrogen
generation. However, in spite of great research efforts in the field, plasma methods of
hydrogen production have still not reached commercial application. The most important
direction of investigation in this area is thermal plasma decomposition of natural gas [1,
2]. But the main drawback of thermal plasma is the high-energy consumption, resulting
from the high temperature operation.
Recently, some researchers have concentrated their efforts on studying the non-thermal
plasma generated by dielectric barrier discharge [3, 4]. The development of such a
technology is supported by economic considerations, since it is able to simulate the
decomposition reactions, employing much lower energies than the thermal processes. An
important characteristic of non-thermal plasma is its high electron temperature or "hot
electrons", while the temperature of the background gas remains as low as room
temperature [4]. The DBD reactors are characterized by the presence of one or more
dielectric layers in the current pathway between the metal electrodes in addition to the
1

Chapter 1 Introduction
discharge gap [5,6]. These dielectric layers play the important role ofbreaking down the
electric field in the gap in tiny filamentary discharges called microdischarges and
therefore to create a bulk type of plasma in which the methane molecules are dissociated.
Sorne operation parameters in DBD can easily be changed including electric parameters
such as applied voltage and applied frequency, residence time such as gas flow, discharge
gap, electrode area and electrode surface and dielectric ceramic permittivity or dielectric
constant. The discharge characteristics such as plasma intensity or number of
microdisharges and, consequently the yield products will be different with the different
parameters in DBD.
According to Eliasson et al. [5], the ceramic is the key factor in the proper functioning of
the assembly. Furthermore Kogelschatz et al. [7] sustains that the number of active
species in the plasma, such as radicals and ions are directly proportional to the
permittivity or dielectric constant of the dielectric. However, not too many studies have
been done on the influence of this important parameter on the discharge characteristics of
the reactor. Most of the research carried out in this area was limited to using silica glass
or alumina ceramic, which have low permittivities (K'= 4 and respectively K'= 9 for
alumina), and therefore there is a lack of information conceming the behavior of higher
permittivity ceramics in the DBD reactor. Hence a close examination of these parameters
and their influence on the hydrogen yield is necessary.
The major problem that occurs when using a commercial high dielectric ceramic as
dielectric barrier is that they tend to break in the plasma environment. The combination of
high voltage, and the increasing reactor's temperature results in failure of the ceramic.
Consequently, the desired ceramic for this process should have a relatively high dielectric
constant that increases with temperature and relatively good dielectric strength.
Therefore, the present research focuses special attention on the ceramic material and the
influence of ceramic properties on the discharge characteristics of the reactor. The first
goal was to evaluate the possibility of using existing commercial ceramics (Phase 1 of the
research program). Very little data were collected form this part of the study due to
2
Chapter 1 Introduction
repeated failure of the ceramic coupons. In order to overcome this challenge and to be
able to examine the influence of operating parameters on the DBD characteristics, a
reliable ceramic was needed. Thus, the technical effort in Phase II has been structured to
overcame the specific problems i.e. breakdown and failure of the ceramic, encountered in
the initial series of tests. Because ceramic reliability and longevity has a dominant
influence over the feasibility of the process, we concentrated our efforts accordingly and
thus the principal interest area in Phase II was to fabricate medium permittivity dielectric
ceramics (K' between 60 to 170) with stable performance up to 125° C. The candidate
materials will be presented in detail in Chapter 5. They were premixed ceramic powders
supplied by Ferro Corporation and they were selected on the basis of their composition,
their dielectric constant values and their dielectric strength. They were fabricated by
conventional ceramic sintering method described in Chapter 5.
Based on this overall objective a Iiterature review of dielectric barrier discharge process
with a concentration on the ceramic role and properties as weIl as a background on the
compositional modifications of high permittivity ceramics will be given in Chapter 2. In
Chapter 3 the defined goals of this work will be presented, then in Chapter 4 the
experimental set-up and characterization techniques will be described. The results of the
two area of interest, namely dielectric barrier discharge reactor and dielectric ceramics i.e.
fabrication and dielectric properties will be shown in Chapter 5. In Chapter 6 the obtained
results from the previous chapter will be discussed and analyzed. Conclusions and
recommendation for future work are given in Chapter 7.
3
Chapter2 Literature Review
CHAPTER2
LITERA TURE REVIEW
2.1.ALTERNATIVE HYDROGEN PRODUCTION; ENVIRONMENTAL EFFECT
One of the major environmental problems facing mankind is global warming. The
extensive consumption of fossil fuel in the recent years has caused a continuing increase
in C02. The presence in the atmosphere of this infrared absorbing gas together with other
gases such as methane, ozone, nitrous oxide, and chlorofluorocarbons leads to an increase
of greenhouse effect. Recently many researchers have been performed to develop novel
technologies for clean sources of energy that would allow mitigation of green house
emissions. If the goal is to minimize the emissions of greenhouse gases, then clean
sources of energy such as hydrogen should be the ultimate solution for energy and
environment.
Hydrogen is a great energy carrier. It has fascinated generations of people for centuries
including visionary minds like Jules Verne. A significant part of the hydrogen produced
in the world cornes from methane [8]. Several methods are available for hydrogen
production, from which one of the most widely used is methane or natural gas reforming.
4

Chapter2 Literature Review
In this process, methane is oxidized by H20, yielding a mixture of hydrogen and carbon
monoxide:
(Equation 2.1)
Even though hydrogen formation at the atmospheric pressure is thermodynamically
favourable at temperatures above 800°C, temperatures higher than 1000°C are necessary
to achieve high-conversion rates in non-catalytic systems. Industrially steam reforming is
produced over a Ni/Ah03 catalyst [9].
The typical problem is the tendency of carbon deposition on the catalyst. The gas-water
shift reaction can be applied to increase the yield ofhydrogen:
(Equation 2. 2)
A big disadvantage of such a process is that the production of hydrogen is accompanied
by the emission of large quantities of CO and C02 into the atmosphere; one part coming
from the conversion and another as a result of the combustion of a part of the methane.
Hydrogen is also produced from natural gas by partial oxidation:
(Equation 2.3)
The overall efficiency of the process (50%) is less than that of a stem reforming (65-
75%), and a source ofpure oxygen is required [10,11].
Even though hydrogen may be considered as a clean energy source, the majority of
industrial production generates about four tons of C02 for one ton of hydrogen. If it were
possible to generate H2 without Green House Gas emissions it would help meeting the
ambitious Kyoto targets. Therefore, novel processes of hydrogen production should be
explored.
5
Chapter2 Literature Review
Plasma discharges, either in thermal or non-thermal regimes, have been experimentally
tested for hydrogen reforming [1, 12-15], for ozone generation [16], and destruction of
NOx, SOx, H2S, NH3 and volatile organic compounds [5,17-22]. The main drawback of
thermal plasma methods is the high-energy consumption resulting from high-temperature
operation.
On the other hand, non-thermal plasma is able to stimulate the chemical reactions
employing an amount of energy much lower than the energy required by thermal
treatments, since the energy is not consumed in heating the bulk gas but is directed in the
production ofhigh-energy electrons. Radicals, ions and other active species are efficiently
produced via electron-impact dissociation, excitation and ionization of target gases. The
main reaction that governs the cracking of methane in a non-thermal barrier discharge
reactor is:
CH4(g) ~ C(s) +2H2(g) L\Ho = 75 kJ/mol (Equation 2.4)
The principle of the pro cess is to directly split the hydrocarbon into carbon black and
hydrogen thanks to an external energy supply while an incomplete combustion was used
to crack C-H bonds [15]. The plasma process under development is environmental
friendly, which allows a better use of the natural gas due to conversions ofhydrocarbons
into only carbon black (100% carbon yields, no C02 release) and the production of pure
hydrogen as a valuable product.
2.2.NON-THERMAL PLASMA
2.2. 1. Definition
Plasmas are produced when agas is heated to a very high temperature or exposed to an
electrical discharge. They contain a very large number of charged particles or ions. The
electrical discharge that takes place between a cloud and ground ionizes the air in its path
6
Chapter2 Literature Review
creating an arc of plasma or a filamentary discharge known as lightning. Non-thermal
plasmas are characterized by conditions in which species are not in thermal equilibrium
and in which electrons, ions and neutral species have different temperatures and kinetic
energies, with the electrons having the highest temperature due to their smaller mass.
Electrons in non-thermal plasmas are very energetic (1-10eV) allowing them to create
free radicals, which are used to crack the C-H bonds from methane molecules.
The inherent problem that occurs in plasma generated at atmospheric pressure is that it
will always turn into an arc or filamentary electrical discharge - this being the most stable
discharge at atmospheric pressure.
However, in order to create ions and radicals - chemical reactive species, which normally
form at high heat - that would further stimulate dissociation in the background gas, a
bulk-type of plasma, is desirable. This is possible using a dielectric as a discharge barrier,
placed normally in the current path between the metal electrodes. Buss et al. [23]
observed that if an ac voltage is applied to the electrode system separated by a dielectric
barrier discharge (DBD), (in a plane parallel gap) the gas breakdown occurs in a number
of individual tiny breakdown channels, more recently referred to as microdischarges.
During its development, charge carfIers collect and charge up the dielectric (either
negatively or positively, depending on the polarity), reducing the electric field in the gas
and hence quenching the microdischarges before they escalate enough to collapse into an
arc. By altemating the polarity very rapidly back and forth, it is possible to create large
volume plasma that is switching on and off so fast that it appears steady. Since the
chemical reactions are much slower than the plasma generation, the dissociation is a
continuous process.
Without the DBD only a few localized intense arcs would develop in the gas between the
metal electrodes. With a dielectric present between the electrodes, and with voltages
between 2-10 kV at frequencies between 1-5 kHz, substantial quantities of plasma are
created by a large number of microdischarges in the gas.
7
Chapter2 Literature Review
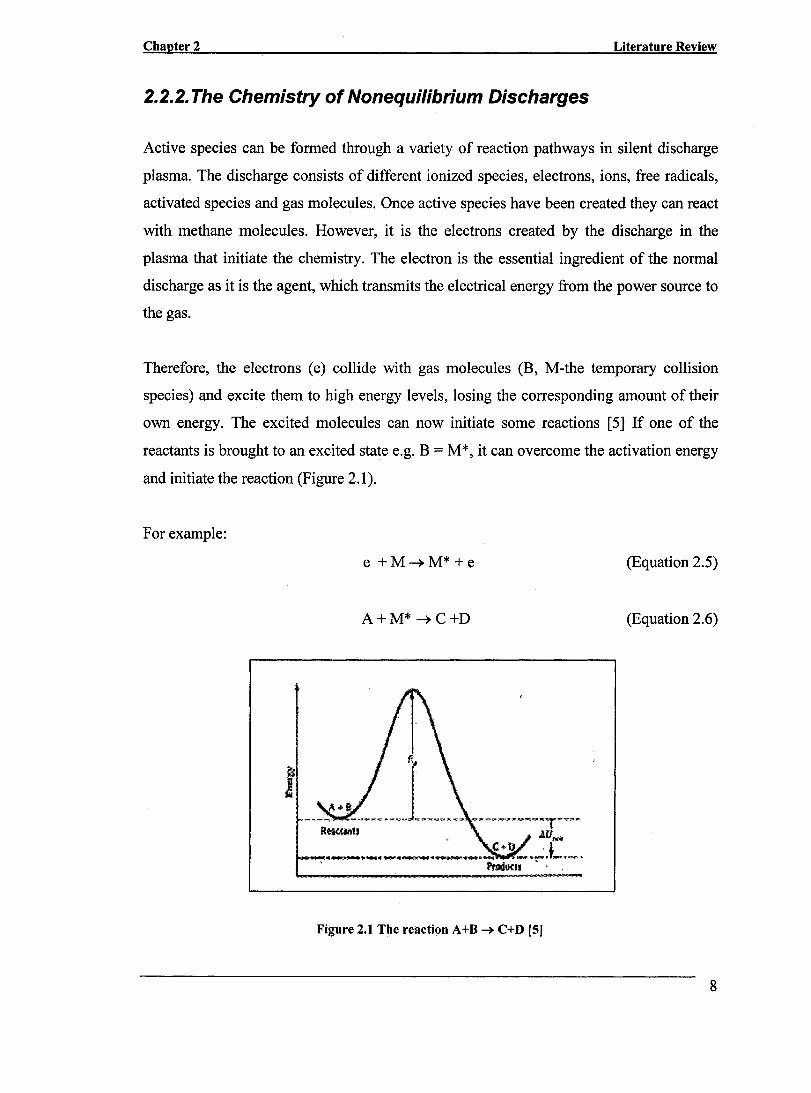
2.2.2. The Chemistry of Nonequilibrium Discharges
Active species can be formed through a variety of reaction pathways in silent discharge
plasma. The discharge consists of different ionized species, electrons, ions, free radicals,
activated species and gas molecules. Once active species have been created they can react
with methane molecules. However, it is the electrons created by the discharge in the
plasma that initiate the chemistry. The e1ectron is the essential ingredient of the normal
discharge as it is the agent, which transmits the electrical energy from the power source to
the gas.
Therefore, the electrons (e) collide with gas molecules (B, M-the temporary collision
species) and excite them to high energy levels, losing the corresponding amount of their
own energy. The excited molecules can now initiate sorne reactions [5] If one of the
reactants is brought to an excited state e.g. B = M*, it can overcome the activation energy
and initiate the reaction (Figure 2.1).
For example:
e +M~M* +e (Equation 2.5)
A+M* ~C+D (Equation 2.6)
Figure 2.1 The reaction A+B ~ C+D [5J
8

Chapter2 Literature Review
Since the reaction A + M ~ C + D might take place only at high temperatures as in
methane conversion, there is actually the reaction (6) that initiates the production of
species C and D.
The basic reactions that take place in the DBD process are listed below. These are not aIl
the possible reactions that take place but only a schematic of the reaction mechanism. A
more detaillist could be found in the literature [24,25].
Free radicals
These species play a leading role in the chemistry of the discharge. Usually the free
radical reactions occur very rapidly and they are multi-step processes. The reaction
usually proceeds by the hydrogen abstraction mechanism.
Initiation:
Propagation:
Termination:
CH4 + e ~ CH3- + H- + e
CH3- + CH4 ~ C2H6 + H
H- + CH4~CH3- + H2
H-+H-~H2
CH3- + H- ~ CH4
CH3- + CH3- ~ C2H6
2.2.3.Die/ectric Barrier Discharge (DBD)
(Equation 2.7)
(Equation 2.8)
(Equation 2.9)
(Equation 2.10)
(Equation 2.11)
(Equation 2.12)
The most important characteristic ofDBDs is that non-equilibrium plasma conditions can
be achieved at elevated pressures, e.g. atmospheric pressure. There is a remarkable
flexibility of DBD configurations with respect to geometry, operating medium and
parameters.
Typical electrode configurations of planar and cylindrical dielectric-barrier are presented
in Figure 2.2 [7]. DBDs are characterized by the presence of one or more dielectric
9
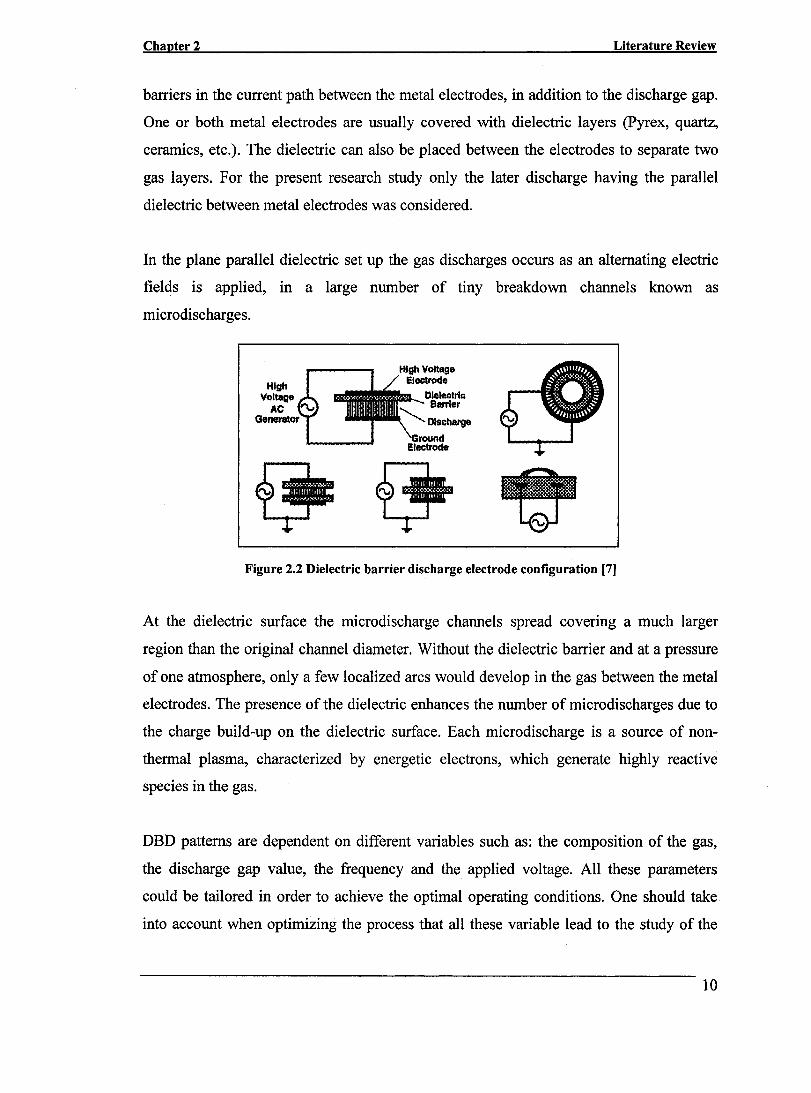
Chapter2 Literature Review
barri ers in the current path between the metal electrodes, in addition to the discharge gap.
One or both metal electrodes are usually covered with dielectric layers (Pyrex, quartz,
ceramics, etc.). The dielectric can also be placed between the electrodes to separate two
gas layers. For the present research study only the later discharge having the paraUel
dielectric between metal electrodes was considered.
In the plane parallel dielectric set up the gas discharges occurs as an alternating electric
fields is applied, in a large number of tiny breakdown channels known as
microdischarges.
High Voltage
AC
Figure 2.2 Dielectric barrier discharge electrode configuration [7]
At the dielectric surface the microdischarge channels spread covering a much larger
region than the original channel diameter. Without the dielectric barrier and at a pressure
of one atmosphere, only a few localized arcs would develop in the gas between the metal
electrodes. The presence of the dielectric enhances the number of microdischarges due to
the charge build-up on the dielectric surface. Each microdischarge is a source of non
thermal plasma, characterized by energetic electrons, which generate highly reactive
species in the gas.
DBD patterns are dependent on different variables such as: the composition of the gas,
the discharge gap value, the frequency and the applied voltage. AlI these parameters
could be tailored in order to achieve the optimal operating conditions. One should take
into account when optimizing the process that aIl these variable lead to the study of the
10

Chapter 2 Literature Review
parameters of microdischarges in the discharge gap, since the charge transfer occurs in
them and this not only affects the electric field in the discharge gap but also enhances the
excitation of the gas medium, which leads eventually to a change in its composition.
Therefore, microdischarge properties should be an important factor for DBD optimum
efficiency.
At the dielectric, these microdischarges spread into surface discharges that can cover a
much wider area. Typical parameters for air discharges in a 1 mm gap are presented in
Table 2.1 [7].
Table 2.1 Microdischarge characteristics [7J
Duration: 1O-9_1O-8s Total Charge: Filament Radius: 100mm Electron Density: CUITent Density: 100-1000 A/cm2 Electron Energy:
2.2.3.1.Effect of Applied Voltage
IO-IO_IO-9C 1020_102Im3
1-lOeV
There is a series of parameters that influence the microdischarge properties. One of them
is the applied voltage. It was found that the number of microdischarges is proportional to
the voltage applied on the electrodes [26]. When the external voltage, and consequently
the internaI applied field is increased the density of high-energy electrons within the gap
mcreases.
The increase in the number of electrons may result in higher probability of breaking the
bond between the hydrogen and carbon in methane molecules and thus increase both the
degree of methane dissociation and conversion.
This fact is furthermore confirmed by Kogelschatz [6], which affirms that high voltage
operations tend to spread and increase the number of microdischarges. This is partially
sustained by Kozlov et al. [27], who found that the number of microdischarges per unit
length of electrode is more pronounced with applied voltage for not too elevated voltage
values.
11
Chapter 2 Literature Review
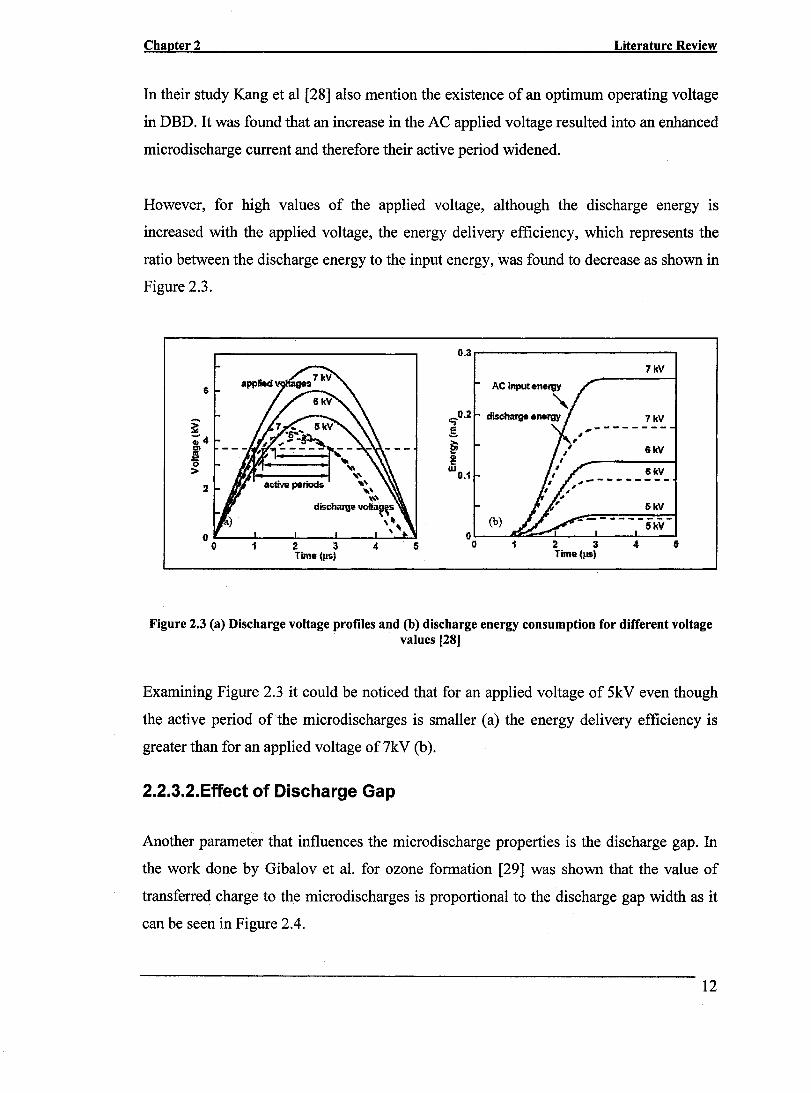
In their study Kang et al [28] also mention the existence of an optimum operating voltage
in DBD. It was found that an increase in the AC applied voltage resulted into an enhanced
microdischarge current and therefore their active period widened.
However, for high values of the applied voltage, although the discharge energy is
increased with the applied voltage, the energy delivery efficiency, which represents the
ratio between the discharge energy to the input energy, was found to decrease as shown in
Figure 2.3.
0.3
7kV
$
..... t:)0.2 7kV ~ .s .... 4 >.
1 El 6kV !
> 111 0•1 6kV
2
5kV
(b) ----------5kV
() ° ° 2 3 4 5 ° 2 3 4 5 Time (jl$) Time (jl$)
Figure 2.3 (a) Discharge voltage profiles and (b) discharge energy consumption for different voltage values [28]
Examining Figure 2.3 it could be noticed that for an applied voltage of 5kV even though
the active period of the microdischarges is smaller (a) the energy delivery efficiency is
greater than for an applied voltage of7kV (b).
2.2.3.2.Effect of Discharge Gap
Another parameter that influences the microdischarge properties is the discharge gap. In
the work done by Gibalov et al. for ozone formation [29] was shown that the value of
transferred charge to the microdischarges is proportional to the discharge gap width as it
can be seen in Figure 2.4.
12

Chapter2 Literature Review
q (WDC 1 t,/6 ., 1 ., + 2 +
0 1.0 0 ~
+
0
+ 1)
+ ., 0.5 1)
0/' 0/ •
0/ 0"'''
!Il'-o. .....
-............-2 3
d(mm}
Figure 2.4 The dependence of transferred charge value vs. gap width for oxygen [29]
50 0.6
40 0.5 -'fi. 0.4 (') -c: 30 t: 0 ... _.
O~S ;; f D .. 20 .... :- 0.2 ;; t: 0 -(,) 10 0.1
0 CH4
0 8 10 12 14
Gap d'.lattCé (m m,
Figure 2.5 Effect of gap distance on conversion and microdischarge current [30]
The explanation resided in the fact that with an increase in the gap value, the initiating
gas breakdown voltage increased, the microdischarge current decreased and, therefore,
the number of electrons with energies capable of initiating reactions decreased. This
theory is in perfect agreement with the work done by Murata et al. [30] showing that the
larger the gap discharge is, the lower the current (Figure 2.5). They also affirmed that the
plasma ignition voltage increased with the inter-electrode distance (Figure 2.6).
13

Chapter 2 Literature Review
50
40
30
2,0
.' .'
....... •••••
2,5
~ ... ' ....
v,kV
3,0 3,5 4,0
Figure 2.6 Effeet of gap size on microdiseharge current and on ignition voltage [30J
Furthermore, Cal et al. [31] stated that as the gap spacing increased more energy must be
deposited in the gas stream to breakdown benzene molecules. AIso, the reactor with 5mm
gas spacing required about three times the amount of power compared to the reactor with
3mm gap to achieve the same benzene destruction rate efficiency. This could be
explained by the fact that when the discharge gap is increased, the residence time of
reaction decreases.
Consequently the probability that each methane molecule successfully interacts with any
of the sufficiently energetic electrons also decreases, which results in a drop in methane
conversion. Therefore, the actual quality of charge transferred to the microdischarges
depends also on the design parameters of the discharge arrangement e.g. on the width of
the discharge gap.
2.2.3.3.Effect of Dielectric Capacitance or Dielectric Constant
However, the most important parameter that influences the charge transferred ln a
microdischarge is the specific capacitance of the dielectric barrier. It was shown that the
increase in the specific capacitance leads to a proportional increase in a transferred charge
reaching lOO-200nC for a 1mm discharge gap in air, [29] aiso illustrated in Figure 2.7.
14

Chapter2
100
nO mm
[10. ~ d
1
0.1 +--...--..,......,,.....,... .......... ...,-------......-....... .,.......,. ........ .......,..-1 10 mm'; 100
e/A----
Literature Review
Figure 2.7 The dependence of the transferred charge on the specific capacitance of the dielectric (ddischarge gap, A-thickness of dielectric, e -relative permittivity) [29]
The discharge gap and the thickness of the dielectric are geometric factors that may be
tailored to the specific needs but dielectric permittivity it is a material related property so
it would be interesting to investigate its influence on DBD discharge characteristics.
In their research Gibalov et al, [30] showed the influence of relative dielectric constant on
the ignition voltage. The higher the permittivity, the lower the plasma onset voltage
(Table 2.2),
Table 2.2 Plasma onset voltage for different ceramic relative
1 Onset Vo~tage (kV) 1
5 10 15
2.4 1.9 1.8
Furthermore, it was aiso stated [32] that microdischarge characteristics practically do not
depend on the type of operating gas but mainly on the capacitance of the arrangement,
which is closely re1ated to the dielectric relative permittivity.
15
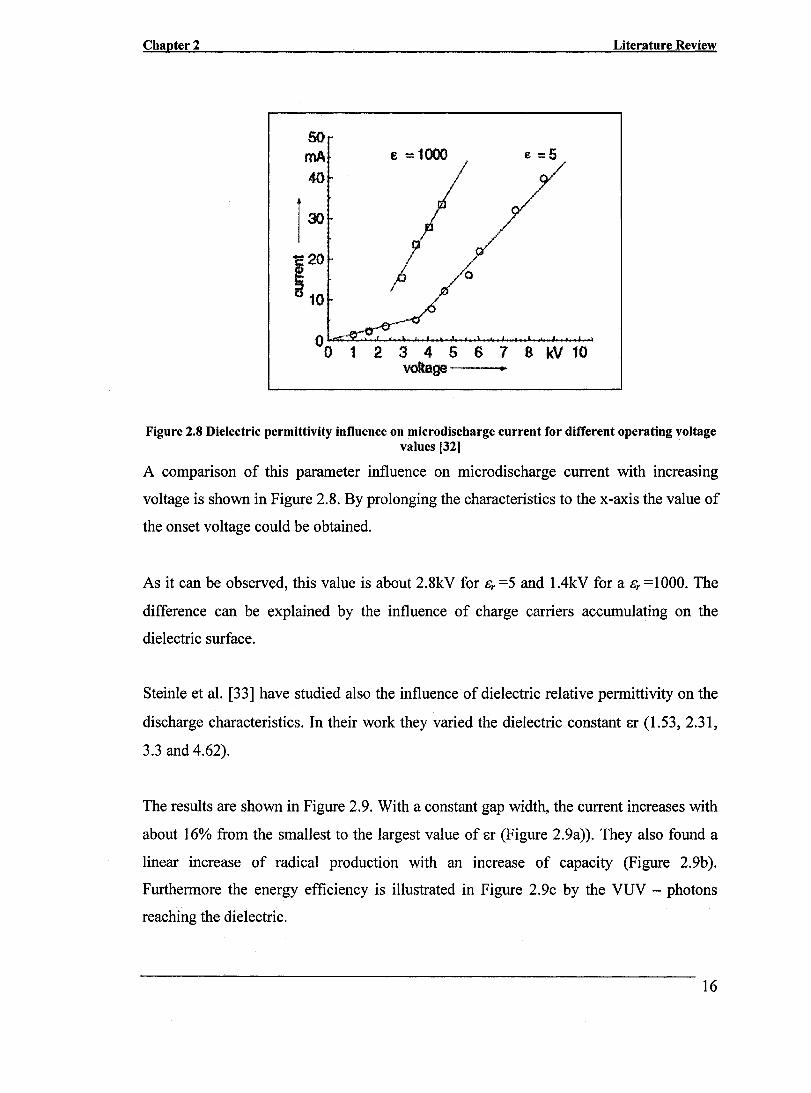
Chapter 2 Literature Review
50 mA E == 1000 E =5
40
[31 'E20 m ij 10
~#_~ °0 1 2 3 4 5 6 7 8 kV 10
voltage •
Figure 2.8 Dielectric permittivity influence on microdischarge current for different operating voltage values [32]
A comparison of this parameter influence on microdischarge current with increasing
voltage is shown in Figure 2.8. By prolonging the characteristics to the x-axis the value of
the onset voltage could be obtained.
As it can be observed, this value is about 2.8kV for Gr =5 and l.4kV for a Gr =1000. The
difference can be explained by the influence of charge carriers accumulating on the
dielectric surface.
Steinle et al. [33] have studied also the influence of dielectric relative permittivity on the
discharge characteristics. In their work they varied the dielectric constant Er (1.53, 2.31,
3.3 and 4.62).
The results are shown in Figure 2.9. With a constant gap width, the current increases with
about 16% from the smallest to the largest value of Er (Figure 2.9a». They also found a
linear increase of radical production with an increase of capacity (Figure 2.9b).
Furthermore the energy efficiency is illustrated in Figure 2.9c by the VVV - photons
reaching the dielectric.
16

Chapter2 Literature Review
--I.. .. \Vith d=coust --II,., \Vithd=conilt --'VIrY \Vith d=COliiit
-x-I .... \Vith e =const -_II,., \VÎtllIl,=C,oust -)C-#v\Jv with _,=const f
65 r 2,4 <II'""
1 s: 5,0 x s: X -~ 2~2 <.>
'C 4,5 li 55 El li '" i 2,0 t: 4J 4,0 1:3 al '5.
1,8 <:! 1 45 ~ 0 3,5 ~
l>Il 1,6 '" e § ... 40 11 3,0
'" j ~
1.1 1,4 35 l' ~ e 1 :> 2,5 ::;1 0:::.. 1,2 i:::> e ~ :> 2,0
i 25 1,0 .... J 0
'" 1,5 li ..
0,8 .0
4- 6 8 10 12 S 4 6 g 10 12 I:i i
capaeîty per arem [pF cm-'.1] capacity per: area [pF enil] capacity per: aRa {pFcm-'.1J (;a) (b) (~)
Figure 2.9 Influence of barrier capacity on: a) current, b) the number of produced oxygen radicals, c) photons reaching the dielectric [33]
Therefore, the strength of a microdischarge can be characterized by the amount of charge
transported by a microdischarge or by the energy density deposited in the discharge
channel after termination of the CUITent flow.
Since the interruption of the current in an individual microdischarge is caused by the local
reduction of the electric field due to space-charge accumulation on the dielectric, the
microdischarges can be influenced by changing the capacitance of the assembly, such as
thickness of the dielectric or the dielectric constant of the dielectric barrier. In the same
time, the thickness of the dielectric could be minimized to a certain extend, due to the fact
that the ceramic has to block the passage of the applied high voltage field necessary to
ensure the high energetic electrons (1-1 Oe V) requested to create free radicals.
Therefore, the dielectric constant of the ceramic should be the most important variable to
work in order to increase the capacitative effect of the barrier, which in turn will reduce
the electric field and further microdischarges will occur at other positions in the gap.
The efficiency of plasma chemical reaction is expected to increase by increasing the
permittivity of the ceramic barrier, since the transported charge, which leads to excitation,
17
Chapter 2 Literature Review
dissociation or ionization of plasma reaction is proportional to the permittivity of the
dielectric [6]. However, a high permittivity ceramic tends to fail when subjected to high
electric fields, and that is why up until now DBD reactors have been operated with low
permittivity materials such as quartz and alumina. Consequently for a good reactor
performance, the ceramic dielectric should manifest high permittivity and relatively good
dielectric strength.
Another aspect that should be taken into consideration is the environment in which these
ceramics have to operate and especially the temperature aspect since ceramic properties
are temperature dependent, as will be discussed more in detail in the following section.
According to Kappes et al [34], a strong temperature rise of the reactor was observed
when the plasma was ignited. They investigated this heating effect and it appears that
more than 60% of the electrical energy input is spent for heating of the dielectric barrier.
This effect was found to be independent of the gas type or the presence of chemical
conversion.
In the same time, Nozaki et al. [35] had the same findings. Particularly 60% of input
power was transferred to the dielectric barrier due to surface charge formation on the
dielectric material. Moreover, their results showed that the gas temperature of
microdischarges observed in the actual DBD reactor exceeded the average gas
temperature by 100 K [36]. So the ceramic temperature increases due to microdischarge
formation with around lOOK.
Therefore, the ideal ceramic for DBD should not be temperature sensitive; moreover it
should manifest increasing dielectric properties with temperature.
18

Chapter2 Literature Review
2.3.CERAMICS FOR DIELECTRIC BARRIER DISCHARGE REACTORS
2.3. 1. Die/ectrics; Polarization
Dielectric properties are of special importance when ceramics are used either as capacitor
elements or as insulators. The dielectric constant, dielectric loss factor, and dielectric
strength usually determine the suitability of a particular material for such applications.
The variation of dielectric properties with frequency and field strength influence the
performances. Furthermore, environmental effects such as temperature also influence the
dielectric applications. Therefore, it is necessary to examine dielectric theory in terms of
material response, circuit response, and environmental response. Ceramics as dielectric
materials have definite advantages over plastics, which are major competitors. They
possess superior electrical properties, are absent from creep or deformation under stresses
at room temperature, and resist environmental changes, particularly at high temperature
where plastics oxidize, gasify or decompose.
Charge
Dielectric
"Extra" Charge attracted by the Charge in Dielectric
Figure 2.10 Ceramic polarization when placed in an electric field
Although dielectrics do not conduct electric current, when an electric field is applied, a
slight shift in the balance of charge within the material will occur to create an electrical
19
Chapter2 Literature Review
dipole, which is the displacement of positive and negative charges in opposite directions
(Figure 2.10). There are different mechanisms of polarizations and they can be explained
in detail in the literature [37].
However, one polarization mechanism needs further attention: ferroelectric polarization.
(a), which is present in sorne ionic crystal s, called ferroelectrics that have symmetries
which allow them to have spontaneous ionic polarization in the absence of an electric
field.
Due to this polarizations mechanism, in limited temperature ranges sorne ferroelectrics
can have dielectric constants of several thousands.
2.3.2.Capacitance, Die/ectric Constant, Permittivity
Dielectric responses result from the motion of charge carriers under the influence of an
applied electric field. The motion of the charges leads to the storage of electrical energy
and the capacitance of the dielectric. Capacitance is a measure of the ability of any two
conductors in proximity to store a charge Q, when a potential difference Vis applied
across them [37].
c = Q = coulombs( C) = Farad (F) V Volts (V)
(Equation 2.13)
The capacitance of a vacuum capacitor is determined purely by the geometry. The charge
density on the plates, Q is proportional to the area A (in square meters) and the electric
intensityapplied E = %' where dis the distance between the plates (in meters).
The proportionality constant is defined as 80, the permittivity of free space, and is equal to
8.854 x 10⁻¹² C2/m2 or F/m.
20
Chapter 2 Literature Review
Thus, the capacitance of a parallel plate capacitor (with vacuum between plates) will be
equal to:
where
Q = qA = ±60EA = 60(%)A
C - QI _ 60(V Id)A - Ald 0- 7v - V - 60
q=charge per unit area
d=separation in meters
A=area in square meters
(Equation 2.14)
(Equation 2.15)
When a material is placed between the plates the capacitance is increased. The dielectric
constant is the ratio of the amount of energy stored in the dielectric to that stored by
vacuum occupying the same volume. It is a measure of electric storage ability or
capacitance.
K'=~ = eAld = 6
Co BoAI d Bo (Equation 2.16)
where e is the permittivity of the dielectric material, also in units C2/m2 or F lm, thus the
dielectric constant of material (or the relative dielectric constant K ') is the ratio of the
permittivity of the material to the permittivity of the free space.
The charge stored in a typicallinear capacitor is on the order of microcoulombs (10·6C) or
picocoulombs (10· l2C). So permittivity is ordinary in the range of microfarads/meter or
picofarads/meter.
2.3.3.Dissipation Factor (D.F. or tanb)
With altemating voltages, a charge stored on a dielectric material has both real (in phase
le -Fig 2.11 b) and imaginary (out of phase- li) components. This is caused by the resistive
21

Chapter 2 Literature Review
leakage or dielectric absorption [38]. The latter contribution to the dielectric loss is a
dissipation of energy associated with polarization, rotation or oscillation of dipoles. As a
result, a loss is expressed as the ratio of the out-of phase components to the in phase
components. The tangent of the angle loss is called dissipation factor or dielectric loss. In
other words, when CUITent and field are exactly 90° out of phase, there is no energy loss;
energy flows into and out of the dielectric reversibly (ideal dielectric - Figure 2.11a)
(a) (b)
le
le 1 1
\ 1 1 1 1 1 1 1 '\(O!
90° 1 1 1 1
U li U
Figure 2.11 Phase diagram for a perfect capacitor (a) for a real capacitor (b) [39J
This is the assumption of an ideal dielectric, where the polarization can respond
instantaneously and without loss and remain in phase with the altemating electric field. In
real dielectrics, particularly as the frequency goes to higher values, eventually the
polarization will be unable to keep up and, the current will no longer be exactly 90° out of
phase (Figure 2.11 (b ». Component Ii leads to power loss. In a real dielectric the CUITent
leads the applied voltage by an angle of 90° - () [39].
In choosing a dielectric for an electronic application, criteria include the energy
absorption reported in terms of loss tangent. Materials that manifest less variation of
dielectric constant have lower polarization and lower losses. Materials that have a higher
dielectric constant may have higher losses due to a higher degree of polarization.
This is especially true for ferroelectrics, which have huge dielectric constants but can
have high losses as well. Thus the proper choice of dielectric will depend on which
factors are of importance for the specific application. In many applications of capacitors
22

Chapter2 Literature Review
in the electronic industry, as weIl as in the DBD process, low dielectric losses and small
variations with temperature are important.
2.3.4.Die/ectric Strength
One other important property of dielectrics should be mentioned: dielectric strength, the
maximum electric field that a dielectric can sustain before "dielectric breakdown" and the
loss of its insulating properties occurs. It has units of volts per unit of thickness of the
dielectric material. The dielectric breaks down when the current rises sharply at a critical
electric field; permanent damage is often found along fine tubular channel s, the major
portion of the sample being left intact.
A defect-free sample breaks down at a field specific to the material, invariant from
sample to sample [37]. This property is highly sensitive to composition, porosity, to loss
factor and to temperature. Porosity, which tends to give variation in the local electric
field, leads to considerable decrease of dielectric strength. A sample containing about14%
porosity may have a dielectric strength about halfthat ofa sample with 5% porosity.
The role of dielectric loss in ceramic breakdown it is important because, when a constant
field is suddenly applied to a dielectric, various polarization mechanisms take time to
respond, so the induced charges increase with time [39]. The heat generated by the
dielectric loss is assumed to dissipate by thermal conduction so that temperature remains
unchanged. But if the heat is trapped inside the ceramic, it locally melts the material,
reducing the breakdown resistance.
Temperature increases the concentration of charge carriers, therefore increases the dc
conductivity. The effect of time duration and temperature on breakdown behaviour
depends critically on the conduction characteristics and, consequently, the composition.
The major factor affecting the dielectric strength of most ceramic compositions is the
onset of thermal breakdown caused by dielectric losses increase.
23
Chapter 2 Literature Review
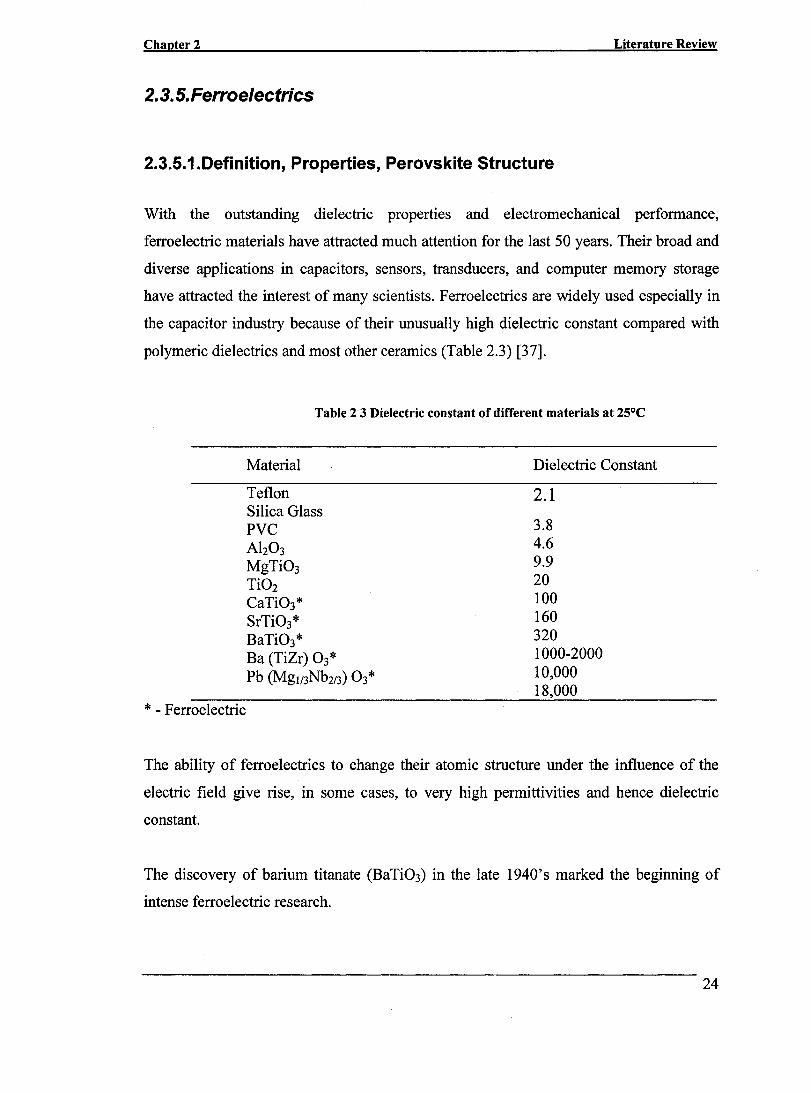
2.3. 5. Ferroelectrics
2.3.5.1.Definition, Properties, Perovskite Structure
With the outstanding dielectric properties and electromechanical performance,
ferroelectric materials have attracted much attention for the last 50 years. Their broad and
diverse applications in capacitors, sensors, transducers, and computer memory storage
have attracted the interest of many scientists. Ferroelectrics are widely used especially in
the capacitor industry because of their unusually high dielectric constant compared with
polymerie dielectries and most other ceramics (Table 2.3) [37].
* - Ferroelectrie
Table 2 3 Dielectric constant of different materials at 25°C
Material
Teflon Silica Glass PVC Ah0 3
MgTi03 Ti02 CaTi03* SrTi03* BaTi03* Ba (TiZr) 03* Pb (Mg1/3Nb2/3) 03*
Dielectric Constant
2.1
3.8 4.6 9.9 20 100 160 320 1000-2000 10,000 18,000
The ability of ferroelectrics to change their atomic structure under the influence of the
eleetrie field give rise, in sorne cases, to very high permittivities and hence dieleetric
constant.
The discovery of barium titanate (BaTi03) in the late 1940's marked the beginning of
intense ferroelectric research.
24

Chapter2 Literature Review
Ferroelectric materials are dielectrics that present a spontaneous and reorientable
polarization over a certain temperature range [40]. Spontaneous polarization is the
automatic lining up of electric dipoles without the application of an external field.
The cause of spontaneous polarization could be application of stress, electric field or
change of the external temperature. For the case of temperature change, it is known that
spontaneous polarization will occur in certain temperature regions. This phenomenon is
determined by the transition point or Curie temperature-Tc. The Curie temperature is a
material characteristic above which the crystals cannot be spontaneously polarized. Once
the temperature drops below the Curie point spontaneous polarization will occur.
This phenomenon is accompanied by the phase change of the crystal structure. The unit
cells will change from the high symmetry to a low symmetry one. For example the
BaTi03 manifests a cubic crystal structure above the Curie temperature and it changes to
tetragonal, orthorhombic and rhombohedral structures when the temperature drops below
this point.
Ferroelectrics can exhibit more than one phase transition temperature. The Curie
temperature marks the transition to the disordered, paraelectric phase. The material can
also go through phase transitions between two ordered phases. There are two different
types of ordered phases, ferroelectric and antiferroelectric. Ferroelectric ordering consists
of parallel dipole moments along a crystallographic direction. Antiferroelectric order
consists in dipole moments that are antiparallel and cancel one another.
The most commonly studied ferroelectrics have the perovskite structure (as illustrated in
Fig 2.12), with the chemical formula ABD3. The A-site cations occupy the corners of the
cube, while B-site cations sit in the body center. Three oxygen atoms per unit cell occupy
the faces. A practical advantage of the perovskite structure is that many different cations
can be substituted on both the A and B sites without drastically changing the overall
structure.
25
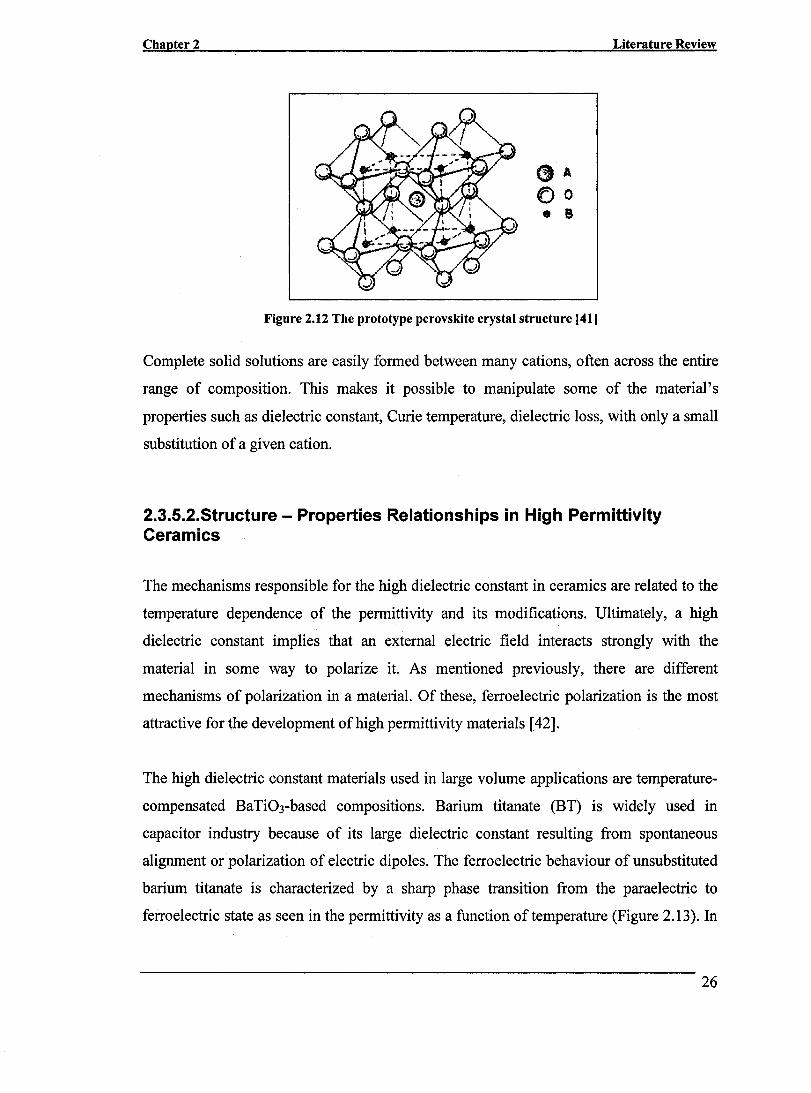
Chapter2 Literature Review
Figure 2.12 The prototype perovskite crystal structure [41J
Complete solid solutions are easily formed between many cations, often across the entire
range of composition. This makes it possible to manipulate sorne of the material's
properties such as dielectric constant, Curie temperature, dielectric loss, with only a small
substitution of a given cation.
2.3.5.2.Structure - Properties Relationships in High Permittivity Ceramics
The mechanisms responsible for the high dielectric constant in ceramics are related to the
temperature dependence of the permittivity and its modifications. Ultimately, a high
dielectric constant implies that an external electric field interacts strongly with the
material in sorne way to polarize it. As mentioned previously, there are different
mechanisms of polarization in a material. Of these, ferroelectric polarization is the most
attractive for the development ofhigh permittivity materials [42].
The high dielectric constant materials used in large volume applications are temperature
compensated BaTi03-based compositions. Barium titanate (BT) is widely used in
capacitor industry because of its large dielectric constant resulting from spontaneous
alignment or polarization of electric dipoles. The ferroelectric behaviour of unsubstituted
barium titanate is characterized by a sharp phase transition from the paraelectric to
ferroelectric state as seen in the permittivity as a function oftemperature (Figure 2.13). In
26
Chapter 2 Literature Review
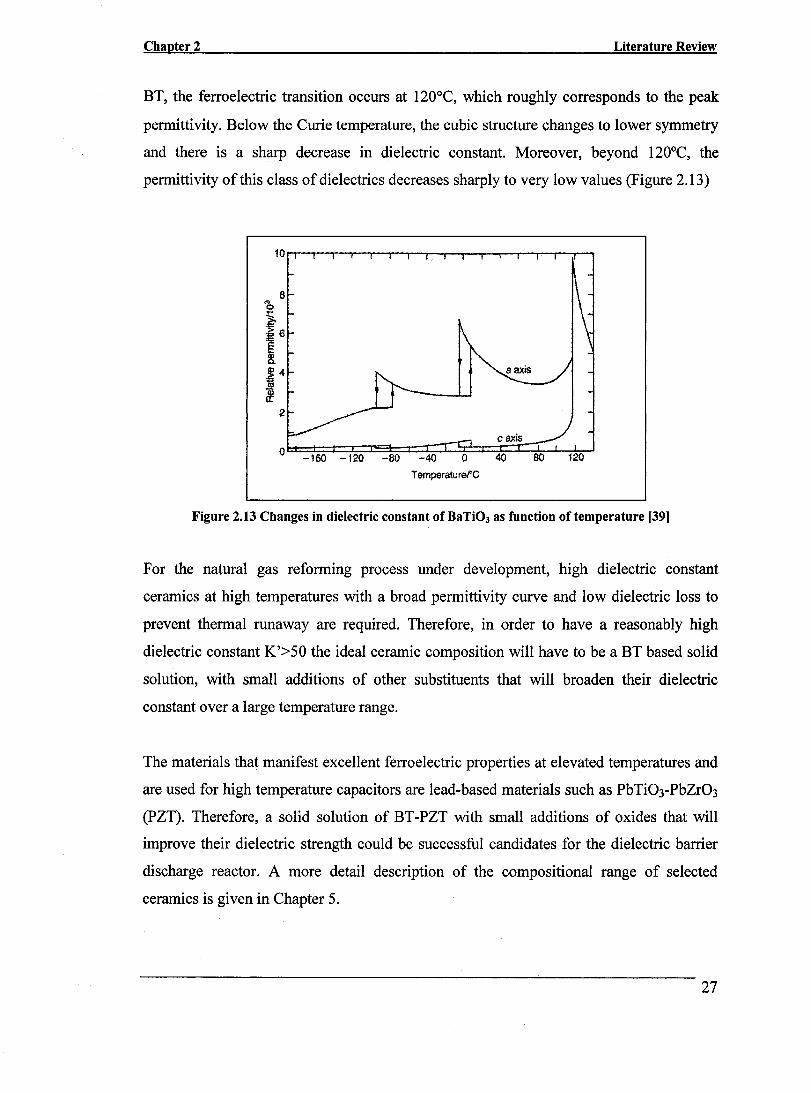
BT, the ferroelectric transition occurs at 120°C, which roughly corresponds to the peak
permittivity. Below the Curie temperature, the cubic structure changes to lower symmetry
and there is a sharp decrease in dielectric constant. Moreover, beyond 120°C, the
permittivity of this class of dielectrics decreases sharply to very low values (Figure 2.13)
TemperaturefC
Figure 2.13 Changes in dielectric constant of BaTi03 as function of temperature [39]
For the natural gas reforming process under development, high dielectric constant
ceramics at high temperatures with a broad permittivity curve and low dielectric loss to
prevent thermal runaway are required. Therefore, in order to have a reasonably high
dielectric constant K'>50 the ideal ceramic composition will have to be a BT based solid
solution, with small additions of other substituents that will broaden their dielectric
constant over a large temperature range.
The materials that manifest excellent ferroelectric properties at elevated temperatures and
are used for high temperature capacitors are lead-based materials such as PbTi03-PbZr03
(PZT). Therefore, a solid solution of BT-PZT with small additions of oxides that will
improve their dielectric strength could be successful candidates for the dielectric barrier
discharge reactor. A more detail description of the compositional range of selected
ceramics is given in Chapter 5.
27

CHAPTER3
OBJECTIVES
The objectives of this research were divided into two area of interest. The first was
related to dielectric barrier discharge reactor and the feasibility of the process, and the
second was focused on dielectric ceramics, their microstructure, dielectric properties and
the application of these properties to the material reliability in the reactor.
The main objectives regarding dielectric barrier discharge reactor were:
• To investigate the discharge characteristics for different types of ceramics
• To evaluate the possibility ofusing existing commercial ceramics
• To fabricate reliable medium permittivity ceramics, which facilitate a close
examination of the important parameters that influence the process, i.e. frequency,
voltage, area discharge, residence time
• To examine the effect of dielectric barrier permittivity on discharge
characteristics, such as plasma onset voltage, power consumption and hydrogen
yield.
The main objectives related to dielectric ceramics were:
• To develop ceramic compositions, which present increased dielectric properties at
elevated temperatures, such as BNT
• To examine the influence of single and double cation substitutions on BNT crystal
structure, physical and dielectric properties
• To study the capability of this material to perform in hydrogen production plasma
reactors.
28
Chapter4 Experimental Procedures
CHAPTER4
EXPERIMENTAL PROCEDURES
4.1.0VERVIEW OF APPROACH
Since the scope of this project extends from the effect of various dielectric ceramics on
hydrogen and carbon production in dielectric barrier dis charge reactors to an intensive
and wide-ranging exploration of compositional variants for medium and high permittivity
ceramics, the work plan was structured in two parts.
Phase 1 resided in an initial test series of selected commercially available ceramics in
order to collect data such as performance, properties, reliability and influence on
hydrogen and carbon production. From the obtained results, which will be presented in
the next section, Phase II of the experimental plan emerged.
The technical effort of phase II has been structured to overcome the specific problems
encountered in the initial test series, and thus the principal interest area in phase II was to
fabricate medium permittivity dielectric ceramics with stable performance up to 1200 e and high dielectric strength.
29
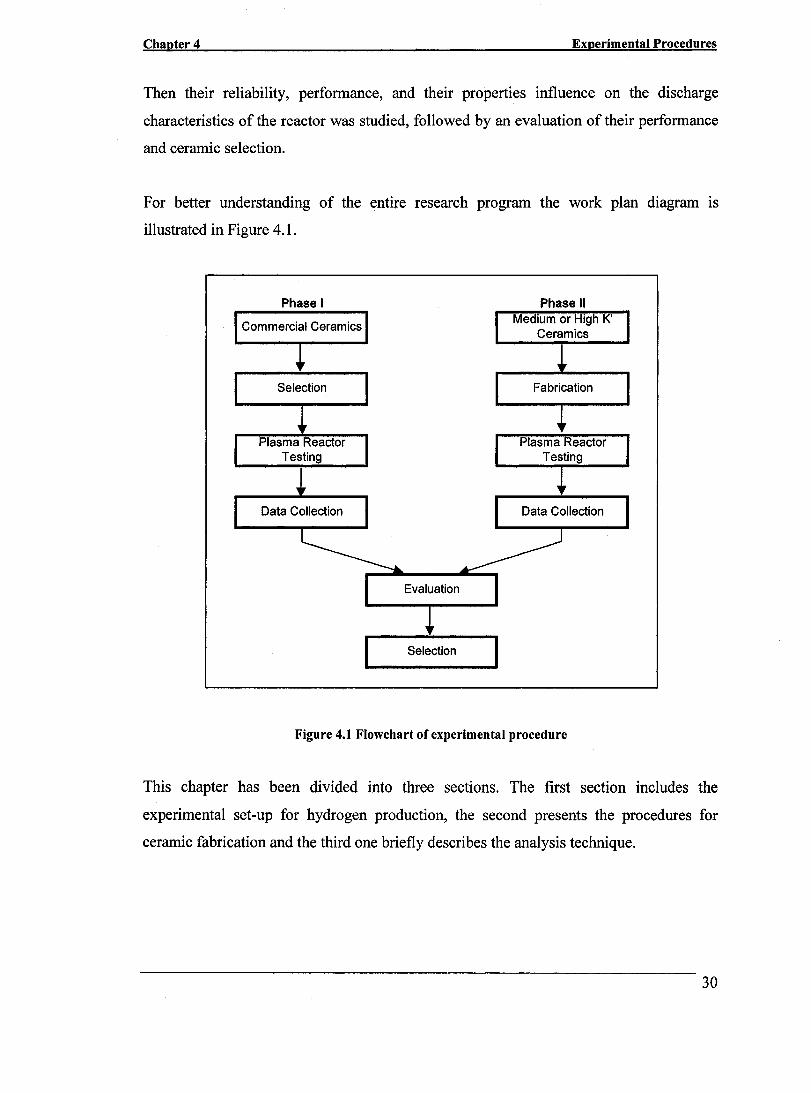
Chapter4 Experimental Procedures
Then their reliability, performance, and their properties influence on the discharge
characteristics of the reactor was studied, followed by an evaluation of their performance
and ceramic selection.
For better understanding of the entire research pro gram the work plan diagram IS
illustrated in Figure 4.1.
Phase 1 Phase Il
Selection
Figure 4.1 Flowchart of experimental procedure
This chapter has been divided into three sections. The first section includes the
experimental set-up for hydrogen production, the second presents the procedures for
ceramic fabrication and the third one briefly describes the analysis technique.
30
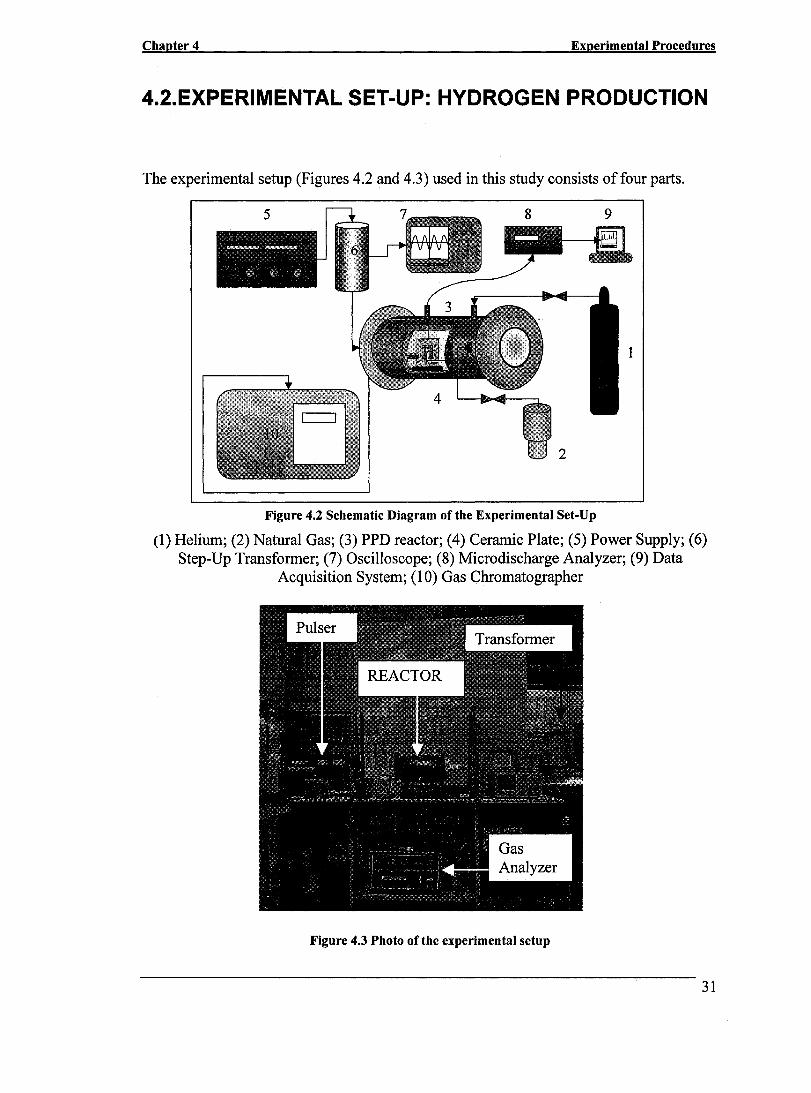
Chapter4 Experimental Procedures
4.2.EXPERIMENTAL SET-UP: HYDROGEN PRODUCTION
The experimental setup (Figures 4.2 and 4.3) used in this study consists of four parts.
1
Figure 4.2 Schematic Diagram of the Experimental Set-Up
(1) Helium; (2) Natural Gas; (3) PPD reactor; (4) Ceramic Plate; (5) Power Supply; (6) Step-Up Transformer; (7) Oscilloscope; (8) Microdischarge Analyzer; (9) Data
Acquisition System; (10) Gas Chromatographer
Figure 4.3 Photo of the experimental setup
31
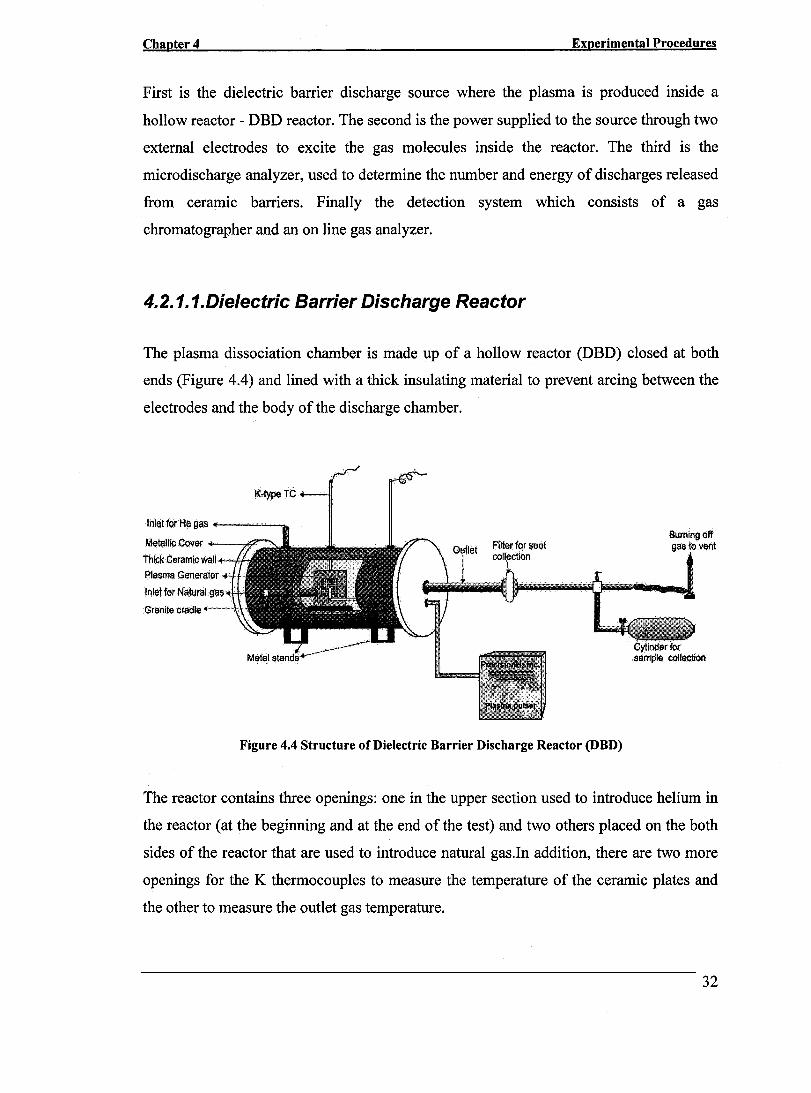
Chapter 4 Experimental Procedures
First is the dielectric barrier discharge source where the plasma is produced inside a
hollow reactor - DBD reactor. The second is the power supplied to the source through two
external electrodes to excite the gas molecules inside the reactor. The third is the
microdischarge analyzer, used to determine the number and energy of discharges released
from ceramic barriers. Finally the detection system which consists of agas
chromatographer and an on line gas analyzer.
4.2.1. 1. Die/ectric Barrier Discharge Reactor
The plasma dissociation chamber is made up of a hollow reactor (DBD) closed at both
ends (Figure 4.4) and lined with a thick insulating material to prevent arcing between the
electrodes and the body of the discharge chamber.
K-type TC
Inlet for Hé gas _----...
Metallic Cover --79'" Thick Ceramic wall Plasma Generator
Figure 4.4 Structure of Dielectric Barrier Discharge Reactor (DBD)
Burning off gas lovent
Cylinder for semple collection
The reactor contains three openings: one in the upper section used to introduce helium in
the reactor (at the beginning and at the end of the test) and two others placed on the both
sides of the reactor that are used to introduce natural gas.ln addition, there are two more
openings for the K thermocouples to measure the temperature of the ceramic plates and
the other to measure the outlet gas temperature.
32

Chapter4 Experimental Procedures
Side View Front View (ceramic Plate)
Figure 4.5 Dielectric Ceramic in DBD Reactor
The ceramic plate is supported in a vertical position by a Teflon cradle (Figure 4.5),
which is sustained by the inner wall of the reactor. The gap between the metallic grid
(electrode) and the ceramic ranges from 0.254 -1.905 mm (10 -75 thou).
The two metal electrodes that are attached to the power supply via two small steel holders
had different geometries and are presented in Figure 4.6, Table 4.1. One side of the
reactor (opposite to the entrance of the natural gas) is extended with an outlet containing a
filter set-up to collect the carbon nano-particles and to separate the solid from the gaseous
product mixture.
Figure 4.6 Different electrode configurations
33
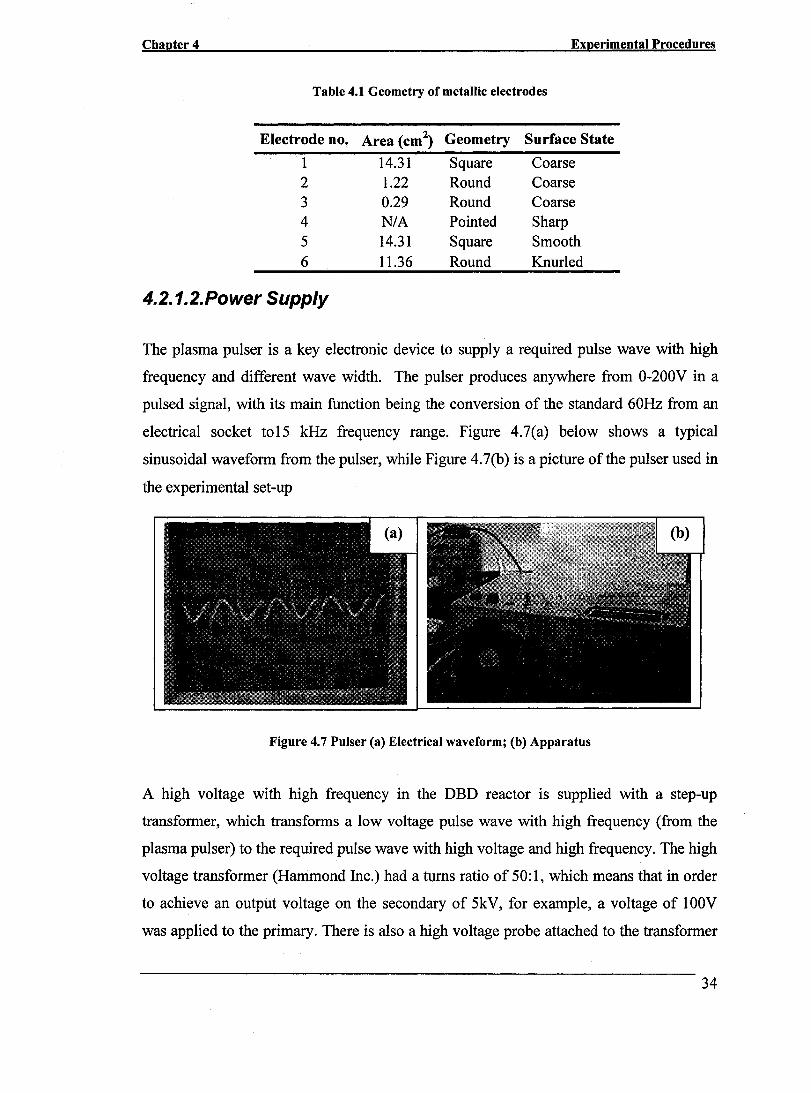
Chapter 4 Experimental Procedures
Table 4.1 Geometry of metallic electrodes
Electrode no. Area (cm2) Geometry Surface State
1 14.31 Square Coarse 2 1.22 Round Coarse 3 0.29 Round Coarse 4 NIA Pointed Sharp 5 14.31 Square Smooth 6 11.36 Round Knurled
4.2. 1. 2. Power Supply
The plasma pulser is a key electronic device to supply a required pulse wave with high
frequency and different wave width. The pulser produces anywhere from 0-200V in a
pulsed signal, with its main function being the conversion of the standard 60Hz from an
electrical socket to15 kHz frequency range. Figure 4.7(a) below shows a typical
sinusoidal waveform from the pulser, while Figure 4.7(b) is a picture of the pulser used in
the experimental set-up
Figure 4.7 Pulser (a) Electrical waveform; (b) Apparatus
A high voltage with high frequency in the DBD reactor is supplied with a step-up
transformer, which transforms a low voltage pulse wave with high frequency (from the
plasma pulser) to the required pulse wave with high voltage and high frequency. The high
voltage transformer (Hammond Inc.) had a turns ratio of 50:1, which me ans that in order
to achieve an output voltage on the secondary of 5kV, for example, a voltage of 100V
was applied to the primary. There is also a high voltage probe attached to the transformer
34

Chapter4 Experimental Procedures
for high voltage measurements. The device acts as a voltage tap, and that limits the
undesired high voltage spikes that may come from the transformer when the voltage is
increased. The standard range for taps is at +/- 2.5% and +/- 5%.
A Variac was connected to the 60Hz, 120V AC supply to provide variable control of the
applied power. Measurements of power for the operating system were conducted with a
digital multimeter and a digital oscilloscope. The power measurements were conducted
on the primary side of the transformer, since the lower voltage was required for the
oscilloscope. The high voltage transformer was independently grounded for safety
reasons and the entire apparatus was housed in a well-grounded fume hood with a glass
door. The fume hood provided instrument protection and personal protection from the
discharge and from any leakage of methane and hydrogen that might escape the system.
4.2. 1.3. Microdischarge Analyzer
An analyzer (Figure 4.8) is used to determine the number, power and energy levels of
discharges released from ceramic barri ers. The analyzer is a critical component in data
collection because it gives a good indication of the plasma intensity. There is a tight
correlation between the energy of the microdischarges and the type of dissociation
produced in the reactant. The amount of dissociation per second is proportional to the
number of microdischarges. The analyzer works by taking the voltage and CUITent from
the voltage divider as it is being fed to the reactor from the transformer.
Figure 4.8 Microdischarge analyzer
35
Chapter4 Experimental Procedures
Using the basic formula for Power (W) P = IV where 1 is current and V is voltage, a
product is obtained. This number is then sent through a multiplier, several chips, and
finally fed to a multiplexer. This device averages the most significant byte (MSB) and the
least significant byte (LSB) with the result being the number obtained for data collection.
This number delivers information on the microdischarge patterns: (1) number of
microdischages per second (100,000 to 10,000,000); (2) number of microdischarges
having current amplitudes above a minimum level (0-100miliamps); (3) number of
microdischarges having a power amplitude above a minimum level (0-1000 watts);
number of microdischarges having an energy amplitude above a minimum level (0-100
millijoules). Figure 4.8 presents the analyzer used to record the number and the energy
levels of the microdischarges.
4.2.1.4.Gas Chromatograph
The gas chromatograph (GC) used in this study was a Hewlett Packard 4890 with
Thermal Conductivity Detector (GC/TCD, Hewlett Packard). The gas carrier was argon at
a flow rate of 20ml/min. The auto sampler had two sampling loops attached (lml,
respectively 2ml in volume). The lml sampling loop was used in the experiments
conducted in this system. The exhaust gas from the DBD reactor was continuously fed
into the sampling loop. A Carbosieve S-II spherical carbon packed column was used for
separation of gases. The column was maintained at an ambient temperature of 21°C.
Three hydrogen gas compositions were used for calibration 2, 3 and 100 (v %). The
detector and its controller were VICI (model TCDC). The detector filament and its
chamber were maintained at 150°C and 125°C, respectively. The auto sampling loop and
the TCD were both connected to a data acquisition and an interface system (Justice
Laboratory Software, Model Tiger II). Data was collected and analyzed using Chrome
Perfect-Software (Justice Laboratory Software). Gas samples were analyzed periodically
(15 min).
36
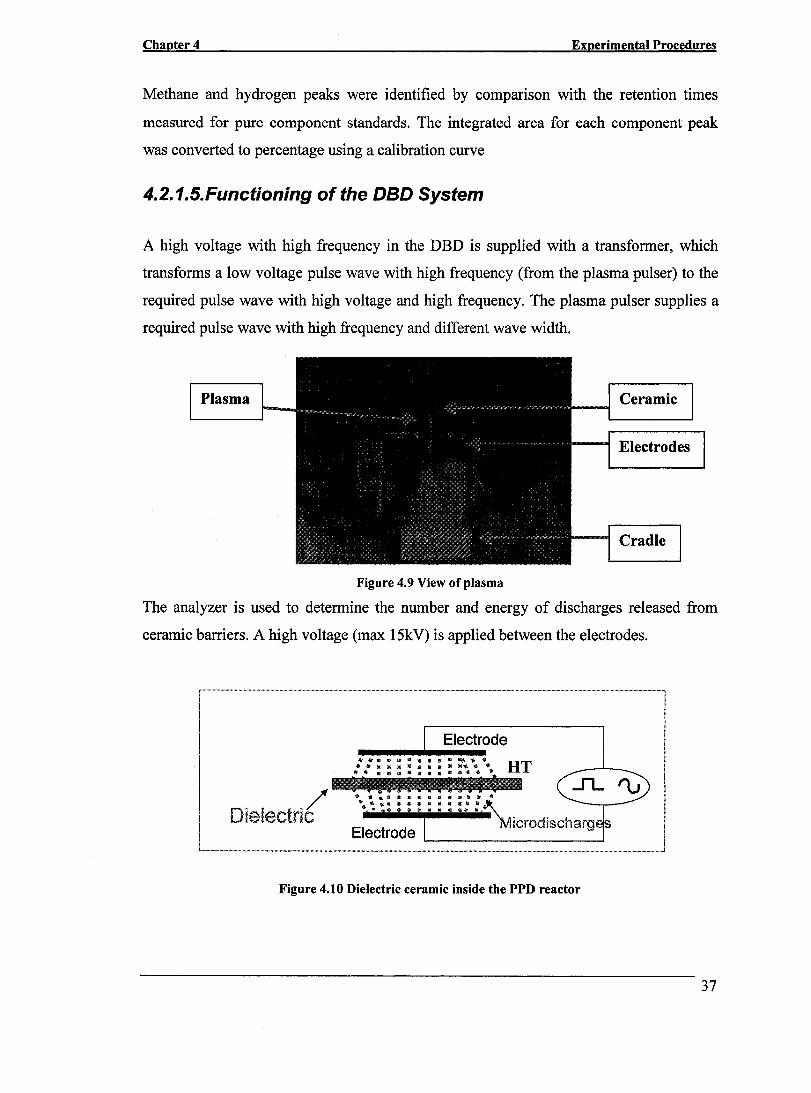
Chapter 4 Experimental Procedures
Methane and hydrogen peaks were identified by comparison with the retention times
measured for pure component standards. The integrated area for each component peak
was converted to percentage using a calibration curve
4.2. 1. 5. Functioning of the DBD System
A high voltage with high frequency in the DBD is supplied with a transformer, which
transforms a low voltage pulse wave with high frequency (from the plasma pulser) to the
required pulse wave with high voltage and high frequency. The plasma pulser supplies a
required pulse wave with high frequency and different wave width.
Figure 4.9 View of plasma
The analyzer is used to determine the number and energy of discharges released from
ceramic barriers. A high voltage (max 15kV) is applied between the electrodes.
1 / .... ' · · . · · .. · · · 1 l, Dielectric •• ~ -: : : : : : : :: : ~icrodisCharg
Electrode 1
1..."""'" .. "'""""'"",'"""""'""'", .. " .... "',"' .. , .. ,,'", .. "' .............. , ...... "' .. ' ........ , .. ", .... " .... "", .... , .... , .. _" .. ,""""""" .. , ........ ,"'""", .. '""' ...... ," .. ,'",", .. '"",' .. ' ...... '",,,,"'"'""'" .... '''' ...... ' .. '""",'""' .. " .. ", .. ', .. ""'"''"""'""'"" .. " .... , .... ','""'""" .. ..
Figure 4.10 Dielectric ceramic inside the PPD reactor
37
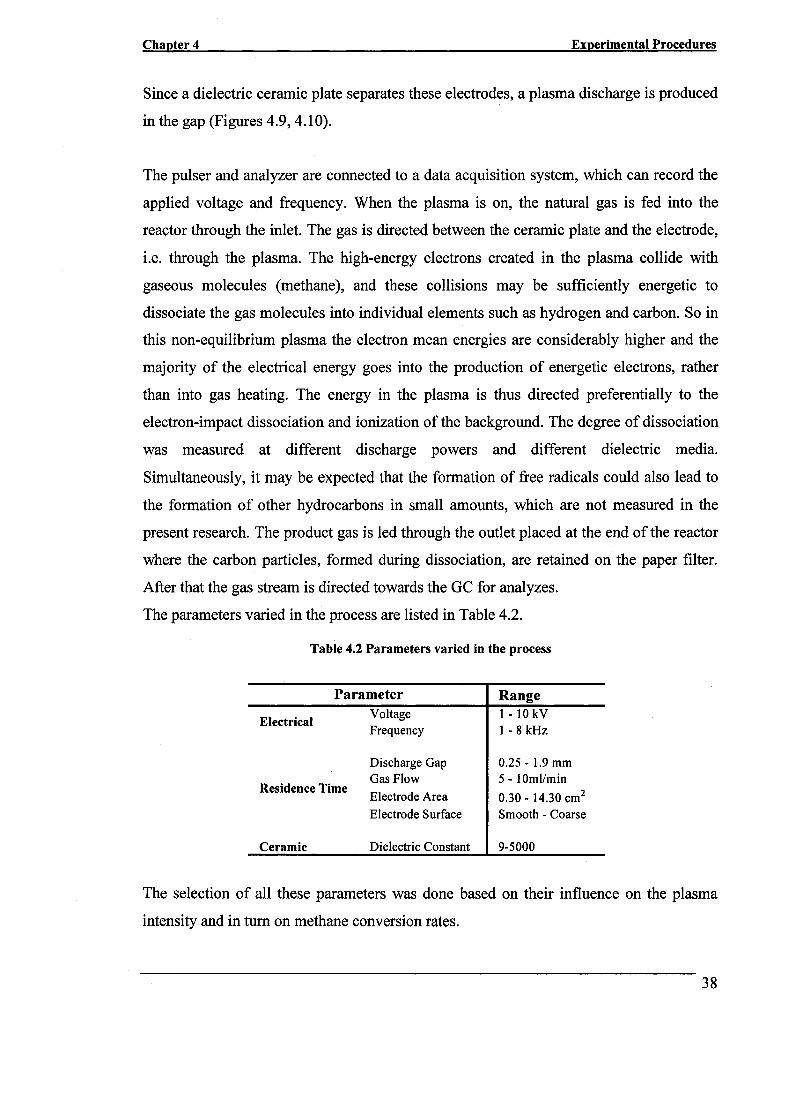
Chapter4 Experimental Procedures
Since a dielectric ceramic plate separates these electrodes, a plasma discharge is produced
in the gap (Figures 4.9, 4.10).
The pulser and analyzer are connected to a data acquisition system, which can record the
applied voltage and frequency. When the plasma is on, the natural gas is fed into the
reactor through the inlet. The gas is directed between the ceramic plate and the electrode,
i.e. through the plasma. The high-energy electrons created in the plasma collide with
gaseous molecules (methane), and these collisions may be sufficiently energetic to
dissociate the gas molecules into individual elements such as hydrogen and carbon. So in
this non-equilibrium plasma the electron mean energies are considerably higher and the
majority of the electrical energy goes into the production of energetic electrons, rather
than into gas heating. The energy in the plasma is thus directed preferentially to the
electron-impact dissociation and ionization of the background. The degree of dissociation
was measured at different discharge powers and different dielectric media.
Simultaneously, it may be expected that the formation of free radicals could also lead to
the formation of other hydrocarbons in small amounts, which are not measured in the
present research. The product gas is led through the outlet placed at the end of the reactor
where the carbon partic1es, formed during dissociation, are retained on the paper filter.
After that the gas stream is directed towards the GC for analyzes.
The parameters varied in the process are listed in Table 4.2.
Table 4.2 Parameters varied in the process
Parameter Range
Electrical Voltage 1 - 10 kV Frequency 1-8kHz
Discharge Gap 0.25 - 1.9 mm Gas Flow 5 - 10ml/min
Residence Time Electrode Area 0.30 - 14.30 cm2
Electrode Surface Smooth - Coarse
Ceramic Dielectric Constant 9-5000
The selection of all these parameters was done based on their influence on the plasma
intensity and in turn on methane conversion rates.
38

Chapter4 Experimental Procedures
4.3.EXPERIMENTAL METHOD-CERAMIC FABRICATION
4.3.1.Sample Preparation
The following subsection describes the preparation of the medium and high permittivity
ceramic compositions employed in this research. The schematic of the process is shown
in Figure 4.11.
Measurement
Figure 4.11 Flow chart of the ceramic processing techniques.
The selected ceramic compositions have been proven to be inexpensive to prepare by
conventional ceramic technique. The preparation of the samples employed the following
steps: (1) particle size evaluation in order to study the compactibility of the powder (2)
39

Chapter4 Experimental Procedures
binder addition for higher green density, (3) spray dry them for a uniform flowing
powder; (4) pressing them to form pellets; (5) sinter them for densification.
4.3.2. Chemical Composition
The chemical compositions of the samples in this research could be categorized in three
groups. The first group is barium titanate-Iead zirconium titanate solid solution, the
second is barium titanate- lead titanate solid solution, and the third is calcium titanate
(Table 4.3)
Table 4.3 Phase II - Ceramic Compositions
Ceramic
K-60*
K-60 K-110 K-166
Base BT-PZT
BT-PZT
BT-PT CT
Additions
The oxides weight % ranges are presented in Table 4.4.
Table 4.4 Ceramic oxide compositions
Ceramic
K-60* K-60 K-110 K-166
BaO 10-15 20-30
65 o
* cadmium containing ** amorphous, precipitated
Component (range wt%) Ti02 Zr02 PbO SiOr CdO 1-10 1-5 1-5 1-2 < 0.5
20-30 1-5 1-5 1-2 0 33 0 4 0 0 00 0 0 0 0
4.3.3.Preparation of Ceramic Compositions
CaO o o o
40
Ceramic samples were prepared employing the conventional ceramic sintering technique.
The powders were supplied by Ferro Corporation. After particle evaluation, the powders
were then baIl milled for 1 hour in water-based systems in polypropylene jars with
zirconia media with a 2wt% PV A binder solution. The weight ratio between milling
media and powder was held at a 2:3. The slurry was then spray dried (laboratory version-
40

Chapter 4 Experimental Procedures
see results chapter) to obtain a uniform flowing powder and then uniaxially pressed into
disks of 25-40 mm diameter and different thickness at 50 - 150 MPa. The binder addition
and the good particle size distribution provided the ceramic disks with enough green
strength for handIing therefore there was no need for a further increase in the appIied
pressure.Sintering tests and density measurements were conducted to determine the
optimum sintering profiles for the various compositions.
The dielectric measurements were performed at frequencies from 1kHz to 1MHz on silver
electroded disks using a high precision LCR meter (HP 4294A). The temperature
dependence of dielectric properties was measured in the temperature range of interest by
placing the ceramics in an environmental chamber and monitoring the temperature with a
thermocouple.
4.4.CHARACTERIZATION AND ANALYSIS TECHNIQUES
In this section a brief description of the procedures employed to characterize the phase
formation, microstructure and dielectric properties is addressed.
4.4.1.Parlicle Size Analysis
The particle size analysis of ceramic powder was performed with a Horiba Particle Size
Distribution Analyzer LA-920 (Figure 4.12).
Figure 4.12 Horiba Particle Size Distribution Analyzer LA-920
41

Chapter 4 Experimental Procedures
The powders were dispersed in deionized water using an ultrasonic bath. The slurry was
added manually to the reservoir and then mixed with the re-circulating liquid so that a
stream of weIl dispersed partic1es passed continuously through the transparent cell.
The refractive index of the powder employed in the measurement was 2.40 and the results
are reported in the next Chapter.
4.4. 2. Densit y Measurements
The fired density of the sintered samples was measured by Archimedes' method using
ASTM standard C20-97 [43]. The first step in the procedure is to measure the dry mass of
the sintered pellets (D). The specimens are then boiled for 12 h and allowed to cool in
water for 12 h prior to weighing to allow the water to completely fill the available open
porosity.
The suspended mass (S) is measured by weighing the samples in water and finally the
saturated mass (W) is measured by removing the excess water from the specimen surface
before weighing. Then the bulk density (8) and apparent porosity (P A) are calculated as
follows:
8 = D/(W-S) (g/cm3) (Equation 4.1)
PA = (W-D)/(W-S) (%) (Equation 4.2)
4.4.3.Die/ectric Characterization
The dielectric measurements (capacitance and dissipation factor) were measured using an
impedance analyser Model 4294 A, Hewlett Packard (Figure 4.13), according to ASTM
D150-93 Standard [44].
42

Chapter 4
The dielectric constant was calculated from:
where: Cp is the capacitance ,
80 is the permittivity of the free space = 8.854 x 1O-12F/m
d is the thickness of the specimen
A is the area of the sample
Experimental Procedures
(Equation 4.3)
Figure 4.13 A schematic diagram of the apparatus used for the capacitance measurements
The sintered specimens were polished and electroded with silver conducting paste. The
capacitance and dissipation factor (tan ù) were measured at 1kHz and 1MHz over a
temperature range of -55 to 140°C during heating.
4. 4. 4. Die/ectric Strength Measurement
The dielectric strength of the samples was measured according to ASTM standard D3755-
86 [45] on a Hipotronics Dielectric Test Set. The samples held in a properly designed
electrode system, is electrically stressed by the application of an increasing direct voltage
until internaI breakdown occurs.
43

Chapter4 Experimental Procedures
Breakdown is when an electrical bum-through punctures the sample, or decomposition
occurs in the specimen. The specimens are typically tested in oil to decrease the chance of
flashover before breakdown.
Dielectric strength is defined as the maximum voltage required to initiate a dielectric
breakdown through the material and is expressed as volts per unit thickness. The higher
the dielectric strength of a material the better it qualifies as an insulator. Dielectric
strength is calculated by dividing the breakdown voltage by the thickness of the sample.
The data is usually expressed in Volts /mil.
4.4.5.Scanning Electron Microscopy
The carbon deposits on the ceramic samples throughout the plasma testing were examined
using a scanning electron microscope (SEM) JOEL JSM -840A.
Samples with carbon deposits were cut from the dielectric disks exposed to plasma in
different experimental conditions. To prepare samples for analysis, they were coated with
AU/Pd alloy for 1 minute, by sputter deposition. The SEM was operated in general at 3-15
keV and a 15mm working distance and an Everhart-Thomley scintillator detector was
used to collect aU images.
44

Chapter5 Results
CHAPTER5
RESULTS
As explained in detail in the "Experimental Procedure" chapter, the research plan has
been structured in three phases. Briefly, Phase 1 was concentrated on available
commercial ceramic testing; different dielectric ceramics were tested in the plasma
reactor and the challenge encountered was the failure and repeated breakdown of the
ceramics. Thus, the technical effort in Phase II has been structured to overcome this
problem and to fabricate medium permittivity ceramics for the plasma reactor. The
obtained results from Phase 1 and Phase II showed that the best candidate material for this
application should present high permittivity i.e. dielectric constant as well as good
reliability.
The results chapter will be divided into several sub-sections. First, the results of plasma
reactor testing will be described in detail. Influence of electrical parameters, residence
time and ceramic properties as well as optimisation of the process will be presented. The
following section will focus on ceramic development. Particle characterization, firing
profiles, relative densities and temperature influence on dielectric properties will be
presented
45

Chapter 5
5.1.CERAMIC TESTING IN DIELECTRIC BARRIER DISCHARGE REACTOR
Results
The first round of ceramic testing aimed at reproducing results and a better understanding
of ceramic behavior in plasma environment as weIl as in depth examination of ceramic
properties and their influence on hydrogen and carbon production closely related with
power consumption. The following results are obtained from the combined data from
phase 1 and phase II compositions. The non-thermal dielectric barrier discharge system
was studied in different experimental configurations to investigate the best conditions in
terms of reliability, plasma generation, hydrogen output, and power consumption using
low and medium permittivity ceramics. Ceramic dielectric constant, discharge gap,
electrode are a, frequency and voltage (Le. power of plasma discharge, since electric
power can be varied by tuning voltage and frequency) were used as experimental
parameters. The parameters collected were amounts of carbon, hydrogen yield and
number of microdischarges.
ln order to investigate the dielectric influence on the hydrogen production, experiments
were carried out for different values of dielectric capacitance i.e. ceramics of different
dielectric constant, area and thickness. The obtained results are presented as follows.
AlI the experiments were performed at atmospheric pressure with applied voltages
varying between 2 and 12 kV and various frequencies. The tests were carried out with
natural gas as feedstock. The feedstock flow rate was varied and optimized for alumina
and kept constant at 10mllsec for all subsequent experiments. Optimization experiments
were carried out also for electrode are a, discharge gap, operating frequency and electric
field strength. During the experiments the following parameters were continuously
recorded: applied voltage and frequency, plasma intensity (number of microdischarges),
plasma power (current and voltage output), hydrogen concentration (with a measurement
ceIl) and gas temperature inside the reactor. The reactor internaI temperature was
measured at two locations with respect to the reactor top: one above the reaction zone,
namely plasma zone and the second one at the end of the reactor as the gas exited the
46

Chapter 5 Results
chamber. A part of the off gas was injected to the on-line hydrogen analyzer and another
part in the gas chromatograph. The carbon black samples were collected from the gas
stream on a filter paper. The total amount of carbon black generated in the process was
the sum of the carbon deposited on the ceramic surface, and on the filter paper. The
amount of carbon deposited on the metallic electrodes and under the reaction zone was
disregarded.
A high number of tests have been carried out to investigate the cracking of natural gas
into hydrogen and carbon black. There was no preheating of the natural gas in these
experiments. The commercially available dielectric ceramics used are presented in Table
5.1. The primarily selection of these ceramics was done according to their dielectric
constant. For clarity of presented results, the nomenclature used for these ceramics
includes their dielectric constant.
Table 5.1 Commercial ceramic used for Phase 1 testing
Commercial Ceramic
Composition Dielectric Constant (K) Dielectric Strength (V/mm)
K-9 K-50
AI20 3-Ti02
50 >3000
K-100
Ti02
100 >3000
K-270 K-31 00 K-5000
SrTi03 Pb(Zr,Ti)03 BaTi03 270 3100 5000 3000 2000 3000
For Phase II of the research program the fabricated ceramic compositions are listed in
Table 5.2. They were obtained courtes y of Ferro Corporation*. They are aIl perovskite
(AB03) crystal structure, in which different substitutions and additions were performed.
K-60* is a mixture of barium titanate and lead titanate zirconate in which smaIl additions
< 2wt% of silicon dioxide (amorphous, precipitated) and <0.5wt% of cadmium oxide
were added. K-60 presents the same base composition but no CdO. K-II0 is a mixture of
barium titanate and lead titanate -no Zr02, CdO, or Si02.
The last composition, K166 is a calcium titanate ceramic with no other additions. The
properties of aIl the compositions are presented in Table 5.3. The results obtained from K-
60* were similar to K -60 ceramic and therefore were not included in.
47
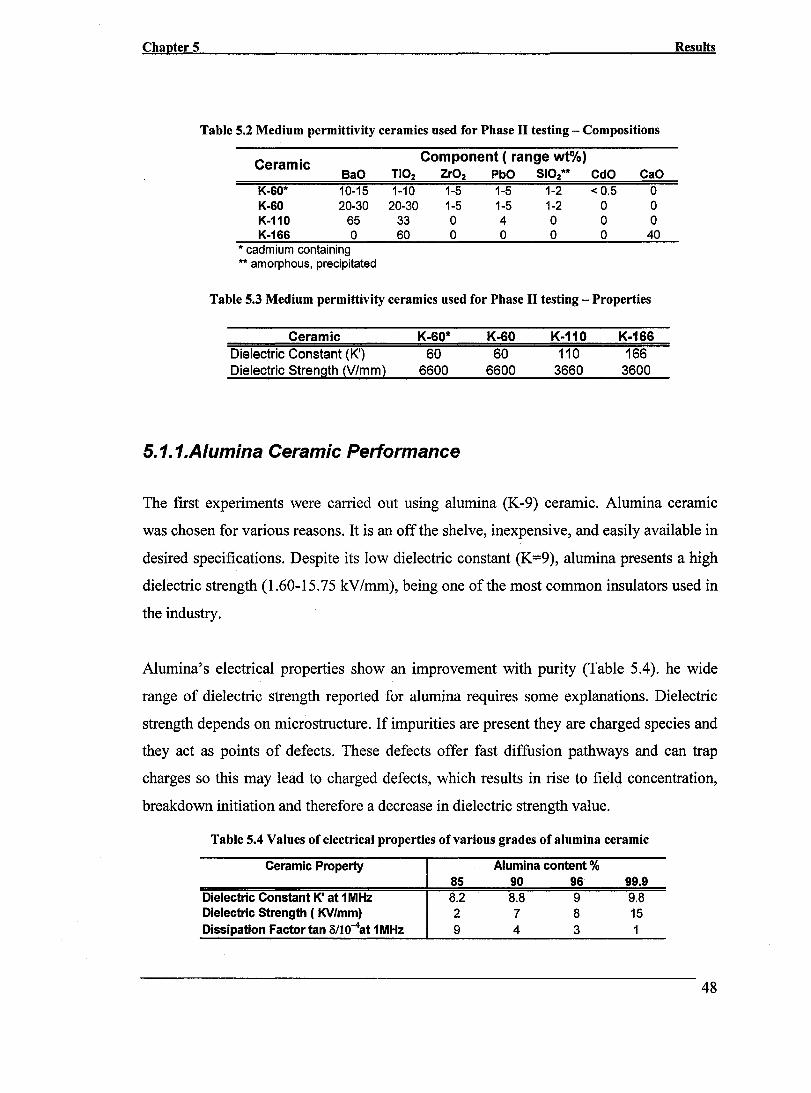
Chapter 5
Table 5.2 Medium permittivity ceramics used for Phase II testing - Compositions
Ceramic Component (range wt%) BaO Ti02 Zr02 PbO Si02** CdO CaO
K-60* 10-15 1-10 1-5 1-5 1-2 < 0.5 0 K-60 20-30 20-30 1-5 1-5 1-2 0 0 K-110 65 33 0 4 0 0 0 K-166 0 60 0 0 0 0 40
* cadmium containing ** amorphous, precipitated
Table 5.3 Medium permittivity ceramics used for Phase II testing - Properties
Ceramic Dielectric Constant (K') Dielectric Strength (V/mm)
K-60* 60
6600
K-60 60
6600
K-110 110
3660
K-166 166
3600
5.1.1.Alumina Ceramic Performance
ResuIts
The first experiments were carried out using alumina (K-9) ceramic. Alumina ceramic
was chosen for various reasons. It is an off the shelve, inexpensive, and easily available in
desired specifications. Despite its low dielectric constant (K =9), alumina presents a high
dielectric strength (1.60-15.75 kY/mm), being one ofthe most common insulators used in
the industry.
Alumina's electrical properties show an improvement with purity (Table 5.4). he wide
range of dielectric strength reported for alumina requires sorne explanations. Dielectric
strength depends on microstructure. If impurities are present they are charged species and
they act as points of defects. These defects offer fast diffusion pathways and can trap
charges so this may lead to charged defects, which results in rise to field concentration,
breakdown initiation and therefore a decrease in dielectric strength value.
Table 5.4 Values of electrical properties of various grades of alumina ceramic
Ceramic Property
Dielectric Constant K' at 1MHz Dielectric Strength ( KV/mm) Dissipation Factor tan MO-4at 1MHz
85 8.2 2 9
Alumina content % 90 96 8.8 9 7 8 4 3
99.9 9.8 15 1
48
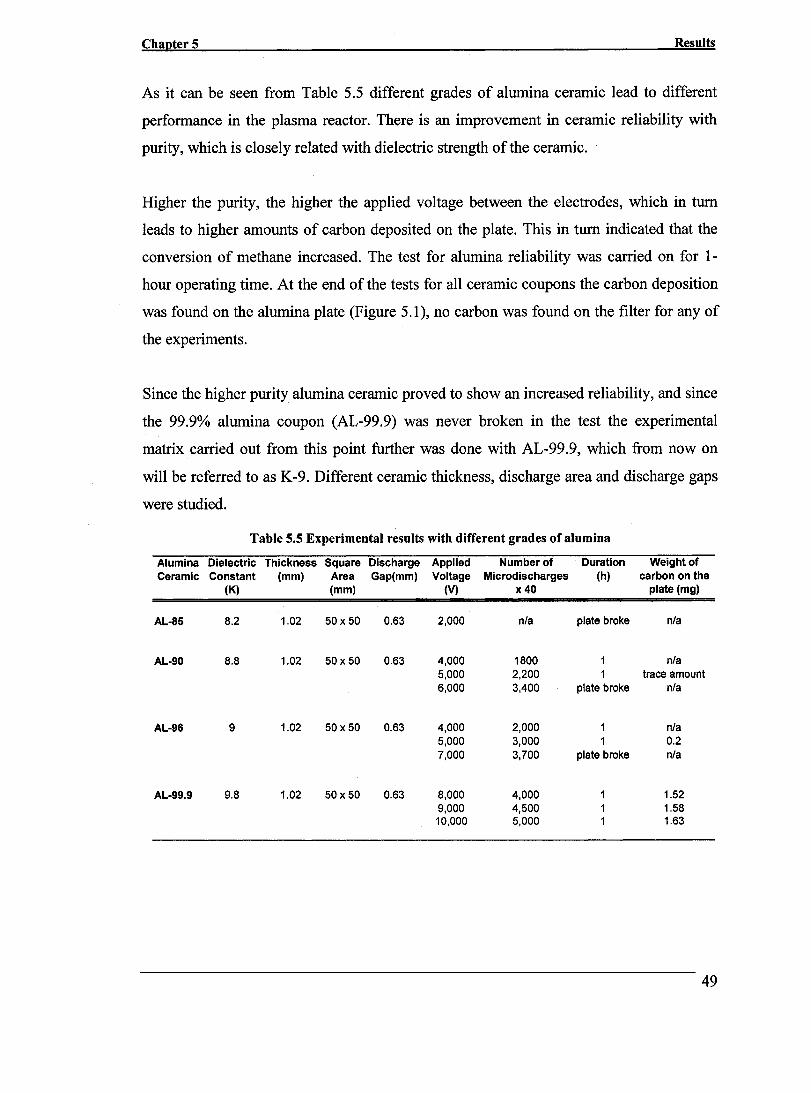
Chapter 5 Results
As it can be seen from Table 5.5 different grades of alumina ceramic lead to different
performance in the plasma reactor. There is an improvement in ceramic reliability with
purity, which is closely related with dielectric strength of the ceramic.
Higher the purity, the higher the applied voltage between the electrodes, which in tum
leads to higher amounts of carbon deposited on the plate. This in tum indicated that the
conversion of methane increased. The test for alumina reliability was carried on for 1-
hour operating time. At the end of the tests for aIl ceramic coupons the carbon deposition
was found on the alumina plate (Figure 5.1), no carbon was found on the filter for any of
the experiments.
Since the higher purity alumina ceramic proved to show an increased reliability, and since
the 99.9% alumina coupon (AL-99.9) was never broken in the test the experimental
matrix carried out from this point further was done with AL-99.9, which from now on
will be referred to as K -9. Different ceramic thickness, discharge area and discharge gaps
were studied.
Table 5.5 Experimental results with different grades of alumina
Alumina Oielectric Thickness Square Oischarge Applied Number of Ouration Ceramic Constant (mm) Area Gap(mm) Voltage Microdischarges (h)
(K) (mm) (V) x 40
AL-85 8.2 1.02 50 x 50 0.63 2,000 nIa plate broke
AL-90 8.8 1.02 50 x 50 0.63 4,000 1800 5,000 2,200 6,000 3,400 plate broke
AL-96 9 1.02 50 x 50 0.63 4,000 2,000 5,000 3,000 7,000 3,700 plate broke
AL-99.9 9.8 1.02 50 x 50 0.63 8,000 4,000 9,000 4,500 10,000 5,000
Weightof carbon on the
plate (mg)
nIa
nIa trace amount
nIa
nIa 0.2 nIa
1.52 1.58 1.63
49
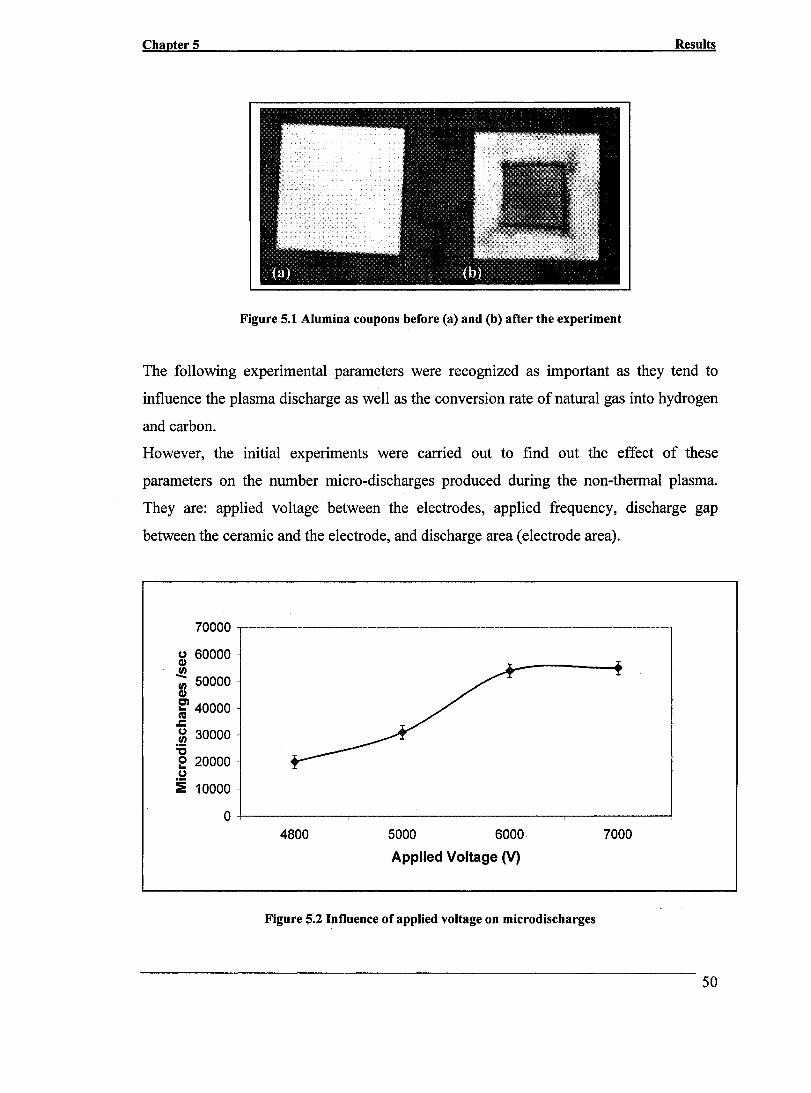
Chapter 5 Results
Figure 5.1 Alumina coupons before (a) and (b) aCter the experiment
The following experimental parameters were recognized as important as they tend to
influence the plasma discharge as well as the conversion rate of natural gas into hydrogen
and carbon.
However, the initial experiments were carried out to find out the effect of these
parameters on the number micro-discharges produced during the non-thermal plasma.
They are: applied voltage between the electrodes, applied frequency, discharge gap
between the ceramic and the electrode, and discharge area (electrode area).
70000~--------------------------------------------~
g 60000 1/)
-;; 50000 CI>
~ 40000 oC ~ 30000 :0 e 20000 u :le 10000
o +-----------~----------~------------r_--------~ 4800 5000 6000
Applied Voltage (V)
Figure 5.2 Influence of applied voltage on microdischarges
7000
50
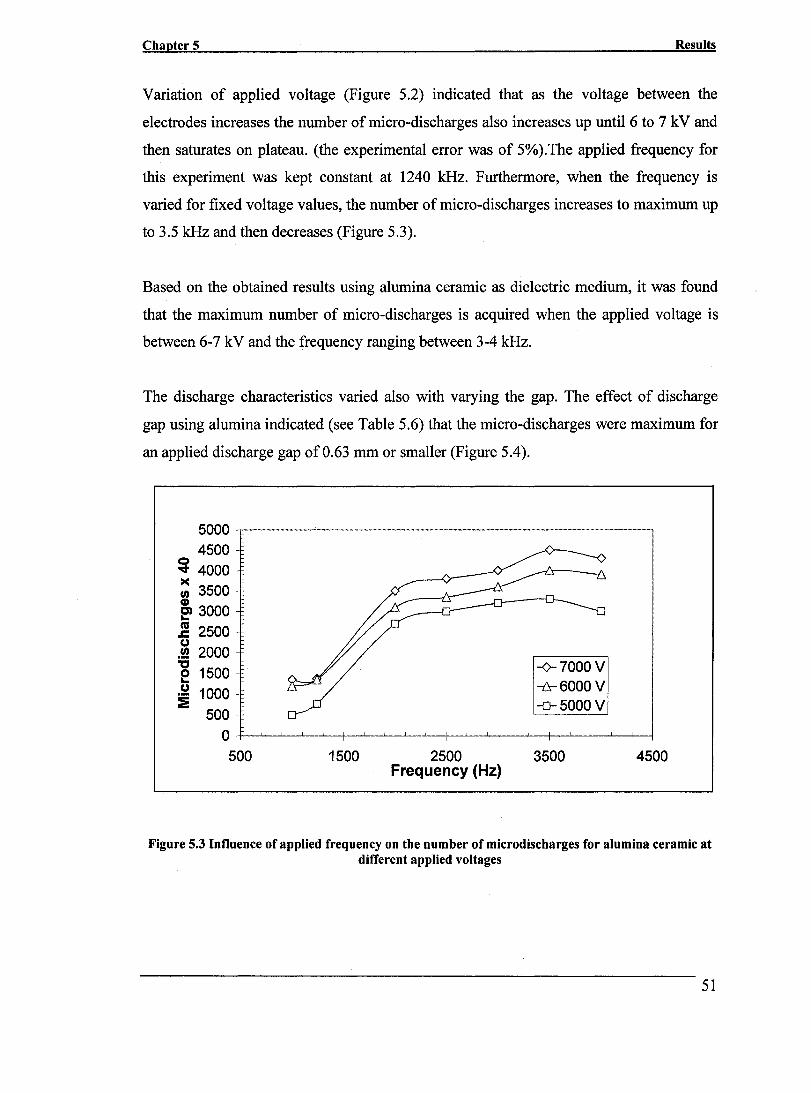
Chapter 5 Results
Variation of applied voltage (Figure 5.2) indicated that as the voltage between the
electrodes increases the number ofmicro-discharges also increases up until6 to 7 kV and
then saturates on plateau. (the experimental error was of 5%).The applied frequency for
this experiment was kept constant at 1240 kHz. Furthermore, when the frequency is
varied for fixed voltage values, the number of micro-discharges increases to maximum up
to 3.5 kHz and then decreases (Figure 5.3).
Based on the obtained results using alumina ceramic as dielectric medium, it was found
that the maximum number of micro-discharges is acquired when the applied voltage is
between 6-7 kV and the frequency ranging between 3-4 kHz.
The discharge characteristics varied also with varying the gap. The effect of discharge
gap using alumina indicated (see Table 5.6) that the micro-discharges were maximum for
an applied discharge gap of 0.63 mm or smaller (Figure 5.4).
5000 4500
~ 4000
= 3500 ~ 3000 ~ 2500 (J
.!!.! 2000
"2 1500 .~ 1000 :e
500
-<>-7000 V *6000 V -0-5000 V
o +-~~~~--~~~~~-+~--~~~~~~--~~ 500 1500 2500
Frequency (Hz) 3500 4500
Figure 5.3 Influence of applied frequency on the number of microdischarges for alumina ceramic at different applied voltages
51

Chapter 5 Results
Table 5.6 Discharge gap influence on number of microdischarges
Gap = 0.63 mm Ga~ = 1.27 mm Gap = 1.90 mm Voltage (V) Frequency (Hz) Micro-discharges
7000 3500 180000 115000 45000 6000 3500 160000 80000 13000 5000 3500 132000 54000 No plasma
The obtained results indicated that a smaller discharge gap induces more intensive
plasma, and therefore it is expected that the optimal discharge gap would be 0.25 mm.
However, for the subsequent experiments a discharge gap of 0.63 mm was selected due to
a better control over the plasma production, namely less noise interfering with the
electronic equipment and a more homogeneous plasma generation.
Another important parameter that affects the plasma intensity is the reaction area or the
metallic electrode area. The bulk type of plasma created by DBD exists only between the
ceramic and the metallic electrode, therefore the larger the metallic electrode, the greater
the reaction zone. From the experiments conducted it was observed that the metallic
electrode area influences the number of microdischarges created in the process as
presented in table 5.7.
35
N 30 :J: e 25 1/1 Q)
~ 20 ca
.J:: (,) 15 1/1 :c e 10 (,)
i 5
0 0
Test Stopped .Y
Natural gas on ~~ /" // /~
/" .... ''+.~ Test Stopped
-0.25 mm Gap
-- 0.63 mm Gap
200 400 600 800 Time (5)
Figure 5.4 Plasma intensity for two different discharge gaps
1000
52
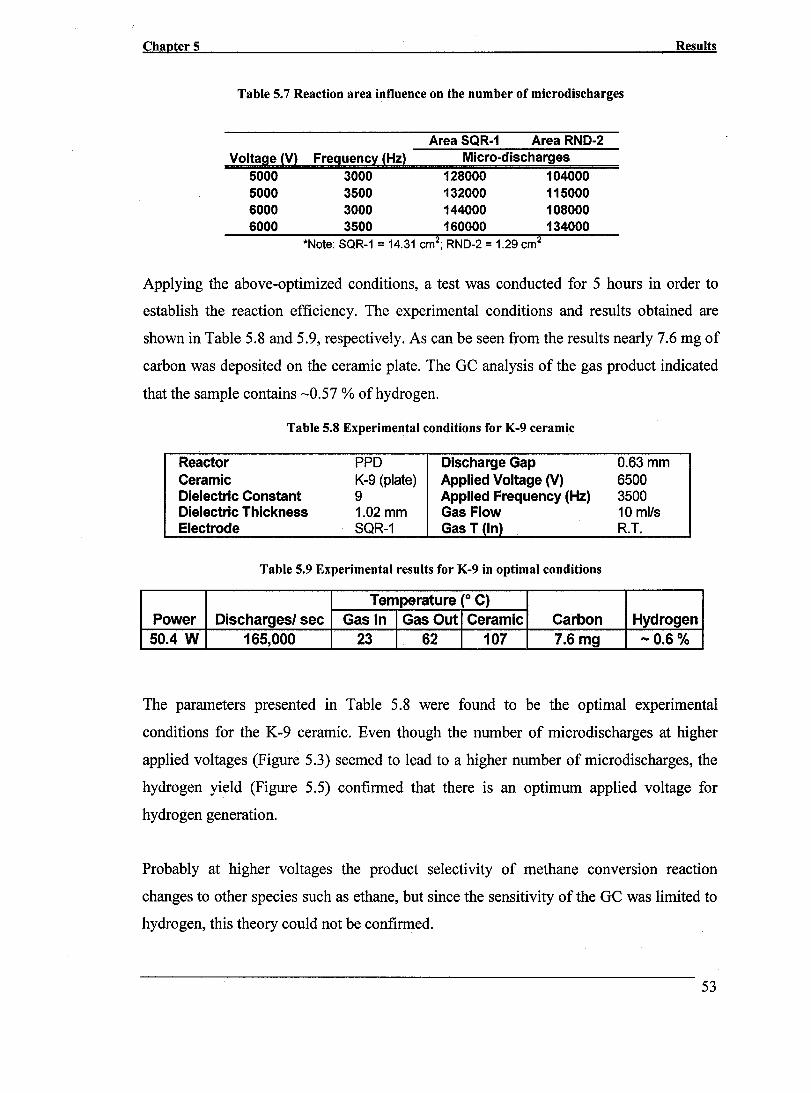
Chapter 5 Results
Table 5.7 Reaction area influence on the number of microdischarges
Area SQR-1 Area RND-2 Voltage {V} Freguencï {Hz} Micro-discharges
5000 3000 128000 104000 5000 3500 132000 115000 6000 3000 144000 108000 6000 3500 160000 134000
*Note: SQR-1 = 14.31 cm2; RND-2 = 1.29 cm2
Applying the above-optimized conditions, a test was conducted for 5 hours in order to
establish the reaction efficiency. The experimental conditions and results obtained are
shown in Table 5.8 and 5.9, respectively. As can be seen from the results nearly 7.6 mg of
carbon was deposited on the ceramic plate. The GC analysis of the gas product indicated
that the sample contains ~0.57 % ofhydrogen.
Table 5.8 Experimental conditions for K-9 ceramic
Reactor PPD Discharge Gap 0.63 mm Ceramic K-9 (plate) Applied Voltage (V) 6500 Dielectric Constant 9 Applied Frequency (Hz) 3500 Dielectric Thickness 1.02 mm Gas Flow 10 mils Electrode SQR-1 Gas T (In) R.T.
Table 5.9 Experimental results for K-9 in optimal conditions
Temperature (0 C) Power Dischargesl sec Gas ln Gas Out Ceramic Carbon Hydrogen 50.4 W 165,000 23 62 107 7.6 mg -0.6%
The parameters presented in Table 5.8 were found to be the optimal experimental
conditions for the K-9 ceramic. Even though the number of microdischarges at higher
applied voltages (Figure 5.3) seemed to lead to a higher number of microdischarges, the
hydrogen yield (Figure 5.5) confirmed that there is an optimum applied voltage for
hydrogen generation.
Probably at higher voltages the product selectivity of methane conversion reaction
changes to other species such as ethane, but since the sensitivity of the GC was limited to
hydrogen, this theory could not be confirmed.
53

Chapter 5 ResuIts
0.7 -,------------------------------------------------- ------
0.6
~ 0.5 "C 'G) >= 0.4 c & 0.3 e -g, 0.2 ::t:
0.1
o+---~----~----~--_,----~--_,----~----,_--~--~
4800 5000 6000
Applied Voltage (V)
6500 7000
Figure 5.5 Influence of applied voltage on hydrogen yield for K-9 ceramic at 3500 Hz
Studies were also carried out for different experimental conditions and it was observed
that the input power for the alumina ceramic plate increases both with applied frequency
and applied voltage as shown in Table 5.10. Experimental conditions are presented in
Table 5.8. For this set of experiments aIl the input parameters were kept constant except
input voltage and frequency, which were varied according to the table.
Table 5.10 Power consumption for K-9 ceramic at various applied voltages and frequencies
Ceramic: Alumina Voltage (V) ~
K-9 5000 6000 7000
Frequency ~ 1000 15.24 18.75 29.76 (Hz) 1240 17.25 25.50 31.59
3500 25.09 44.51 57.02 POWER WATTS
As shown in table 5.9 during the experiment there was registered an increase in both the
ceramic and gas temperature, even if there was no preheating of the natural gas for these
tests. The variation of ceramic and gas temperature for an operating time of six hours is
presented in Figure 5.6.
54
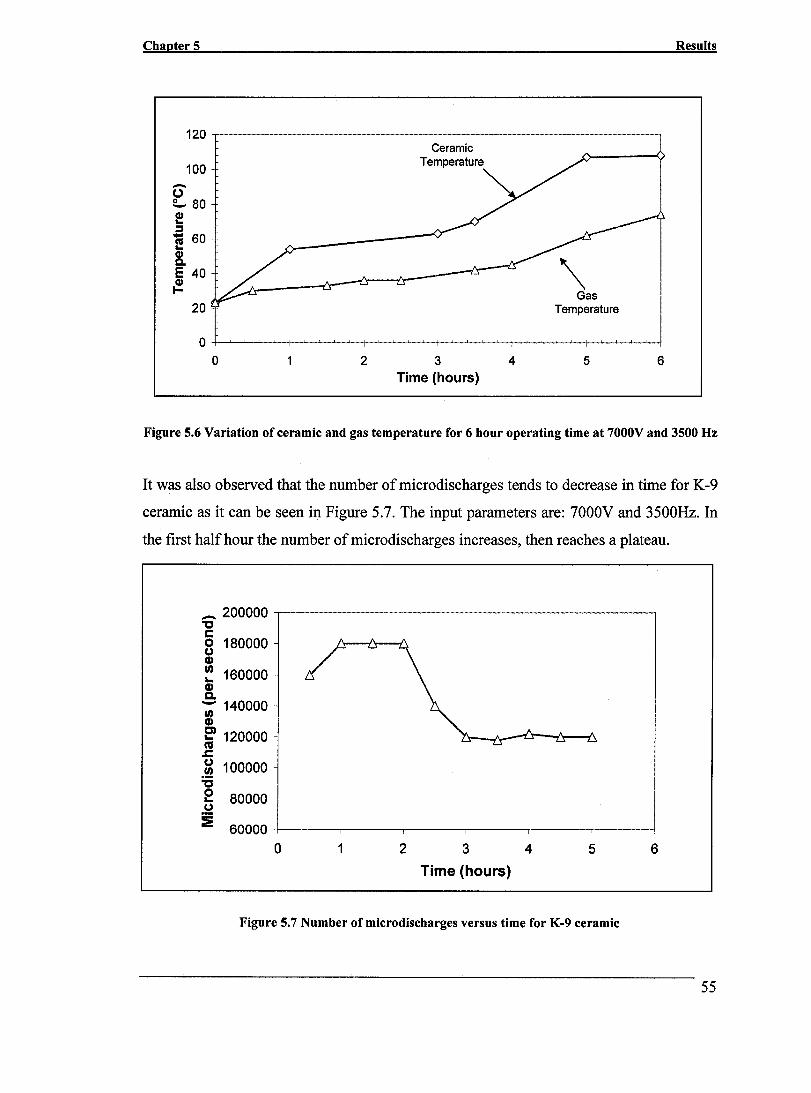
Chapter 5
120
100 -0 ~ 80 ! ~ .... 60 I! Q) c. E 40 Q) 1-
20
0 0 2
Ceramic Temperature
3 lime (hours)
4
Results
Temperature
5 6
Figure 5.6 Variation of ceramic and gas temperature for 6 hour operating time at 7000V and 3500 Hz
It was also observed that the number of microdischarges tends to decrease in time for K-9
ceramic as it can be seen in Figure 5.7. The input parameters are: 7000V and 3500Hz. In
the first half hour the number of microdischarges increases, then reaches a plateau.
_ 200000 "CI s::: 8 180000 CI,)
~ 160000 CI,) a. ;- 140000
CI,)
~ 120000 .c .~ 100000 "CI
2 80000 .~ ::!1 60000 +-----,----,---,-__ ...,.-__ --,-__ --\
o 1 2 3 4 5 6
Time (hours)
Figure 5.7 Number of microdischarges versus time for K-9 ceramic
55
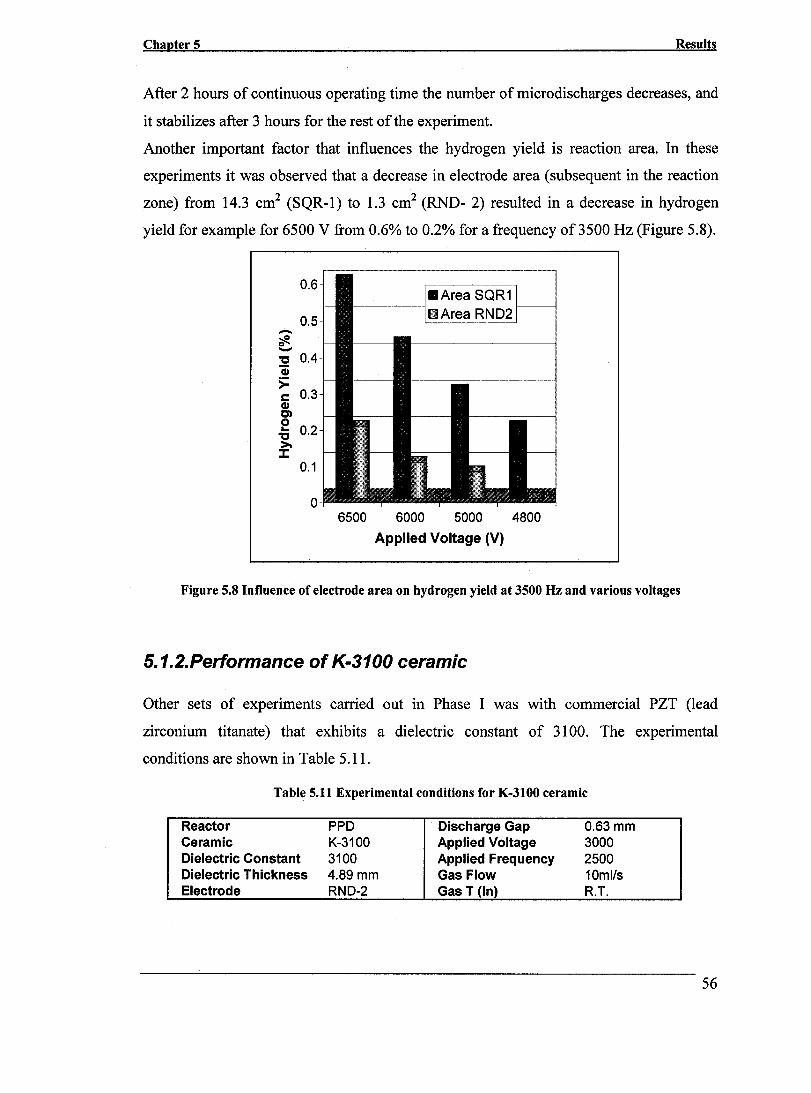
Chapter 5 Results
After 2 hours of continuous operating time the number of microdischarges decreases, and
it stabilizes after 3 hours for the rest of the experiment.
Another important factor that influences the hydrogen yield is reaction area. In these
experiments it was observed that a decrease in electrode area (subsequent in the reaction
zone) from 14.3 cm2 (SQR-1) to 1.3 cm2 (RND- 2) resulted in a decrease in hydrogen
yield for example for 6500 V from 0.6% to 0.2% for a frequency of 3500 Hz (Figure 5.8).
0.6
0.5 -.,. -"C 0.4 Q;
>= c 0.3 (1) CJ o oC 0.2 >J:
0.1
a 6500 6000 5000 4800
Applied Voltage (V)
Figure 5.8 Influence of electrode area on hydrogen yield at 3500 Hz and va rio us voltages
5. 1. 2. Performance of K-3100 ceramic
Other sets of experiments carried out in Phase 1 was with commercial PZT (lead
zirconium titanate) that exhibits a dielectric constant of 3100. The experimental
conditions are shown in Table 5.11.
Table 5.11 Experimental conditions for K-3100 ceramic
Reactor PPD Discharge Gap 0.63 mm Ceramic K-31 00 Applied Voltage 3000 Dielectric Constant 3100 Applied Frequency 2500 Dielectric Thickness 4.89 mm Gas Flow 10ml/s Electrode RND-2 Gas T (In) R.T.
56
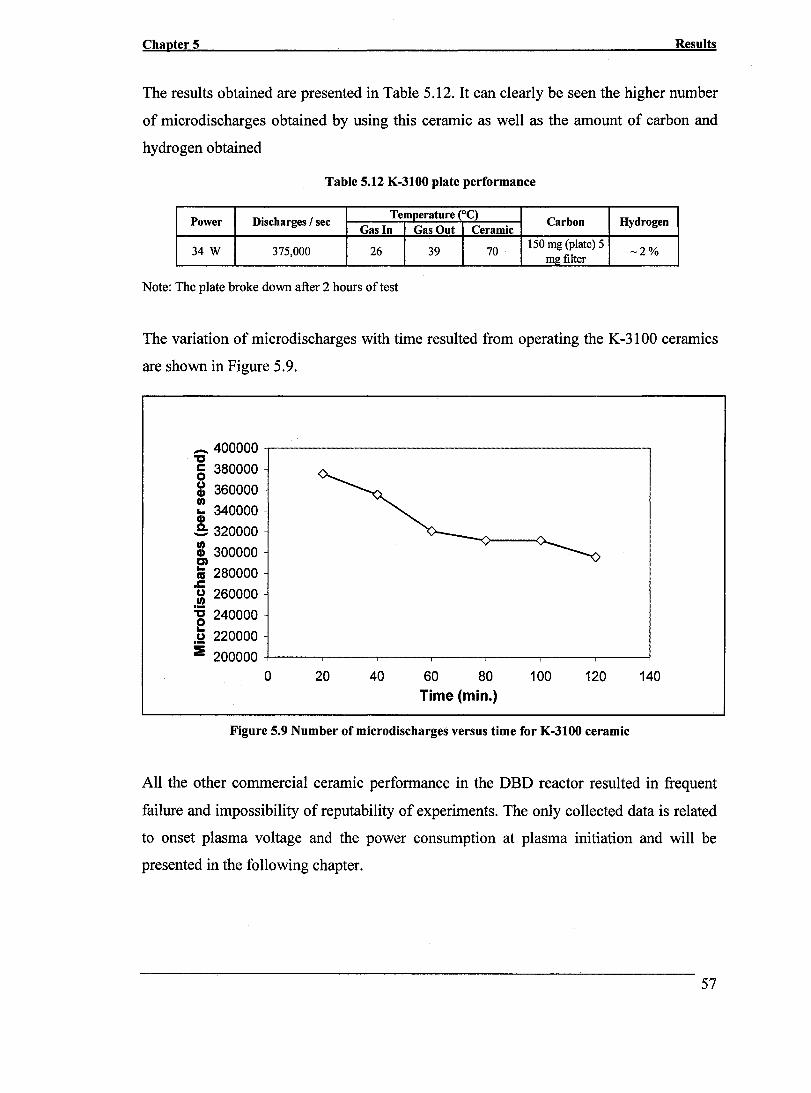
Chapter 5 Results
The results obtained are presented in Table 5.12. It can c1early be seen the higher number
of microdischarges obtained by using this ceramic as well as the amount of carbon and
hydrogen obtained
Table 5.12 K-3100 plate performance
Power Discharges 1 sec Temperature (OC)
Carbon Hydrogen Gas In Gas Out Ceramic
34 W 375,000 26 39 70 150 mg (plate) 5
-2% mg filter
Note: The plate broke down after 2 hours of test
The variation of microdischarges with time resulted from operating the K-31 00 ceramics
are shown in Figure 5.9.
_ 400000 -,-------------'C 5 380000
~ 360000
~ 340000
.S: 320000
l 300000
:a 280000 oC .~ 260000
-g 240000
.~ 220000 ::E 200000 +---,-------y----,.---,----,-----,----J
o 20 40 60 80 100 120 140
Time (min.)
Figure 5.9 Number of microdischarges versus time for K-3100 ceramic
AH the other commercial ceramic performance in the DBD reactor resulted in frequent
failure and impossibility of reputability of experiments. The only coHected data is related
to onset plasma voltage and the power consumption at plasma initiation and will be
presented in the following chapter.
57
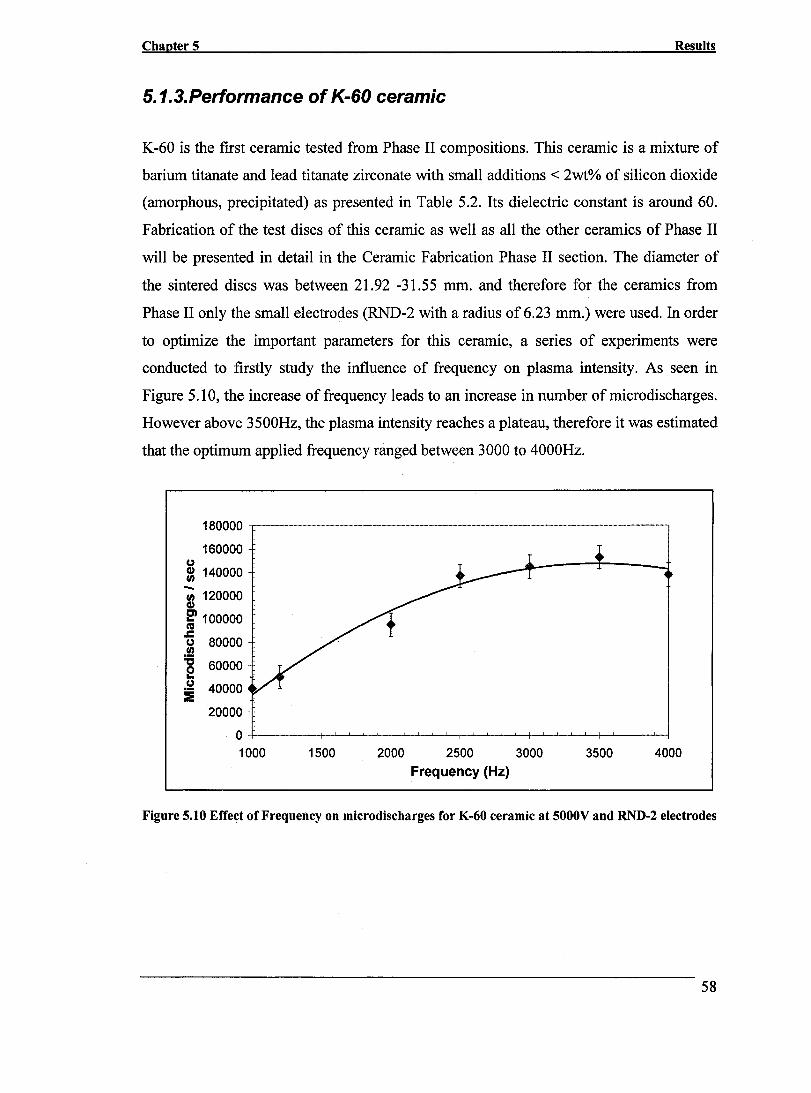
Chapter 5 Results
5. 1. 3. Performance of K-60 ceramic
K-60 is the first ceramic tested from Phase II compositions. This ceramic is a mixture of
barium titanate and lead titanate zirconate with smaU additions < 2wt% of silicon dioxide
(amorphous, precipitated) as presented in Table 5.2. Its dielectric constant is around 60.
Fabrication of the test discs of this ceramic as weU as aU the other ceramics of Phase II
will be presented in detail in the Ceramic Fabrication Phase II section. The diameter of
the sintered discs was between 21.92 -31.55 mm. and therefore for the ceramics from
Phase II only the smaU electrodes (RND-2 with a radius of 6.23 mm.) were used. In order
to optimize the important parameters for this ceramic, a series of experiments were
conducted to firstly study the influence of frequency on plasma intensity. As seen in
Figure 5.10, the increase offrequency leads to an increase in number ofmicrodischarges.
However above 3500Hz, the plasma intensity reaches a plateau, therefore it was estimated
that the optimum applied frequency ranged between 3000 to 4000Hz.
180000
160000 (.)
~ 140000 -1/) 120000 CI)
~ 100000
~ 80000
=g 60000 ... . ~ 40000 :E
20000 O+-~~~~~~~~~~~~~~~~~~-+~~~~
1000 1500 2000 2500 3000 3500 4000 Frequency (Hz)
Figure 5.10 Effect of Frequency on microdischarges for K-60 ceramic at 5000V and RND-2 electrodes
58
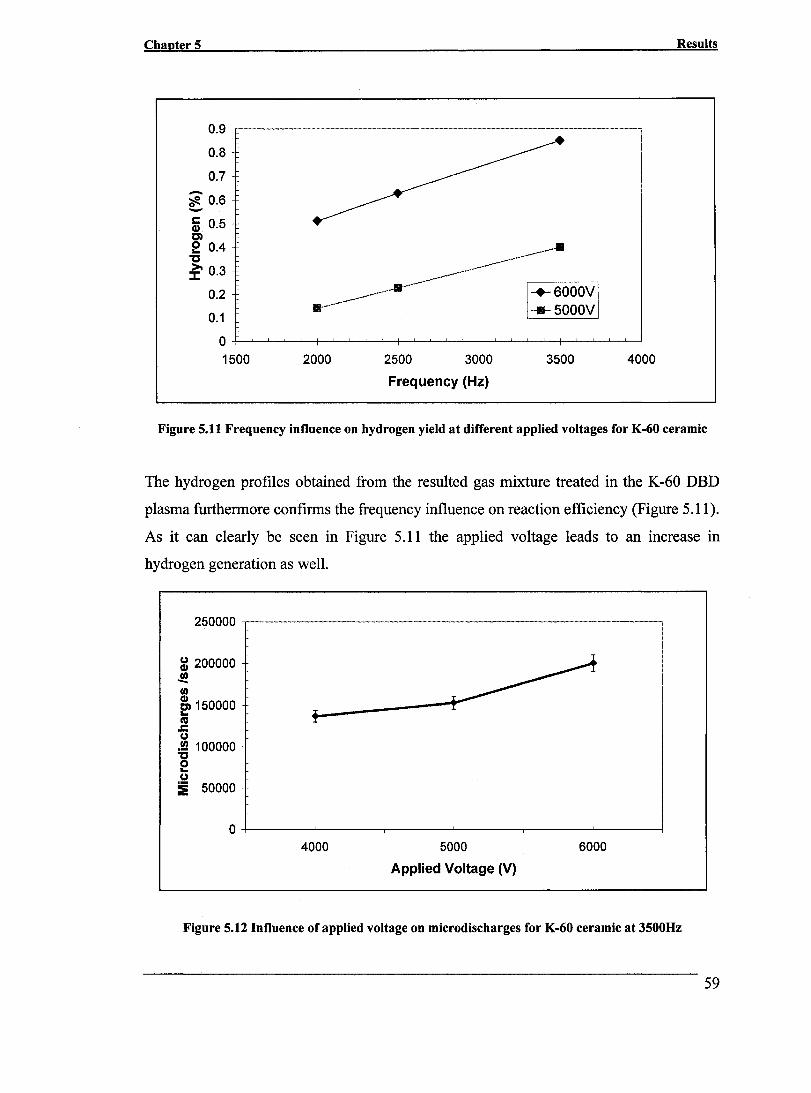
Chapter 5 Results
0.9 ........... _ .. _ ...... -.......................................... - ................ ---..................... - ............................................. ---................... --........ ---.. ..
0.8
0.7
?j 0.6 -5i 0.5 CI e 0.4 'tJ ::r 0.3
0.2
0.1 o +-~~~~~~~~-+~~~~~~~~~r-~~~~ 1500 2000 2500 3000 3500 4000
Frequency (Hz)
Figure 5.11 Frequency influence on hydrogen yield at different applied voltages for K-60 ceramic
The hydrogen profiles obtained from the resulted gas mixture treated in the K-60 DBD
plasma furthermore confirms the frequency influence on reaction efficiency (Figure 5.11).
As it can clearly be seen in Figure 5.11 the applied voltage leads to an increase in
hydrogen generation as weIl.
250000 ,...---..... -.. --..... ---....... ---.... -................ --.... -----..... -----.... - .. ----..... --.
~ 200000 .! fi)
& 150000 ... cu ..c CJ .!a 100000
~ CJ i 50000
o+-------~------,_------~------,_------~------~
4000 5000
Applied Voltage (V)
6000
Figure 5.12 Influence of applied voltage on microdischarges for K-60 ceramic at 3500Hz
59
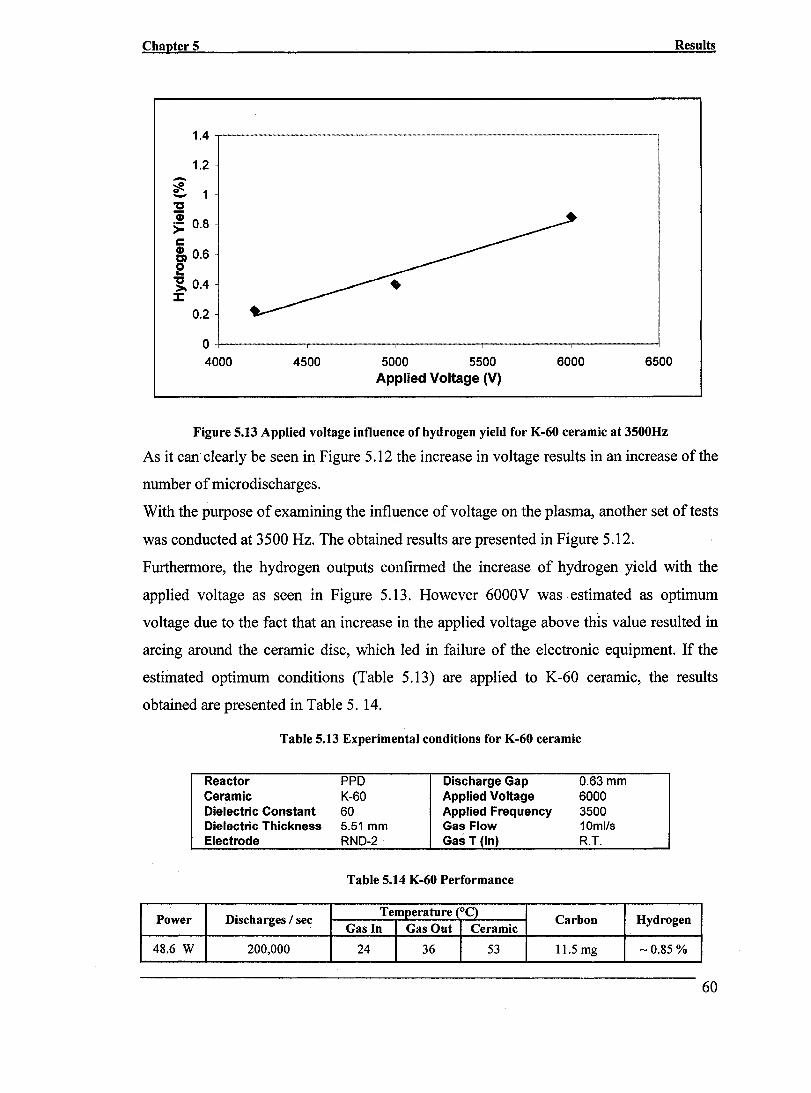
Chapter 5 Results
1.4
1.2
~1 "CI 'i :;: 0.8 c & 0.6 e 'g. 004 J:
0.2
o +---------,---------,----------r---------,--------~ 4000 4500 5000 5500 6000 6500
Applied Voltage (V)
Figure 5.13 Applied voltage influence of hydrogen yield for K-60 ceramic at 3500Hz
As it canclearly be seen in Figure 5.12 the increase in voltage results in an increase of the
number of microdischarges.
With the purpose of examining the influence of voltage on the plasma, another set of tests
was conducted at 3500 Hz. The obtained results are presented in Figure 5.12.
Furthermore, the hydrogen outputs confirmed the increase of hydrogen yield with the
applied voltage as seen in Figure 5.13. However 6000V was estimated as optimum
voltage due to the fact that an increase in the applied voltage above this value resulted in
arcing around the ceramic disc, which led in failure of the electronic equipment. If the
estimated optimum conditions (Table 5.13) are applied to K-60 ceramic, the results
obtained are presented in Table 5. 14.
Table 5.13 Experimental conditions for K-60 ceramic
Reactor PPD Discharge Gap 0.63 mm Ceramic K-60 Applied Voltage 6000 Dielectric Constant 60 Applied Frequency 3500 Dielectric Thickness 5.51 mm Gas Flow 10ml/s Electrode RND-2 Gas T (In) R.T.
Table 5.14 K-60 Performance
Power Discharges / sec Temperature (OC}
Carbon Hydrogen Gas In Gas Out Ceramic
48.6 W 200,000 24 36 53 11.5 mg ~0.85 %
60

Chapter 5 Results
5. 1.4. Performance of K-110ceramic
Another ceramic tested from Phase II of the experimental plan was K-110 ceramic. K-110
is a mixture of about 65% barium titanate and lead titanate (no Zr02, CdO, or SiOz). The
higher amount ofbarium titanate, as well as the absence of Zr02, CdO, or Si02, (Table
5.2) reflects in the electrical properties ofthis ceramic. The value of dielectric constant is
110 and there is a slight decrease ofits dielectric strength (compared to K-60 ceramic).
Similar with the other ceramic tested, an initial set of experiments was carried out to
determine the frequency influence on the number of microdischarges. The experimental
conditions for these tests are presented in Table 5.15. The obtained results are presented
in Figure 5.14.
Table 5.15 Experimental conditions for K-110 ceramic
Reactor PPD Discharge Gap 0.63 mm Ceramic K-110 Applied Voltage 4200 Dielectric Constant 110 Applied Frequency Various Dielectric Thickness 5.51 mm Gas Flow 10ml/s Electrode RND-2 Gas T (In) R.T.
165000 ................. __ .............................................. .......... -.................................................................................................................. _ ...................................................................... .
(,) 160000 CI) (1) -~ 155000 e» ! 150000
.~ "C e .~ :::E
145000
140000
135000 -t---------,--------,------,-----...............
2000 2500 3000 Frequency (Hz)
3500 4000
Figure 5.14 Frequency influence on microdischarges for K-110 ceramic at 4200 V
61

Chanter 5 Results
0.5 -rfl. :; 0.4 G) ): c 0.3 CI) C)
e 02 ~.
::z::: 0.1
0~~~-r~~~~~~~~~1-~~~~~~~~~~~
2000 2200 2400 2600 2800 3000 3200 3400
Frequency (Hz)
Figure 5.15 Influence ofapplied frequency for K-110 ceramic at 4200 V
As it can be seen in Figure 5.14 the optimum estimated frequency value could be placed
between 3500 and 4000 Hz. Furthermore, the hydrogen output for K-110 ceramic
confirms the increase ofhydrogen yield with applied frequency (Figure 5.15).
Considering the optimum frequency value as being 3500 Hz, the applied voltage was
varied as shown in Figure 5.16.
_ 1.2 rfl. -" 1 'i ): 0.8 c CI) C) 0.6 e ~ 0.4 ::z:::
0.2
O+-~~--~~--r-~~--~~~--~~--~~-+--~~
4000 4500 5000
Voltage (V)
5500
Figure 5.16 Influence of applied voltage on hydrogen yield for K-110 ceramic
62

Chapter 5 Results
There is a rise of hydrogen yield with voltage increase up until 5500 V, and probably
above this voltage value as weIl, however due to experimental set up limitations, namely
the ceramic disk size it was not possible a further increase in the applied voltage without
encountering arcing around the plate and, consequently damaging of the electronic
equipment.
Table 5.16 Optimum experimental conditions for K-110 ceramic
Reactor PPD Discharge Gap 0.63 mm Ceramic K-110 Applied Voltage 5500 Dielectric Constant 110 Applied Frequency 3500 Dielectric Thickness 5.51 mm Gas Flow 10ml/s Electrode i RND-2 Gas T (In) R.T.
The estimated optimum conditions for this ceramic are presented in Table 5.16 and the
obtained results in Table 5.17.
Table 5.17 Performance ofK-110 ceramic
Power Discharges / sec Temperature (OC) Carbon Hydrogen
Gas In Gas Out Ceramic
43.6 W 243,000 22 50 70 30 mg -1.14 %
5. 1. 5. Performance of K-166 ceramic
Ceramic K-166 belongs to the Phase II of the experimental plan and its composition and
properties are presented in Table 5.2 and Table 5.3, respectively. It is a calcium titanate
perovskite ceramic with a dielectric constant value of 166. A series of tests was carried
out with this ceramic in order to study the influence of different parameters on the
discharge physics of the DBD reactor. The first set was carried out to examine the
influence of the discharge gap on the plasma ignition, power consumption and on the
temperature of the gaseous phase. The results obtained are presented in Figures 5.17 and
5.18, respectively.
63
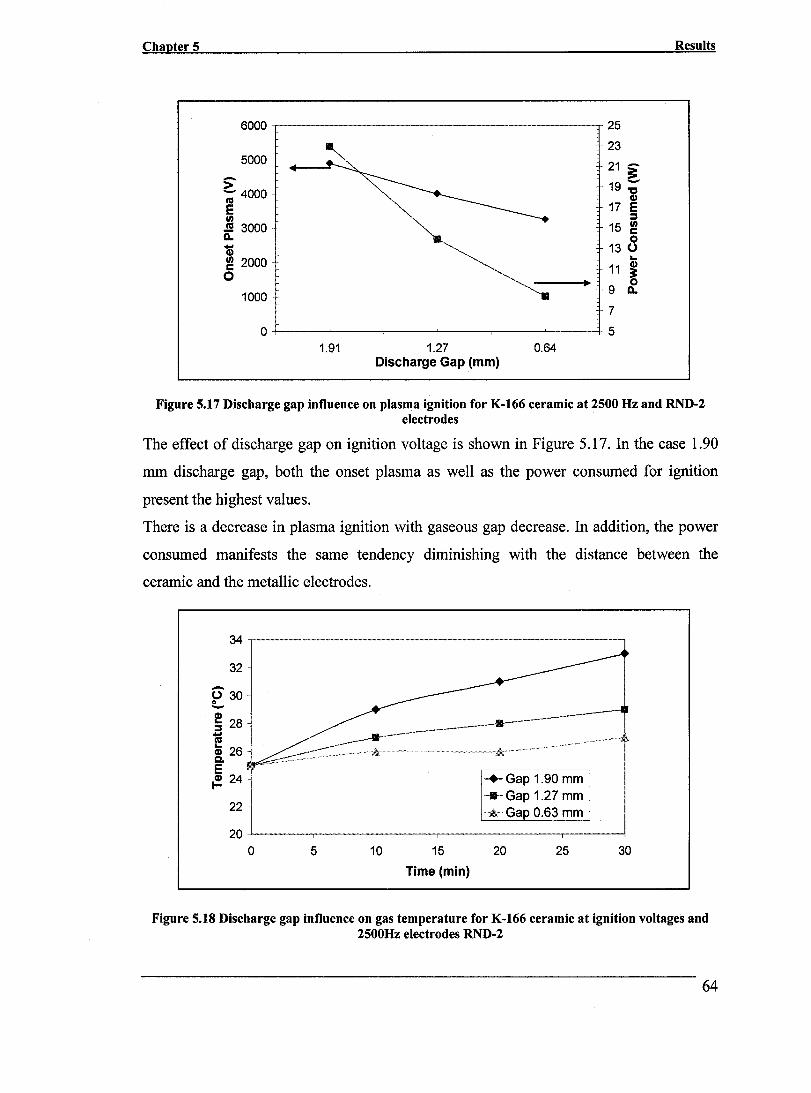
Chapter 5 Results
6000 ------_._- 25
23 5000
21 :i" li -~ 4000 19 :;
CI)
E 17 E 1/) :::s .m 3000 15 ~ 0... 0 1) ',,- 13 () ~ 2000 "
.. 11 ; 0 ',-
'-.. ~
9 ~ 1000 ~.
7
0 5 1.91 1.27 0.64
Discharge Gap (mm)
Figure 5.17 Discharge gap influence on plasma ignition for K-166 ceramic at 2500 Hz and RND-2 electrodes
The effect of dis charge gap on ignition voltage is shown in Figure 5.17. In the case 1.90
mm discharge gap, both the onset plasma as well as the power consumed for ignition
present the highest values.
There is a decrease in plasma ignition with gaseous gap decrease. In addition, the power
consumed manifests the same tendency diminishing with the distance between the
ceramic and the metallic electrodes.
32
-~ 30 -e 28 :::s -ni ~ 26 Q. E ~ 24
22
20 0 5 10 15
Time (min)
-+- Gap 1.90 mm .... -Gap 1.27 mm A Gap 0.63 mm
20 25 30
Figure 5.18 Discharge gap influence on gas temperature for K-166 ceramic at ignition voltages and 2500Hz electrodes RND-2
64
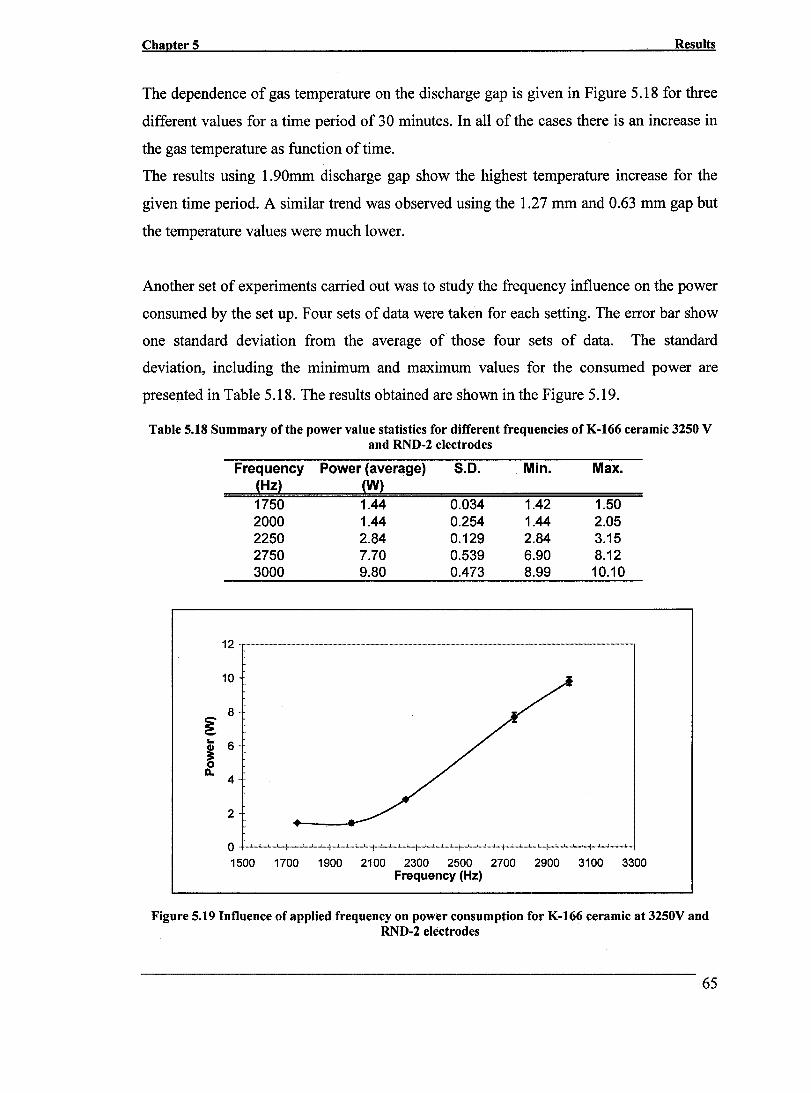
Chapter 5 Results
The dependence of gas temperature on the discharge gap is given in Figure 5.18 for three
different values for a time period of 30 minutes. In aH of the cases there is an increase in
the gas temperature as function of time.
The results using 1.90mm discharge gap show the highest temperature increase for the
given time period. A similar trend was observed using the 1.27 mm and 0.63 mm gap but
the temperature values were much lower.
Another set of experiments carried out was to study the frequency influence on the power
consumed by the set up. Four sets of data were taken for each setting. The error bar show
one standard deviation from the average of those four sets of data. The standard
deviation, inc1uding the minimum and maximum values for the consumed power are
presented in Table 5.18. The results obtained are shown in the Figure 5.19.
Table 5.18 Summary of the power value statistics for different frequencies ofK-166 ceramic 3250 V and RND-2 electrodes
Frequency (Hz)
1750 2000 2250 2750 3000
Power (average) (W)
1.44 1.44 2.84 7.70 9.80
S.D.
0.034 0.254 0.129 0.539 0.473
Min.
1.42 1.44 2.84 6.90 8.99
Max.
1.50 2.05 3.15 8.12 10.10
12 .. ------.-.-.. --...... --.. --.--- ......... ---.---... -........ --------... --... -..... -.-.-------.. --... ---.. --.--... --.... -.... -... ---
10·
2
1500 1700 1900 2100 2300 2500 2700 2900 3100 3300 Frequency (Hz)
Figure 5.19 Influence of applied frequency on power consumption for K-166 ceramic at 3250V and RND-2 electrodes
65

Chapter 5 Results
It was observed that the applied frequency has an effect on the power applied to the
reactor. The effect of operating frequency on power for K -166 ceramic is shown in Figure
5.19. The power drawn by the reactor increases with increasing frequency.
In an attempt to optimize the discharge reactor with K-166 ceramlC, a series of
experiments were performed to study the effect of frequency on plasma intensity (number
of microdischarges).
AlI the reactor parameters were held constant (voltage value 3500V) while the frequency
was varied between 1 kHz to 5 kHz. The number of microdischarges produced varied
(Figure 5.20) suggesting that the frequency has an influence on plasma intensity.
200000 ----------------.. -.. -----------.------.. -----.--------------
180000
g 160000 III - 140000 III g, 120000 ... .! 100000 u .!!! 80000 "CI e 60000 u !:i 40000
20000
• •
O+-----~------~------~------~----~------~
1500 2000 2500 3000
Frequency (Hz)
3500 4000 4500
Figure 5.20 Frequency influence on plasma intensity for K-l66 ceramic at 3500 V and RND-2 electrodes
As pointed out in Figure 5.20, the optimum frequency range for this type of ceramic is
around 3500 Hz. Keeping constant this frequency value and varying the applied voltage
the hydrogen output is presented in Figure 5.21. As shown, there is an increase in
hydrogen yield with voltage increase.
66
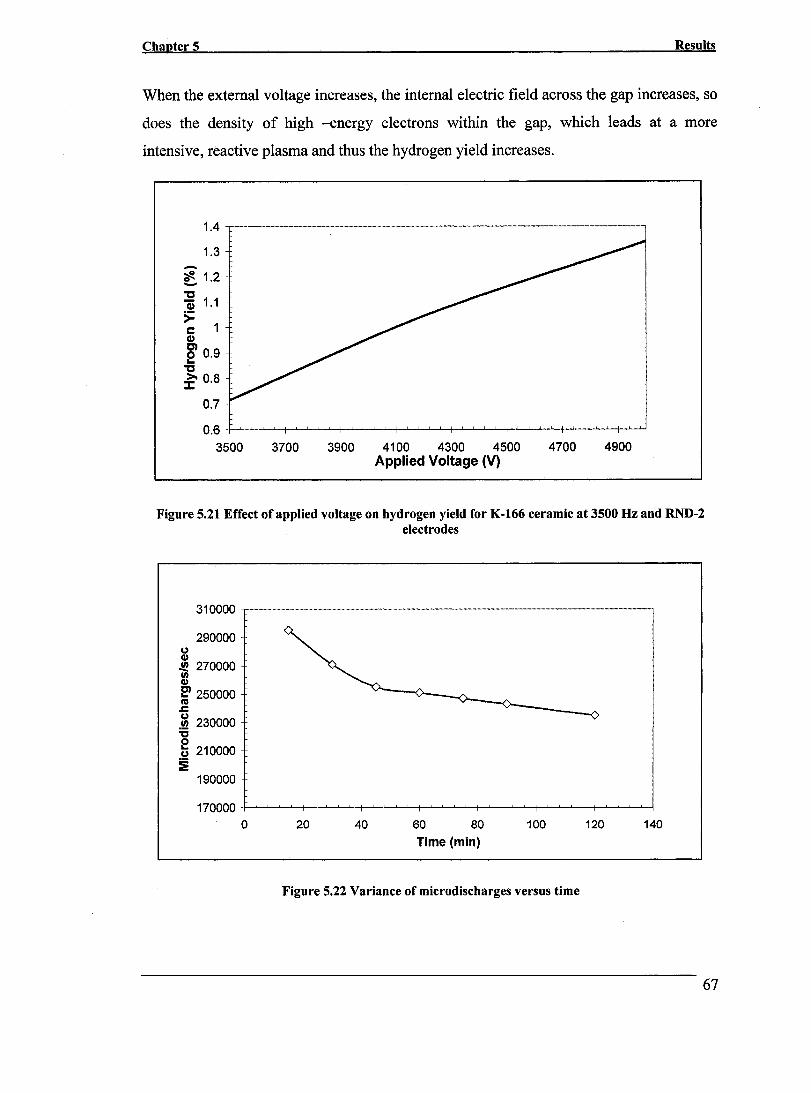
Chapter 5 Results
When the external voltage increases, the internaI electric field across the gap increases, so
does the density of high -energy electrons within the gap, which leads at a more
intensive, réactive plasma and thus the hydrogen yield increases.
1.3 -?ft. 1.2 -'tS Q; 1.1 >= c CI) C) o 0.9 ...
'tS ~0.8
0.7
0.6 -Ç..-J.-'--'---'--t-'---'---'--'--i-.L..-l-....J.-..J--!-...l-.l.-'-'---f-............ ......J.....-'--f--'-l........I--'--f-.l.....-'-'---'-I---'--".J
3500 3700 3900 4100 4300 4500 4700 4900 Applied Voltage (V)
Figure 5.21 Effect ofapplied voltage on hydrogen yield for K-166 ceramic at 3500 Hz and RND-2 electrodes
310000 "'-----.. ------------"'-.... "' ........... -.-."'---"' .. ---.--...... ---.------.. -.. -"' .............. -"' .. -.. "'-----.-....... -----.---.. -.-.............. -.--
290000 ~ .!!! 270000 :l ~ 250000
s::. .~ 230000 '8 t; 210000 i
190000
o 20 40 60 80 100 120 140
Time (min)
Figure 5.22 Variance of microdischarges versus time
67

Chapter 5 Results
The variance ofnumber ofmicrodischarges with time is shown in Figure 5.22. A decrease
in plasma intensity with time is registered for K -166 ceramic.
The estimated optimum parameters for K-166 are listed in Table 5.19 and the K-166
ceramic performance in plasma environment in Table 5.20.
Table 5.19 Optimum experimental conditions for K-I66 reactor
Reactor PPD Discharge Gap 0.63 mm Ceramic K-166 Applied Voltage 5000 Dielectric Constant 166 Applied Frequency 3500 Dielectric Thickness 5.50 mm Gas Flow 10mlls Electrode RND-2 Gas T (In) RT.
Table 5.20 K-166 ceramic performance
Power Discharges 1 sec Temperature (OC)
Carbon Hydrogen Gas In Gas Out Ceramic
39.7 295,000 23 57 79 40 mg -1.34%
A range of reaction parameters has been varied to study their effect on plasma intensity,
hydrogen yield, and energy consumption in the DBD reactor equipped with different
dielectric ceramics. The results indicate that, among other parameters, the ceramic
properties, namely, the ceramic relative permittivity, enhances the methane dissociation
in the reaction.
68

Chapter 5 Results
5.2.CERAMIC FABRICATION
The premixed ceramic powders were prepared by conventional method. For all the
ceramic formulations from Phase II a particles size analysis was performed in order to
study the compactibility of the powders. Fabrication of the test discs was done by uniaxial
pressing with a standard dry press.
Studies were conducted in order to determine the amount of binder that would lead to
higher densification of the samples. It was found that 2 % PV A water solution binder
would lead to densities above 95 % of theoretical densities in all of the ceramic
formulations from Phase II. The preparation of the slurries consisted in the following
steps: the premixed ceramic powders were weighted in 100g batches, then the liquid
binder was stirred in with a spatula in polyethylene jars, and the zirmolite grinding media
was added in a ratio powder to media 2:3.The obtained slurry was mixed in a ball mill for
1 hour. The mixed slurry was removed from the jars, pored into trays and allowed to dry
for 17 hours at room temperature. The dried slurry cornes out in large chunks. The chunks
were crashed with a mortar and pestle until the particles pass through a No. 45 (350 J..lm)
steve.
5.2.1.K-60 Ceramic
Particle Characterization
As shown in Figure 5.23 the particle size of K-60 ceramic manifests a unimodal
distribution, with the higher number of counts of approximately 13.6% at around 0.51
J..lm. The mean particle size for this ceramic takes place at around 0.51 !-lm. This uniform
distribution was reflected in the good compactibility of the powder. No additional milling
time was needed for the ceramic in order to achieve green densities between 63 to 65 %
of TD. This conferred enough green strength for handling of the ceramic compacts prior
to sintering.
69

Chapter 5
14 +-____ ~-~L--~-----+_----~~
12+-----~~~--~-----+-----~-+
~10+-----+ ->-g 8+-----+ CI) :::J C' 6 +------e u.
4+-----
2+-----
o --1-___ -.4
0.022 0.339 5.122 77.339 Diameter (microns)
1167.725
100
90
80
70 -60 ?ft. -CI)
50 N
'f! 40 CI)
> 30
0
20
10
0
Figure 5.23 Particle size analysis and cumulative size distribution for K-60 ceramic
Firing Profile
Results
In Figure 5.24 firing profile of K-60 ceramic is presented. The heating rate was 10-
11 oC/min., with a soaking time of 2 hours at 1350°C and then the samples were fumace
cooled.
1200 " ........ _--.""" .. "".".""" ............. " .. " ... """"""""" .. " ...... "".""-""" ...... " ... " ......... ,, ... "".""" .. " ..................... "."." ......... " ........ """"""-""""." ... """" .. """,,,,--,,---
1000+_---4-~~/'-r-----+----~-----\~,+-----~~
Ê 800+_--~~~--+---~--~--_+~~---r-~ ~)/ \ 1 600+--~-~---~---+----4---~-~~\-+-~ ~ 400 / '\ 200+1r---r---~--~----4---_+---~~
o 2 3 4 5 6 Time (hours)
Figure 5.24 Firing profile for K-60 ceramic
70

Chapter5 Results
The densities of the fired compacts are presented in Table 5.21, and they were performed
on three different samples from which three pie ces from different region of the sample
were analyzed.
Table 5.21 Densities of K-60 ceramics
Sam pie Dry Weight Suspended Saturated Open Bulk TO %TO Weight Weight Porosity Oensity
(g) (g) (g) (%) (g/cm3) (g/cm3
)
K60 - Sam pie 1 1 3.5900 2.9723 3.591 0.0016 5.8024 5.8 100.04 2 0.8442 0.6961 0.847 0.0185 5.5944 96.46 3 2.1015 1.7325 2.102 0.0013 5.6874 98.06
Average density: 5.6947 98.19
K60 - Sam pie Il 1 0.2898 0.2390 0.290 0.0039 5.6823 5.8 97.97 2 0.6192 0.5105 0.620 0.0073 5.6547 97.49 3 0.4660 0.3845 0.466 0.0000 5.7177 98.58
Average density: 5.6849 98.02
K60 - Sam pie III
1 0.9210 0.7600 0.921 0.0000 5.7204 5.8 98.63 2 0.4783 0.3944 0.479 0.0082 5.6536 97.48 3 0.7603 0.6267 0.761 0.0052 5.6612 97.61
A vera9.e densitr.: 5.6784 97.90 Average %TD - Samples 1, Il, III 98.03
As it can be seen in Table 5.21, the densities achieved were between 96-100% of the
theoretical value. The average density was of ~ 98% of TD. Therefore, these ceramics
were easy to sinter with a very good relative density and a very low percent of open
porosity.
Temperature Influence on Dielectric Properties
The variation of capacitance of the ceramlCS under investigation was measured as
function of temperature. The measured capacitance for K-60 ceramics varied over the
temperature range of interest as illustrated in Figure 5.25. The capacitance value and, as a
result the relative permittivity of this ceramic gradually decreases as the temperature in
the reactor rises. This is a detrimental factor for the reactor efficiency. The increase in the
gas temperature consequently reduces the ceramic performance.
71
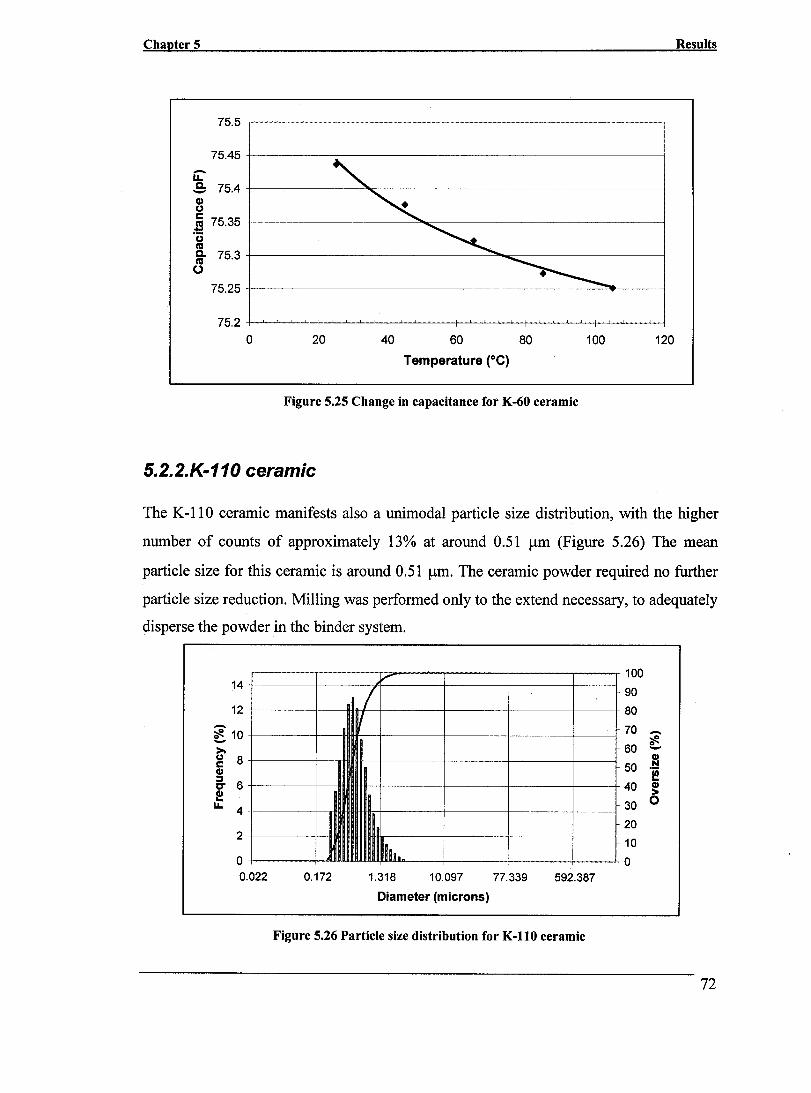
Chapter 5
75.5,-----------------· ---------
75.45 +-------,----------------------1 -LL .S: 75.4 +---------"~------------------I Il) (,)
~ 75.35 +------------'''''''''''-----------------1 -'ëj C'G g. 75.3 +_--------------="'"'o~------------I o
75.25 +------------------------'~------I
o 20 40 60
Temperature (OC)
80
Figure 5.25 Change in capacitance for K-60 ceramic
5.2.2.K-110 ceramic
100 120
Results
The K-110 ceramic manifests also a unimodal particle size distribution, with the higher
number of counts of approximately 13% at around 0.51 ~m (Figure 5.26) The mean
particle size for this ceramic is around 0.51 ~m. The ceramic powder required no further
particle size reduction. Milling was performed only to the extend necessary, to adequately
disperse the powder in the binder system.
14 + -_ -_ ------·-·--·---·--1·--·f---·--·----·------·-------·~~r~:=====:=======~=======:===~-r
12T-----I-~r+/--_r--~--+--~ il ~10+_--~--HH--+---~---r_---4-~ -~ 8+---~-,a~-+---4_---~--_4-~ c Il)
& 6+---~-~HK-+---4_---~--_4--+ e LL 4+---~~HH~k+---4_---~--_4-----1
2+---~~MHHK~---4_-----~----_4--~
o~ __ -+~~~llh~Io.~.-+ ____ +-__ -+ __ ~ 0.022 0.172 1.318 10.097 77.339 592.387
Diameter (microns)
Figure 5.26 Particle size distribution for K-110 ceramic
100
90
80
70 -~ 60
Q --50 .~
f 40 Il)
30 ~ 20
10
0
72

Chapter 5 Results
The firing temperature was 1050°C with a 1.5-hour soak at the peak temperature, as
presented in Figure 5.27.
_ 1200 (.) ~ 1000 w ~ 800 ::)
~ 600
w 400 Il. :E 200 w 1- 0
L"
/ /1'
/' /
V
o 1
...... "-
'"
2 3
TIME (hours)
" "-
Figure 5.27 Firing profile for K-110 ceramic
~,
4 5
After firing the relative densities of the samples were measured and they were found to be
above 98% of the TD as presented in Table 5.22.
Table 5.22 Relative densities of the KIlO sintered disks
Sam pIe Dry suspended saturated Open Bulk TD %TD Weight Weight Weight Porosity Density
(g) (g) (g) (%) (g/cm3) (g/cm3
)
K110 - Sam pIe 1 1 2.3372 1.9395 2.339 0.0045 5.8503 5.9 99.15 2 2.3923 1.9843 2.395 0.0065 5.8249 98.72 3 1.1716 0.9724 1.173 0.0069 5.8405 98.99
Average density: 98.95
K110 - Sam pIe " 1 1.5547 1.2883 1.556 0.0048 5.8076 5.9 98.43 2 2.2964 1.9036 2.301 0.0091 5.7931 98.18 3 1.2958 1.0742 1.297 0.0053 5.8159 98.57
Average density: 98.39 K110 - Sam pIe III
1 2.3461 1.9458 2.348 0.0047 5.8331 5.9 98.86 2 1.9621 1.6261 1.963 0.0026 5.8222 98.68 3 0.8731 0.7218 0.874 0.0059 5.7365 97.22
Average density: 98.25 Average % rD - Samples l, Il, II/ 98.53
73

Chapter 5 Results
Capacitance variation as function oftemperature is presented in Figure 5.28. As it can be
observed there is a decrease in capacitance as the temperature increases.
120 .. -------.. -.---------... -.. ------... ---.----.----..... --------..... -------... --... -.-----
119.5 +---------------------------1
u:-S: 119 -1-------------------------j CI) (J
i 118.5 +---------"""~---------.--------j .... '(j l'CI
~ 118+--------------~~----------j o
117.5 +-----------------------''''''''''-..------1
117~~~~~~~~~~~~~~~~~~~~~~~-Y
o 20 40 60 80 100 120 140 160 Temperature (OC)
Figure 5.28 Change in Capacitance for K-II0 Ceramic
5.2.3.K-166 ceramic
The particle size distribution manifests a unimodal distribution, with the higher number of
counts ofapproximately 13.7 % at around 0.58 J..lm (Figure 5.29).
16 ---.-.. -..... -.. -----
14+-----~-~~~---_r---_r---_+-~
12-j-----~--fl~~---_r---_r---_+-~
~ ~ 10 -j-----+--~ i 8 +-----+----t
= l 6 +------f--LI.
4 +-----~_I_
2 -j------j---HII-
o -j-___ +-.4.II.IL
0.022 0.172 1.318 10.097 77.339 592.387
Diameter (microns)
Figure 5.29 Particle size distribution for K-166 ceramic
100
90
80
70 -t!-60 -CI)
50 .!::! I!!
40 CI)
> 30 0
20
10
0
74
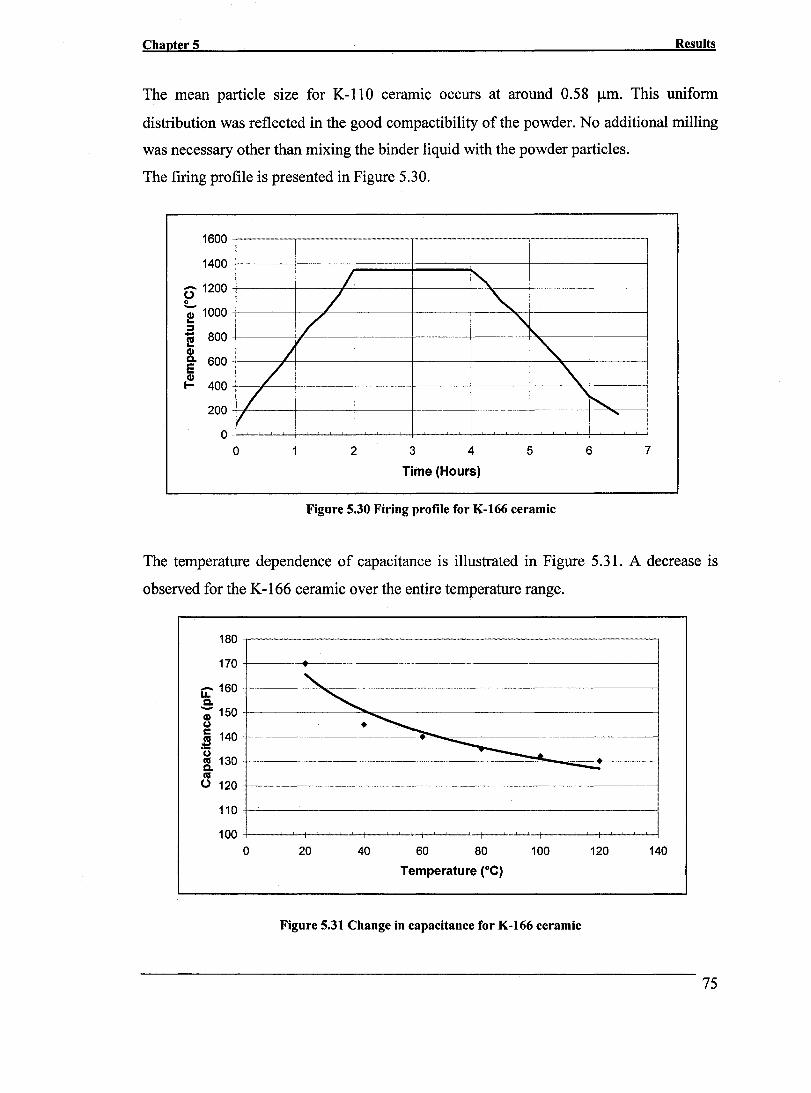
Chapter 5 Results
The mean particle size for K-110 ceramic occurs at around 0.58 ).lm. This uniform
distribution was reflected in the good compactibility of the powder. No additional milling
was necessary other than mixing the binder liquid with the powder particles.
The firing profile is presented in Figure 5.30.
1600
1400t-----t-----~~~~~~t_----r_----r_--~
P 1200 +---~_I__~/..f/-+-~-+-~--+I"-*-'\..~+--~-I--~--I if 1000+-----_+~--~--~----~----~----"~,,~------+-----~ ë 800+------h~----~----~-----4------~~-----+----~
8. 600 J ~ ~ 400 / '\.
/ ~~ 200 1 ..........
V ' O~~~_+~~~~~~~~~~~~~~~~~~~~
o 2 3 4 5 6 7
Time (Hours)
Figure 5.30 Firing profile for K-166 ceramic
The temperature dependence of capacitance is illustrated in Figure 5.31. A decrease is
observed for the K -166 ceramic over the entire temperature range.
180
170
Li:' 160 Q. - 150 ~ ; 140 :!:
~ 130 Q. l'CI o 120
110
100 o
--- --------------
" , .~ ~
--...:
1
20 40 60 80 100 120 140
Temperature (OC)
Figure 5.31 Change in capacitance for K-I66 ceramic
75

CHAPTER6
DISCUSSION
In this chapter, first, the results of the dielectric barrier discharge (DBD) experiments are
discussed and the fundamentals based on which the important parameters influence the
reactor efficiency, namely hydrogen yield and microdischarges are described. Aiso a
comparison between the reliability, in terms of breakdown voltage, between the available
commercial ceramic and the medium K' fabricated ceramics is presented. Finally, the
solid phase obtain in the dissociation process, carbon black particles are examined by
scanning electron microscope.
Microdischarge Properties
The non-thermal plasma operating at atmospheric pressure consists in a large number of
microdischarges distributed over the entire electrode area. Each microdischarge lasts only
a few nanoseconds and reaches current densities of 100-1000 A/cm2 [7]. At the dielectric,
these microdischarges spread into surface discharges that can coyer a much wider area.
The "strength" of a microdischarge can be characterized by the amount of charge
transported or by the energy density deposited in the discharge channel after termination
of the current flow. Since the interruption of the CUITent in an individual microdischarge
is caused by local reduction of the electric field due to space charge accumulation on the
76
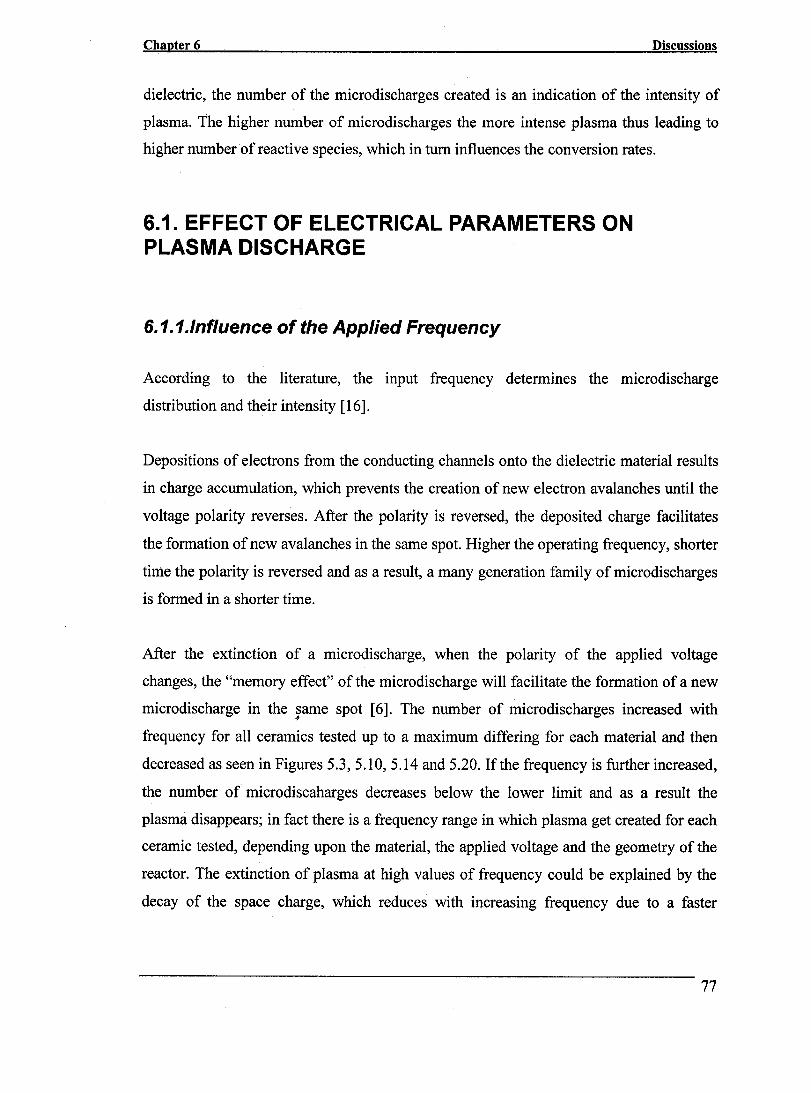
Chapter6 Discussions
dielectric, the number of the microdischarges created is an indication of the intensity of
plasma. The higher number of microdischarges the more intense plasma thus leading to
higher number of reactive species, which in turn influences the conversion rates.
6.1. EFFECT OF ELECTRICAL PARAMETERS ON PLASMA DISCHARGE
6.1.1.1nfluence of the Applied Frequency
According to the literature, the input frequency determines the microdischarge
distribution and their intensity [16].
Depositions of electrons from the conducting channels onto the dielectric material results
in charge accumulation, which prevents the creation of new electron avalanches until the
voltage polarity reverses. After the polarity is reversed, the deposited charge facilitates
the formation ofnew avalanches in the same spot. Higher the operating frequency, shorter
time the polarity is reversed and as a result, a many generation family of microdischarges
is formed in a shorter time.
After the extinction of a microdischarge, when the polarity of the applied voltage
changes, the "memory effect" of the microdischarge will facilitate the formation of a new
microdischarge in the same spot [6]. The number of microdischarges increased with ., frequency for an ceramics tested up to a maximum differing for each material and then
decreased as seen in Figures 5.3, 5.l0, 5.l4 and 5.20. If the frequency is further increased,
the number of microdiscaharges decreases below the lower limit and as a result the
plasma disappears; in fact there is a frequency range in which plasma get created for each
ceramic tested, depending upon the material, the applied voltage and the geometry of the
reactor. The extinction of plasma at high values of frequency could be explained by the
decay of the space charge, which reduces with increasing frequency due to a faster
77
Chapter 6 Discussions
reversaI of the electric field. Acceleration of the remaining space charge by the reversing
electric field decreases the amount of current needed to sustain the discharge.
The power consumed by the reactor increases with frequency for an ceramics tested
(Table 5.10, 5.18) and this was in agreement with the literature [46]. Hydrogen yield
increased with frequency (Figures 5.11, 5.15). Increasing the frequency results in an
increase in time for the electron impact reactions to occur, and therefore, hydrogen
production increases.
6.1.2.1nfluence of the Applied Voltage
Figure 6.1 shows the more detailed influence of applied voltage on hydrogen generation
for ceramic K-9. The graph obtained could be divided into three regions. In the first
region (1) no hydrogen is formed since the voltage has not reached a high enough value
for break down of the methane gas to occur.
The region II starts at the on set voltage where the methane molecules breakdown starts to
occur and hydrogen is detected. Hydrogen concentration enhances sharply in this region.
This behavior can be explained from the observation that, with increasing discharge
voltage, more and more discharge filaments built up and fill a growing part of the
electrode area until finally the whole gap area is bridged and covered with discharge
filaments.
The hydrogen yield increases up to a certain limit where the rate of the increase tends to
slow down and then to decrease - region III. This phenomenon could be explained as
follows: at higher voltages, more energetic electrons are produced and probably the
selectivity towards other hydrocarbon formation increases or probably dissociation of
already formed hydrogen molecules takes place, but since the sensitivity of the Ge was
limited to hydrogen, more research is needed in order to verify above explanations.
78

Chapter6
-';!. -"C Qi
>= c CI) tJ) e "C >-::t:
0.7
0.6
0.5
0.4
0.3
0.2
0.1
0
_o.fO 00 3000 4000 5000 6000
Discussions
1 1
• III
7 0
-0.2 -------------------------------------,,----- .1. ___________ ,, ________________________ ------------
Applied Voltage (V)
Figure 6.1 Hydrogen yield as a function of applied voltage for K-9 ceramic
The increase in hydrogen generation with the applied voltage was observed as well for the
other used ceramics (5.13,5.16,5.21). However, due to limitations on the ceramic di sc
dimensions, the voltage could not be increased to maximum value allowed by the ceramic
and the hydrogen yield increase showed a more linear trend.
As the voltage increased the gas temperature in the reaction zone also increases. Since a
direct measurement of the gas temperature in the discharge gap was not possible due to
arcing between the thermocouple and the metallic electrodes, it remained unc1ear from
the results, whether the ceramic itself is heated through dielectric losses or the gas is
heated by the microdischarges.
It is likely that a part of the energy created in the gas stream by the microdischarges is
dissipated as heat during the relaxation of the excited molecules and therefore the reactor
heating occurs from the gas itself than from the dielectric material. Furthermore alumina
ceramic (K-9) has a very low dissipation factor and there were increases of the reactor
temperature when this ceramic was used (table 5.9).
79
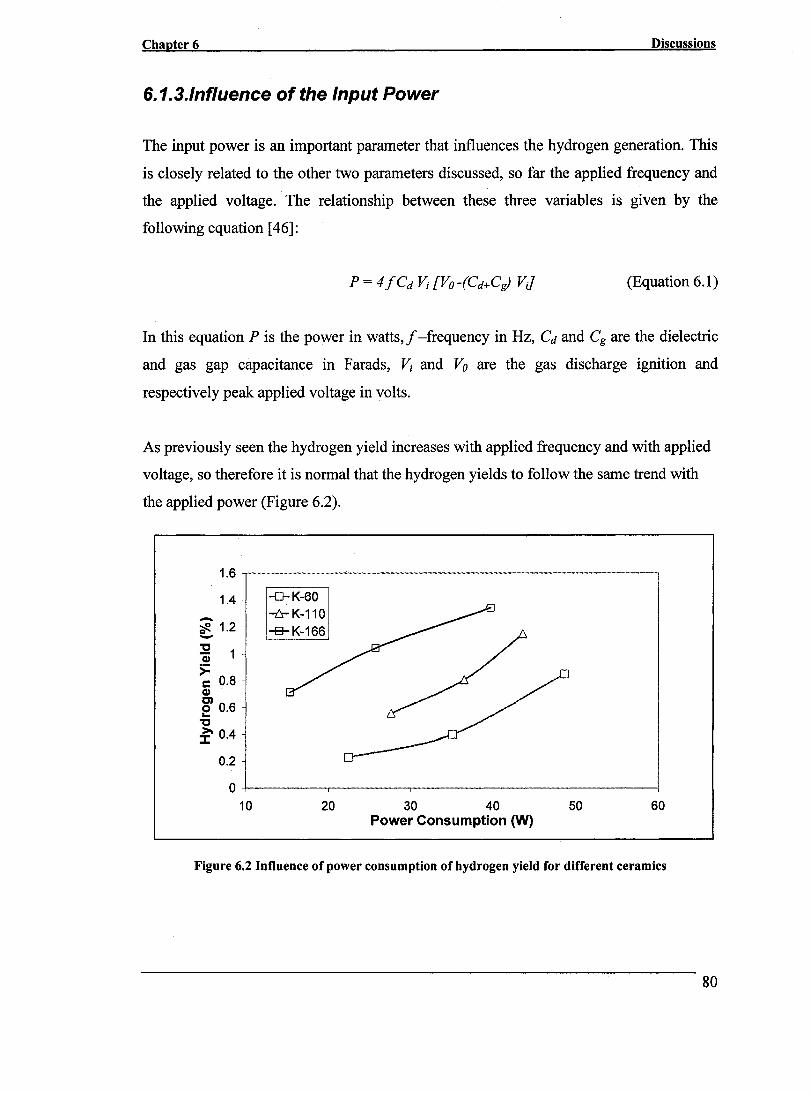
Chapter 6 Discussions
6.1.3.1nfluence of the Input Power
The input power is an important parameter that influences the hydrogen generation. This
is c10sely related to the other two parameters discussed, so far the applied frequency and
the applied voltage. The relationship between these three variables is given by the
following equation [46]:
(Equation 6.1)
In this equation P is the power in watts, f -frequency in Hz, Cd and Cg are the dielectric
and gas gap capacitance in Farads, Vi and Vo are the gas discharge ignition and
respectively peak applied voltage in volts.
As previously seen the hydrogen yield increases with applied frequency and with applied
voltage, so therefore it is normal that the hydrogen yields to follow the same trend with
the applied power (Figure 6.2).
1.6 ........ ---.-.................................... - .................... __ .................................. -.............................. - .. -........ --
1.4
~ 1.2 -'tJ ëi)
>= c 0.8 CI> C) ~ 0.6 'tJ ~ 0.4
0.2
-D-K-60 -6-K-110 -B-K-166
O+-------~--------~------~--------~-------
10 20 30 40 50 60 Power Consumption (W)
Figure 6.2 Influence of power consumption of hydrogen yield for different ceramics
80
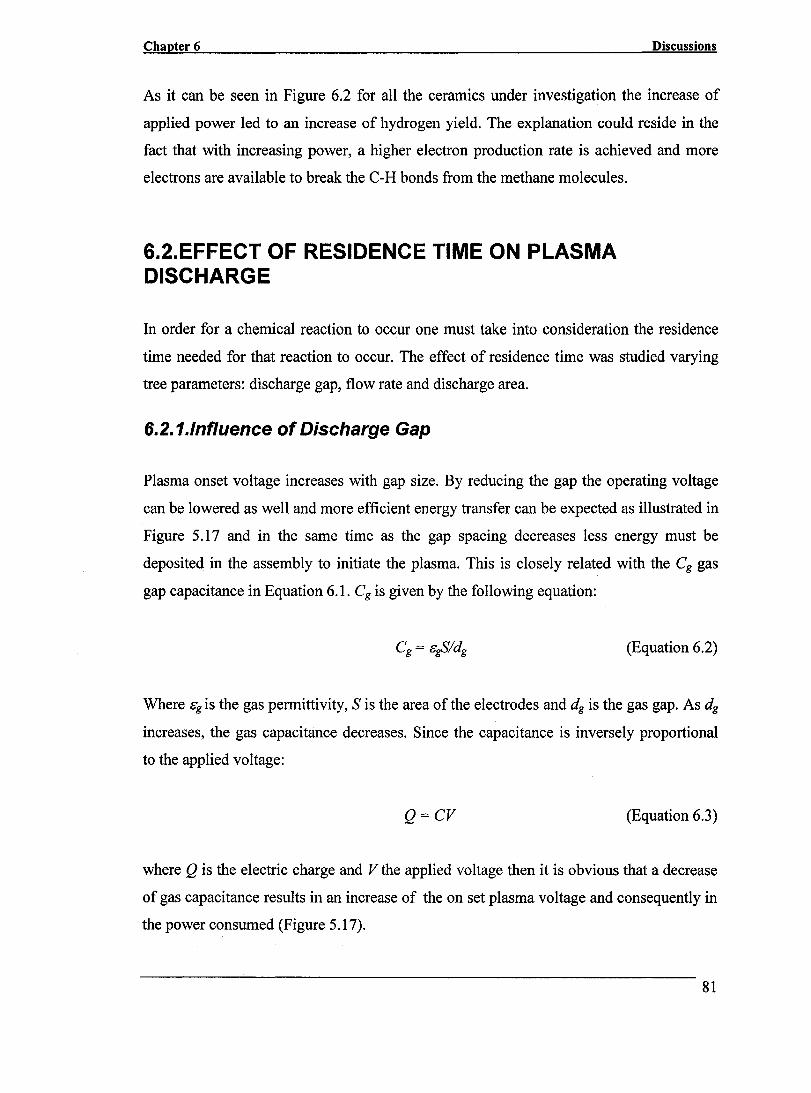
Chapter 6 Discussions
As it can be seen in Figure 6.2 for all the ceramics under investigation the increase of
applied power led to an increase of hydrogen yield. The explanation could reside in the
fact that with increasing power, a higher electron production rate is achieved and more
electrons are available to break the C-H bonds from the methane molecules.
6.2.EFFECT OF RESIDENCE TIME ON PLASMA DISCHARGE
In order for a chemical reaction to occur one must take into consideration the residence
time needed for that reaction to occur. The effect of residence time was studied varying
tree parameters: discharge gap, flow rate and discharge area.
6.2.1.1nfluence of Discharge Gap
Plasma onset voltage increases with gap size. By reducing the gap the operating voltage
can be lowered as well and more efficient energy transfer can be expected as illustrated in
Figure 5.17 and in the same time as the gap spacing decreases less energy must be
deposited in the assembly to initiate the plasma. This is closely related with the Cg gas
gap capacitance in Equation 6.1. Cg is given by the following equation:
(Equation 6.2)
Where &gis the gas permittivity, Sis the area of the electrodes and dg is the gas gap. As dg
increases, the gas capacitance decreases. Since the capacitance is inversely proportional
to the applied voltage:
Q=CV (Equation 6.3)
where Q is the electric charge and V the applied voltage then it is obvious that a decrease
of gas capacitance results in an increase of the on set plasma voltage and consequently in
the power consumed (Figure 5.17).
81

Chapter6 Discussions
The DBD reactor's discharge characteristics varied with the gap distance. As shown in
Figure 5.4 for a smaller gap, the plasma intensity is higher than for a larger gap. As
mentioned at the beginning of the present chapter the number of microdischardes directly
influences the conversion rates and therefore in the case of smaller discharge gap the
hydrogen yield should be expected to be higher.
The experimental conditions for Figure 5.4 are presented in Table 5.8. AlI the variables
were kept constant except the discharge gap was varied from 0.25 mm to 0.63 mm while
the flow rate was kept constant at 10ml/s. By increasing the gas gap from 0.25 mm to
0.63 mm the residence time was also increased from 0.072s to 0.181s. As it can be seen in
Figure 5.4 the number of microdischarges is higher for a smaller gap than for a larger gap.
Usually an increase in residence time leads to higher conversion rates and in this case the
number of microdischarges should be expected to be higher for the 0.63 mm gap (longer
residence time-0.181s) than for the 0.25 mm gap (shorter residence time-0.072s). As
previously mentioned, all the other operating conditions were kept constant including
voltage, and frequency and therefore the input power.
As shown above (Figure 5.17) the larger gap reactor consumes more power, and then
more energy must be applied to the gas stream for the 0.63 mm reactor to ignite plasma,
whereas in the case of 0.25 mm reactor at the same applied voltage and frequency as
theO.63 mm reactor the electric field the gap is higher and therefore more "hot" electrons
are present and therefore a higher number of microdischarges fill in the gap.
Choosing a small gap allows one to work with moderate voltages, which are easier to
handle and result in a quite uniform discharge. On the other hand the assembly with
narrower slots results in a greater flow resÎstance.
The actual total 0.63 mm gap we have chosen for our device seems to be a reasonable
compromise. Moreover the plasma generation versus gap was studied for different types
of electrode surface state as illustrated in Figure 6.3.
82
Chapter6 Discussions
7000 ............... -..... ---.--... -..... ----.. -----.. -.-................... -- ...................... -... --................................................................... ----.--....................... -----.. --... -... -.. ---.
6500 -> -; 6000 C)
,fi ~ 5500
li :g 5000 0
4500 ... Smooth
o Coarse 4000
0 0.5 1 1.5 2 2.5 Gap distance (mm)
Figure 6.3 Influence of gap distance on plasma generation for K-9 ceramic for Smooth (SQR) and Coarse (SQR-l) electrodes
The plasma onset voltage increases as the gap distance increases. The coarse surface
electrode stimulates the plasma at slightly lower voltages than the smooth surface
electrode. The explanation could reside in the fact that the coarse electrode presents on its
surface tiny pointed pyramids.
The concept is the same as a lightning rod and it is based on the principle that the electric
field strength is concentrated around a pointed object. The intense electric fields
surrounding a pointed object serve to ionize the surrounding gas, thus enhancing its
conductive ability. There is a conductive pathway established between the dielectric and
the cathode that bridges the gap, which is the initialization of the microdischarge,
therefore the microdischarges appear earlier or at lower voltage values than when using
an electrode with smooth surface.
Basically, when the structure of the electrode is changed, the electric field distribution is
changed at the same time. This changes the plasma intensity and the properties of the
discharges. The increase in the difference of the plasma onset voltage increased as the gap
distance increased.
83
Chapter 6 Discussions
6.2.2.1nfluence of Gas Flow
If the flow rate is varied from lOml /s to 20mlls for K-9 ceramic, for SQR-1 electrodes,
the residence time decreases from 181 ms to 90 ms The hydrogen yield (under the same
experimental conditions) is substantially decreased from 0.58% to 0%, respectively, with
decreasing residence time. As the residence time decreases, the time of contact between
the reactive species and the methane molecules decreases and therefore the hydrogen
yie1d follows the same trend.
6.2.3.1nfluence of Discharge Area
The dependence between hydrogen concentration and the area of the discharge is shown
in Figure 5.8. The increase in area of the discharge results in an increase of the
capacitance of the assembly (Equation 6.2), since S increases, which in tum leads to the
increase in the number of microdischarges and this results in an increase of the hydrogen
concentration. Consequently, an increase in the discharge area is also obviously related to
the increase in the residence time, which rises from 8.ms to 181ms for RND2 to SQR1
electrodes, respectively. Longer residence time leads to longer times that methane
molecules exist in in the plasma zone and therefore, longer dissociation time leads to
higher hydrogen concentration.
6.3.EFFECT OF CERAMIC PROPERTIES ON PLASMA DISCHARGE
As it was shown in the previous sections the actual quality of charge transferred through
the discharge gap depends on the electrical parameters (such as applied voltage and
frequency) as well as on the design parameters of the discharge arrangement e.g. the
width of the discharge gap, electrode are a, and the specific capacitance of the dielectric
material (i.e. thickness and dielectric constant).
84
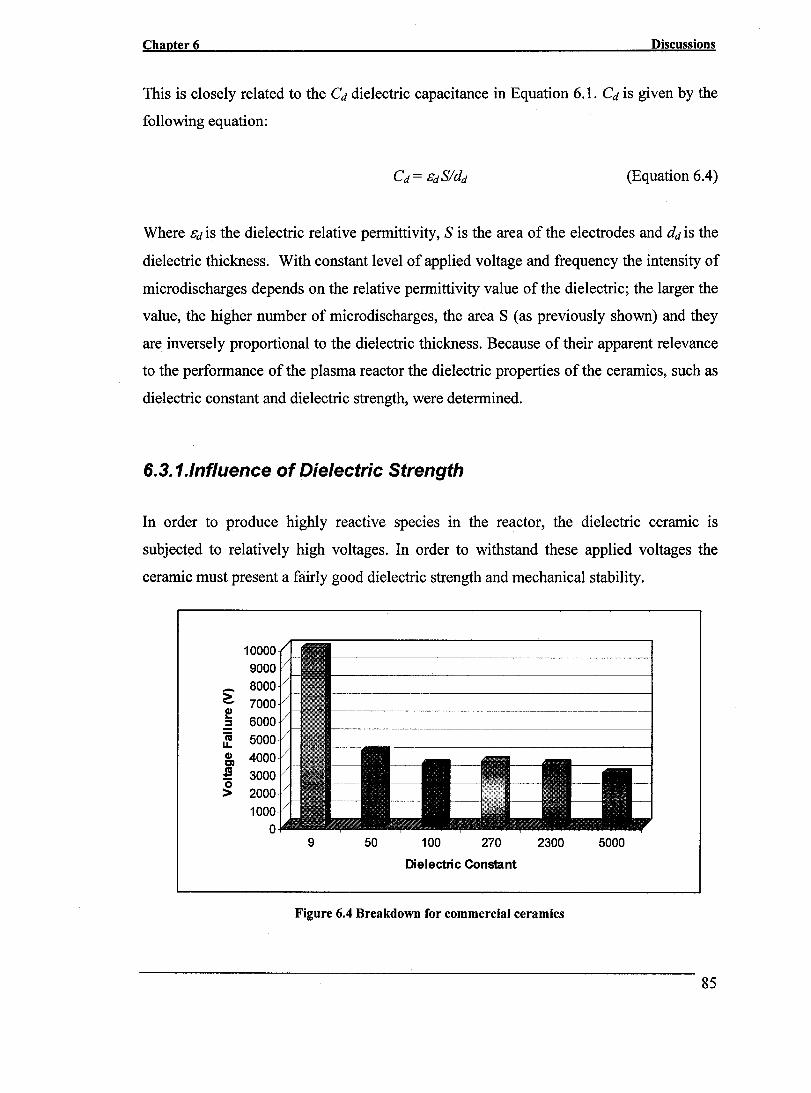
Chapter6 Discussions
This is closely related to the Cd dielectric capacitance in Equation 6.1. Cd is given by the
following equation:
(Equation 6.4)
Where Cd is the dielectric relative permittivity, Sis the area of the electrodes and dd is the
dielectric thickness. With constant level of applied voltage and frequency the intensity of
microdischarges depends on the relative permittivity value of the dielectric; the larger the
value, the higher number of microdischarges, the area S (as previously shown) and they
are inversely proportional to the dielectric thickness. Because of their apparent relevance
to the performance of the plasma reactor the dielectric properties of the ceramics, such as
dielectric constant and dielectric strength, were determined.
6.3.1.1nfluence of Die/ectric Strength
In order to produce highly reactive species in the reactor, the dielectric ceramlC IS
subjected to relatively high voltages. In order to withstand these applied voltages the
ceramic must present a fairly good dielectric strength and mechanical stability.
10000 9000
~ 8000 7000
! .2 6000 'jij 5000 u. CI) 4000 tI)
J9 3000 '0 > 2000
1000 0
9 50 100 270 2300 5000
Dielectric Constant
Figure 6.4 Breakdown for commercial ceramics
85

Chapter6 Discussions
As presented in Tables 5.4 and 5.5 with an increase in ceramic dielectric strength, the
ceramic reliability increased. As shown in Figure 6.4, the commercial dielectric ceramics
were found to have insufficient dielectric strength, breaking down below 4 kV. The only
exception was the K-9 alumina ceramic.
For the phase II fabricated ceramics, the discs presented were powered to a level above
~4 kV without fracture events occurring, which increased their reliability in the plasma
reactor. The thickness of the discs varied between 3-4 mm.
60 60* 110 166
Dielectric Constant
Figure 6.5 Breakdown for phase II dielectric ceramics
Therefore, the in house fabricated ceramics, from Phase II of the research, which, present
medium dielectric constants, could find their application in DBD reactors. They could be
operated continuously, without failure, for long testing hours. They could successfully
substitute low permittivity ceramics, such as alumina, benefiting from higher dielectric
constants. Tested under the same experimental conditions, commercial ceramics, tend to
fracture when operating in plasma reactor.
86
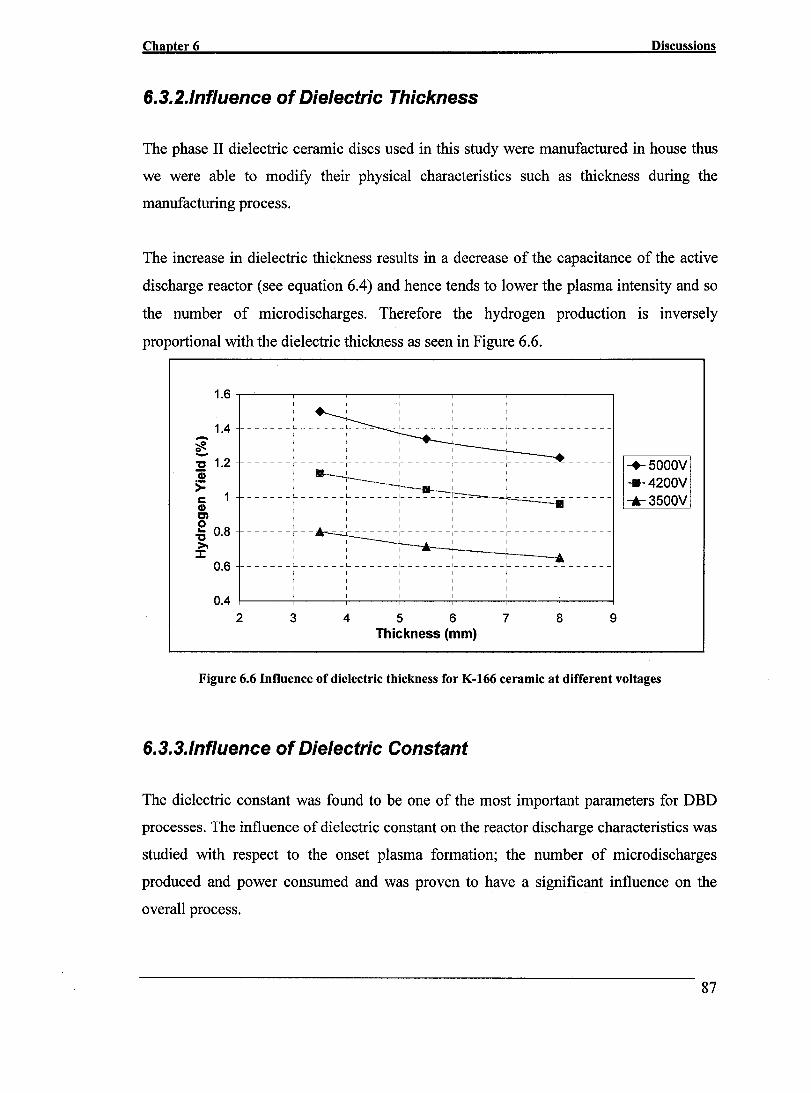
Chapter6 Discussions
6.3.2.1nfluence of Dielectric Thickness
The phase II dielectric ceramic discs used in this study were manufactured in house thus
we were able to modify their physical characteristics such as thickness during the
manufacturing process.
The increase in dielectric thickness results in a decrease of the capacitance of the active
discharge reactor (see equation 6.4) and hence tends to lower the plasma intensity and so
the number of microdischarges. Therefore the hydrogen production is inversely
proportional with the dielectric thickness as seen in Figure 6.6.
-'#. -'g G) ): c CI) Il)
1.6 -,-----,-----,-----,----.,----.,----.,------,
1.4 ______ L ______ L___ _L ______ L ______ L ______ L _____ _ 1 1 1 1 1 1 1 1 1
1.2 1 1 1 1
------r------r------r------r------r------r------
: ~----~-----: : : : ------~ ------:- ---~~~-=~-~~~--_:- -----_:- ------,----.
1 1 1 1 1 1 1 1
1 1 1 1 1 1 - - - - - - j- - -~ - 1- - - - - - - 1- - - - - - - 1- - - - - - - 1- - - - - - -
1 1 __ ~I 1
e 'g 0.8
: : : 1 -; • _______ L ____ L ______ L ______ L ______ L ______ L _____ _
1 1
>-::t
0.6
0.4 -t----,-----i----i----j-----j-----j------l
2 3 4 5 6 7 8 9 Thickness (mm)
-+-5000V ··.··4200V * 3500V
Figure 6.6 Influence of dielectric thickness for K-166 ceramic at different voltages
6.3.3.1nfluence of Dielectric Constant
The dielectric constant was found to be one of the most important parameters for DBD
processes. The influence of dielectric constant on the reactor discharge characteristics was
studied with respect to the onset plasma formation; the number of microdischarges
produced and power consumed and was proven to have a significant influence on the
overall process.
87
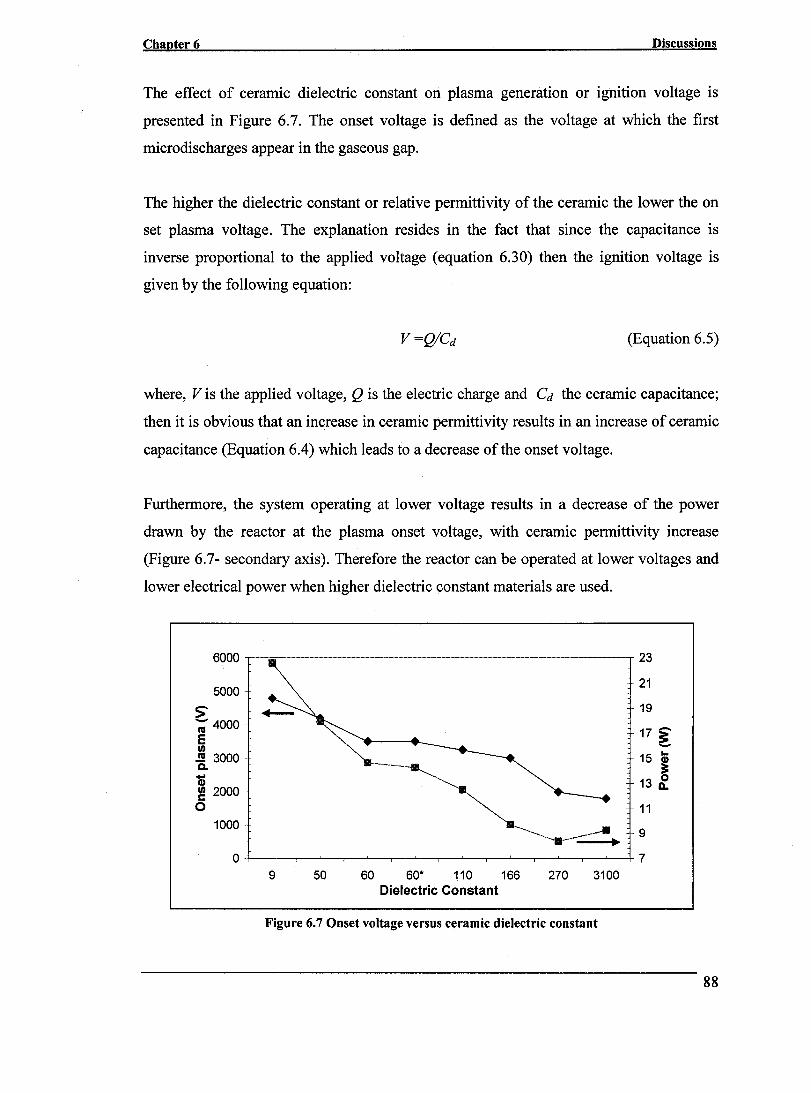
Chapter6 Discussions
The effect of ceramic dielectric constant on plasma generation or ignition voltage is
presented in Figure 6.7. The onset voltage is defined as the voltage at which the first
microdischarges appear in the gaseous gap.
The higher the dielectric constant or relative permittivity of the ceramic the lower the on
set plasma voltage. The explanation resides in the fact that since the capacitance is
inverse proportional to the applied voltage (equation 6.30) then the ignition voltage is
given by the following equation:
(Equation 6.5)
where, V is the applied voltage, Q is the electric charge and Cd the ceramic capacitance;
then it is obvious that an increase in ceramic permittivity results in an increase of ceramic
capacitance (Equation 6.4) which leads to a decrease of the ons et voltage.
Furthermore, the system operating at lower voltage results in a decrease of the power
drawn by the reactor at the plasma onset voltage, with ceramic permittivity increase
(Figure 6.7- secondary axis). Therefore the reactor can be operated at lower voltages and
lower electrical power when higher dielectric constant materials are used.
6000 ___ , ________ , ___________ , _____ ' __ m _________ m __________ ----r 23
5000
:> -; 4000 E II)
.!l! 3000 CL
-ai ~ 2000 0
1000
0
----~
21
19
17 ~
15 ;
13 ~
11
''1111.------- ~ 9 +-~--r_~~--~-r~--~~--r_~~--~_r--~~7
9 50 60 60· 110 166 270 3100 Dielectric Constant
Figure 6.7 Onset voltage versus ceramic dielectric constant
88

Chapter6 Discussions
Figure 6.8 shows the influence of dielectric constant on the plasma intensity, namely the
number of microdischarges. With ceramic permittivity increase results in an increase in
the average number of microdischarges.
This could be explained by the fact that the ceramic in DBD acts more like a capacitor
and since the permittivity of the dielectric increases, the capacitance increases as weIl
(Equation 6.4).
At the same time the potential energy stored in the capacitor increases (Equation 6.6).
(Equation 6.6)
where U is the electric potential Cd is the ceramic capacitance and V the applied voltage,
and then when the voltage changes po 1 arity, the capacitor discharges with a stronger
intensity and this facilitates the formation of new microdischarges in the same spot before
the previous microdischarge is fully dissipated which leads to an increase number of
microdischarges.
300,000 .. --------------.-... -... -..... -.--.-........ -.-------.--.. --.----.. --.. ----.-.. -.---
U)
280,000
260,000
& 240,000 lca i3 220,000 U)
=s 200,000 e i 180,000
160,000
140,000
120,000 +------.,.---------,.-----.,.--------1 K-9 K-60 K-110 K-166
Figure 6.8 Influence of ceramic permittivity on the number of microdischarges
89
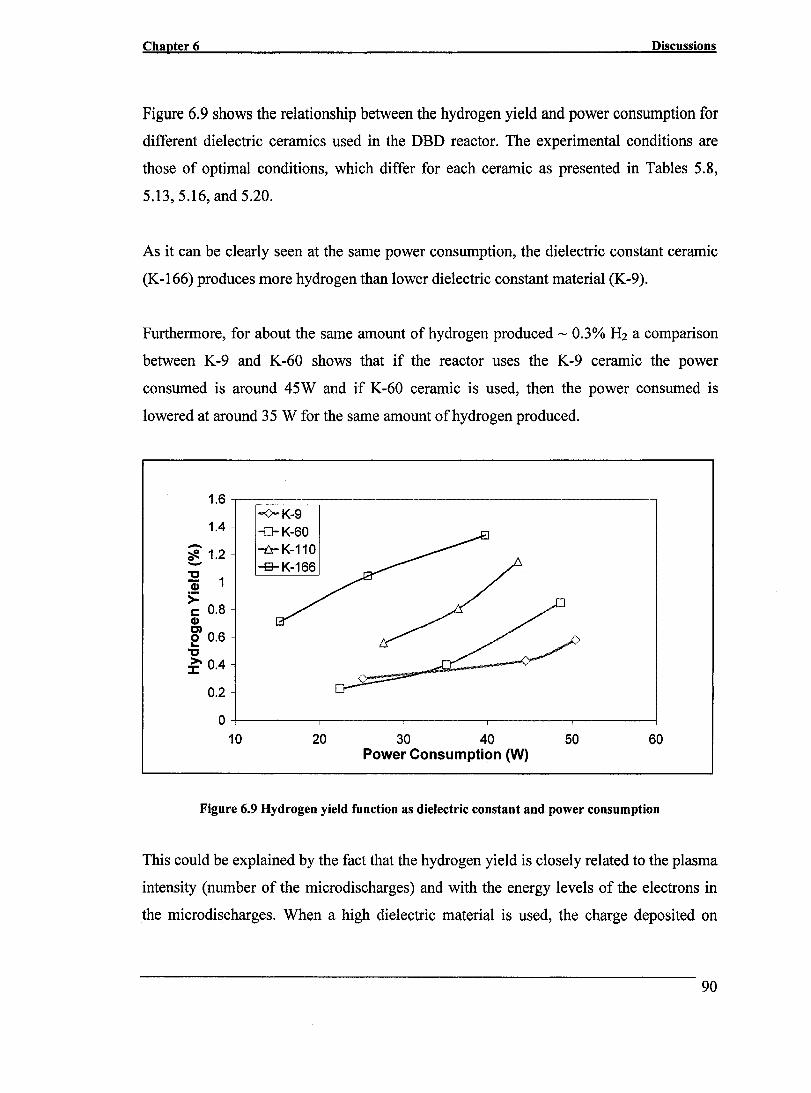
Chapter6 Discussions
Figure 6.9 shows the relationship between the hydrogen yield and power consumption for
different dielectric ceramics used in the DBD reactor. The experimental conditions are
those of optimal conditions, which differ for each ceramic as presented in Tables 5.8,
5.13,5.16, and 5.20.
As it can be clearly seen at the same power consumption, the dielectric constant ceramic
(K-166) produces more hydrogen than lower dielectric constant material (K-9).
Furthermore, for about the same amount of hydrogen produced ~ 0.3% H2 a comparison
between K-9 and K-60 shows that if the reactor uses the K-9 ceramic the power
consumed is around 45W and if K-60 ceramic is used, then the power consumed is
lowered at around 35 W for the same amount of hydrogen produced.
1.6 1-;=::::::::::::::::=,-----------------------,
1.4
~ 1.2 -32 1 CI)
>= c 0.8 CI) C) e 0.6
" ~ 0.4
0.2 o
O+-------~--------~--------~--------~------~
10 20 30 40 50 60 Power Consumption (W)
Figure 6.9 Hydrogen yield function as dielectric constant and power consumption
This could be explained by the fact that the hydrogen yield is closely related to the plasma
intensity (number of the microdischarges) and with the energy levels of the electrons in
the microdischarges. When a high dielectric material is used, the charge deposited on
90

Chapter6 Discussions
dielectric surfaces is higher and this leads to a higher electric field in the discharge gap
and therefore to the generation ofnew microdischarges ofhigher levels of energy.
Under these conditions the methane molecules are bombarded by higher numbers of "hot"
electrons, and therefore the C-H chemical bonds are broken faster, which leads to higher
conversion rates.
The changes in dielectric constant of the ceramic affect the parameters of the discharge in
the reactor. The changes of the properties of the ceramics, mainly the change in dielectric
constant, result in a variation of the discharge characteristics. At the same operating
voltage, the discharge and the intensity of plasma are weaker when a lower dielectric
constant ceramic is used than as in the case of a higher K' ceramic. The discharge
operates at lower voltage and consequently at lower electrical power when ceramics with
higher dielectric constants are used. Such changes of the discharge characteristics
influence the amount ofhydrogen produced in the reactor.
To investigate the influence of barrier capacity on the reactor discharge we take the same
electric field (the same applied voltage and the same applied frequency) for the gap and
vary the dielectric constant. The results are shown in Figure 6.10. It was found that the
hydrogen yield increased from 0.3% to 1.35% with the increase in dielectric constant of
the ceramic from 9 to 166. This could be explained by the fact that the particle production
(electrons and ions) is proportional to the barrier capacity, which is increased by dielectric
constant of the ceramic.
Therefore, an increase in the specific capacitance of the dielectric leads to a proportional
increase in the transferred charge.
91

Chapter 6 Discussions
1.6 .".""""""-"""""""'-"""""-"""""""'"""-,-"""'"""""--"""'""" """""""""'"""-"--"""","""",-"-'"--
1.4 -------------------------------------------------
~1.2 :5! 1 \1)
>= c 0.8 \1) DI eO.6 oc ~0.4 ---------------- ------------------------------
0.2 "" "" "" "" "" - "" "" "" "" - - - - - - - - - - - "" - - - - - - - - - - - - - - - - - - - - - - - - - - ""
o+---------~--------~--~------~--------~
K-9 K-60 K-110 K-166 Ceramic
Figure 6.10 Influence of relative permittivity on hydrogen yield at 5000 V, 3500Hz, 0.63 mm gap
This is aU related to the electric field strength applied to the reactor. According to
Coulomb's law the electric field strength is proportional to the amount of charge Q
applied.
E=kQ// (Equation 6.7)
where E is the electric field, Q is the charge, k is the is the electrostatic constant or
Coulomb force constant, and r is the distance.
Furthermore, according to equation 6.3 the charge is proportional with the capacitance
and the applied voltage. Consequently, higher permittivity ceramics resulted in higher
capacitance and this leads to higher stored charge, and finaUy higher electric field.
Therefore there are two parameters that influence the electric field strength (in this case),
the capacitance (ceramic permittivity) and applied voltage (Figure 6.11).
92
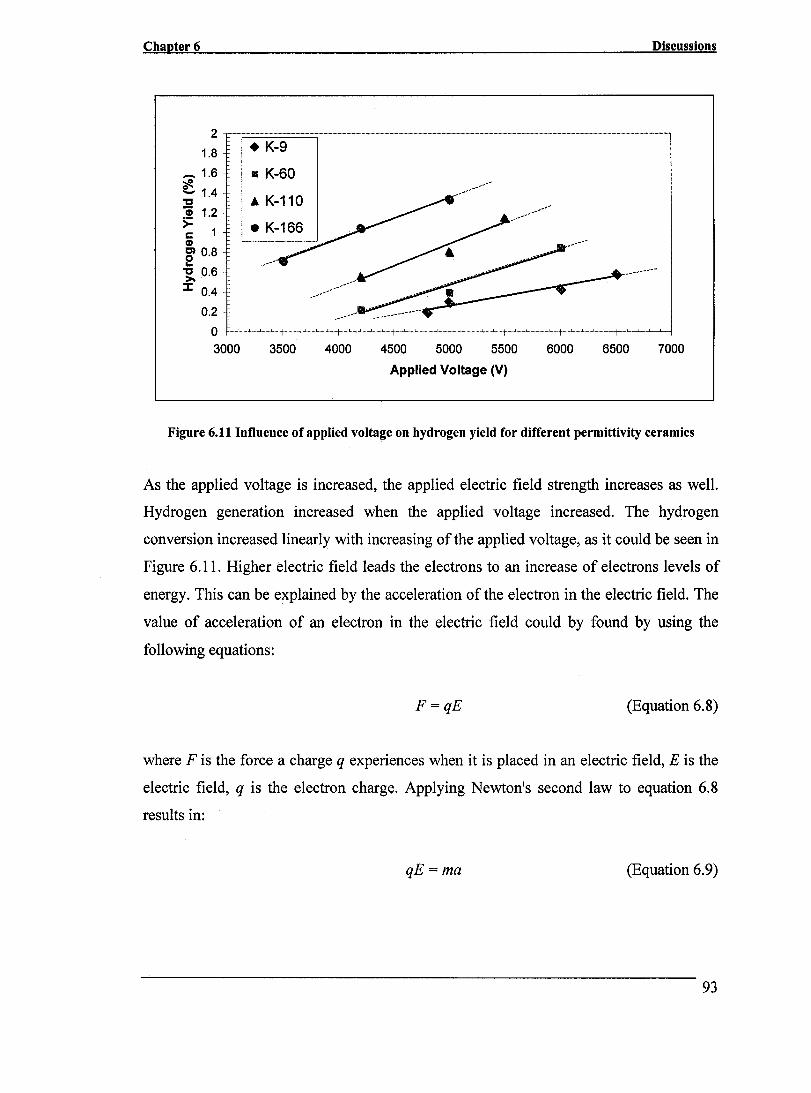
Chapter 6
2 _ ........................... --_._--
1.8
_ 1.6 ~ e.... 1.4
" 1 1.2
~ 1 CI)
g» 0.8 .. -g, 0.6 J: 0.4
0.2
• K-9
III K-60
 K-110
• K-166
Discussions
........................
.............
O~~~~~~-r~~-r~~~~~~~~~~~~~~~
3000 3500 4000 4500 5000 5500 6000 6500 7000
Applied Voltage (V)
Figure 6.11 Influence of applied voltage on hydrogen yield for different permittivity ceramics
As the applied voltage is increased, the applied electric field strength increases as weIl.
Hydrogen generation increased when the applied voltage increased. The hydrogen
conversion increased linearly with increasing of the applied voltage, as it could he seen in
Figure 6.11. Higher electric field leads the electrons to an increase of electrons levels of
energy. This can he explained hy the acceleration of the electron in the electric field. The
value of acceleration of an electron in the electric field could hy found hy using the
following equations:
F=qE (Equation 6.8)
where F is the force a charge q experiences when it is placed in an electric field, E is the
electric field, q is the electron charge. Applying Newton's second law to equation 6.8
results in:
qE=ma (Equation 6.9)
93
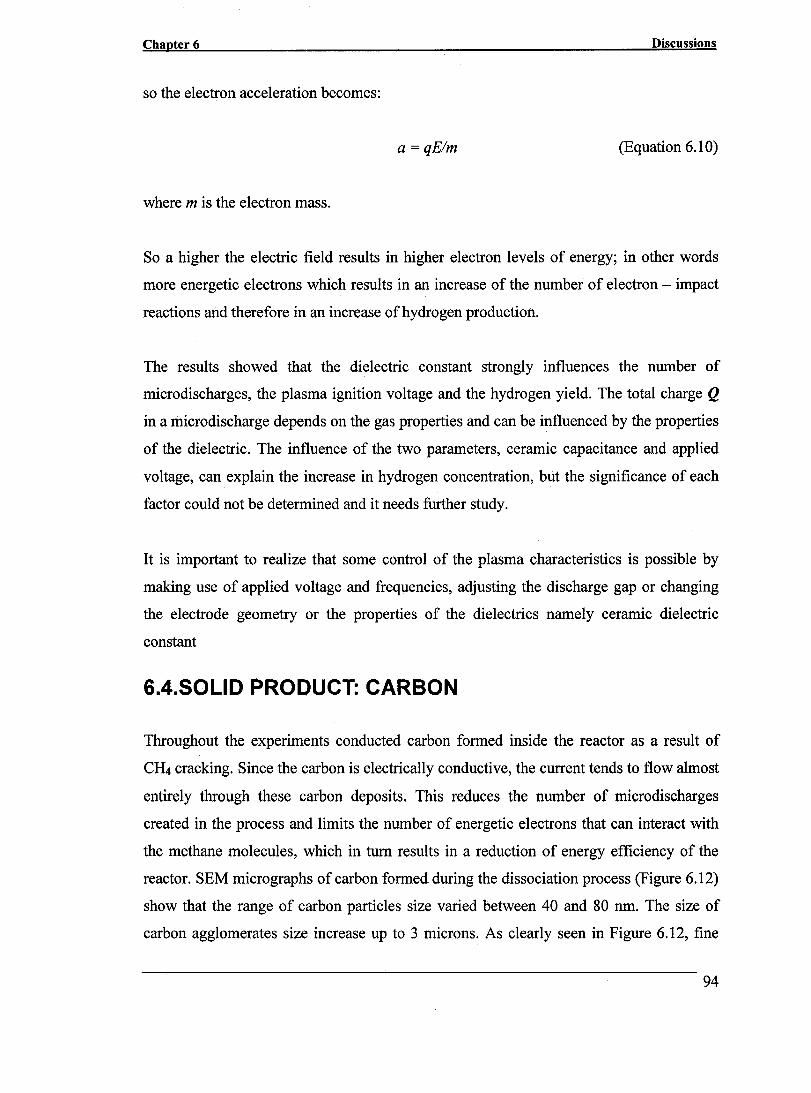
Chapter 6 Discussions
so the electron acceleration becomes:
a = qE/m (Equation 6.1 0)
where m is the electron mass.
So a higher the electric field results in higher electron levels of energy; in other words
more energetic electrons which results in an increase of the number of electron - impact
reactions and therefore in an increase of hydrogen production.
The results showed that the dielectric constant strongly influences the number of
microdischarges, the plasma ignition voltage and the hydrogen yield. The total charge Q
in a microdischarge depends on the gas properties and can be influenced by the properties
of the dielectric. The influence of the two parameters, ceramic capacitance and applied
voltage, can explain the increase in hydrogen concentration, but the significance of each
factor could not be determined and it needs further study.
It is important to realize that sorne control of the plasma characteristics is possible by
making use of applied voltage and frequencies, adjusting the discharge gap or changing
the electrode geometry or the properties of the dielectrics namely ceramic dielectric
constant
6.4.S0LID PRODUCT: CARBON
Throughout the experiments conducted carbon formed inside the reactor as a result of
CH4 cracking. Since the carbon is electrically conductive, the current tends to flow almost
entirely through these carbon deposits. This reduces the number of microdischarges
created in the process and limits the number of energetic electrons that can interact with
the methane molecules, which in turn results in a reduction of energy efficiency of the
reactor. SEM micrographs of carbon formed during the dissociation process (Figure 6.12)
show that the range of carbon particles size varied between 40 and 80 nm. The size of
carbon agglomerates size increase up to 3 microns. As clearly seen in Figure 6.12, fine
94
Chapter6 Discussions
spherically shaped particles, are fused together to form a chain or cluster of carbon
particles. Solid carbon particles were deposited on both the metallic electrodes as well as
on the ceramic plates after several hours of operation.
Figure 6.12 Carbon particles characteristics as observed from SEM
The carbon deposits tend to grow on the dielectric barrier. Being electrically conductive,
the current flows through them, which reduces the charge that can be deposited on the
dielectric surface and consequently, the capacitance of the assembly. As the solid
deposits increased, they seemed to cause a small decrease in the number of
microdischarges as illustrated in Figures 5.7, 5.9 and 5.22.
Furthermore, the gas and ceramic temperature increase in the reactor with operating time
as shown in Figure 5.6. The dielectric constants of the ceramics used decrease with
temperature increase as presented in Figure 6.13, which furthermore contributes to the
decrease of the capacitance.
These two factors contribute to the reduction in the number of microdischarges and the
number of "hot" electrons that can interact with the feed gas in the reaction zone, thus
lowering the conversion rates. It should also be specified that both, the carbon deposit on
dielectric, and the gas and ceramic temperature, stabilize after a period of time that varies
depending upon the experimental condition used. Therefore the ideal ceramic used for
DBD reactors should present an increase in dielectric constant value with increase in the
reaction time and temperature in order to generate optimal number of microdischarges.
95

Chapter 7 Conclusions and Future Work
CHAPTER 7
CONCLUSIONS AND FUTURE WORK
7.1 CONCLUSIONS
• The testing of commercial ceramics in the dielectric barrier discharge (DBD)
reactor resulted in repeated failure of the ceramic. Very little data was collected.
The only reliable commercial ceramic was alumina (K'=9)
• Medium dielectric constant ceramics (60< K'<166) were successfully fabricated.
Their selection was made based on their composition and dielectric strength. They
proved to be reliable and they allowed the examination of important parameters on
the discharge characteristics of the reactor.
• The number of microdischarges increased with applied frequency for aIl ceramics
tested reaching a maximum differing for each material. Further increase above this
level resulted in plasma extinction. Hydrogen yield increased with frequency.
• An increase in the applied voltage resulted in an increase in hydrogen yield.
However, there is an optimum operating voltage, which is different for each
ceramic used.
• As discharge gap increases, at the same applied power, a decrease of hydrogen
yield occurred. The onset plasma voltage was higher for larger discharge gaps.
96
Chapter7 Conclusions and Future Work
• The electrode surface state influences the onset plasma voltage. For coarse surface
onset plasma is lower that for a smooth surface.
• When the reactor gas flow rate is increased from 10mlls to 20ml/s the hydrogen
yield decreases from 0.58% to zero.
• An increase in the discharge area resulted in an increase in hydrogen output.
• The increase of dielectric thickness resulted in a decrease in hydrogen production.
• The higher dielectric constant of the ceramic, the lower the onset plasma voltage
and consequently lower electrical power at ignition.
• Dielectric constant of the ceramic influences the number of microdischarges,
which increases with K' increase.
• Hydrogen yield increases with dielectric constant of the ceramic from 0.3% for
K'=9 to 1.4% for K'=166.
• The decrease in the number of microdischarges with time is the combined effect
of ceramic permittivity decrease with the reactor temperature increase and the
carbon deposits on the ceramic.
• The carbon particles formed during the dissociation process varied between 40-80
nm.
7.2 RECOMMENDATIONS FOR FUTURE WORK
To effectively and efficiently operate nonthermal plasma reactors for environmental
applications, more experimentation with larger ceramic plates is necessary in order to
complete1y examine and understand the effect of applied voltage.
Furthermore, aIl the compounds resulted from the dissociation process should be
identified as a function of the input parameters such as voltage, frequency, residence time
and ceramic permittivity. The overall process should be optimized. An energy balance of
the reactor should be calculated. The solid product resulted from the reaction should be
analyzed as function of the input parameters and it should be fully characterized.
It should also be taken into the account that even if in this present study the conversion
rates were rather small due to the po or reactor geometry, very high conversion rates could
97
Chapter 7 Conclusions and Future Work
be achieved with better-designed discharge chambers. In the present study a great
importance was given to the ceramic influence and behavior in DBD reactors without
disregarding any other important parameters. However, due to elevated demands for high
hydrogen purity in sorne applications one should take in the consideration the use of
methane - hydrogen membrane separation and redirecting the undissociated methane
back into dissociation chamber, in order to increase the market value of the hydrogen
produced.
In the same time, the resuIts obtained in the dielectric barrier discharge reactor indicated
that, the ceramic material is a key factor in dissociation reaction efficiency. A high
permittivity ceramic is highly desirable. Even though we fabricated reliable medium K'
ceramics, an increase in ceramic dielectric constant value could furthermore improve the
conversion rates.
Therefore, future work should be mainly focused in exploring high K' ceramic materials
(K> 166), that are able to maintain their broad permittivity over a wide temperature range
and to present good dielectric strength values.
98

References
REFERENCES
1. L.Fulcheri, Y.Schwob "From methane to hydrogen, carbon black and water", Int J Hydrogen Energy, (1995) 20, 197-202.
2. L. Bromberg, D. R. Cohn, A. Rabinovich, C. O'Brien, S. Hochgreb "Plasma Reforming of Methane" Energy and Fuels (1998) 1211-18
3. D. W. Larkin, L.L. Lobban, R. G. Mallinson "Production of Organic Oxygenates in the Partial Oxidation of Methane in a Silent Electric Discharge Reactor" Ind. Eng. Chem. Res. (2001) 40, 1594-1601
4. Y.P. Zhang, y. Li, Y. Wang, C. -1. Liu, B. Eliasson" Plasma methane conversion in the presence of carbon dioxide using dielectric-barrier discharges" Fuel Processing Technology (2003) 83 101-109
5. B. Eliasson,U. Kogelschatz, "Nonequilibrium volume plasma chemical processing." IEEE Trans. Plasma Sei. (1991), 19, 1063 -1077
6. U. Kogelschatz, B. Eliasson, W. Egli "Dielectric Barrier Discharge. Prineiple and Applications" J. Phys IV France (1997) 7 C4-47-C4-66
7. U. Kogelschatz, B. Eliasson, W. Egli "From ozone generators to fiat television screens: history and future potential of dielectric-barrier discharges" Pure Appl. Chem. (1999) Vol. 71 No.10 1819-1828
8. U. Bossel, B. Eliasson, "Energy and the Hydrogen Economy" Database on the web. http: www.eere.energy.gov (Web Version)
9. A. V. Walker, D. A. King, "Production of Synthesis Gas by Direct Catalytic Oxidation of Methane on Pt {Il O} (1 x 2) Using Supersonic Molecular Beams." J. Phys. Chem. B (2000), 104 6462
10. C.C. Elam, C. Gregoire Padro, G. Sandrock, A. Luzzi, P Lindblad, E. Fjermestad Hagen, "Realizing the hydrogen future: the International Energy Agency's efforts to advance hydrogen energy technologies." Hydrogen Planet, World Hydrogen Energy Conference, 14th, Montreal, QC, Canada, June 9-13, 2002 (2003), Meeting Date 2002,627-638
Il. L. Basyse, S. Swaminathan " Hydrogen Production Costs-A Survey" DOE/CO/10170-T18; Scentech, Inc.: Bethesda, MD, 1997
99
References
12. L. M.Zhou, B. Xue, U. Kogelschatz, B. Eliasson "Partial Oxidation of Methane to Methanol with Oxygen or Air in a Nonequilibrium Discharge Plasma" Plasma Chemistry and Plasma Processing, (1998), 18,375-393
13. M. Sobacchi, A. Savaliev, A. Fridman, L. Kennedy, S. Ahmed, T. Krause, "Experimental assessment of a combined plasma/catalytic system for hydrogen production via partial oxidation of hydrocarbon fuels", Int. J Hydrogen Energy, 27(6) (2002), 635-642
14. H. Sekiguchi, "Catalysis Assisted Plasma Decomposition of Benzene Using Dielectric Barrier Discharge" Canadian Journal of Chemical Engineering, (2001), 79(4), 512-516.
15. L. Fu1cheri, N. Probst, G. Flamant, F. Fabry, E. Grivei, X. Bourrat, "Plasma Processing: a step towards the production of new grades of carbon black", Carbon 40(2002), 169-176
16. B. Eliasson, M. Hirth, U. Kogelschatz, "Ozone synthesis from oxygen in dielectric barrier discharges", J. Phys. D: Appl. Phys., 20 (1997) 1421
17. B. Eliasson, U. Kogelschatz, "Modeling and Applications of Silent Discharge Plasma" IEEE Transactions on Plasma Science 19(2), 1991,309-323
18. B. M. Penetrante, M.C. Hsiao, B. T. Merritt, G. E. Vogtlin,P. H. Wallman, "Comparaison of electrical discharge techniques for non-thermal plasma processing of NO in N2 " IEEE Transactions on Plasma Science 23(4), 1995,679-687
19. J. Li, W. Sun, B. Pashaie, S. K. Dhali, "Streamer discharge simulation in flue gas" IEEE Transactions on Plasma Science 23(4), 1995, 672- 678
20. S. Futamura, T. Yamamoto, "Byproduct identification and mechanism determination in plasma chemical decomposition of trichloroethylene" IEEE Trans Ind. Appl. 33 1997,447-453
21. S. Futamura, A. Zhang, T. Yamamoto, "Behaviour ofN2 and nitrogen oxides in nonthermal plasma chemical processing of hazardous air pollutants" IEEE Trans Ind. Appl. 362000, 1507-1514.
22. S. Futamura, H. Einaga, A. Zhang, "Comparison in reactor performance in the non thermal plasma chemical processing of hazardous air polluants" IEEE Trans Ind. Appl 37,2001,978-985
23. K. Buss Arch. Elektrotech. 26,1932, 261
100

References
24. P. L.Spedding "Chemical reactions in nondisruptive electric discharges" The Chemical Engineer 1969 No. 225 CE 17-CE50
25. lR. Fincke, R. P. Anderson, T.A. Hyde, B. A. Detering "Plasma Pyrolysis of Methane to Hydrogen and Carbon Balck" Ind. Eng. Chem. Res. (2002) 41 1425-1235
26. X. Xu "Dielectric Barrier Discharge - Properties and Applications" Thin Solid Films (2001) 390 237-242
27. M.V.Kozlov, M.V.Sokolova, A.G.Temnikov, V.V.Timatkov, l.P.Vereshchagin "Surface discharge characteristics for different types of applied voltage and different dielectric materials" Hakone VIn 8th International Symposium on High Pressure, Low Temperature Plasma Chemistry July 21- 25, 2002
28. W.S. Kang, Y-H Kim S. H. Hong, Y-H. Song "Numerical modeling on recurrence of microdischarges in dielectric barrier discharge" Eighth International Symposium on High Pressure, Low Temperature Plasma Chemistry, July 21- 25, 2002 Pühajarve, Estonia
29. Gibalov, V. 1.; Drimal, l; Wronski, M.; Samoilovich, V. G. "Barrier discharge. The transferred charge and ozone synthesis" Contributions to Plasma Physics (1991) 31(1), 89-99
30. V.l. Gibalov, T. Murata, G. Pietsch "Parameters of Barrier Discharges in Coplanar Arrangements" Hakone VIn 8th International Symposium on High Pressure, Low Temperature Plasma Chemistry July 21- 25, 2002 Pühajarve, Estonia
31. Cal, M.P., Schluep, M "Destruction of Benzene with Non-Thermal Plasma in Dielectric Barrier Discharge Reactors"Environmental Progress (2001) 20 (3) 151-156
32. V. 1. Gibalov, G. J. Pietsch "The development of dielctric barrier discharges in gas gaps and on surfaces" J. Phys. D; Appl. Phys. (2000) 332618-2636
33. G. Steinle, D. Neundorf, W. Hiller, M. Pietralla "Two-dimensional simulation of filaments in barrier dis charges" lPhys. GD: Appl. Phys. (1999) 32, 1350-1356
34. T. Kappes, W. Schiene, T. Hammer "Energy Balance of Dielectric Barrier Discharge Reactor for Hydrocarbon Steam Reforming" Hakone VIn 8th International Symposium on High Pressure, Low Temperature Plasma Chemistry July 21- 25, 2002 Pühajarve, Estonia
35. T. Nozaki, Y. Miyazaki, Y Unno, K. Okazaki "Energy distribution and heat transfer mechanism in atmospheric pressure non-equilibrium plasmas" lPhys. D: Appl. Phys. (2001) 34 3383-3390
101
References
36. T. Nozaki, Y. Unno, y. Miyazaki, K. Okazaki "Optical diagnostics for determining gas temperature of reactive microdischarges in a methane-fed dielectric barrier discharge" J. Phys. D: Appl. Phys (2001) 34 2504-2511
37. Moulson A.J., Herbert J.M. "Electroceramics" (1990) 52-58, 241-252
38. B. Jaffe, W.R. Cook, H. Jaffe, "Piezoelectric Ceramics" Academic Press, London, New York
39. Hench L.L., West J.K. "Principles of Electronic Ceramics" (1990) 250-259 A. Dekker, New York
40. J.M. Herbert "Ferroelectric Transducers and Sensors (Electrocomponent Science Monographs)" Gordon & Breach Publishing Group (1982)
41. Lines M.E., Glass A.M., "Princip les and Applications of Ferroelectric and Related Materials", Clarendon Press, (1977)
42. Newnham R.E., "Structure-Properties Relation in Ceramic Capacitors" J.Mat.Ed. 5, (1983) 974-982
43. ASTM C20-97 "Standard Test Methods for Apparent Porosity, Water Absorption, Apparent Specific Gravit y, and Bulk I:;>ensity of Burned Refractory Brick and Shapes by Boiling Water"
44. ASTM D 150-93 "Standard Test Methods for A-C Loss Characteristics and Permittivity (Dielectric Constant) of Solid Electrical Insulation
45. ASTM d 3755 - 86 "Standard Test Method for Dielectric Breakdown Voltage and Dielectric Strength of Solid Electrical Insulating Materials Under Direct -Voltage Stress
46. T. C. Manley "The electric characteristics of the ozonator discharge."
Transactions of the Electrochemical Society, (1943), 84 12
102