Legal Insights @ Google CRO Presentation: Ryan Webb, Search Star

Financial Results Month xx, 2015 117Q2
Investor PresentationFor the Quarter Ended April 30, 2017
May 24, 2017
May 24, 2017 2
Caution Regarding Forward-Looking Statements
Bank of Montreal’s public communications often include written or oral forward-looking statements. Statements of this type are included in this document, and may be included in other filings with Canadian securities regulators or the U.S. Securities and Exchange Commission, or in other communications. All such statements are made pursuant to the “safe harbor” provisions of, and are intended to be forward-looking statements under, the United States Private Securities Litigation Reform Act of 1995 and any applicable Canadian securities legislation. Forward-looking statements may involve, but are not limited to, comments with respect to our objectives and priorities for fiscal 2017 and beyond, our strategies or future actions, our targets, expectations for our financial condition or share price, and the results of or outlook for our operations or for the Canadian, U.S. and international economies.
By their nature, forward-looking statements require us to make assumptions and are subject to inherent risks and uncertainties. There is significant risk that predictions, forecasts, conclusions or projections will not prove to be accurate, that our assumptions may not be correct and that actual results may differ materially from such predictions, forecasts, conclusions or projections. We caution readers of this document not to place undue reliance on our forward-looking statements as a number of factors could cause actual future results, conditions, actions or events to differ materially from the targets, expectations, estimates or intentions expressed in the forward-looking statements.
The future outcomes that relate to forward-looking statements may be influenced by many factors, including but not limited to: general economic and market conditions in the countries in which we operate; weak, volatile or illiquid capital and/or credit markets; interest rate and currency value fluctuations; changes in monetary, fiscal, tax or economic policy; the level of competition in the geographic and business areas in which we operate; changes in laws or in supervisory expectations or requirements, including capital, interest rate and liquidity requirements and guidance and the effect of such changes on funding costs; judicial or regulatory proceedings; the accuracy and completeness of the information we obtain with respect to our customers and counterparties; our ability to execute our strategic plans and to complete and integrate acquisitions, including obtaining regulatory approvals; critical accounting estimates and the effect of changes to accounting standards, rules and interpretations on these estimates; operational and infrastructure risks; changes to our credit ratings; political conditions, including changes relating to or affecting economic or trade matters; global capital markets activities; the possible effects on our business of war or terrorist activities; outbreaks of disease or illness that affect local, national or international economies; natural disasters and disruptions to public infrastructure, such as transportation, communications, power or water supply; technological changes; information and cyber-security; and our ability to anticipate and effectively manage risks arising from all of the foregoing factors.
We caution that the foregoing list is not exhaustive of all possible factors. Other factors and risks could adversely affect our results. For more information, please see the Enterprise-Wide Risk Management section on pages 79 to 112 of BMO’s 2016 Annual Report, which outlines certain key factors and risks that may affect Bank of Montreal’s future results. Investors and others should carefully consider these factors and risks, as well as other uncertainties and potential events, and the inherent uncertainty of forward-looking statements. Bank of Montreal does not undertake to update any forward-looking statements, whether written or oral, that may be made from time to time by the organization or on its behalf, except as required by law. The forward-looking information contained in this document is presented for the purpose of assisting our shareholders in understanding our financial position as at and for the periods ended on the dates presented, as well as our strategic priorities and objectives, and may not be appropriate for other purposes.
Assumptions about the performance of the Canadian and U.S. economies, as well as overall market conditions, and their combined effect on our business, are material factors we consider when determining our strategic priorities, objectives and expectations for our business. In determining our expectations for economic growth and financial services, we primarily consider historical economic data provided by the Canadian and U.S. governments, historical relationships between economic and financial variables, and the risks to the domestic and global economy. See the Economic Review and Outlook section of our Second Quarter 2017 Report to Shareholders.
Non-GAAP Measures
Bank of Montreal uses both GAAP and non-GAAP measures to assess performance. Readers are cautioned that earnings and other measures adjusted to a basis other than GAAP do not have standardized meanings under GAAP and are unlikely to be comparable to similar measures used by other companies. Reconciliations of GAAP to non-GAAP measures as well as the rationale for their use can be found on page 4 of BMO’s Second Quarter 2017 Report to Shareholders and on page 33 of BMO’s 2016 Annual Report all of which are available on our website at www.bmo.com/investorrelations.
Examples of non-GAAP amounts or measures include: efficiency and leverage ratios; revenue and other measures presented on a taxable equivalent basis (teb); amounts presented net of applicabletaxes; results and measures that exclude the impact of Canadian/U.S. dollar exchange rate movements, adjusted net income, revenues, non-interest expenses, earnings per share, effective tax rate, ROE, efficiency ratio, pre-provision pre-tax earnings, and other adjusted measures which exclude the impact of certain items such as, acquisition integration costs, amortization of acquisition-related intangible assets, decrease (increase) in collective allowance for credit losses and restructuring costs.
Bank of Montreal provides supplemental information on combined business segments to facilitate comparisons to peers.
Forward looking statements & non-GAAP measures
Financial Results Month xx, 2015 3
Strategic HighlightsFor the Quarter Ended April 30, 2017
May 24, 2017
Bill DowneChief Executive Officer
17Q2

Strategic Highlights May 24, 2017 4
• Adjusted1 net income of $1.3B, up 12% ($1.25B reported, up 28%)
• Adjusted1 EPS of $1.92, up 11% (reported $1.84, up 27%)
• Year-to-date adjusted1 EPS up 21% (reported up 34%) with good underlying
positive operating leverage
• Strong capital position with CET1 ratio of 11.3%
• Adjusted1 ROE of 13.1% (reported 12.6%)
• Quarterly dividend increased 2 cents to $0.90 per common share, up 5%
from the prior year
Q2 2017 Financial HighlightsGood contribution from BMO Wealth Management and BMO Capital Markets
1 Adjusted measures are non-GAAP measures. See slide 2 for more information. See slide 25 for adjustments to reported results
Strategic Highlights May 24, 2017 5
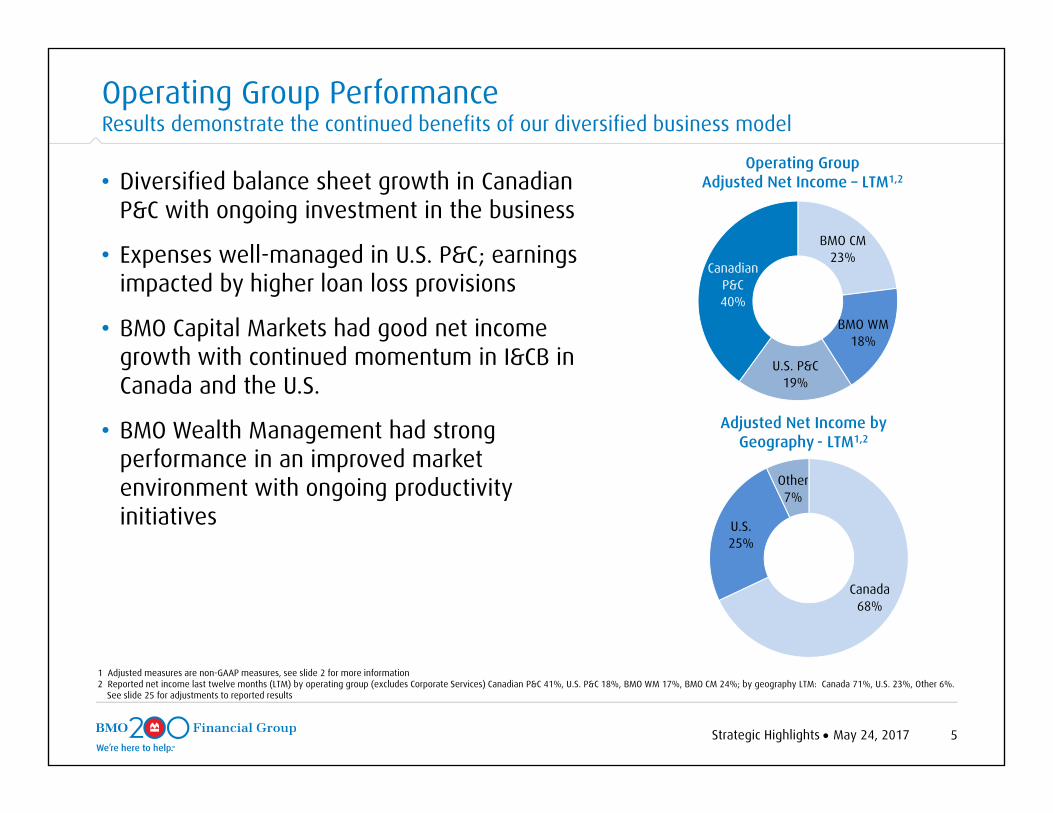
Operating GroupAdjusted Net Income – LTM1,2
BMO CM23%
BMO WM18%
U.S. P&C19%
Canadian P&C40%
• Diversified balance sheet growth in Canadian P&C with ongoing investment in the business
• Expenses well-managed in U.S. P&C; earnings impacted by higher loan loss provisions
• BMO Capital Markets had good net income growth with continued momentum in I&CB in Canada and the U.S.
• BMO Wealth Management had strong performance in an improved market environment with ongoing productivity initiatives
Operating Group Performance Results demonstrate the continued benefits of our diversified business model
1 Adjusted measures are non-GAAP measures, see slide 2 for more information 2 Reported net income last twelve months (LTM) by operating group (excludes Corporate Services) Canadian P&C 41%, U.S. P&C 18%, BMO WM 17%, BMO CM 24%; by geography LTM: Canada 71%, U.S. 23%, Other 6%.
See slide 25 for adjustments to reported results
Adjusted Net Income by Geography - LTM1,2
Canada68%
U.S.25%
Other7%
6Strategic Highlights May 24, 2017
Financial Results Month xx, 2015 717Q2
Financial ResultsFor the Quarter Ended April 30, 2017
May 24, 2017
Tom FlynnChief Financial Officer
8Financial Results May 24, 2017
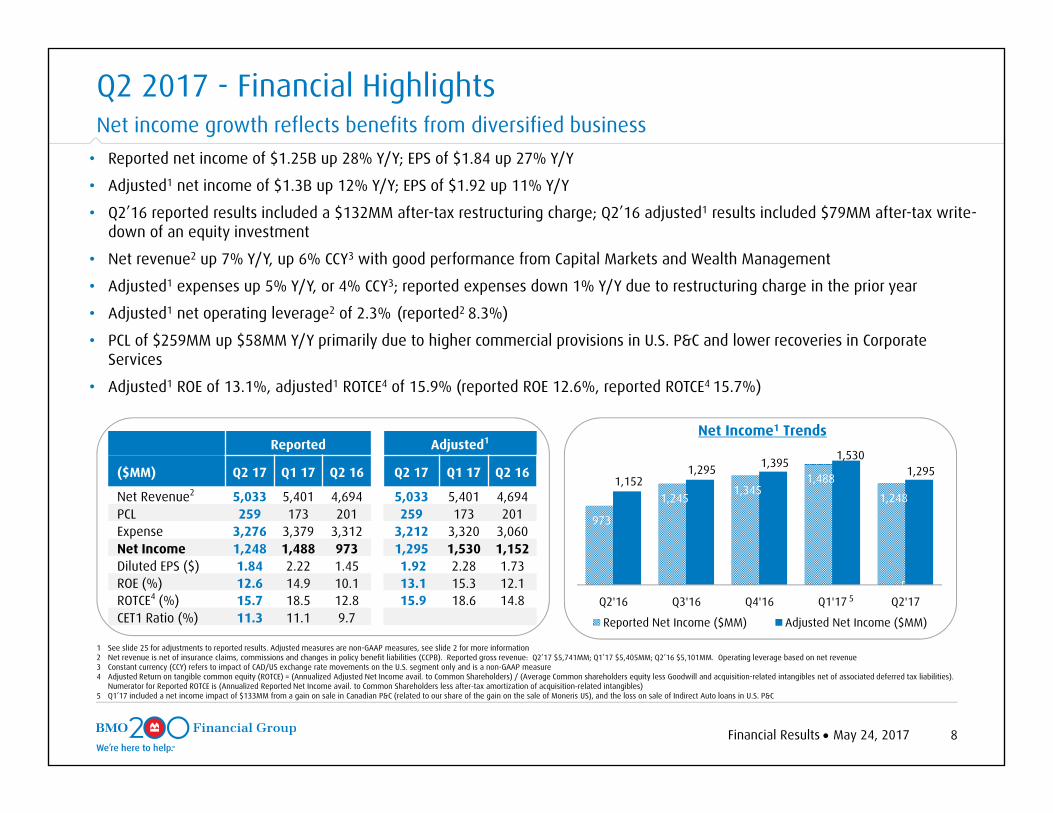
Q2 2017 - Financial HighlightsNet income growth reflects benefits from diversified business • Reported net income of $1.25B up 28% Y/Y; EPS of $1.84 up 27% Y/Y
• Adjusted1 net income of $1.3B up 12% Y/Y; EPS of $1.92 up 11% Y/Y
• Q2’16 reported results included a $132MM after-tax restructuring charge; Q2’16 adjusted1 results included $79MM after-tax write-down of an equity investment
• Net revenue2 up 7% Y/Y, up 6% CCY3 with good performance from Capital Markets and Wealth Management
• Adjusted1 expenses up 5% Y/Y, or 4% CCY3; reported expenses down 1% Y/Y due to restructuring charge in the prior year
• Adjusted1 net operating leverage2 of 2.3% (reported2 8.3%)
• PCL of $259MM up $58MM Y/Y primarily due to higher commercial provisions in U.S. P&C and lower recoveries in Corporate Services
• Adjusted1 ROE of 13.1%, adjusted1 ROTCE4 of 15.9% (reported ROE 12.6%, reported ROTCE4 15.7%)
1 See slide 25 for adjustments to reported results. Adjusted measures are non-GAAP measures, see slide 2 for more information2 Net revenue is net of insurance claims, commissions and changes in policy benefit liabilities (CCPB). Reported gross revenue: Q2’17 $5,741MM; Q1’17 $5,405MM; Q2’16 $5,101MM. Operating leverage based on net revenue3 Constant currency (CCY) refers to impact of CAD/US exchange rate movements on the U.S. segment only and is a non-GAAP measure4 Adjusted Return on tangible common equity (ROTCE) = (Annualized Adjusted Net Income avail. to Common Shareholders) / (Average Common shareholders equity less Goodwill and acquisition-related intangibles net of associated deferred tax liabilities).
Numerator for Reported ROTCE is (Annualized Reported Net Income avail. to Common Shareholders less after-tax amortization of acquisition-related intangibles)5 Q1’17 included a net income impact of $133MM from a gain on sale in Canadian P&C (related to our share of the gain on the sale of Moneris US), and the loss on sale of Indirect Auto loans in U.S. P&C
Net Income1 TrendsReported Adjusted1
($MM) Q2 17 Q1 17 Q2 16 Q2 17 Q1 17 Q2 16
Net Revenue2 5,033 5,401 4,694 5,033 5,401 4,694PCL 259 173 201 259 173 201Expense 3,276 3,379 3,312 3,212 3,320 3,060Net Income 1,248 1,488 973 1,295 1,530 1,152Diluted EPS ($) 1.84 2.22 1.45 1.92 2.28 1.73ROE (%) 12.6 14.9 10.1 13.1 15.3 12.1ROTCE4 (%) 15.7 18.5 12.8 15.9 18.6 14.8CET1 Ratio (%) 11.3 11.1 9.7
973
1,245 1,345
1,488
1,248 1,152
1,295 1,395 1,530 1,295
Q2'16 Q3'16 Q4'16 Q1'17 Q2'17
Reported Net Income ($MM) Adjusted Net Income ($MM)
5
9Financial Results May 24, 2017
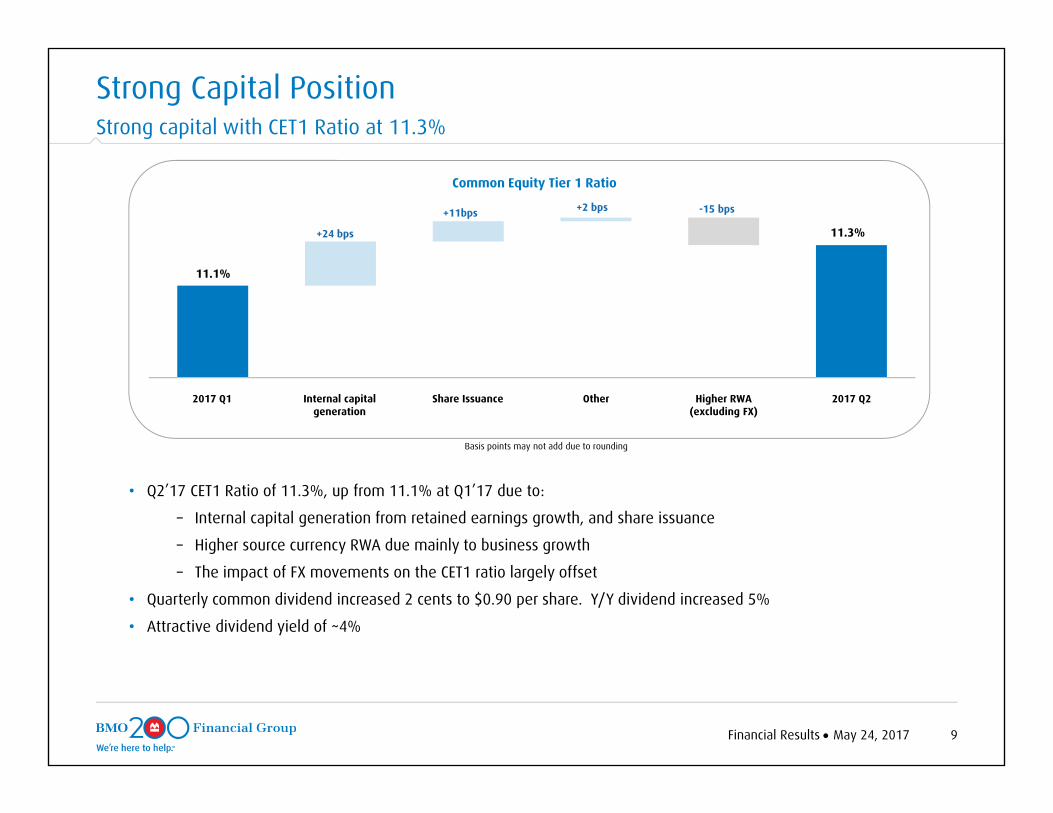
• Q2’17 CET1 Ratio of 11.3%, up from 11.1% at Q1’17 due to:
– Internal capital generation from retained earnings growth, and share issuance
– Higher source currency RWA due mainly to business growth
– The impact of FX movements on the CET1 ratio largely offset
• Quarterly common dividend increased 2 cents to $0.90 per share. Y/Y dividend increased 5%
• Attractive dividend yield of ~4%
Strong Capital PositionStrong capital with CET1 Ratio at 11.3%
Basis points may not add due to rounding
Common Equity Tier 1 Ratio
Other 2017 Q2Higher RWA (excluding FX)
Internal capital generation
Share Issuance2017 Q1
11.3%
11.1%
+11bps +2 bps
+24 bps
-15 bps
10Financial Results May 24, 2017
Reported Adjusted1
($MM) Q2 17 Q1 17 Q2 16 Q2 17 Q1 17 Q2 16
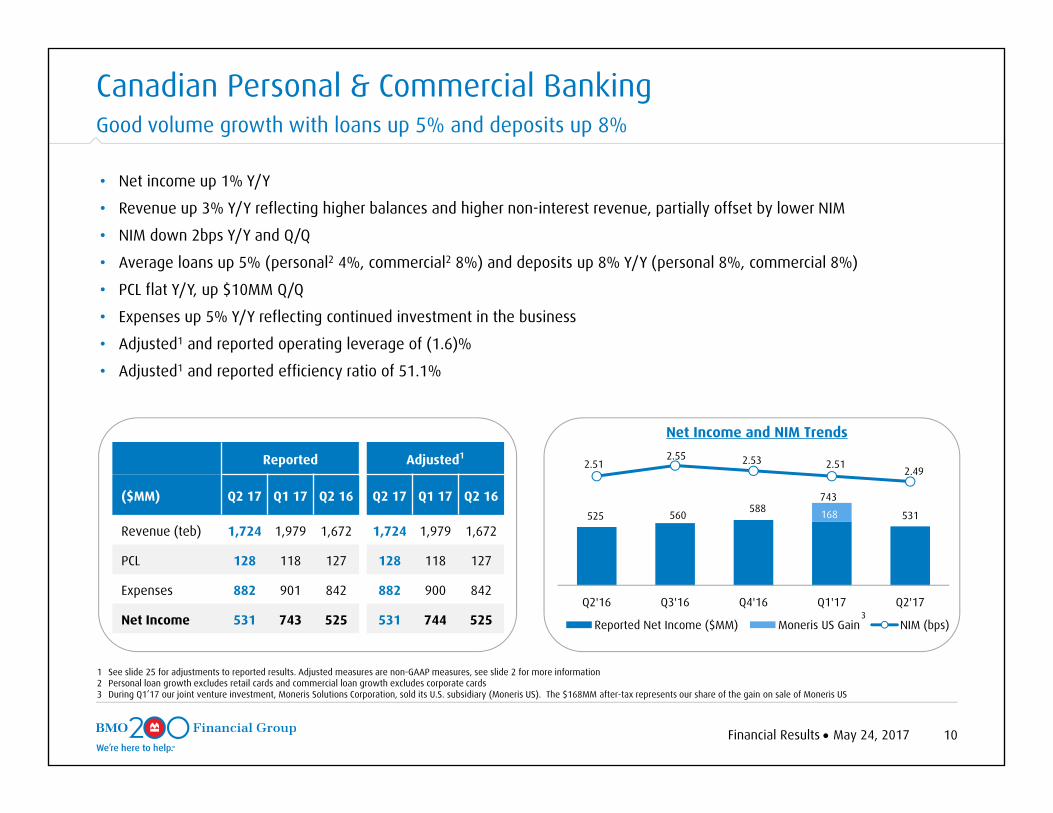
Revenue (teb) 1,724 1,979 1,672 1,724 1,979 1,672
PCL 128 118 127 128 118 127
Expenses 882 901 842 882 900 842
Net Income 531 743 525 531 744 525
Canadian Personal & Commercial BankingGood volume growth with loans up 5% and deposits up 8%
1 See slide 25 for adjustments to reported results. Adjusted measures are non-GAAP measures, see slide 2 for more information2 Personal loan growth excludes retail cards and commercial loan growth excludes corporate cards3 During Q1’17 our joint venture investment, Moneris Solutions Corporation, sold its U.S. subsidiary (Moneris US). The $168MM after-tax represents our share of the gain on sale of Moneris US
• Net income up 1% Y/Y
• Revenue up 3% Y/Y reflecting higher balances and higher non-interest revenue, partially offset by lower NIM
• NIM down 2bps Y/Y and Q/Q
• Average loans up 5% (personal2 4%, commercial2 8%) and deposits up 8% Y/Y (personal 8%, commercial 8%)
• PCL flat Y/Y, up $10MM Q/Q
• Expenses up 5% Y/Y reflecting continued investment in the business
• Adjusted1 and reported operating leverage of (1.6)%
• Adjusted1 and reported efficiency ratio of 51.1%
Net Income and NIM Trends
525 560 588 531 168
2.512.55 2.53 2.51
2.49
Q2'16 Q3'16 Q4'16 Q1'17 Q2'17
Reported Net Income ($MM) Moneris US Gain NIM (bps)
743
3

11Financial Results May 24, 2017
U.S. Personal & Commercial BankingContinued good expense management with positive operating leverage
• Adjusted1 net income of $260MM, down 7% Y/Y (reported $248MM, down 7%)Figures that follow are in U.S. dollars
• Adjusted1 and reported net income down 10% Y/Y driven primarily by higher PCL• Revenue down 2% Y/Y due to lower loan spreads and volumes partially offset by higher deposit revenue• NIM up 3 bps Q/Q and 2 bps Y/Y due to higher rates net of loan spread compression• Average loans and acceptances2 down 2% Y/Y, with commercial loan growth of 5% and deposits relatively flat • Adjusted1 expenses continue to be well managed, down 2% Y/Y (reported down 3%)• PCL up $29MM Y/Y mainly driven by higher commercial provisions• Adjusted1 operating leverage of 0.8% (reported 0.9%)• Adjusted1 efficiency ratio of 61.4% (reported 62.8%)
Net Income1 and NIM Trends
207 213 217 196 185
217 222 226 205 194
3.71 3.57 3.58 3.70 3.73
Q2'16 Q3'16 Q4'16 Q1'17 Q2'17Reported Net Income (US$MM) Adjusted Net Income (US$MM)NIM (bps)
1 See slide 25 for adjustments to reported results. Adjusted measures are non-GAAP measures, see slide 2 for more information 2 Average loans growth rate referenced above exclude Wealth Management mortgage and off-balance sheet balances for U.S. P&C serviced mortgage portfolio; average loans down 1% including these balances
Reported Adjusted1
(US$MM) Q2 17 Q1 17 Q2 16 Q2 17 Q1 17 Q2 16
Revenue (teb) 867 856 882 867 856 882
PCL 68 45 39 68 45 39
Expenses 545 556 559 533 544 546
Net Income 185 196 207 194 205 217
12Financial Results May 24, 2017
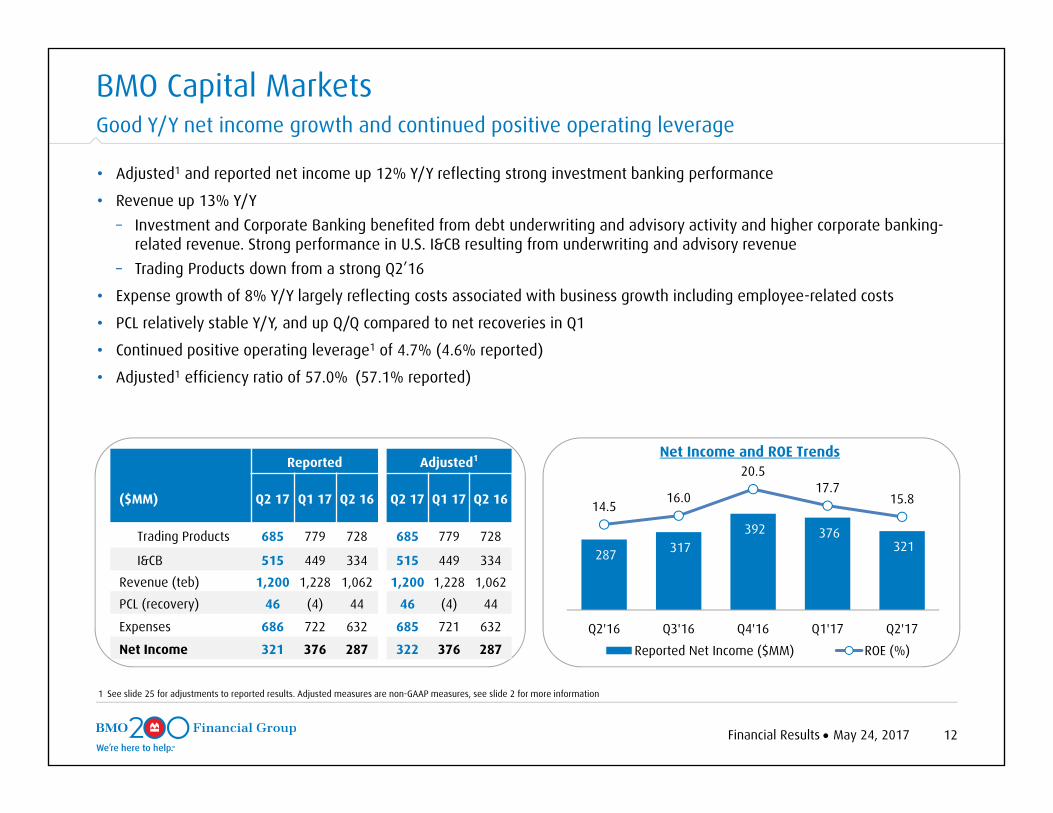
BMO Capital MarketsGood Y/Y net income growth and continued positive operating leverage
1 See slide 25 for adjustments to reported results. Adjusted measures are non-GAAP measures, see slide 2 for more information
• Adjusted1 and reported net income up 12% Y/Y reflecting strong investment banking performance
• Revenue up 13% Y/Y – Investment and Corporate Banking benefited from debt underwriting and advisory activity and higher corporate banking-
related revenue. Strong performance in U.S. I&CB resulting from underwriting and advisory revenue– Trading Products down from a strong Q2’16
• Expense growth of 8% Y/Y largely reflecting costs associated with business growth including employee-related costs
• PCL relatively stable Y/Y, and up Q/Q compared to net recoveries in Q1
• Continued positive operating leverage1 of 4.7% (4.6% reported)
• Adjusted1 efficiency ratio of 57.0% (57.1% reported)
Net Income and ROE TrendsReported Adjusted1
($MM) Q2 17 Q1 17 Q2 16 Q2 17 Q1 17 Q2 16
Trading Products 685 779 728 685 779 728
I&CB 515 449 334 515 449 334
Revenue (teb) 1,200 1,228 1,062 1,200 1,228 1,062
PCL (recovery) 46 (4) 44 46 (4) 44
Expenses 686 722 632 685 721 632
Net Income 321 376 287 322 376 287
287 317 392 376
321
14.516.0
20.517.7
15.8
Q2'16 Q3'16 Q4'16 Q1'17 Q2'17
Reported Net Income ($MM) ROE (%)

13Financial Results May 24, 2017
• Adjusted1 net income of $272MM, up 72% Y/Y (reported $251MM, up 86% Y/Y)
– Traditional Wealth adjusted1 results up 121% Y/Y (reported up 166%) with good underlying business growth, and also reflecting a $79MM investment write-down in the prior year
– Insurance earnings up 8% Y/Y primarily from business growth
• Net revenue2 up 17% Y/Y reflecting the prior year investment write-down, underlying business growth and the impact of improved markets
• Expenses up 1% Y/Y reflecting higher revenue-based costs and the benefits from productivity initiatives
• Adjusted1 net operating leverage2 of 15.7% (reported 16.1%), write-down in the prior year contributed ~11%
• Adjusted1 net efficiency ratio2 of 68.8% (reported 71.1%)
• AUM/AUA up 13% Y/Y due to improved equity markets and favourable foreign exchange movements
1 See slide 25 for adjustments to reported results. Adjusted measures are non-GAAP measures, see slide 2 for more information 2 For purposes of this slide revenue is net of insurance claims, commissions and changes in policy benefit liabilities (CCPB). Gross revenue: Q2’17 $1,864MM, Q1’17 $1,212MM, Q2’16 $1,397MM
Reported Adjusted1
($MM) Q2 17 Q1 17 Q2 16 Q2 17 Q1 17 Q2 16
Net Revenue2 1,156 1,208 990 1,156 1,208 990
PCL 1 2 2 1 2 2
Expenses 821 854 816 795 835 787
Net Income (NI) 251 266 134 272 281 158
Traditional Wealth NI 178 162 66 199 177 90
Insurance NI 73 104 68 73 104 68
AUM/AUA ($B) 920 865 817 920 865 817
Net Income1 Trends
Q2’16 Q3’16 Q4’16 Q1’17 Q2’17Reported Adjusted Reported Adjusted Reported Adjusted Reported Adjusted Reported Adjusted
Traditional Wealth
134158
201227
279302
266 281251
272Insurance
BMO Wealth ManagementStrong results in both Traditional Wealth and Insurance with continued benefit from productivity initiatives
14Financial Results May 24, 2017
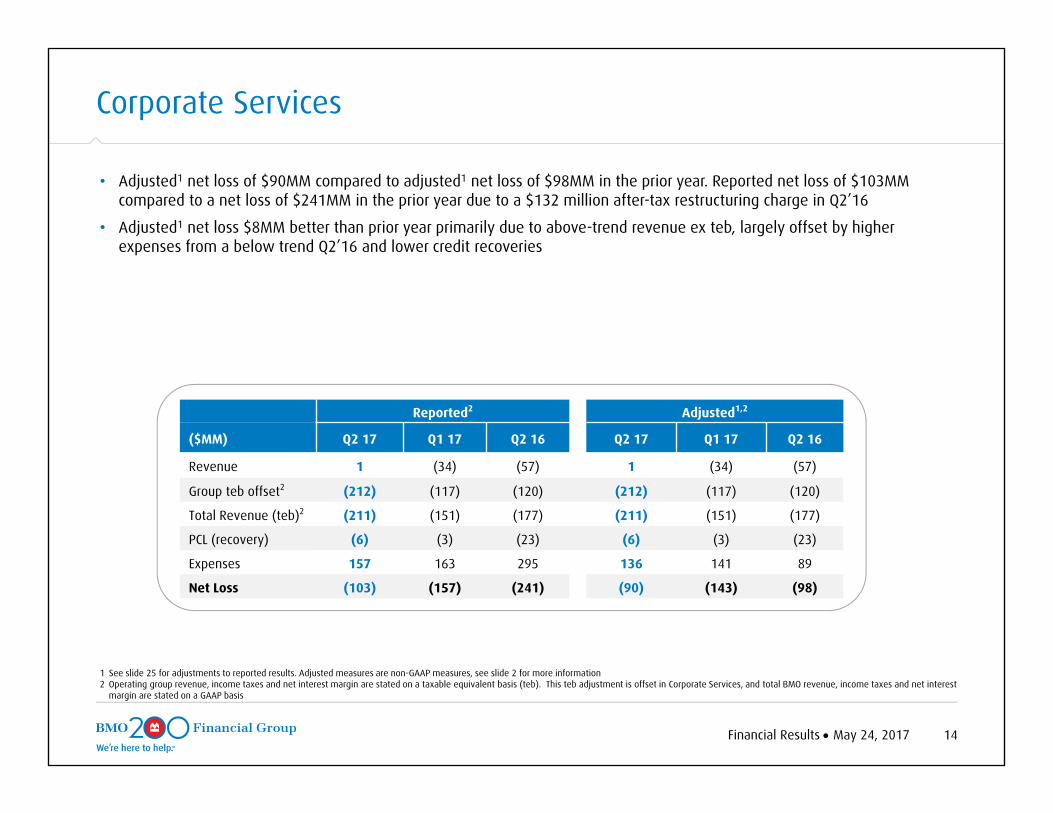
• Adjusted1 net loss of $90MM compared to adjusted1 net loss of $98MM in the prior year. Reported net loss of $103MM compared to a net loss of $241MM in the prior year due to a $132 million after-tax restructuring charge in Q2’16
• Adjusted1 net loss $8MM better than prior year primarily due to above-trend revenue ex teb, largely offset by higher expenses from a below trend Q2’16 and lower credit recoveries
1 See slide 25 for adjustments to reported results. Adjusted measures are non-GAAP measures, see slide 2 for more information 2 Operating group revenue, income taxes and net interest margin are stated on a taxable equivalent basis (teb). This teb adjustment is offset in Corporate Services, and total BMO revenue, income taxes and net interest
margin are stated on a GAAP basis
Reported2 Adjusted1,2
($MM) Q2 17 Q1 17 Q2 16 Q2 17 Q1 17 Q2 16
Revenue 1 (34) (57) 1 (34) (57)
Group teb offset2 (212) (117) (120) (212) (117) (120)
Total Revenue (teb)2 (211) (151) (177) (211) (151) (177)
PCL (recovery) (6) (3) (23) (6) (3) (23)
Expenses 157 163 295 136 141 89
Net Loss (103) (157) (241) (90) (143) (98)
Corporate Services
Financial Results Month xx, 2015 1517Q2
Risk ReviewFor the Quarter Ended April 30, 2017
May 24, 2017
Surjit RajpalChief Risk Officer

Risk Review May 24, 2017 16
201257
174 173259
Q2'16 Q3'16 Q4'16 Q1'17 Q2'17
Quarterly Specific PCL ($MM)
• Q2’17 PCL ratio at 28 bps, up 9 bps Q/Q primarily due to higher losses in U.S. P&C Commercial and Capital Markets
• Year-to-date PCL ratio at 23 bps
Provision for Credit Losses (PCL)
PCL By Operating Group ($MM) Q2 16 Q1 17 Q2 17
Consumer – Canadian P&C 105 98 104
Commercial – Canadian P&C 22 20 24
Total Canadian P&C 127 118 128
Consumer – U.S. P&C 35 26 30
Commercial – U.S. P&C 16 34 60
Total U.S. P&C 51 60 90
Wealth Management 2 2 1
Capital Markets 44 (4) 46
Corporate Services (23) (3) (6)
Specific PCL 201 173 259
Change in Collective Allowance - - -
Total PCL 201 173 259
PCL in bps 23 19 28
Risk Review May 24, 2017 17
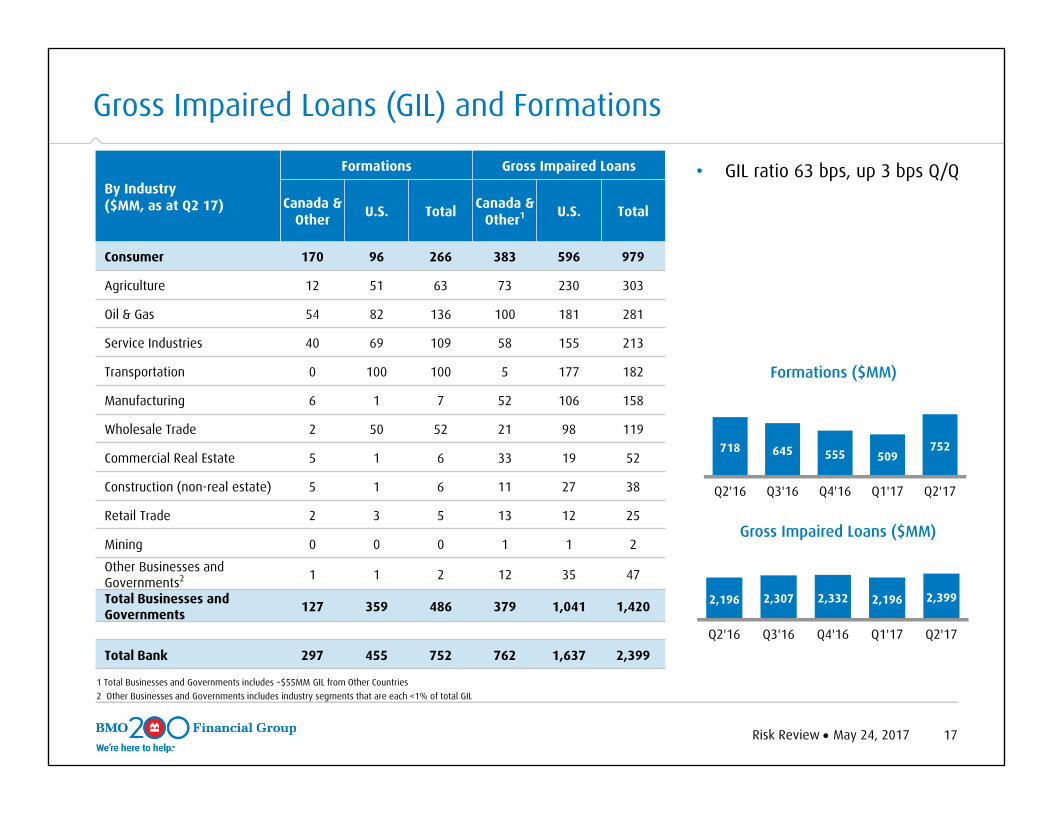
718 645 555 509752
Q2'16 Q3'16 Q4'16 Q1'17 Q2'17
Formations ($MM)
2,196 2,307 2,332 2,196 2,399
Q2'16 Q3'16 Q4'16 Q1'17 Q2'17
Gross Impaired Loans ($MM)
1 Total Businesses and Governments includes ~$55MM GIL from Other Countries2 Other Businesses and Governments includes industry segments that are each <1% of total GIL
• GIL ratio 63 bps, up 3 bps Q/Q
Gross Impaired Loans (GIL) and Formations
By Industry($MM, as at Q2 17)
Formations Gross Impaired Loans
Canada & Other U.S. Total Canada &
Other1 U.S. Total
Consumer 170 96 266 383 596 979
Agriculture 12 51 63 73 230 303
Oil & Gas 54 82 136 100 181 281
Service Industries 40 69 109 58 155 213
Transportation 0 100 100 5 177 182
Manufacturing 6 1 7 52 106 158
Wholesale Trade 2 50 52 21 98 119
Commercial Real Estate 5 1 6 33 19 52
Construction (non-real estate) 5 1 6 11 27 38
Retail Trade 2 3 5 13 12 25
Mining 0 0 0 1 1 2
Other Businesses and Governments2 1 1 2 12 35 47
Total Businesses and Governments 127 359 486 379 1,041 1,420
Total Bank 297 455 752 762 1,637 2,399

Risk Review May 24, 2017 18
Residential MortgagesInsured Uninsured Total % of Total Uninsured
LTVBy Region($B, as at Q2 17)
Atlantic 3.6 1.7 5.3 5% 59%
Quebec 9.1 5.8 14.9 14% 62%
Ontario 23.5 20.9 44.4 43% 53%
Alberta 11.3 4.8 16.1 15% 61%
British Columbia 7.5 12.0 19.5 19% 47%
All Other Canada 2.4 1.4 3.8 4% 55%
Total Canada 57.5 46.6 104.1 100% 54%
• Total Canadian residential mortgage portfolio at $104.1B─ 55% of the portfolio is insured
─ Loan-to-value (LTV)1 on the uninsured portfolio is 54%
─ 70% of the portfolio has an effective remaining amortization of 25 years or less
─ Loss rates for the trailing 4 quarter period were less than 1 bp
─ 90 day delinquency rate remains good at 23 bps
─ Condo Mortgage portfolio is $14.8B with 49% insured
1 LTV is the ratio of outstanding mortgage balance to the original property value indexed using Teranet data. Portfolio LTV is the combination of each individual mortgage LTV weighted by the mortgage balance
Canadian Residential Mortgages
Risk Review May 24, 2017 19
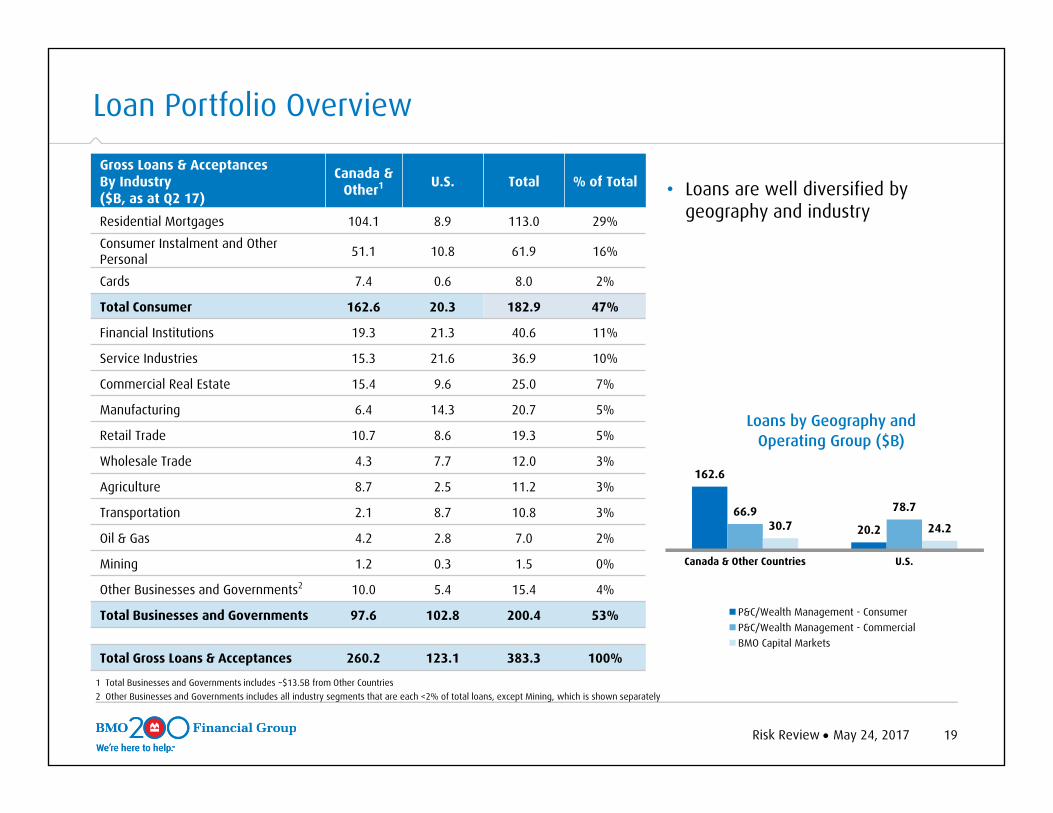
1 Total Businesses and Governments includes ~$13.5B from Other Countries2 Other Businesses and Governments includes all industry segments that are each <2% of total loans, except Mining, which is shown separately
• Loans are well diversified by geography and industry
Loan Portfolio Overview
162.6
20.266.9 78.7
30.7 24.2
Canada & Other Countries U.S.
Loans by Geography and Operating Group ($B)
P&C/Wealth Management - ConsumerP&C/Wealth Management - CommercialBMO Capital Markets
Gross Loans & Acceptances By Industry($B, as at Q2 17)
Canada & Other1 U.S. Total % of Total
Residential Mortgages 104.1 8.9 113.0 29%
Consumer Instalment and Other Personal 51.1 10.8 61.9 16%
Cards 7.4 0.6 8.0 2%
Total Consumer 162.6 20.3 182.9 47%
Financial Institutions 19.3 21.3 40.6 11%
Service Industries 15.3 21.6 36.9 10%
Commercial Real Estate 15.4 9.6 25.0 7%
Manufacturing 6.4 14.3 20.7 5%
Retail Trade 10.7 8.6 19.3 5%
Wholesale Trade 4.3 7.7 12.0 3%
Agriculture 8.7 2.5 11.2 3%
Transportation 2.1 8.7 10.8 3%
Oil & Gas 4.2 2.8 7.0 2%
Mining 1.2 0.3 1.5 0%
Other Businesses and Governments2 10.0 5.4 15.4 4%
Total Businesses and Governments 97.6 102.8 200.4 53%
Total Gross Loans & Acceptances 260.2 123.1 383.3 100%
Financial Results Month xx, 2015 20
APPENDIX

21Financial Results May 24, 2017
50.4 55.1 54.7
89.7 95.0 96.7
Q2'16 Q1'17 Q2'17
Commercial Deposits Personal Deposits
Average Loans & Acceptances ($B) Average Deposits ($B)
• Loan growth of 5% Y/Y
– Mortgages up 5%
– Consumer loan balances up 2%
– Commercial loan balances1 up 8%
Canadian Personal and Commercial Banking - Balances
• Deposit growth of 8% Y/Y
– Personal deposit balances up 8% including strong chequing account growth
– Commercial deposit balances up 8%
140.1150.1
1 Commercial lending growth excludes commercial cards. Commercial cards balances approximately 8% of total credit card portfolio in Q2’16, and 7% in Q2’17 and Q1’17
151.4
203.6212.7 214.1
57.8 60.8 62.5
8.4 8.8 8.6
44.0 44.7 44.7
93.4 98.4 98.3
Q2'16 Q1'17 Q2'17Commercial Loans & Acceptances Credit CardsConsumer Loans Residential Mortgages
22Financial Results May 24, 2017
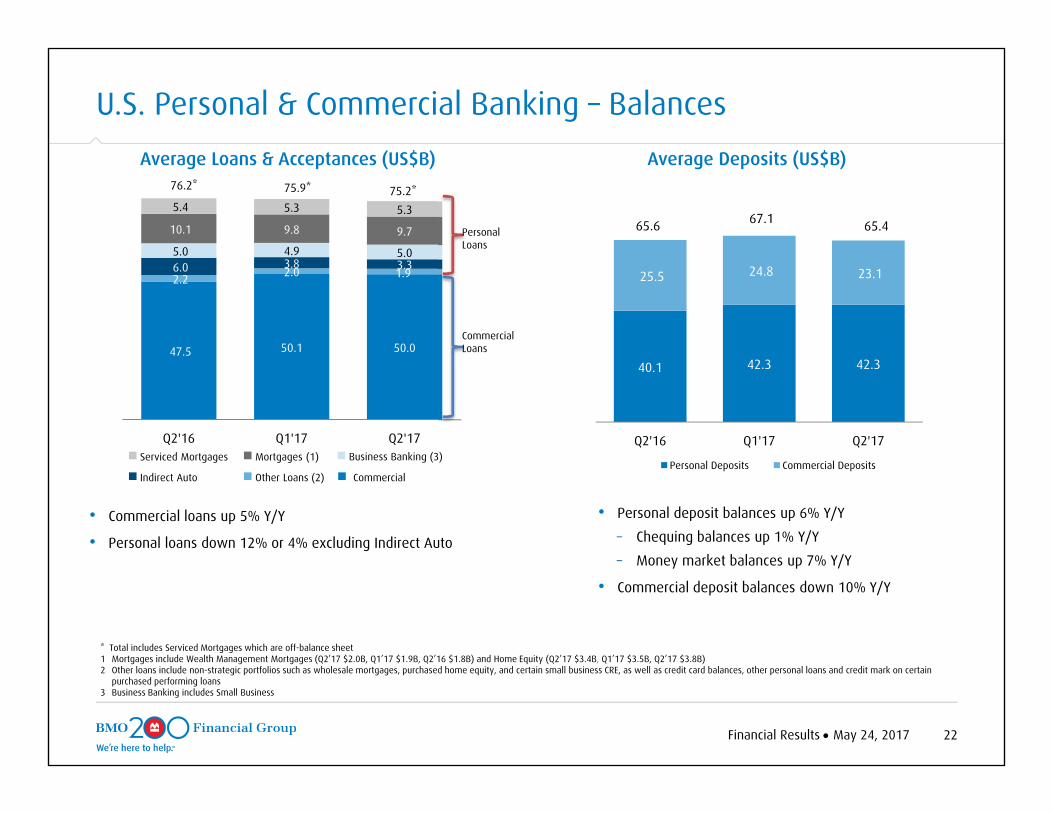
U.S. Personal & Commercial Banking – Balances
47.5 50.1 50.0
2.2 2.0 1.96.0 3.8 3.35.0 4.9 5.0
10.1 9.8 9.7
5.4 5.3 5.3
Q2'16 Q1'17 Q2'17
76.2* 75.9* 75.2*
Average Loans & Acceptances (US$B)
40.1 42.3 42.3
25.5 24.8 23.1
Q2'16 Q1'17 Q2'17
Personal Deposits Commercial Deposits
65.6 65.467.1
Average Deposits (US$B)
• Personal deposit balances up 6% Y/Y
– Chequing balances up 1% Y/Y
– Money market balances up 7% Y/Y
• Commercial deposit balances down 10% Y/Y
• Commercial loans up 5% Y/Y
• Personal loans down 12% or 4% excluding Indirect Auto
* Total includes Serviced Mortgages which are off-balance sheet1 Mortgages include Wealth Management Mortgages (Q2’17 $2.0B, Q1’17 $1.9B, Q2’16 $1.8B) and Home Equity (Q2’17 $3.4B, Q1’17 $3.5B, Q2’17 $3.8B)2 Other loans include non-strategic portfolios such as wholesale mortgages, purchased home equity, and certain small business CRE, as well as credit card balances, other personal loans and credit mark on certain
purchased performing loans 3 Business Banking includes Small Business
Commercial Loans
Personal Loans
Indirect Auto
Serviced Mortgages Mortgages (1)
Other Loans (2) Commercial
Business Banking (3)
Risk Review May 24, 2017 23
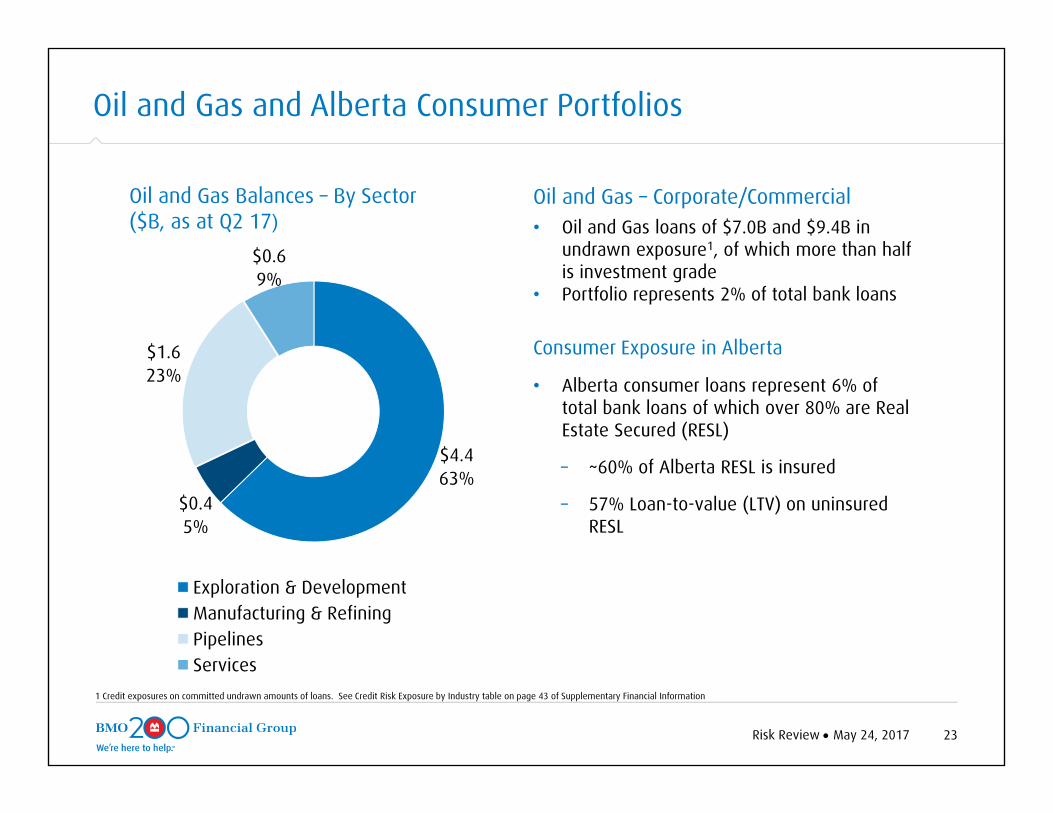
Oil and Gas Balances – By Sector ($B, as at Q2 17)
Oil and Gas and Alberta Consumer Portfolios
Oil and Gas – Corporate/Commercial • Oil and Gas loans of $7.0B and $9.4B in
undrawn exposure1, of which more than half is investment grade
• Portfolio represents 2% of total bank loans
Consumer Exposure in Alberta
• Alberta consumer loans represent 6% of total bank loans of which over 80% are Real Estate Secured (RESL)
– ~60% of Alberta RESL is insured
– 57% Loan-to-value (LTV) on uninsured RESL
1 Credit exposures on committed undrawn amounts of loans. See Credit Risk Exposure by Industry table on page 43 of Supplementary Financial Information
$4.463%
$0.45%
$1.623%
$0.69%
Exploration & DevelopmentManufacturing & RefiningPipelinesServices
Risk Review May 24, 2017 24
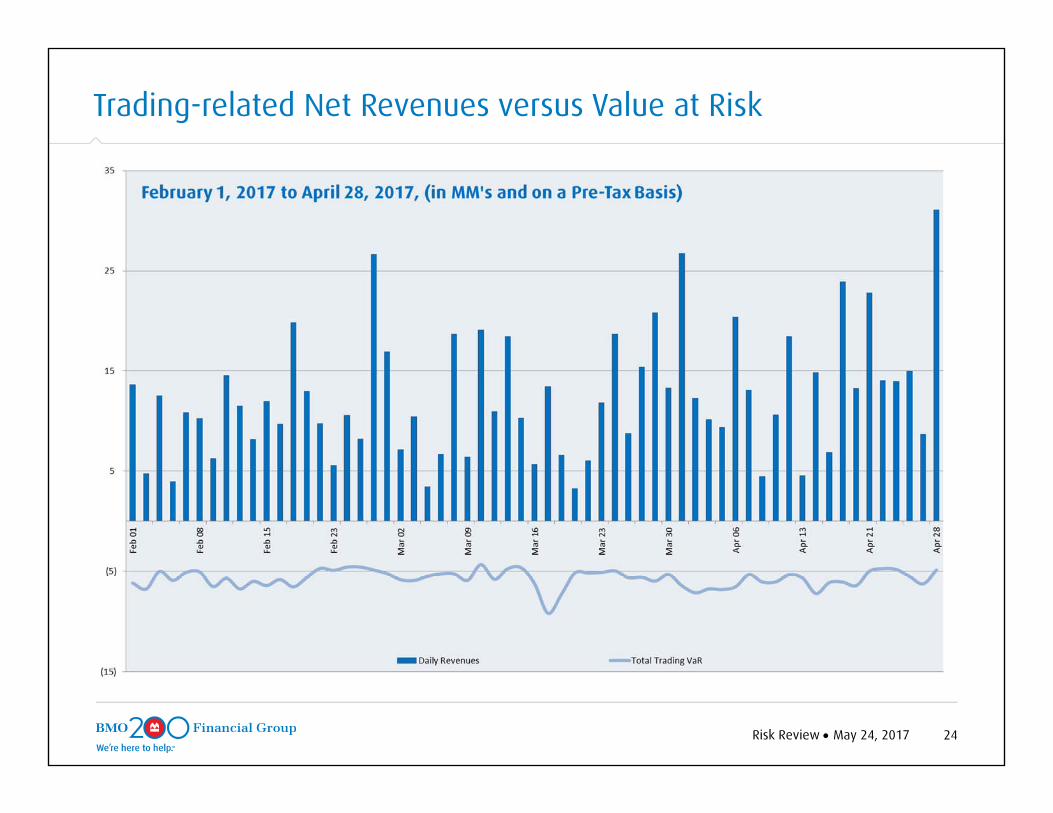
Trading-related Net Revenues versus Value at Risk
25Financial Results May 24, 2017
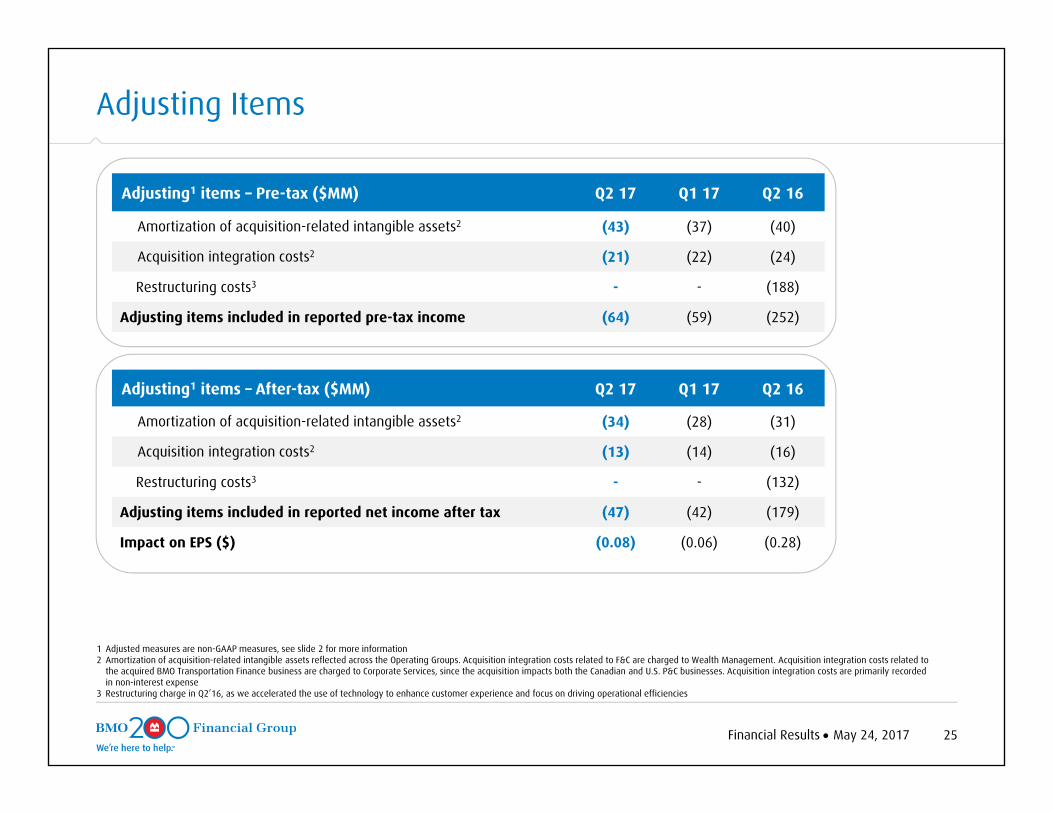
Adjusting Items
Adjusting1 items – Pre-tax ($MM) Q2 17 Q1 17 Q2 16
Amortization of acquisition-related intangible assets2 (43) (37) (40)
Acquisition integration costs2 (21) (22) (24)
Restructuring costs3 - - (188)
Adjusting items included in reported pre-tax income (64) (59) (252)
Adjusting1 items – After-tax ($MM) Q2 17 Q1 17 Q2 16
Amortization of acquisition-related intangible assets2 (34) (28) (31)
Acquisition integration costs2 (13) (14) (16)
Restructuring costs3 - - (132)
Adjusting items included in reported net income after tax (47) (42) (179)
Impact on EPS ($) (0.08) (0.06) (0.28)
1 Adjusted measures are non-GAAP measures, see slide 2 for more information2 Amortization of acquisition-related intangible assets reflected across the Operating Groups. Acquisition integration costs related to F&C are charged to Wealth Management. Acquisition integration costs related to
the acquired BMO Transportation Finance business are charged to Corporate Services, since the acquisition impacts both the Canadian and U.S. P&C businesses. Acquisition integration costs are primarily recorded in non-interest expense
3 Restructuring charge in Q2’16, as we accelerated the use of technology to enhance customer experience and focus on driving operational efficiencies

Financial Results Month xx, 2015 26
Investor Relations Contact Information
bmo.com/investorrelationsE-mail: [email protected]
JILL HOMENUKHead, Investor [email protected]
CHRISTINE VIAUDirector, Investor [email protected]