Centre of excellence for low carbon and fuel cells
31
Cenex Centre of excellence for low carbon and fuel cell technologies The Coca-Cola Enterprises Biomethane Trial Report Authored by Steve Carroll - Technical Specialist Approved by Chris Walsh – Head of Technical Support and Consultancy March 2012
Transcript of Centre of excellence for low carbon and fuel cells

Cenex
Centre of excellence for low carbon and fuel cell technologies
The Coca-Cola Enterprises Biomethane
Trial Report
Authored by
Steve Carroll - Technical Specialist
Approved by
Chris Walsh – Head of Technical Support and Consultancy
March 2012
The biomethane vehicle trial
Page 2 Cenex 2012 128-1.2
Executive summary Driven by a desire to produce a step change reduction in fleet CO2 emissions Coca-Cola Enterprises (CCE) evaluated and compared the emissions, fuel consumption,
economics, reliability and operability of a 26 tonne Iveco Stralis gas vehicle operating on biomethane with that of a diesel Stralis vehicle. The vehicles’ performance was evaluated as part of a collaborative assessment project involving Cenex - the UK’s Centre of Excellence for Low Carbon and Fuel Cell technologies acting as an independent monitoring body, Iveco – the vehicle provider, GasRec – the fuel supplier and CCE – the vehicle operator, where the economic, technical and programme support resources of each partner were pooled.
Biomethane is a renewable transport fuel with a similar energy content and chemical composition to natural gas and is fully exchangeable with natural gas when used in an engine. Gas vehicle technologies are well proven throughout Europe and the world where vehicles are operated in significant numbers . OEMs now supply gas vehicles into the UK covering most commercial vehicle classes.
Temporary gas vehicle refuelling infrastructure was installed at the CCE depot in Enfield, UK where the trial vehicles were operated from.
Vehicle activity data from the Enfield depot was logged via onboard telemetry and a drive cycle (a speed versus time cycle) was produced. The CCE drive cycle was a 30 minute 19.5 km cycle statistically representative of vehicle distribution patterns from Enfield. Testing vehicles over the CCE drive cycle in an emissions testing facility allowed air quality performance as well as tailpipe CO2 and fuel consumption to be measured in a controlled and repeatable environment.
Gas vehicle operation reduced NOx and PM emissions by 85.6% and 97.1% respectively. The gas truck consumed 34.9 kg/100 km compared to the diesel truck that consumed 31.9 litres/100 km over the CCE drive cycle. This equated to a theoretical vehicle range of 357 km and 940 km for the gas and diesel trucks respectively. The overall reduction in efficiency from the diesel to gas vehicle over the CCE drive cycle was 31.8%.
Well-to-wheel emission analysis quantified the total carbon footprint of the transport fuels. The emissions relating to a trial gas station are often high and unrepresentative of the emissions from a permanent higher volume station due to the inherent inefficiencies of a low volume gas supply. The overall well-to-wheel savings achieved from biomethane operation were 50.3% and 60.7% for trial and permanent station scenarios respectively.
The gas vehicle achieved an availability rate of 99.2% during the 12 month vehicle trail compared to an availability rate of 100% for the diesel vehicle.
A tests regime was designed to measure noise emissions relevant to inner-city areas and night time distributions. Gas vehicle operation reduced noise levels by 4.1 dB(A), 10.5 dB(A), and 8.1 dB(A) during low speed drive-by, engine idle and hot engine start conditions respectively.
Fuel analysis showed that the biomethane had a high methane content (<95%) and very low levels of contamination both directly at the biogas upgrading plant and at the high pressure gas dispensing unit at site.
Analysis of used engine oil from the gas vehicle showed that the oil was in good condition. No water was detected within the oil and wear metals were within normal levels.
Drivers rated the overall performance of the gas vehicle higher than the diesel. Drivers were most impressed with the gas trucks acceleration, transmission and refuelling aspects.
Operating the gas vehicle on biomethane reduced the fuel costs by 12.8%. However, the total cost of ownership increased by 15.3% primarily due to the additional capital cost of the gas vehicle. Estimated future cost reductions between the vehicle technologies coupled with a further reduction in gas price due to either a higher volume supply or the use of a public gas refuelling station would achieve a similar total cost of ownership between the two vehicle technologies.
On conclusion of the trial CCE invested in a fleet of 14 gas Iveco Stralis vehicles and a gas station which is due to be operational at the Enfield depot in June 2012. The new CCE gas fleet will consume approximately 168 tonnes of biomethane saving over 300 tonnes of CO2, 1590 kgs of NOx and 33 kgs of PM emissions per annum.

The biomethane vehicle trial
Page 3 Cenex 2012 128-1.2
Contents Slide number
Executive summary 2 Contents 3
Introduction
Introduction to the Coca-Cola Enterprises vehicle trial 4 Introduction to biomethane 5 Introduction to gas vehicles 6 The project partners 7 The trial vehicles 8 The trial refueling set-up 9 The trial delivery routes 10
Drive cycle creation and testing
Drive cycle creation methodology 11 The CCE drive cycle 12 Drive cycle air quality emissions 13 Drive cycle fuel consumption, vehicle efficiency & range 14 Introduction to vehicle CO2 emissions 16
Emissions analysis Well-to-tank CO2 emissions 17 Well-to-wheel CO2 emissions 18 Drive cycle emissions summary 19
Real-world performance and condition monitoring
Real-world fuel consumption and emissions 20 Reliability 21 Driver feedback 22 Noise measurements 23 Fuel analysis 24 Oil analysis 25
Economics Economics 26
Next steps and conclusions
Next steps 27 Concluding statements 28 Further information 29 References and acknowledgements 30 Table of abbreviations 31
The biomethane vehicle trial
Key point
Cenex 2012 128-1.2
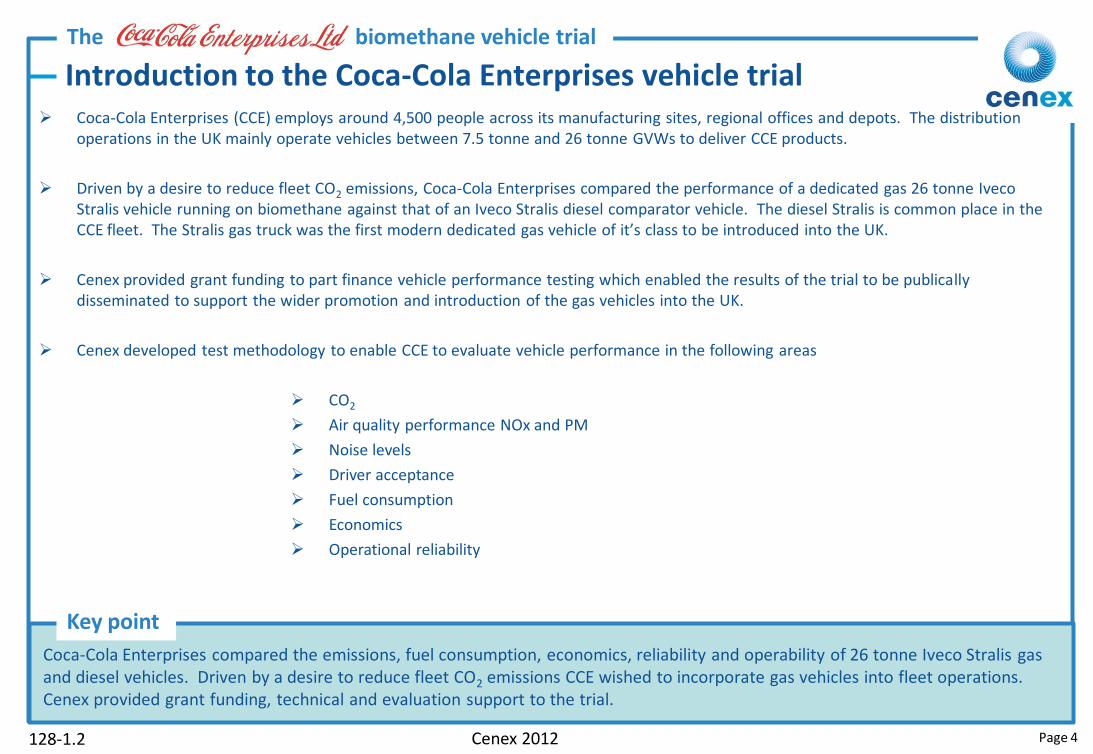
Coca-Cola Enterprises (CCE) employs around 4,500 people across its manufacturing sites, regional offices and depots. The distribution operations in the UK mainly operate vehicles between 7.5 tonne and 26 tonne GVWs to deliver CCE products.
Driven by a desire to reduce fleet CO2 emissions, Coca-Cola Enterprises compared the performance of a dedicated gas 26 tonne Iveco Stralis vehicle running on biomethane against that of an Iveco Stralis diesel comparator vehicle. The diesel Stralis is common place in the CCE fleet. The Stralis gas truck was the first modern dedicated gas vehicle of it’s class to be introduced into the UK.
Cenex provided grant funding to part finance vehicle performance testing which enabled the results of the trial to be publically disseminated to support the wider promotion and introduction of the gas vehicles into the UK.
Cenex developed test methodology to enable CCE to evaluate vehicle performance in the following areas
CO2
Air quality performance NOx and PM
Noise levels
Driver acceptance
Fuel consumption
Economics
Operational reliability
Introduction to the Coca-Cola Enterprises vehicle trial
Coca-Cola Enterprises compared the emissions, fuel consumption, economics, reliability and operability of 26 tonne Iveco Stralis gas and diesel vehicles. Driven by a desire to reduce fleet CO2 emissions CCE wished to incorporate gas vehicles into fleet operations. Cenex provided grant funding, technical and evaluation support to the trial.
Page 4

The biomethane vehicle trial
Key point
Cenex 2012 128-1.2
Introduction to biomethane
Biomethane is the term given to biogas that has been upgraded (i.e. unwanted gases and contaminants have been removed) to vehicle fuel quality which typically has a high > 95% methane (CH4) content. Biogas is created from the anaerobic digestion of organic matter and contains approximately 60% CH4 and 40% carbon dioxide (CO2), plus very small quantities of oxygen (O2), carbon monoxide (CO), and nitrogen (N2).
The amount of CO2 produced by combusting biomethane is similar to the amount of CO2 absorbed by the organic matter during it’s growth. The release of this CO2 to atmosphere is part of our planets sustainable carbon cycle. Hence, biomethane is a renewable fuel.
The UK is one of the largest producers of biogas from landfill sites in Europe. The majority of this biogas is combusted to produce electricity for export to the national grid rather than being upgraded to biomethane and used as a vehicle fuel.
The rising price of diesel, corporate sustainability interests and moves from the UK Government to provide some funding for alternative refuelling infrastructure as well as incentives to inject biomethane into the natural gas grid are creating a growing interest in using biomethane as a transport fuel throughout the UK.
Biomethane is similar in energy content and chemical composition to natural gas and is fully interchangeable with natural gas when used in an engine.
Biomethane is a renewable transport fuel with a similar energy content and chemical composition to natural gas and is fully exchangeable with natural gas when used in an engine.
Page 5

The biomethane vehicle trial
Key point
Cenex 2012 128-1.2
Introduction to gas vehicles
There are currently over 13 million natural gas vehicles operating throughout the world. The market leader in Europe is Italy with over 760,000 vehicles on the road, followed by Ukraine and Germany with 200,000 and 95,000 vehicles respectively. The UK lags behind with only 220 gas vehicles in operation [1].
Modern natural gas vehicles were first introduced into the UK in the mid 1990s. Unfortunately at that time the high moisture content within the UK natural gas network contaminated the fuel which lead to perceived poor vehicle reliability. Modernised gas grids, gas drier technology and widely available liquefied natural gas and biomethane (the liquefaction process removes moisture) has resulted in a high quality fuel now being available for use in vehicles.
OEMs now supply gas vehicles into the UK covering most commercial vehicle classes. Dedicated gas vehicles use a spark ignition (SI) engine. Dual fuel gas vehicles use a compression ignition (CI) engine and simultaneously combust a mixture of diesel and gas. Bi-fuel gas vehicles incorporate two separate fuel systems and can operate on either gas or petrol in a SI engine. A complete description of gas vehicle technologies is available in the Cenex biomethane toolkit available from www.cenex.co.uk/resources
Fleets incorporating back-to-base operations are ideal adopters of the technology given the current lack of publically available gas vehicle refuelling infrastructure within the UK.
Gas vehicle technologies are well proven with vehicles being operated in significant numbers throughout Europe and the world. OEMs now supply gas vehicles covering most commercial vehicle classes into the UK.
Page 6

The biomethane vehicle trial
Key point
Cenex 2012 128-1.2
The project partners
A collaborative agreement covering the vehicle performance evaluation was formed between the partners below. Economic, technical and project management resources were pooled between the partners.
Cenex, the Centre of Excellence for low carbon vehicle technologies, provided independent technical, evaluation and reporting support.
CCE, operated the vehicles on distribution routes from its depot in Enfield, UK.
Iveco, the truck manufacture, provided technical support to the project.
Gasrec, the fuel supplier, provided a biomethane supply at the testing facility and technical support to the project.
The vehicles’ performance was evaluated as part of a collaborative assessment project involving Cenex - acting as an independent monitoring body, Iveco – the vehicle provider, GasRec – the fuel supplier and CCE – the vehicle operator, pooling the economic, technical and programme support resources of each partner.
Page 7
The biomethane vehicle trial
Key point
Cenex 2012 128-1.2
The trial vehicles
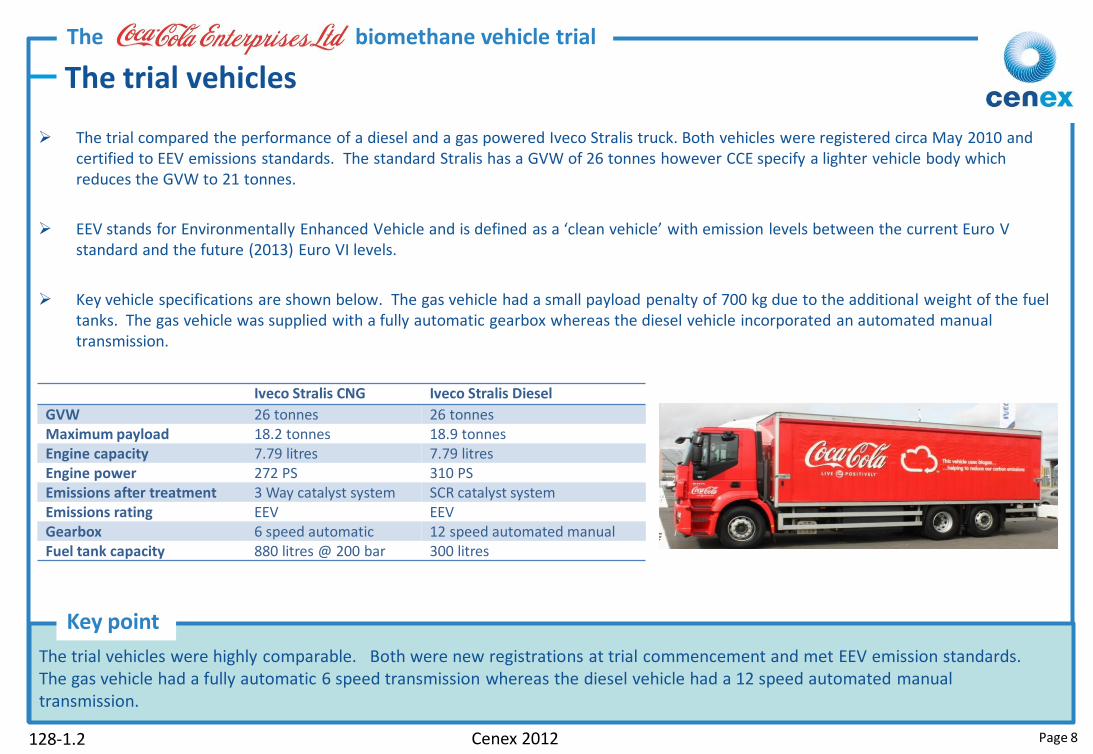
The trial compared the performance of a diesel and a gas powered Iveco Stralis truck. Both vehicles were registered circa May 2010 and certified to EEV emissions standards. The standard Stralis has a GVW of 26 tonnes however CCE specify a lighter vehicle body which reduces the GVW to 21 tonnes.
EEV stands for Environmentally Enhanced Vehicle and is defined as a ‘clean vehicle’ with emission levels between the current Euro V standard and the future (2013) Euro VI levels.
Key vehicle specifications are shown below. The gas vehicle had a small payload penalty of 700 kg due to the additional weight of the fuel tanks. The gas vehicle was supplied with a fully automatic gearbox whereas the diesel vehicle incorporated an automated manual transmission.
Iveco Stralis CNG Iveco Stralis Diesel
GVW 26 tonnes 26 tonnes Maximum payload 18.2 tonnes 18.9 tonnes Engine capacity 7.79 litres 7.79 litres Engine power 272 PS 310 PS Emissions after treatment 3 Way catalyst system SCR catalyst system Emissions rating EEV EEV Gearbox 6 speed automatic 12 speed automated manual Fuel tank capacity 880 litres @ 200 bar 300 litres
The trial vehicles were highly comparable. Both were new registrations at trial commencement and met EEV emission standards. The gas vehicle had a fully automatic 6 speed transmission whereas the diesel vehicle had a 12 speed automated manual transmission.
Page 8

The biomethane vehicle trial
Key point
Cenex 2012 128-1.2
The trial refueling set-up
A temporary refuelling facility was setup at the CCE depot and consisted of the following.
Item 1 - a one tonne capacity cryogenic tank storing low pressure liquefied biomethane gas (LBG). LBG was delivered to site approximately once every 10 days.
Item 2 - a gas vaporising column.
Item 3 - reciprocating gas compressors that increased the biomethane pressure to approximately 250 bar.
Item 4 - a cylinder bank that stored compressed biomethane gas (CBG).
Item 5 – A CBG dispenser that transferred the gas to the vehicle. The dispenser incorporated a mass based flow meter. Operators refuelled and recorded the gas dispensed to the vehicle on a daily basis.
1
5 4
3
2
A temporary gas vehicle refuelling infrastructure was installed at the Enfield depot to support the vehicle trial.
Page 9

The biomethane vehicle trial
Key point
Cenex 2012 128-1.2
The trial delivery routes
CCE
depot
Essex
Reading
Central
London
Route Typical number of drops
Typical route length (km)
Average speed (mph)
Average duration (hrs)
Central London 25 109 27 8 Essex 23 198 36 10.5 Reading 24 299 40 12.5
CCE operated the trial vehicles over three routes that were broadly representative of all delivery routes from the Enfield depot.
Page 10
Three routes were identified by CCE that were broadly representative of all the delivery routes from Enfield.
The Central London route consisted of mainly inner city stop/start deliveries and was representative of approximately 50% of the distribution activity from Enfield.
The Reading route consisted of a motorway commute with urban deliveries and was representative of approximately 25% of the distribution activity from Enfield.
The Essex route consisted of a motorway and A-road commute with mixed deliveries and was representative of approximately 25% of the distribution activity from Enfield.
The trucks were mainly deployed over these three routes as operational requirements allowed.
CCE depot location
Drop off point
The biomethane vehicle trial
Key point
Cenex 2012 128-1.2
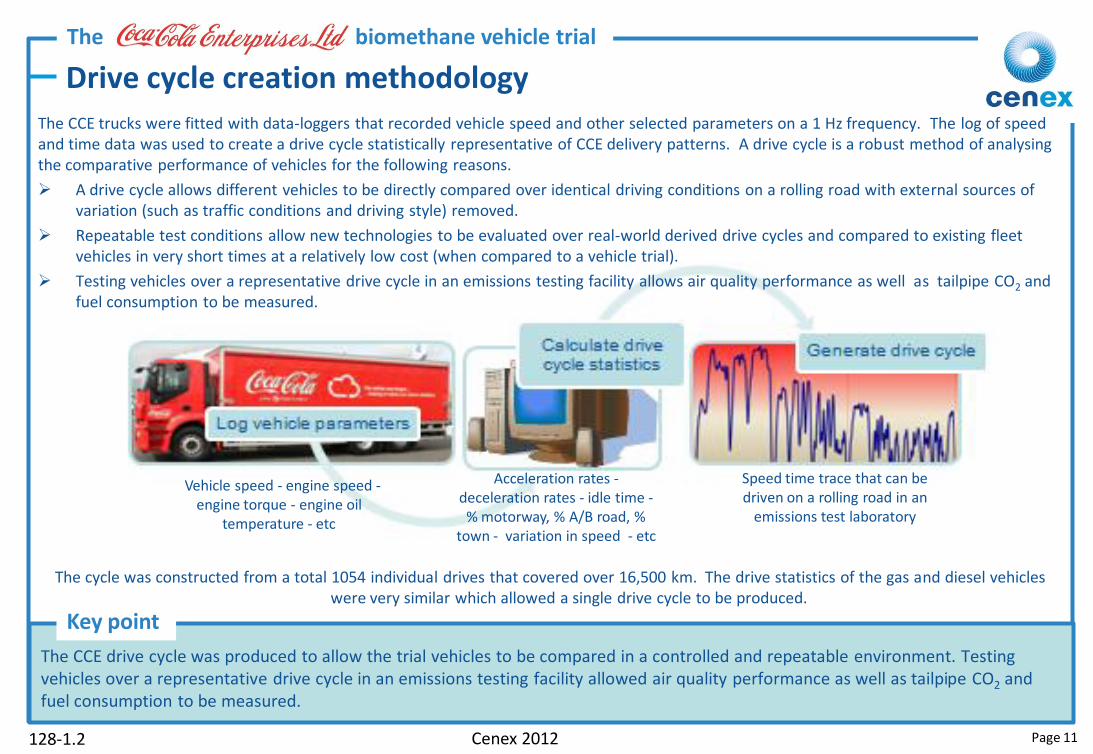
Drive cycle creation methodology The CCE trucks were fitted with data-loggers that recorded vehicle speed and other selected parameters on a 1 Hz frequency. The log of speed and time data was used to create a drive cycle statistically representative of CCE delivery patterns. A drive cycle is a robust method of analysing the comparative performance of vehicles for the following reasons.
A drive cycle allows different vehicles to be directly compared over identical driving conditions on a rolling road with external sources of variation (such as traffic conditions and driving style) removed.
Repeatable test conditions allow new technologies to be evaluated over real-world derived drive cycles and compared to existing fleet vehicles in very short times at a relatively low cost (when compared to a vehicle trial).
Testing vehicles over a representative drive cycle in an emissions testing facility allows air quality performance as well as tailpipe CO2 and fuel consumption to be measured.
Vehicle speed - engine speed -engine torque - engine oil
temperature - etc
Acceleration rates - deceleration rates - idle time -
% motorway, % A/B road, % town - variation in speed - etc
Speed time trace that can be driven on a rolling road in an
emissions test laboratory
The cycle was constructed from a total 1054 individual drives that covered over 16,500 km. The drive statistics of the gas and diesel vehicles were very similar which allowed a single drive cycle to be produced.
The CCE drive cycle was produced to allow the trial vehicles to be compared in a controlled and repeatable environment. Testing vehicles over a representative drive cycle in an emissions testing facility allowed air quality performance as well as tailpipe CO2 and fuel consumption to be measured.
Page 11

The biomethane vehicle trial
Key point
Cenex 2012 128-1.2
The CCE drive cycle
The CCE drive cycle is a 30 minute 19.5 km cycle that is statistically representative of vehicle distribution patterns from Enfield. The drive cycle was presented in three phases representing Motorway, A/B road and Town driving . Phasing allows vehicle performance under a certain driving duty to be assed. For example, if electric hybrids were tested over this cycle it would be advantageous if their performance in town and motorway driving conditions could be segregated from the resultant perfromance statistics.
A CCE drive cycle test procedure was produced that allowed repeatable vehicle preconditioning and testing to be accomplished. The CCE drive cycle was run with a 4000 kg vehicle payload, which was broadly representative of the average payload of deliveries from the Enfield depot where the real-world payload reduced in a linear fashion over the duration of the route. The commute to and return from the delivery area occurred with a full and empty payload respectively.
CCE drive cycle key stats Duration 30.8 minutes Distance 19.5 km Avg speed 37.6 kph Town driving 55 % A/B road driving 24 % Motorway driving 21 %
Tests were conducted a minimum of three times to allow variation to be assessed and a statistically valid result obtained.
The CCE drive cycle is a 30 minute 19.5 km cycle statistically representative of vehicle distribution patterns from Enfield. The drive cycle was presented in three phases representing Motorway, A/B road and Town driving.
Page 12
The biomethane vehicle trial
Key point
Cenex 2012 128-1.2
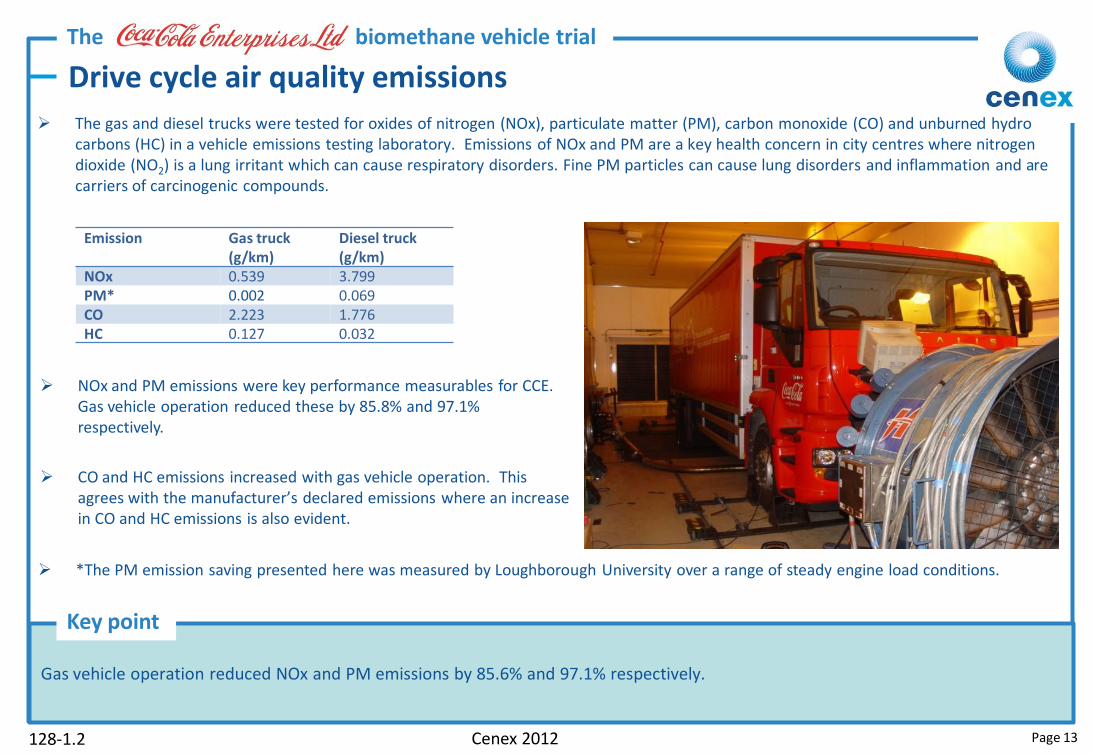
Drive cycle air quality emissions
NOx and PM emissions were key performance measurables for CCE. Gas vehicle operation reduced these by 85.8% and 97.1% respectively.
CO and HC emissions increased with gas vehicle operation. This agrees with the manufacturer’s declared emissions where an increase in CO and HC emissions is also evident.
Emission Gas truck (g/km)
Diesel truck (g/km)
NOx 0.539 3.799 PM* 0.002 0.069 CO 2.223 1.776 HC 0.127 0.032
The gas and diesel trucks were tested for oxides of nitrogen (NOx), particulate matter (PM), carbon monoxide (CO) and unburned hydro carbons (HC) in a vehicle emissions testing laboratory. Emissions of NOx and PM are a key health concern in city centres where nitrogen dioxide (NO2) is a lung irritant which can cause respiratory disorders. Fine PM particles can cause lung disorders and inflammation and are carriers of carcinogenic compounds.
*The PM emission saving presented here was measured by Loughborough University over a range of steady engine load conditions.
Gas vehicle operation reduced NOx and PM emissions by 85.6% and 97.1% respectively.
Page 13

The biomethane vehicle trial
Key point
Cenex 2012 128-1.2
Drive cycle fuel consumption, vehicle efficiency & range
The gas truck consumed 34.9 kg/100 km compared to the diesel truck that consumed 31.9 litres/100 km over the CCE drive cycle. This equated to a theoretical vehicle range of 357 km and 940 km for the gas and diesel trucks respectively. The gas truck held approximately 124 kg of gas (880 litres @ 200 bar) compared to the 300 litre fuel tank of the diesel vehicle.
Biomethane (~48 MJ/kg) has a higher energy content by mass when compared with diesel (~43 MJ/kg). However since the efficiency of a SI engine is lower than a CI ignition engine a reduction in vehicle efficiency is normal when converting a fleet from diesel to dedicated gas technology. Additionally on the trial vehicles the transmission changed from an automated manual in the diesel to a fully automatic unit in the gas which is also likely to have a negative effect on efficiency. The overall reduction in efficiency from the diesel to gas vehicle over the CCE drive cycle was 31.8%, with the diesel consuming 1139.6 MJ/100 km and the gas 1670.8 MJ/100 km.
Drive cycle segment Gas truck Diesel truck
Fuel consumption (Gas kg/100 km, Diesel litres/100 km)
Motorway 31.6 28.7
A/B Road 40.0 39.1
Town 37.0 31.8
Total 34.9 31.9
Energy consumption (MJ/100 km)
Motorway 1513.2 1022.9
A/B Road 1915.0 1395.9
Town 1772.3 1136.4
Total 1670.8 1139.6
The gas truck consumed 34.9 kg/100 km compared to the diesel truck that consumed 31.9 litres/100 km over the CCE drive cycle. This equated to a theoretical vehicle range of 357 km and 940 km for the gas and diesel trucks respectively. The overall reduction in fuel efficiency from the diesel to gas vehicle was 31.8%.
Page 14
The A/B drive cycle segment has the highest energy consumption. This is due to the high number of acceleration and deceleration events in this phase.

The biomethane vehicle trial
Key point
Cenex 2012 128-1.2
Introduction to vehicle CO2 emissions Well-to-wheel (WTW) emissions methodology was used to quantify the carbon footprint of the transport fuels. This assessed the carbon impact of the total energy chain used to produce and use the fuel and the source of the carbon embodied within the fuel i.e. whether it is from a fossil or renewable source. For the purpose of carbon accounting relevant to this project CO2 emissions are quantified using three formats as described below. WTW emissions – WTW greenhouse gas emissions consisted of well-to-tank (WTT) and tank-to-wheel (TTW) emissions segments. The WTT
portion quantified the emissions produced during the extraction, processing, delivery and dispensing of the fuel. Whilst the TTW portion quantified the CO2 emitted directly from a vehicle that was additional to normal atmospheric CO2 levels and hence contributed to global warming.
TTW emissions – TTW emissions were introduced above. These are a measure of the CO2 emitted directly from a fuel that is outwith the
natural carbon cycle and increases atmospheric CO2 levels. Hence for the combustion of a renewable fuel the direct TTW emissions are typically very close to zero. Under UK emissions reporting guidance, which is used by CCE, the direct TTW emissions only are the responsibility of the transport operator. Emissions associated with infrastructure electricity use and fuel supply would be reported by building control and the fuel supplier respectively.[2]
Tailpipe emissions – These represent the absolute amount of CO2 emitted directly from a vehicles exhaust pipe regardless of the fuels origin and sustainability. Manufacturers are legally bound to test and declare the tailpipe emissions of their vehicle over the regulated test cycle. However, tailpipe emissions are not relevant when assessing the CO2 performance of a renewable fuel.
WTW emissions quantify the total carbon footprint of a transport fuel. TTW emissions quantify the amount of unsustainable CO2 released directly from a vehicle and also represent the emissions declared by the CCE fleet under UK emissions reporting guidance. Tailpipe emissions are an absolute measure of CO2 emitted from a vehicles exhaust pipe regardless of the fuels origin.
Page 15

The biomethane vehicle trial
Key point
Cenex 2012 128-1.2
Well-to-tank CO2 emissions
WTT emissions were calculated for the trial refuelling setup and for a permanent gas station. These emitted 1.453 and 1.133 kg CO2/kg of biomethane respectively.
Extraction and processing emissions were calculated from the energy consumption of the Gasrec plant.
Delivery emissions were calculated by applying DEFRA emission factors[2] to actual delivery distances travelled.
Dispensing emissions represented the electricity consumption of the site refuelling infrastructure.
A significant dispensing emission reduction is evident from the permanent station due to a change from gas compressors to a more efficient liquid biomethane pump.
A marginal delivery emission saving is achieved from the permanent station scenario as the overall delivery mileage per kg of fuel reduced due to the increased quality of gas been delivered.
The processing emission of the fuel was high due to the energy required for gas liquefaction.
WTT emissions when using a trial gas station are often high and unrepresentative of WTT emissions using a permanent gas station. This is due to inherent inefficiencies in low volume gas supply chains. WTT emissions for the trial and permanent station scenarios were 1.453 and 1.133 kg CO2 / kg of biomethane respectively.
Gas station scenario emissions
Process Process description Emissions (KgCO2/kg
fuel)
Trial
station
Permanent
station
Extraction & Extracting and upgrading biogas to
biomethane. Liquefying the
biomethane.
1.064 1.064
Processing
Delivery Delivery of biomethane to Enfield 0.050 0.031
Dispensing Site compression and dispensing 0.321 0.037
Total 1.453 1.133
Page 16

The biomethane vehicle trial
Key point
Cenex 2012 128-1.2
Well-to-wheel CO2 emissions
The WTW emissions were calculated by adding the TTW emissions measured over the CCE drive cycle to the calculated WTT emissions.
Tailpipe CO2 produced from the combustion of biomethane does not contribute to the TTW emissions of the vehicle. However it was assumed that the small amount of unburned HC emitted from the gas vehicle during laboratory testing was CH4. These emissions have been added to the TTW figures on a CO2 equivalence basis (by applying a factor of 23). Therefore the gas vehicle emitted 0.003kg TTW CO2 / km when operated on biomethane.
The overall WTW savings achieved from biomethane operation were 50.3% and 60.7% for the trial and permanent station scenarios respectively.
The overall WTW savings achieved from biomethane operation were 50.3% and 60.7% for the trial and permanent station scenarios respectively.
Page 17

The biomethane vehicle trial
Key point
Cenex 2012 128-1.2
Drive cycle emissions summary
Tailpipe emissions increased by 8.7% when operating on biomethane due to the lower efficiency of the gas vehicle when compared with the diesel truck. However, the biomethane truck allowed a reduction of 99.6% in TTW CO2.
Coca-Cola Enterprises drive cycle emissions summary
Gas supply scenario
Fuel
co
nsu
mp
tio
n
(kg/
100
kmm
) Gas vehicle emissions
(kg CO2 / km)
Die
sel s
up
ply
Fuel
co
nsu
mp
tio
n
(lit
res
/100
km)
Diesel vehicle emissions (kg CO2 / km)
Emission reduction from diesel to gas (%)
Tailp
ipe
em
issi
on
TTW
em
issi
on
WTW
em
issi
on
Tailp
ipe
em
issi
on
TTW
em
issi
on
WTW
em
issi
on
Tailp
ipe
em
issi
on
TTW
em
issi
on
WTW
em
issi
on
Trial BM 34.9 0.916
0.003 0.504
UK
die
sel
31.9 0.843 0.843 1.013 -8.7% 99.6% 50.3%
Permanent BM 0.003 0.398 60.7%
Tailpipe emissions increased by 8.7% when operating on biomethane due to the lower efficiency of the gas vehicle when compared with the diesel. However, the biomethane truck allowed a reduction of 99.6% in TTW CO2.
Page 18

The biomethane vehicle trial
Key point
Cenex 2012 128-1.2
Real world fuel consumption and emissions The fuel consumption of the trucks was monitored for the duration of the 12 month trial, which commenced in June 2010. The fuel
consumption was weighted to represent the overall distribution route mix from Enfield. The gas vehicle consumed 33.6 kg/100 km and the diesel vehicle 34.5 litres/100km. This represented a variation of 3.7% and -8.1% from the fuel consumed during laboratory testing. This variation existed due to changes in payloads, driving style, ancillary power use, ambient and engine temperature conditions, gradients and composition of the fuel over the 12 month period. Whereas the laboratory emission testing was a back-to-back test of vehicle performance under identical conditions.
The real world emissions shown in the table below have been calculated by applying DEFRA emission factors for gas and diesel consumption to the real world fuel consumption recorded during the 12 month trial.
The gas vehicle consumed 33.6 kg/100 km and the diesel vehicle consumed 34.5 litres/100km during the 12 month vehicle trial. This represented a variation of 3.7% and -8.1% from the fuel consumed during laboratory testing respectively.
Real-world fuel consumption and emissions summary
Gas supply scenario
Fue
l co
nsu
mp
tio
n
(kg/
100k
mm
)
Gas vehicle emissions (kg CO2 / km)
Die
sel s
up
ply
Fuel
co
nsu
mp
tio
n
(lit
res
/100
km)
Diesel vehicle emissions (kg CO2 / km)
Emission reduction from diesel to gas (%)
Tailp
ipe
em
issi
on
TTW
em
issi
on
WTW
em
issi
on
Tailp
ipe
em
issi
on
TTW
em
issi
on
WTW
em
issi
on
Tailp
ipe
em
issi
on
TTW
em
issi
on
WTW
em
issi
on
Trial BM 33.6 0.911
0.002 0.483
UK
die
sel
34.5 0.888 0.888 1.703 -2.6 99.8% 54.9%
Permanent BM 0.002 0.382 64.4%
The WTW emission savings improved when looking at real world fuel consumption mainly due to the increased use of diesel.
Page 19

The biomethane vehicle trial
Key point
Cenex 2012 128-1.2
Reliability
CCE monitor breakdowns and unplanned vehicle off-road (VOR) days.
The diesel truck had no breakdowns or unplanned VOR days for the duration of the trial.
The gas truck had one breakdown and two VOR days. The truck broke down during November 2010 with a split engine coolant hose. The vehicle was fixed on the roadside and then resumed it’s delivery schedule. The two VOR days were as a result of emulsified oil within the engine breather system. The emulsification was noticed during a routine preventative maintenance inspection (PMI) and the vehicle was held for two days while new parts were ordered to prevent a repeat occurrence of the fault.
A one vehicle sample of each technology does not provide a statistically robust failure rate sample, however the severity and frequency of the failures were low which gave confidence in the reliability of the gas vehicle on trial.
The availability rate of the gas vehicle was 99.2% and the diesel vehicle was 100%.
The availability rate of the gas vehicle was 99.2% and the diesel vehicle was 100%.
Page 20

The biomethane vehicle trial
Key point
Cenex 2012 128-1.2
Driver feedback
Seven regular drivers provided feedback on the relative performance of the gas and diesel trucks. The performance indicators are shown in the radar chart below. Drivers rated the performance aspects on a scale of 1 to 5 denoting Not acceptable [1], Marginal [2], Acceptable [3], Good [4], and Excellent [5].
The overall performance of the gas vehicle scored 4.6 and was rated higher than the diesel that scored 4.1. However both vehicles received positive performance ratings of between good and excellent.
The gas truck was unanimously scored a 5 in all acceleration and refuelling categories where feedback comments implied that drivers i) preferred the gas truck’s fully automated transmission to the automated manual in the diesel, and ii) preferred refuelling the gas vehicle on site rather than refuelling with diesel on a public forecourt.
Drivers rated gas as a safer method of refuelling than diesel.
The largest variation in response and the lowest score for the gas vehicle was regarding the braking feel and response where some drivers thought the breaks and retarder were too keen.
On average the diesel and gas vehicles achieved the same ratings for noise performance. This agrees with internal cab noise monitored at Millbrook Proving Ground, which is report on in Page 22 of this document.
‘Excellent vehicle. Powerful, fast and always in gear’
‘It is ideal having refuelling station onsite’
‘ Both vehicles are quiet, both are safe to refuel’
‘Braking on the gas truck took some getting used to..’
‘There is a lack of space to put drinks on the dash’
‘Gas truck is excellent at pulling away because you are always in gear’
Drivers rated the overall performance of the gas vehicle higher than the diesel. However both vehicles received overall positive performance ratings of between good and excellent. Drivers were most impressed with the gas trucks acceleration, transmission and refuelling aspects
Page 21
The biomethane vehicle trial
Key point
Cenex 2012 128-1.2
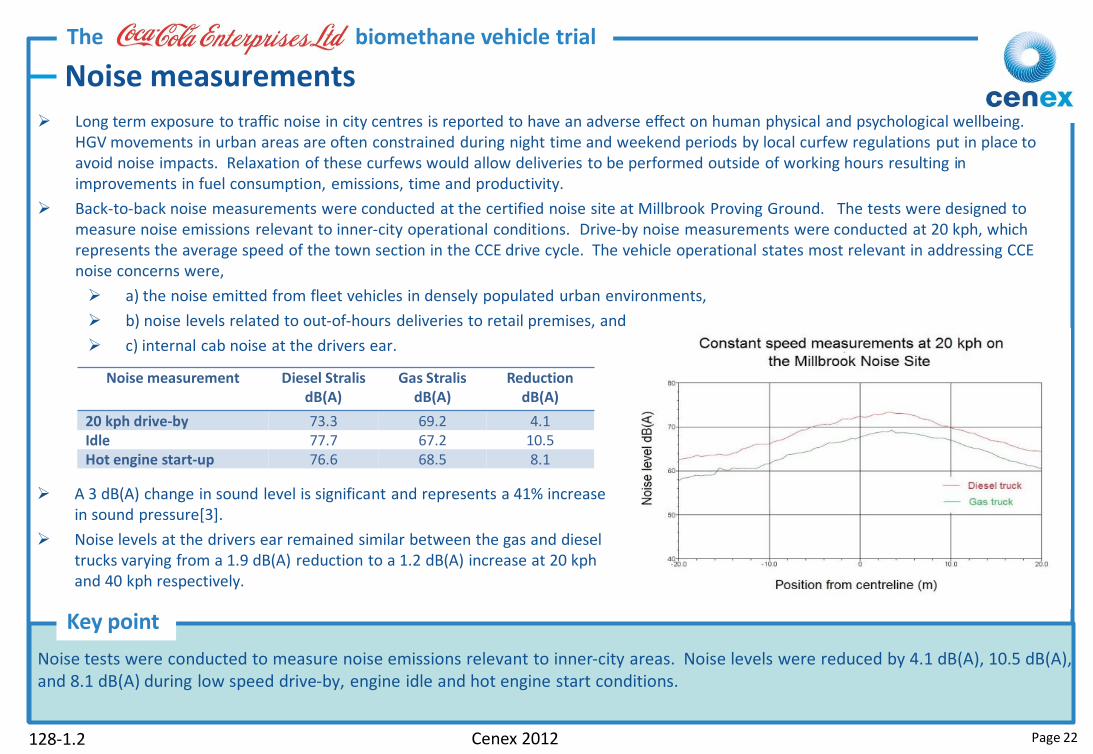
Noise measurements Long term exposure to traffic noise in city centres is reported to have an adverse effect on human physical and psychological wellbeing.
HGV movements in urban areas are often constrained during night time and weekend periods by local curfew regulations put in place to avoid noise impacts. Relaxation of these curfews would allow deliveries to be performed outside of working hours resulting in improvements in fuel consumption, emissions, time and productivity.
Back-to-back noise measurements were conducted at the certified noise site at Millbrook Proving Ground. The tests were designed to measure noise emissions relevant to inner-city operational conditions. Drive-by noise measurements were conducted at 20 kph, which represents the average speed of the town section in the CCE drive cycle. The vehicle operational states most relevant in addressing CCE noise concerns were,
a) the noise emitted from fleet vehicles in densely populated urban environments,
b) noise levels related to out-of-hours deliveries to retail premises, and
c) internal cab noise at the drivers ear.
Noise measurement Diesel Stralis
dB(A) Gas Stralis
dB(A) Reduction
dB(A)
20 kph drive-by 73.3 69.2 4.1 Idle 77.7 67.2 10.5 Hot engine start-up 76.6 68.5 8.1
Noise tests were conducted to measure noise emissions relevant to inner-city areas. Noise levels were reduced by 4.1 dB(A), 10.5 dB(A), and 8.1 dB(A) during low speed drive-by, engine idle and hot engine start conditions.
A 3 dB(A) change in sound level is significant and represents a 41% increase in sound pressure[3].
Noise levels at the drivers ear remained similar between the gas and diesel trucks varying from a 1.9 dB(A) reduction to a 1.2 dB(A) increase at 20 kph and 40 kph respectively.
Page 22

The biomethane vehicle trial
Key point
Cenex 2012 128-1.2
Fuel analysis In the absence of a European or UK biomethane standard, Iveco's key requirements from biomethane are that the fuel has a high
methane content (> 95%) and a low level of contaminants such as siloxanes, hydrogen sulphide (H2S) and moisture. Siloxanes and H2S are formed during the anaerobic digestion process and cause accelerated engine wear. Moisture in the fuel can damage the fuel delivery system and impede the lubrication properties of engine oil.
Gasrec are an Iveco approved supplier of biomethane vehicle fuel.
To test the quality of the fuel and integrity of the gas supply chain, the biomethane was tested at i) Gasrec’s upgrading facility in Albury, ii) at the low pressure storage tank at the Enfield and iii) at the high pressure dispenser at Enfield. The gas was tested by Ceram Laboratories[4].
Fuel analysis showed that H2S and siloxanes remained below the level of detection throughout the fuel supply chain processes. Moisture levels in the fuel were low at 3.8 mg/m3 which represented just 11.9% of the maximum allowable level under the Swedish biogas standard (SS 15 54 38). The methane content of the fuel reduced at each measurement point subsequent to the fuel supplier. Here it is assumed that some air contamination entered the fuel during the transportation or sampling processes.
The final fuel delivered into the vehicle exceeded the quality levels required.
Measurement Fuel processing facility
(Sample A)
Site low-pressure system (Sample
B)
Site high-pressure dispenser (Sample
C) Methane 97.8% 96.0% 95.4%
Carbon dioxide 0.0% 0.0% 0.0%
Nitrogen 1.8% 2.8% 3.4%
Oxygen 0.5% 1.2% 1.3%
Carbon monoxide 0% 0% 0% Hydrogen sulphide <10 PPM <10 PPM <10 PPM
Siloxanes <1 mg/m3 <1 mg/m3 <1 mg/m3
Moisture 3.8 mg/m3 Energy content (LHV) 49.0 MJ/kg 48.1 MJ/kg 47.8 MJ/kg
Fuel analysis showed that the biomethane maintained a high methane content and low levels of contamination when measured throughout the fuel supply chain. The final fuel delivered into the vehicle exceeded the quality levels required by the vehicle manufacturer.
Page 23

The biomethane vehicle trial
Key point
Cenex 2012 128-1.2
Oil analysis
Independent analysis was conducted on oil sampled from the Gas truck to identify contamination or oil degradation which may effect vehicle reliability. A virgin oil sample was tested in Jun-2010, with used oil samples being tested in Sept-2010 and Jan-2011. The results of these analyses are shown below and plotted against the maximum permissible level recommended for each substance[5]. The level of metals in the virgin oil sample was deducted from the used oil analysis results.
Water content (WC%) – Due to the high hydrogen to carbon ratio of methane, steam is formed during combustion which can condense within the exhaust and engine breather systems, especially during engine warm-up periods. The analyses did not detect water contamination in the oil.
Oil condition index (OCI) – This is a measure of the conductivity of engine oils and indicates concentrations of soot and other conducting materials present in the oil. The OCI of the sampled oil was low and typical of new oils and oils in good condition.
Contamination and wear metals - The levels of wear metals present in the oil were very low, especially in the context of a new engine. Copper and Boron were above recommended levels, however this was considered low risk for the following reasons.
Elevated levels of copper in the oil of new engines is a common occurrence due to the sulphation of copper cooling tubes which leach into the engine oil. The release of sulphides normally declines to low levels.
Boron is a common additive in both engine oil and engine coolant. If a coolant leak was present glycol would also have tested positive and the truck would consume coolant. Neither of these were apparent.
Oil analysis showed that the oil was in good condition. No water was detected within the oils and wear metals were within normal levels.
Page 24
The biomethane vehicle trial
Key point
Cenex 2012 128-1.2
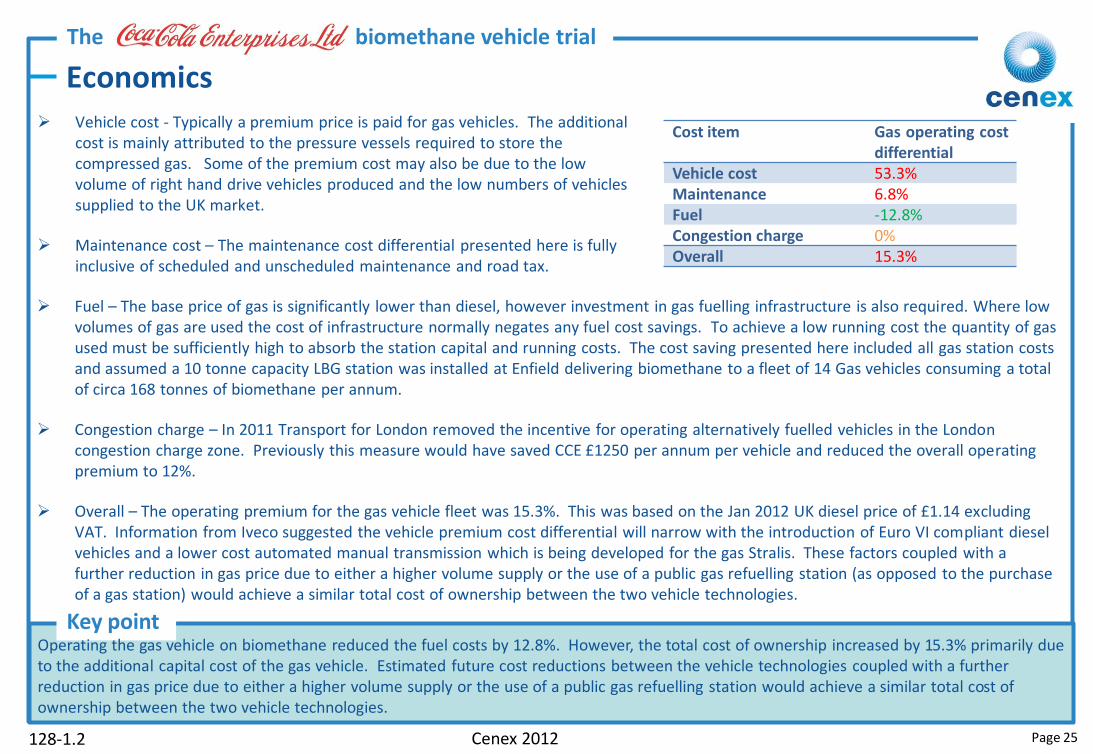
Economics Vehicle cost - Typically a premium price is paid for gas vehicles. The additional
cost is mainly attributed to the pressure vessels required to store the compressed gas. Some of the premium cost may also be due to the low volume of right hand drive vehicles produced and the low numbers of vehicles supplied to the UK market.
Maintenance cost – The maintenance cost differential presented here is fully inclusive of scheduled and unscheduled maintenance and road tax.
Fuel – The base price of gas is significantly lower than diesel, however investment in gas fuelling infrastructure is also required. Where low volumes of gas are used the cost of infrastructure normally negates any fuel cost savings. To achieve a low running cost the quantity of gas used must be sufficiently high to absorb the station capital and running costs. The cost saving presented here included all gas station costs and assumed a 10 tonne capacity LBG station was installed at Enfield delivering biomethane to a fleet of 14 Gas vehicles consuming a total of circa 168 tonnes of biomethane per annum.
Congestion charge – In 2011 Transport for London removed the incentive for operating alternatively fuelled vehicles in the London congestion charge zone. Previously this measure would have saved CCE £1250 per annum per vehicle and reduced the overall operating premium to 12%.
Overall – The operating premium for the gas vehicle fleet was 15.3%. This was based on the Jan 2012 UK diesel price of £1.14 excluding VAT. Information from Iveco suggested the vehicle premium cost differential will narrow with the introduction of Euro VI compliant diesel vehicles and a lower cost automated manual transmission which is being developed for the gas Stralis. These factors coupled with a further reduction in gas price due to either a higher volume supply or the use of a public gas refuelling station (as opposed to the purchase of a gas station) would achieve a similar total cost of ownership between the two vehicle technologies.
Cost item Gas operating cost differential
Vehicle cost 53.3% Maintenance 6.8% Fuel -12.8% Congestion charge 0% Overall 15.3%
Operating the gas vehicle on biomethane reduced the fuel costs by 12.8%. However, the total cost of ownership increased by 15.3% primarily due to the additional capital cost of the gas vehicle. Estimated future cost reductions between the vehicle technologies coupled with a further reduction in gas price due to either a higher volume supply or the use of a public gas refuelling station would achieve a similar total cost of ownership between the two vehicle technologies.
Page 25
The biomethane vehicle trial
Key point
Cenex 2012 128-1.2
Next steps
CCE invested in a fleet of 14 gas Iveco Stralis vehicles and a gas station which is due to be operational at the Enfield depot in June 2012. The CCE gas fleet will consume approximately 168 tonnes of BM saving over 300 tonnes of CO2, 1590 kgs of NOx and 33 kgs of PM emissions per annum.
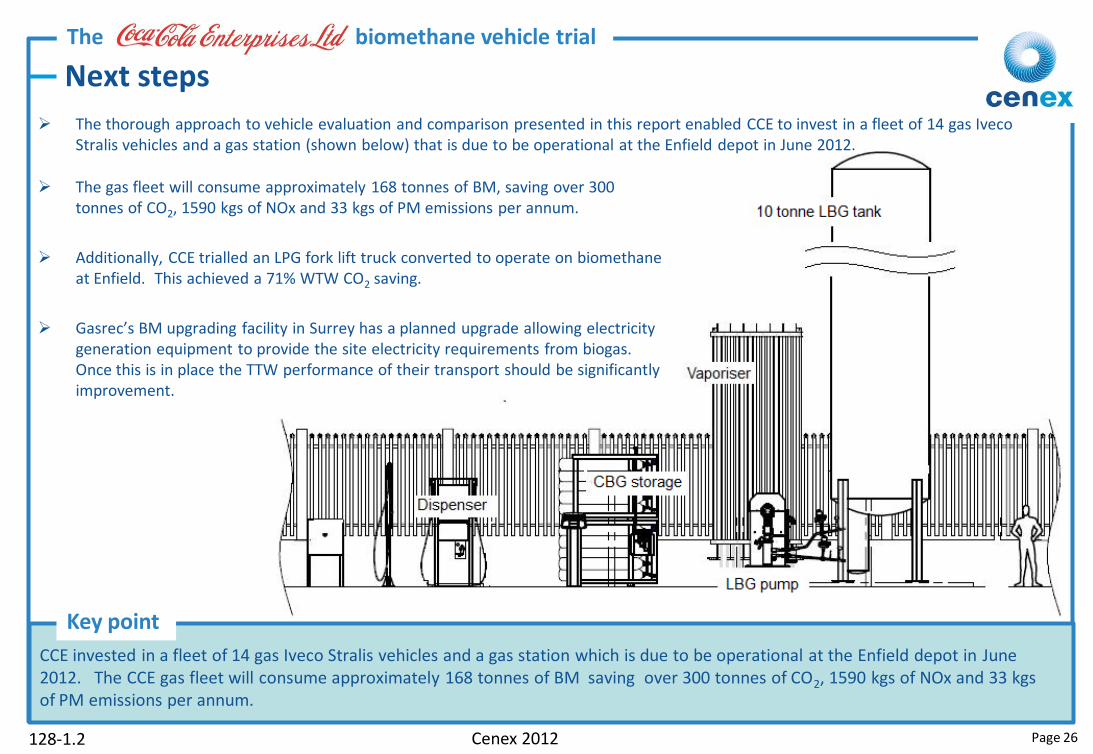
The thorough approach to vehicle evaluation and comparison presented in this report enabled CCE to invest in a fleet of 14 gas Iveco Stralis vehicles and a gas station (shown below) that is due to be operational at the Enfield depot in June 2012.
The gas fleet will consume approximately 168 tonnes of BM, saving over 300 tonnes of CO2, 1590 kgs of NOx and 33 kgs of PM emissions per annum.
Additionally, CCE trialled an LPG fork lift truck converted to operate on biomethane at Enfield. This achieved a 71% WTW CO2 saving.
Gasrec’s BM upgrading facility in Surrey has a planned upgrade allowing electricity generation equipment to provide the site electricity requirements from biogas. Once this is in place the TTW performance of their transport should be significantly improvement.
Page 26

The biomethane vehicle trial
Key point
Cenex 2012 128-1.2
Concluding statements
Page 27
This document presented a performance evaluation of two comparable Iveco Stralis vehicles that were operated on biomethane and diesel. The monitoring aspects of the trial reviewed Coca-Cola Enterprises requirements from a low carbon truck. The test methodology and results were independently designed and verified by Cenex, who also provided grant funding to support this project.
Cenex’s key motivation to provide funding was to present a thorough and robust evaluation of the technology to mark it’s introduction into the UK market. The aim of this report was to enable fleet operators and decision makers to understand the truck’s operational performance and gain the confidence to help reduce, or eliminate, the need for repeated technology comparisons across fleets, and hence reduce the time required to deploy greater numbers of gas commercial vehicles throughout the UK.
Challenges in terms of ownership cost still need to be overcome. The total cost of ownership varies dependent on a fleets’ duty cycle, gas usage levels and the vehicle technology used. For CCE, the cost of ownership was greater for the gas fleet. However a more favourable economic scenario can exist when factors such as the rising price of diesel fuel, higher gas consumption volumes, the introduction of local pollution charges and expected reductions in the cost differential between gas and diesel vehicles are considered.
This report showed the gas vehicle provided similar drive performance and reliability levels to incumbent diesel technologies in fleets. When operating on biomethane emissions of WTW CO2 were significantly reduced. Gas vehicle operation also reduced emissions of NOx, PM and noise.
This report showed the gas vehicle provided similar drive performance and reliability levels to incumbent diesel technologies in fleets. When operating on biomethane emissions of WTW CO2 were significantly reduced. Gas vehicle operation also reduced emissions of NOx, PM and noise.
The biomethane vehicle trial
Key point
Cenex 2012 128-1.2
Further information
Information and reports on the use of biomethane and other low carbon vehicle technologies and fuels are available for download from www.cenex.co.uk/resources, this information includes the following.
The biomethane toolkit – this is a guide to the production and use of biomethane as a road transport fuel. The toolkit contains ten topic sheets designed to enable fleets to evaluate their options and the implications of operating vehicles on biomethane.
The Camden and Leeds City Council biomethane trials – Cenex reports on the performance of an Iveco Daily van and a Mercedes Econic refuse collection vehicle operating on biomethane in Camden Borough and Leeds City Council fleets respectively.
The fleet carbon reduction guidance - this provides a step-by-step approach to assessing and evaluating low carbon vehicle options and running vehicle trials. The guidance introduces and provides technical descriptions of low carbon vehicle technologies and includes case study examples of deployments in fleets.
For further information on how Cenex can assist your organisation in the evaluation, analysis and deployment of low carbon vehicles and technologies please contact [email protected], +44 (0) 1509 635750.
For further information on Coca-Cola Enterprises Ltd, please call +44 (0) 1895 844 828
For further information on the Iveco range of gas vehicles please contact Nigel Emms, +44 (0) 1923 259 513
For further information Gasrec biomethane supply please contact Doug Leaf, [email protected], +44 (0) 7909673 529
Information and reports on the use of biomethane and other low carbon vehicle technologies and fuels are available for download from www.cenex.co.uk/resources
Page 28

The biomethane vehicle trial
Page 29 Cenex 2012 128-1.2
References and acknowledgements
References
[1] NGVA, http://www.ngvaeurope.eu, accessed February 2012
[2] Defra / DECC GHG Conversion Factors for Company Reporting 19/08/2011, accessed February 2012
[3] http://www.sengpielaudio.com/TableOfSoundPressureLevels.htm, accessed February 2012
[4] Moisture level measurements were taken by GCS (Gas Container Services)
[5] Camden biomethane trial report available from www.cenex.co.uk/resources, accessed February 2012
Lysanda, produce eco-log driving units to assist fleets to reduce fuel consumption. Lysanda contributed financially to the vehicle laboratory testing and validated their eco-log unit on the gas vehicle. The Lysanda product was not assessed as part of this project.
Acknowledgements
Cenex, Coca-Cola Enterprises, Iveco and Gasrec would like to thank the following organisations for their support and contributions during the performance monitoring of the CCE biomethane vehicle trial.

The biomethane vehicle trial
Page 30 Cenex 2012 128-1.2
Table of abbreviations
BM Biomethane CBG Compressed biogas CCE Coca-Cola Enterprises CH4 Methane CI Compression ignition CO Carbon monoxide CO2 Carbon dioxide (quoted on a CO2 equivalence basis) DECC Department for energy and climate change DEFRA Department for environment, food and rural affairs EEV Environmentally enhanced vehicle GVW Gross vehicle weight kWh Kilo watt hour LBG Liquefied biogas LPG Liquefied petroleum gas MJ Mega joules N2 Nitrogen NO2 Nitrogen dioxide NOx Oxides of nitrogen O2 Oxygen PM Particulate matter PMI Preventative maintenance inspection PS Horsepower SCR Selective catalytic reduction SI Spark ignition TTW Tank-to-wheel VOR Vehicle off-road WTT Well-to-tank WTW Well-to-wheel

CENEX
Holywell Park
Loughborough University
Ashby Road
Loughborough
LE11 3TU
www.cenex.co.uk
01509 635750
31