
Centre for the Greek · PDF fileFinal Project Report Spiros Papageorgiou University of...
40
Centre for the Greek Language Standardizing The Certificate of Attainment in Greek on the Common European Framework of Reference Final Project Report Spiros Papageorgiou University of Michigan Thessaloniki, Greece 2008
-
Upload
nguyenquynh -
Category
Documents
-
view
215 -
download
0
Transcript of Centre for the Greek · PDF fileFinal Project Report Spiros Papageorgiou University of...

Centre for the Greek Language
Standardizing
The Certificate of Attainment in Greek
on the Common European Framework
of Reference
Final Project Report
Spiros Papageorgiou
University of Michigan
Thessaloniki, Greece 2008
2
TABLE OF CONTENTS
1 INTRODUCTION 4
2 METHODOLOGY 5
2.1 Selection of judges 5
2.2 Location and duration of the meeting 5
2.3 Familiarization task 5
2.4 Standardization task 5
2.5 Internal validation 6
3 FAMILIARIZATION STAGE 7
4 STANDARDIZATION STAGE 11 4.1 Speaking Standardization task 11 4.2 Writing Standardization task 15 4.3 Reading Standardization task 19 4.4 Listening Standardization task 24 4.5 Estimating the CEFR level based on the judgments 28
5 INTERNAL VALIDATION 29
6 CONCLUSION 33
APPENDIX 1 35
APPENDIX 2 36
APPENDIX 3 37
APPENDIX 4 38
APPENDIX 5 39
APPENDIX 6 40
3
LIST OF TABLES
Table 3.1 Descriptive statistics for the speaking Familiarization task 7 Table 3.2 Descriptive statistics for the writing Familiarization task 8 Table 3.3 Descriptive statistics for the reading Familiarization task 9 Table 3.4 Descriptive statistics for the listening Familiarization task 9 Table 3.5 Correlation of median of judgments with the correct level 10 Table 4.1 Conversion of levels into numbers 11 Table 4.2 Descriptive statistics-speaking Level A Standardization task 12 Table 4.3 Descriptive statistics-speaking Level B Standardization task 13 Table 4.4 Descriptive statistics-speaking Level C Standardization task 14 Table 4.5 Descriptive statistics-speaking Level D Standardization task 15 Table 4.6 Descriptive statistics-writing Level A Standardization task 16 Table 4.7 Descriptive statistics-writing Level B Standardization task 17 Table 4.8 Descriptive statistics-writing Level C Standardization task 18 Table 4.9 Descriptive statistics-writing Level D Standardization task 19 Table 4.10 Descriptive statistics-Reading Level A Standardization task 20 Table 4.11 Descriptive statistics-Reading Level B Standardization task 21 Table 4.12 Descriptive statistics-Reading Level C Standardization task 22 Table 4.13 Descriptive statistics-Reading Level D Standardization task 23 Table 4.14 Spearman correlations between reading item difficulty and judgments 24 Table 4.15 Descriptive statistics-Listening Level A Standardization task 24 Table 4.16 Descriptive statistics-Listening Level B Standardization task 25 Table 4.17 Descriptive statistics-Listening Level C Standardization task 26 Table 4.18 Descriptive statistics-Listening Level D Standardization task 27 Table 4.19 Spearman correlations between reading item difficulty and judgments 27 Table 4.20 CEFR level for the productive skills 28 Table 4.21 CEFR level for reading (% of items correct for a borderline test taker) 29 Table 4.22 CEFR level for listening (% of items correct for a borderline test taker) 29 Table 5.1 Item difficulty and discrimination (point-biserial) for reading 31 Table 5.2 Item difficulty and discrimination (point-biserial) for listening 32

Introduction
4
1 Introduction
This report outlines a research project to standardize the Certificate of Attainment in Greek, offered by the Centre for the Greek Language
1 on the Common European Framework of
Reference – CEFR - (Council of Europe, 2001). Given that the CEFR is the most frequently-cited performance standard for levels of language proficiency, it was important to examine what test takers’ scores mean in relation to the CEFR. The methodology to examine the relationship of the Certificate scores to the CEFR was primarily based on the procedure recommended by the Council of Europe’s (2003) Manual and the relevant standard-setting literature (Cizek, 2001; Cizek & Bunch, 2007; Kaftandjieva, 2004). The linking process set out in the Manual comprises a set of activities which are primary based on human judgments, described in Appendix 1 (for a discussion of these stages see Figueras et al., 2005 ; North, 2004). First, a panel of judges needs to be recruited and trained in using the CEFR to achieve adequate familiarisation with its content (Familiarization stage). One of these Familiarization tasks suggested in the Manual involves asking judges to place descriptors at the six CEFR levels, without providing any prior information as to the level of the descriptors. Then a group discussion follows in which, after the correct level is revealed, coordinators ensure that the judges have understood the important differences between consequent CEFR levels. After training, the judges are required to analyse test content (Specification stage) and examinee performance and set cut-off scores (Standardization stage) in relation to the CEFR. The Standardization stage draws from the educational measurement literature, in particular research in setting performance standards and cut-off scores (e.g. Cizek, 2001; Cizek & Bunch, 2007), which is further discussed in the Reference Supplement to the Manual by Kaftandjieva (2004). Finally the Manual includes a chapter entitled ‘Empirical Validation’, introducing two categories of empirical validation: internal validation, aiming at establishing the quality of the test on its own right, and external validation, aiming at a confirmation of the linking claim by either using an anchor test properly calibrated to the CEFR or by using judgments of teachers familiar with the CEFR. The research project focussed on the Familiarization and Standardization stages and some internal validation analysis was also conducted. The Specification stage was not conducted at this point because the test specifications (Αναλυτικό εξεταστικό πρόγραμμα’) are based on Council of Europe documents such as ‘Threshold 1990’ (Van Ek & Trim, 1998) and the CEFR itself; this provided a good basis as to the relevance of the content of the 4 levels (Levels A, B, C and D) of the Certificate to the CEFR. It should also be pointed out that it was not possible to conduct the external validation stage as described in the Manual (through comparison with performance on another test or with judgments by teachers). These are stages of the linking process that can be addressed in future research studies. The report first discusses the methodology of the project (Section 2), the Familiarization stage (Section 3) and the Standardization stage in (Section 4). The internal validation analysis is presented in Section 5.
1 http://www.greeklanguage.gr/
Methodology
5
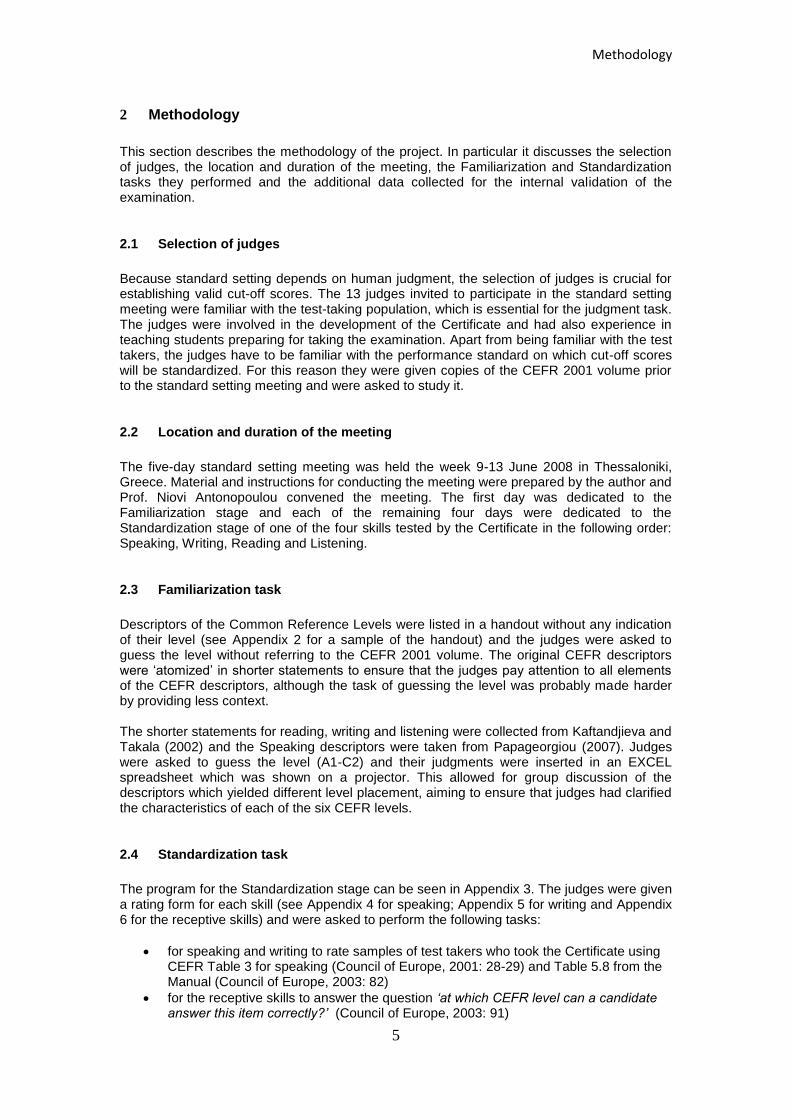
2 Methodology
This section describes the methodology of the project. In particular it discusses the selection of judges, the location and duration of the meeting, the Familiarization and Standardization tasks they performed and the additional data collected for the internal validation of the examination.
2.1 Selection of judges
Because standard setting depends on human judgment, the selection of judges is crucial for establishing valid cut-off scores. The 13 judges invited to participate in the standard setting meeting were familiar with the test-taking population, which is essential for the judgment task. The judges were involved in the development of the Certificate and had also experience in teaching students preparing for taking the examination. Apart from being familiar with the test takers, the judges have to be familiar with the performance standard on which cut-off scores will be standardized. For this reason they were given copies of the CEFR 2001 volume prior to the standard setting meeting and were asked to study it.
2.2 Location and duration of the meeting
The five-day standard setting meeting was held the week 9-13 June 2008 in Thessaloniki, Greece. Material and instructions for conducting the meeting were prepared by the author and Prof. Niovi Antonopoulou convened the meeting. The first day was dedicated to the Familiarization stage and each of the remaining four days were dedicated to the Standardization stage of one of the four skills tested by the Certificate in the following order: Speaking, Writing, Reading and Listening.
2.3 Familiarization task
Descriptors of the Common Reference Levels were listed in a handout without any indication of their level (see Appendix 2 for a sample of the handout) and the judges were asked to guess the level without referring to the CEFR 2001 volume. The original CEFR descriptors were ‘atomized’ in shorter statements to ensure that the judges pay attention to all elements of the CEFR descriptors, although the task of guessing the level was probably made harder by providing less context. The shorter statements for reading, writing and listening were collected from Kaftandjieva and Takala (2002) and the Speaking descriptors were taken from Papageorgiou (2007). Judges were asked to guess the level (A1-C2) and their judgments were inserted in an EXCEL spreadsheet which was shown on a projector. This allowed for group discussion of the descriptors which yielded different level placement, aiming to ensure that judges had clarified the characteristics of each of the six CEFR levels.
2.4 Standardization task
The program for the Standardization stage can be seen in Appendix 3. The judges were given a rating form for each skill (see Appendix 4 for speaking; Appendix 5 for writing and Appendix 6 for the receptive skills) and were asked to perform the following tasks:
for speaking and writing to rate samples of test takers who took the Certificate using CEFR Table 3 for speaking (Council of Europe, 2001: 28-29) and Table 5.8 from the Manual (Council of Europe, 2003: 82)
for the receptive skills to answer the question ‘at which CEFR level can a candidate answer this item correctly?’ (Council of Europe, 2003: 91)
6
All judgments were inserted into EXCEL spreadsheets and were visible on a projector to allow for discussions about the assigned levels. The items and performances came from the May 2007 administration.
2.5 Internal validation
Item analysis was conducted for the reading and writing sections, as it was important to compare item difficulty with the judgments for the level of these items. Examining the reliability of the test is also related to the number of cut-off scores that can be established (see Kaftandjieva, 2004). The results of the item analysis were provided to the test convenor for discussion of item difficulty with the judges when they were performing the Standardization task for the receptive skills. It was not possible to conduct any analysis for the productive skills. This can be the aim of a future research project as it may also provide some validity evidence for the judgment task for the productive skills in this project.

Familiarization
7
3 Familiarization stage
The descriptive statistics (Table 3.1-Table 3.4) summarize the judges’ level placement of the descriptors. Descriptors that resulted in a range of more than two levels are highlighted. The meeting convenor emphasized the differences in level assignment and asked judges to pay attention to these descriptors, because such differences indicated that some judges did not share a common understanding of the CEFR levels.
Table 3.1 Descriptive statistics for the speaking Familiarization task
Descriptor Mean Min Max Median Mode CEFR
S1 5.92 5 6 6 6 6
S2 2.38 1 4 2 2 3
S3 1 1 1 1 1 1
S4 1.69 1 2 2 2 2
S5 4.23 3 5 4 5 5
S6 4.38 3 6 4 5 4
S7 4.38 4 5 4 4 4
S8 3.15 2 4 3 3 3
S9 4.92 4 6 5 5 5
S10 4.46 3 6 4 4 6
S11 2.31 1 3 2 2 2
S12 1.46 1 3 1 1 1
S13 1.54 1 3 1 1 1
S14 3.54 3 4 4 4 4
S15 4.46 3 6 4 4 5
S16 4.77 4 6 5 5 6
S17 2.54 1 4 3 3 2
S18 3.85 3 5 4 4 3
S19 2.38 1 3 3 3 3
S20 1.46 1 2 1 1 1
S21 3.92 3 5 4 4 4
S22 2.54 1 4 3 3 2
S23 5.77 5 6 6 6 6
S24 5.08 4 6 5 5 5
S25 4.85 4 6 5 5 5
S26 3 2 4 3 3 3
S27 3.77 3 5 4 4 3
S28 5.15 4 6 5 5 6
S29 1.85 1 4 2 1 2
S30 2.15 1 3 2 2 1

Familiarization
8
Table 3.2 Descriptive statistics for the writing Familiarization task
Descriptor Mean Min Max Median Mode CEFR
W1 5.23 4 6 5 5 6
W2 4.31 3 5 4 4 5
W3 5.92 5 6 6 6 6
W4 1.85 1 2 2 2 2
W5 3.38 3 4 3 3 4
W6 1.23 1 2 1 1 2
W7 4.15 4 5 4 4 4
W8 3.15 2 4 3 3 4
W9 4.62 2 6 5 4 6
W10 5.62 5 6 6 6 6
W11 3 2 5 3 3 3
W12 2.46 2 3 2 2 3
W13 5.15 4 6 5 5 5
W14 4.31 3 5 4 4 6
W15 2.77 2 3 3 3 3
W16 2.15 2 3 2 2 3
W17 3.54 3 4 4 4 5
W18 5.08 4 6 5 5 6
W19 1.38 1 4 1 1 2
W20 4.92 3 6 5 5 5
W21 5.08 3 6 5 5 5
W22 4.31 4 6 4 4 4
W23 4.62 3 6 5 4 6
W24 1.46 1 2 1 1 1
W25 1.15 1 2 1 1 1

Familiarization
9
Table 3.3 Descriptive statistics for the reading Familiarization task
Descriptor Mean Min Max Median Mode CEFR
R1 5.62 5 6 6 6 5
R2 4.38 4 5 4 4 4
R3 6 6 6 6 6 6
R4 1.54 1 2 2 2 1
R5 3.15 2 4 3 3 3
R6 1 1 1 1 1 1
R7 2.69 2 3 3 3 3
R8 3.08 2 4 3 3 3
R9 4.54 4 5 5 5 5
R10 5.62 5 6 6 6 5
R11 2.46 2 3 2 2 3
R12 2.15 1 3 2 2 2
R13 4.46 4 5 4 4 4
R14 5.92 5 6 6 6 5
R15 2 2 2 2 2 2
R16 1.23 1 2 1 1 2
R17 2.85 2 4 3 3 3
R18 5.15 4 6 5 6 5
R19 1.23 1 4 1 1 1
R20 5.54 5 6 6 6 4
Table 3.4 Descriptive statistics for the listening Familiarization task
Descriptor Mean Min Max Median Mode CEFR
L1 6 6 6 6 6 6
L2 4.31 4 5 4 4 4
L3 1 1 1 1 1 1
L4 1.92 1 3 2 2 1
L5 3.15 3 4 3 3 3
L6 1.23 1 2 1 1 1
L7 3.46 2 4 4 4 4
L8 4.46 4 5 4 4 4
L9 5.31 4 6 5 5 5
L10 4.77 4 5 5 5 5
L11 2.85 2 3 3 3 3
L12 1.38 1 2 1 1 2
L13 4.62 4 6 5 4 4
L14 5.31 4 6 5 5 5
L15 2.15 2 3 2 2 2
L16 2 1 3 2 2 2
L17 4.46 4 5 4 4 4
L18 4.62 4 5 5 5 5
L19 4.38 3 6 4 4 4

Familiarization
10
Spearman correlations between the median of the judgments and the correct level are presented in Table 3.5. The median was chosen among the remaining statistics as it is not affected by extreme ratings (cf. Bachman, 2004: 62) and therefore provides a better summary of the judges’ collective understanding of the levels. Such use of the median can also be seen in CEFR studies such as Alderson (2005) and Kaftandjieva and Takala (2002). The correlations in Table 3.5 are high, indicating that the group was in general successful in understanding the progression of ability from level to level.
Table 3.5 Correlation of median of judgments with the correct level
Speaking Writing Reading Listening
Spearman .927 .923 .938 .963
The descriptive statistics of the judgments presented above (Table 3.1 to Table 3.4) probably indicated some problems with judging adjacent levels (e.g. placing a descriptor at C1 instead of B2), which is why the convenor attempted to explain these differences during the group discussions. When the judges expressed confidence in their understanding of the levels, the meeting continued with the Standardization stage.

Internal Validation
11
4 Standardization stage
Judgments during the Standardization stage are presented here in 4 sections, each corresponding to one skill. The sections are presented in chronological order, starting with speaking, which was conducted on the first day. The judges were asked to perform their task using a numeric scale, with each number corresponding to a specific level (Table 4.1). Even numbers were used when the judges felt that a performance was between two levels, fulfilling the requirements for the level below and maybe being slightly above this level, but clearly not reaching the level above. For example, a rating of 4 would indicate a strong performance at A2 level, but not enough to be assigned to B1.
Table 4.1 Conversion of levels into numbers
LEVEL NUMBER
A1 1
A1/A2 2
A2 3
A2/B1 4
B1 5
B1/B2 6
B2 7
B2/C1 8
C1 9
C1/C2 10
C2 11
4.1 Speaking Standardization task
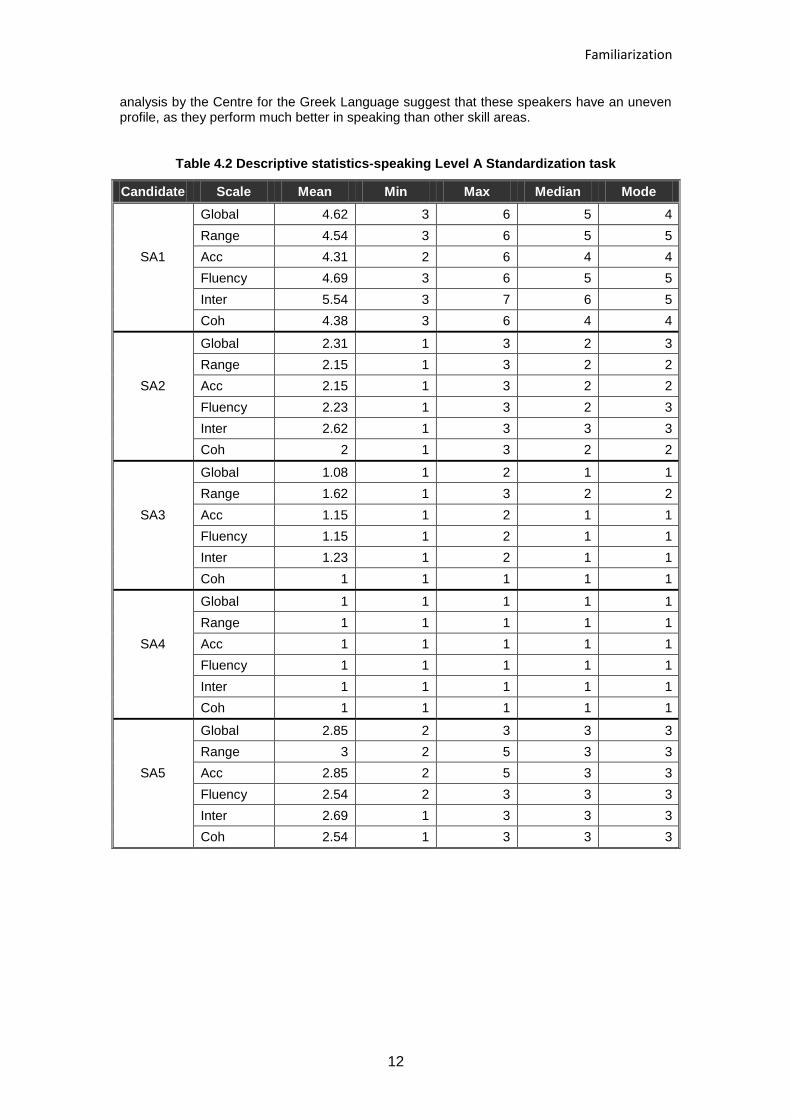
Audio performances of five test takers were judged for each one of the four levels of the Certificate. The first column of the tables in this section refers to test takers using an ID code. The first letter of the ID code corresponds to the skill and the second to the level of the Certificate. This convention is used for all speaking and writing samples. Column 2 lists the categories of CEFR Table 3 for speaking (Council of Europe, 2001: 28-29), which the judges used as their criteria to rate performances. The remaining columns present descriptive statistics of the judgments. Unfortunately, it was not possible at the time of writing this report to compare the judgments to the ratings given by the examiners who interviewed the test takers. This can be done in a future study to better interpret the results of the Standardization stage. In general, the statistics show that there is progression of ability from lower Certificate levels to higher ones in terms of CEFR level. However, top performers of one level were sometimes judged as performing at a higher CEFR level than lower performers of the next Certificate level. For example, the mean of judgments for all categories for test taker SC3 (Table 4.4), who sat Level C were higher the judgment for SD2 (Table 4.5) who sat Level D. If SD2 failed the exam, this would not probably be very surprising. However, if SD2 passed, then this could suggest that the cut-score between Levels C and D is not very clear. There is, nevertheless, another possible explanation for observing high oral performances, which relates to the test taking population. The Certificate is regularly taken by test takers of Greek origin, born outside Greece, who are highly proficient speakers of Greek. On-going
Familiarization
12
analysis by the Centre for the Greek Language suggest that these speakers have an uneven profile, as they perform much better in speaking than other skill areas.
Table 4.2 Descriptive statistics-speaking Level A Standardization task
Candidate Scale Mean Min Max Median Mode
Global 4.62 3 6 5 4
Range 4.54 3 6 5 5
SA1 Acc 4.31 2 6 4 4
Fluency 4.69 3 6 5 5
Inter 5.54 3 7 6 5
Coh 4.38 3 6 4 4
Global 2.31 1 3 2 3
Range 2.15 1 3 2 2
SA2 Acc 2.15 1 3 2 2
Fluency 2.23 1 3 2 3
Inter 2.62 1 3 3 3
Coh 2 1 3 2 2
Global 1.08 1 2 1 1
Range 1.62 1 3 2 2
SA3 Acc 1.15 1 2 1 1
Fluency 1.15 1 2 1 1
Inter 1.23 1 2 1 1
Coh 1 1 1 1 1
Global 1 1 1 1 1
Range 1 1 1 1 1
SA4 Acc 1 1 1 1 1
Fluency 1 1 1 1 1
Inter 1 1 1 1 1
Coh 1 1 1 1 1
Global 2.85 2 3 3 3
Range 3 2 5 3 3
SA5 Acc 2.85 2 5 3 3
Fluency 2.54 2 3 3 3
Inter 2.69 1 3 3 3
Coh 2.54 1 3 3 3

Familiarization
13
Table 4.3 Descriptive statistics-speaking Level B Standardization task
Candidate Scale Mean Min Max Median Mode
Global 5 5 5 5 5
Range 5.08 5 6 5 5
SB1 Acc 4.54 4 7 4 4
Fluency 5.15 5 6 5 5
Inter 5.15 5 6 5 5
Coh 5.08 5 6 5 5
Global 5.46 5 6 5 5
Range 5.46 5 6 5 5
SB2 Acc 5.38 5 7 5 5
Fluency 5.92 5 7 6 6
Inter 5.85 5 6 6 6
Coh 5.54 5 7 5 5
Global 4.31 4 5 4 4
Range 4.62 4 5 5 5
SB3 Acc 3.85 3 5 4 4
Fluency 3.85 3 5 4 4
Inter 4.23 3 5 4 4
Coh 3.92 3 6 4 4
Global 6.15 5 7 6 7
Range 5.62 5 7 6 6
SB4 Acc 6 5 7 6 6
Fluency 6.31 5 7 6 6
Inter 6 5 7 6 6
Coh 6 5 7 6 6
Global 4.54 2 5 5 5
Range 4.54 4 5 5 5
SB5 Acc 4.31 4 5 4 4
Fluency 4.54 4 5 5 5
Inter 4.38 3 5 4 5
Coh 4.46 3 5 5 5

Familiarization
14
Table 4.4 Descriptive statistics-speaking Level C Standardization task
Candidate Scale Mean Min Max Median Mode
Global 6.69 6 7 7 7
Range 6.62 5 7 7 7
SC1 Acc 7.15 6 8 7 7
Fluency 6.92 6 8 7 7
Inter 6.69 6 8 7 7
Coh 6.54 5 7 7 7
Global 8 7 9 8 8
Range 8.15 7 9 9 9
SC2 Acc 7.77 7 9 8 8
Fluency 8.62 7 11 9 9
Inter 8.08 7 9 8 9
Coh 7.85 7 9 8 8
Global 7.46 7 8 7 7
Range 7.54 7 9 7 7
SC3 Acc 7.23 7 8 7 7
Fluency 7.31 6 8 7 7
Inter 7.46 6 8 8 8
Coh 7.46 6 9 7 7
Global 6.38 5 7 7 7
Range 6.15 5 8 6 6
SC4 Acc 5.85 5 7 6 6
Fluency 6.23 5 8 6 6
Inter 6.85 5 8 7 7
Coh 6.23 5 7 6 6
Global 7.46 7 8 7 7
Range 7.23 7 8 7 7
SC5 Acc 7 7 7 7 7
Fluency 8.08 8 9 8 8
Inter 8.23 8 9 8 8
Coh 7.38 7 9 7 7

Familiarization
15
Table 4.5 Descriptive statistics-speaking Level D Standardization task
Candidate Scale Mean Min Max Median Mode
Global 7.77 7 9 8 8
Range 8.15 7 9 8 8
SD1 Acc 7.08 6 8 7 7
Fluency 7.38 6 9 7 7
Inter 7.46 6 9 7 7
Coh 7.46 7 9 7 7
Global 7.15 5 9 7 7
Range 7.08 6 9 7 7
SD2 Acc 6.85 6 7 7 7
Fluency 6.69 5 8 7 7
Inter 6.54 5 8 7 7
Coh 6.62 5 8 7 7
Global 9.69 9 11 10 10
Range 9.85 9 11 10 10
SD3 Acc 9.92 9 11 10 9
Fluency 10.4 9 11 10 10
Inter 9.46 8 10 10 10
Coh 9.85 9 11 10 10
Global 8.92 8 9 9 9
Range 9.08 8 11 9 9
SD4 Acc 9 8 10 9 9
Fluency 9.15 8 11 9 9
Inter 9 8 10 9 9
Coh 9.08 8 11 9 9
Global 8.5 8 9 8.5 9
Range 8.17 8 9 8 8
SD5 Acc 8.83 8 9 9 9
Fluency 8.58 8 9 9 9
Inter 8.17 7 9 8 8
Coh 8.5 8 9 8.5 8
4.2 Writing Standardization task
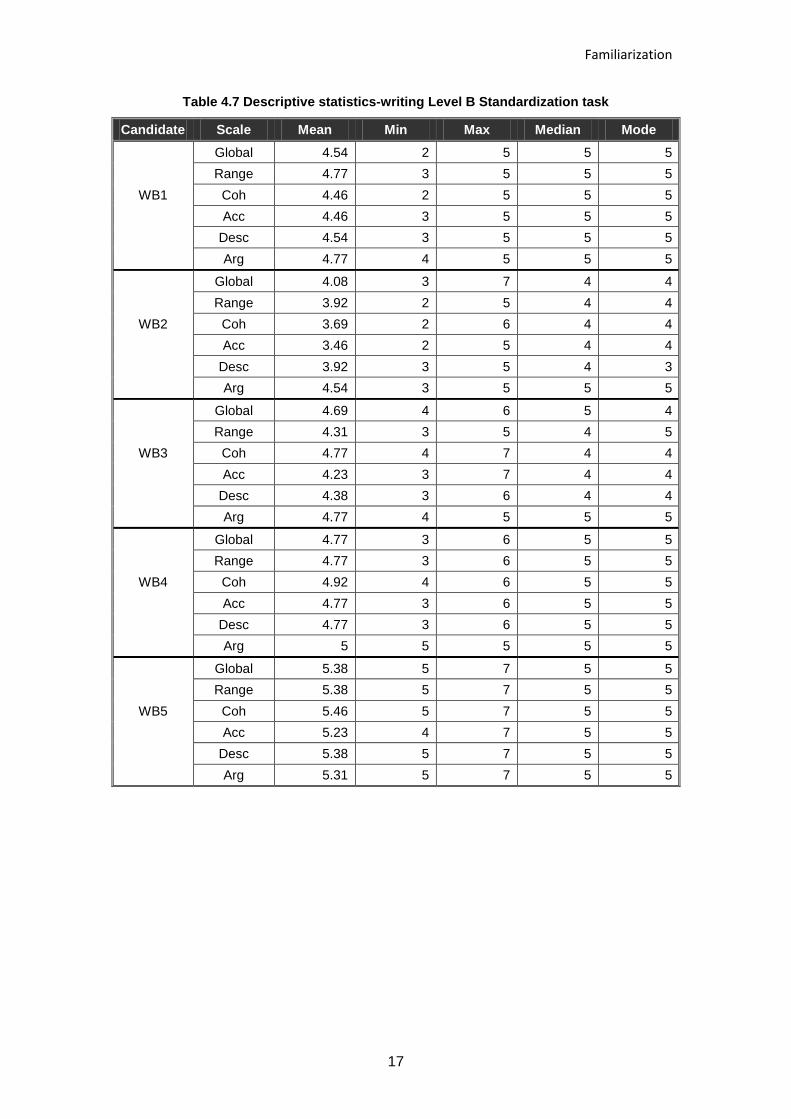
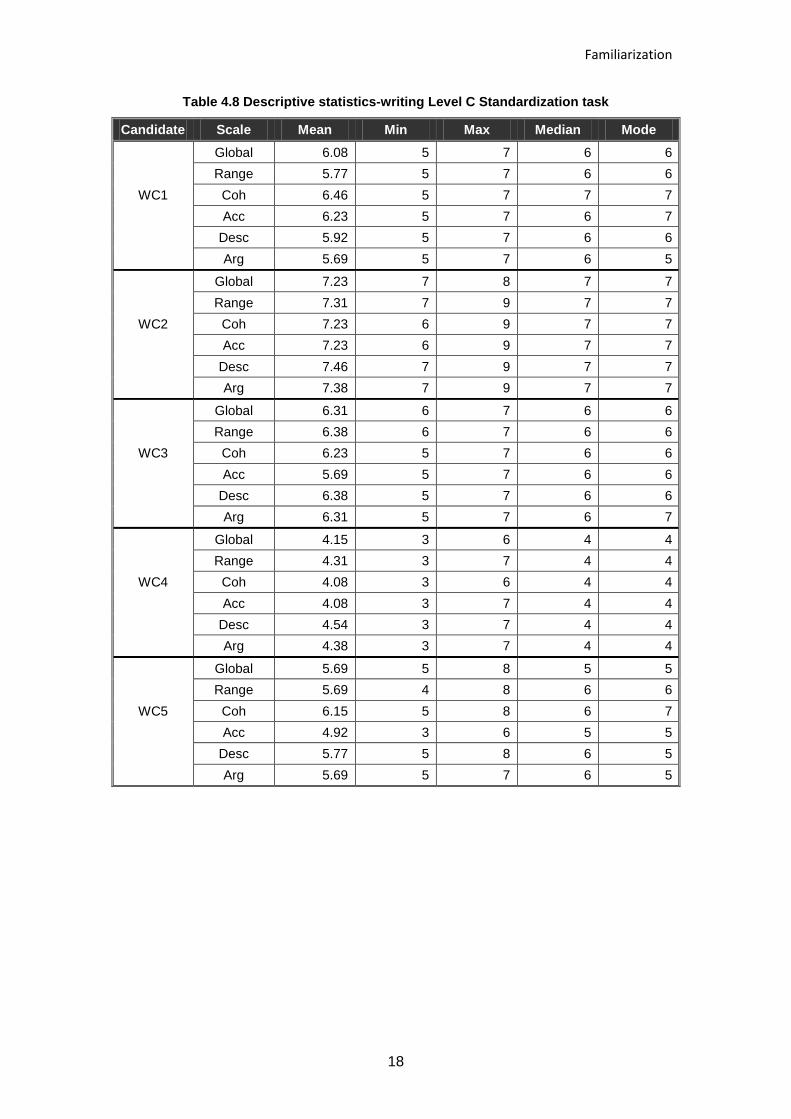
A similar analysis to the one for speaking is presented here for writing. The criteria for judging the written samples were taken from Table 5.8 from the Manual (Council of Europe, 2003: 82). Like with the speaking judgments, overlap of top performers of a lower level and lower performers of the next higher level is evidenced. However, because details of the examiners’ scores could not be collected, it is difficult to interpret this finding, as it has already been mentioned in Section 4.1.

Familiarization
16
Table 4.6 Descriptive statistics-writing Level A Standardization task
Candidate Scale Mean Min Max Median Mode
Global 2.69 2 3 3 3
Range 2.62 1 3 3 3
WA1 Coh 2 1 3 2 2
Acc 2.23 1 3 2 2
Desc 2.38 1 3 3 3
Arg N/A N/A N/A N/A N/A
Global 4.38 3 5 4 4
Range 4.54 3 5 5 5
WA2 Coh 4.69 4 5 5 5
Acc 3.54 2 5 4 4
Desc 4.15 1 5 5 5
Arg 4.11 4 5 4 4
Global 1 1 1 1 1
Range 1 1 1 1 1
WA3 Coh 1 1 1 1 1
Acc 1 1 1 1 1
Desc 1 1 1 1 1
Arg N/A N/A N/A N/A N/A
Global 2.92 2 4 3 3
Range 2.92 2 4 3 3
WA4 Coh 2 1 4 2 1
Acc 2.38 1 3 2 2
Desc 2.77 2 5 3 3
Arg 2.92 2 4 3 3
Global 4.69 4 5 5 5
Range 4.69 4 5 5 5
WA5 Coh 4.85 4 5 5 5
Acc 4.23 3 5 4 4
Desc 4.54 4 5 5 5
Arg 4.67 4 5 5 5
Familiarization
17
Table 4.7 Descriptive statistics-writing Level B Standardization task
Candidate Scale Mean Min Max Median Mode
Global 4.54 2 5 5 5
Range 4.77 3 5 5 5
WB1 Coh 4.46 2 5 5 5
Acc 4.46 3 5 5 5
Desc 4.54 3 5 5 5
Arg 4.77 4 5 5 5
Global 4.08 3 7 4 4
Range 3.92 2 5 4 4
WB2 Coh 3.69 2 6 4 4
Acc 3.46 2 5 4 4
Desc 3.92 3 5 4 3
Arg 4.54 3 5 5 5
Global 4.69 4 6 5 4
Range 4.31 3 5 4 5
WB3 Coh 4.77 4 7 4 4
Acc 4.23 3 7 4 4
Desc 4.38 3 6 4 4
Arg 4.77 4 5 5 5
Global 4.77 3 6 5 5
Range 4.77 3 6 5 5
WB4 Coh 4.92 4 6 5 5
Acc 4.77 3 6 5 5
Desc 4.77 3 6 5 5
Arg 5 5 5 5 5
Global 5.38 5 7 5 5
Range 5.38 5 7 5 5
WB5 Coh 5.46 5 7 5 5
Acc 5.23 4 7 5 5
Desc 5.38 5 7 5 5
Arg 5.31 5 7 5 5
Familiarization
18
Table 4.8 Descriptive statistics-writing Level C Standardization task
Candidate Scale Mean Min Max Median Mode
Global 6.08 5 7 6 6
Range 5.77 5 7 6 6
WC1 Coh 6.46 5 7 7 7
Acc 6.23 5 7 6 7
Desc 5.92 5 7 6 6
Arg 5.69 5 7 6 5
Global 7.23 7 8 7 7
Range 7.31 7 9 7 7
WC2 Coh 7.23 6 9 7 7
Acc 7.23 6 9 7 7
Desc 7.46 7 9 7 7
Arg 7.38 7 9 7 7
Global 6.31 6 7 6 6
Range 6.38 6 7 6 6
WC3 Coh 6.23 5 7 6 6
Acc 5.69 5 7 6 6
Desc 6.38 5 7 6 6
Arg 6.31 5 7 6 7
Global 4.15 3 6 4 4
Range 4.31 3 7 4 4
WC4 Coh 4.08 3 6 4 4
Acc 4.08 3 7 4 4
Desc 4.54 3 7 4 4
Arg 4.38 3 7 4 4
Global 5.69 5 8 5 5
Range 5.69 4 8 6 6
WC5 Coh 6.15 5 8 6 7
Acc 4.92 3 6 5 5
Desc 5.77 5 8 6 5
Arg 5.69 5 7 6 5

Familiarization
19
Table 4.9 Descriptive statistics-writing Level D Standardization task
Candidate Scale Mean Min Max Median Mode
Global 6.92 6 7 7 7
Range 6.92 6 8 7 7
WD1 Coh 6.92 6 7 7 7
Acc 6 5 7 6 6
Desc 6.92 6 8 7 7
Arg 6.62 5 7 7 7
Global 10.46 9 11 11 11
Range 10.69 9 11 11 11
WD2 Coh 10.46 9 11 11 11
Acc 10.46 9 11 11 11
Desc 10.46 9 11 11 11
Arg 10.54 9 11 11 11
Global 9.46 9 10 9 9
Range 9.92 9 11 10 9
WD3 Coh 9.46 9 11 9 9
Acc 8.15 7 10 8 8
Desc 10.23 9 11 10 11
Arg 10.15 9 11 10 10
Global 8.69 8 10 9 8
Range 8.85 8 10 9 9
WD4 Coh 7.77 7 9 8 8
Acc 8.46 8 9 8 8
Desc 8.77 8 11 9 8
Arg 8.54 7 11 8 8
Global 6.85 6 8 7 7
Range 6.85 5 8 7 7
WD5 Coh 6.92 6 8 7 6
Acc 7.07 5 9 7 8
Desc 7.07 6 8 7 8
Arg 6.39 5 7 7 7
4.3 Reading Standardization task
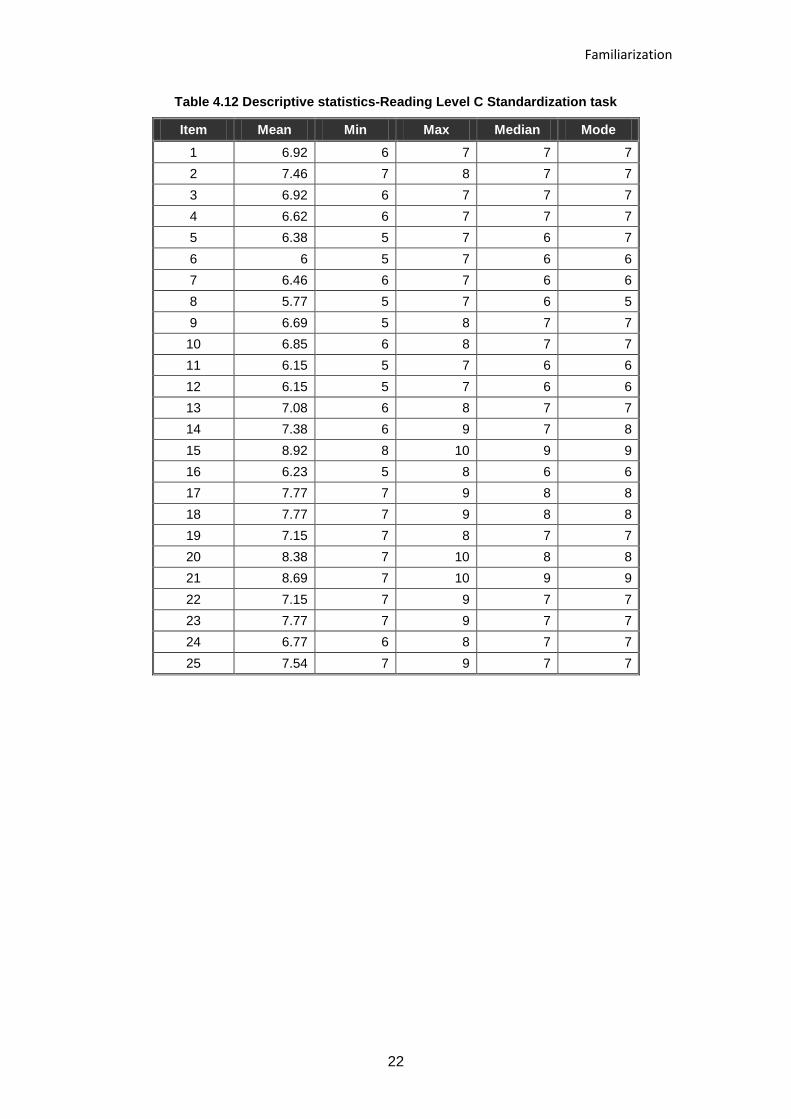
The judgments for reading are presented in this section. In order to further validate these results, the mean and medial of the judgments are correlated with item difficulty in Table 4.14.

Familiarization
20
Table 4.10 Descriptive statistics-Reading Level A Standardization task
Item Mean Min Max Median Mode
1 1.38 1 3 1 1
2 1.92 1 3 2 1
3 1.92 1 4 2 1
4 2 1 3 2 1
5 1.92 1 3 2 1
6 2.08 1 4 2 2
7 2 1 3 2 3
8 2.23 1 3 2 3
9 2.38 1 3 3 3
10 2.23 1 3 2 3
11 2.31 1 4 2 3
12 1.85 1 4 2 1
13 2.08 1 4 2 1
14 3.31 1 4 4 4
15 3.38 2 4 3 3
16 3.46 2 4 4 4
17 3.23 2 4 3 3
18 3.23 2 4 3 3
19 3.23 3 4 3 3
20 3.46 3 4 3 3
21 3.08 2 4 3 3
22 3.46 3 4 3 3
23 3 2 4 3 3
24 3.46 3 4 3 3
25 3.46 3 4 3 3

Familiarization
21
Table 4.11 Descriptive statistics-Reading Level B Standardization task
Item Mean Min Max Median Mode
1 1.77 1 3 2 2
2 1.62 1 3 1 1
3 3.92 2 5 4 4
4 3.08 1 5 3 3
5 2.92 1 4 3 3
6 4.54 3 6 5 5
7 3.92 2 5 4 4
8 3.31 2 5 3 3
9 3.92 2 5 4 4
10 2.85 1 4 3 3
11 3.38 3 4 3 3
12 4.92 2 6 5 5
13 4.08 2 7 4 4
14 4.54 3 5 5 5
15 5 4 6 5 5
16 5.62 4 6 6 6
17 4.54 3 6 5 5
18 4.92 3 7 5 5
19 5.54 4 7 5 5
20 3.92 3 5 4 3
21 5.08 4 6 5 5
22 4.92 3 6 5 5
23 5.23 4 6 5 5
24 5.62 4 7 6 5
25 5 4 7 5 5
Familiarization
22
Table 4.12 Descriptive statistics-Reading Level C Standardization task
Item Mean Min Max Median Mode
1 6.92 6 7 7 7
2 7.46 7 8 7 7
3 6.92 6 7 7 7
4 6.62 6 7 7 7
5 6.38 5 7 6 7
6 6 5 7 6 6
7 6.46 6 7 6 6
8 5.77 5 7 6 5
9 6.69 5 8 7 7
10 6.85 6 8 7 7
11 6.15 5 7 6 6
12 6.15 5 7 6 6
13 7.08 6 8 7 7
14 7.38 6 9 7 8
15 8.92 8 10 9 9
16 6.23 5 8 6 6
17 7.77 7 9 8 8
18 7.77 7 9 8 8
19 7.15 7 8 7 7
20 8.38 7 10 8 8
21 8.69 7 10 9 9
22 7.15 7 9 7 7
23 7.77 7 9 7 7
24 6.77 6 8 7 7
25 7.54 7 9 7 7
Familiarization
23
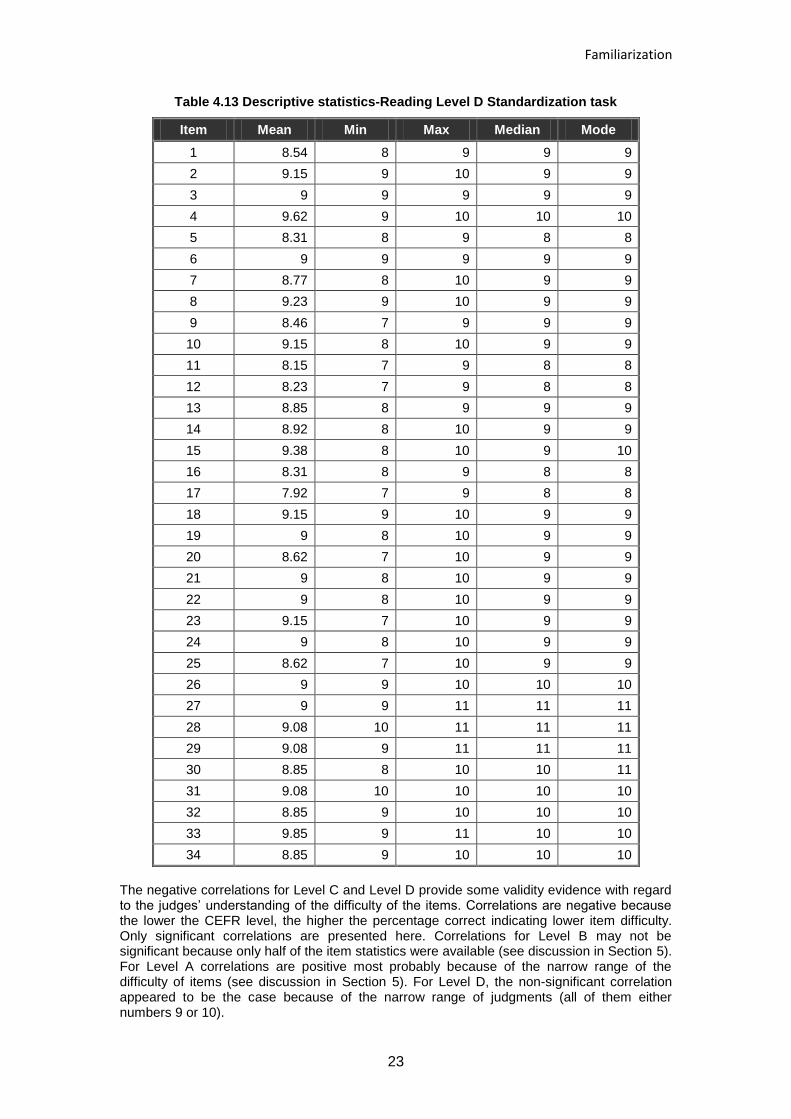
Table 4.13 Descriptive statistics-Reading Level D Standardization task
Item Mean Min Max Median Mode
1 8.54 8 9 9 9
2 9.15 9 10 9 9
3 9 9 9 9 9
4 9.62 9 10 10 10
5 8.31 8 9 8 8
6 9 9 9 9 9
7 8.77 8 10 9 9
8 9.23 9 10 9 9
9 8.46 7 9 9 9
10 9.15 8 10 9 9
11 8.15 7 9 8 8
12 8.23 7 9 8 8
13 8.85 8 9 9 9
14 8.92 8 10 9 9
15 9.38 8 10 9 10
16 8.31 8 9 8 8
17 7.92 7 9 8 8
18 9.15 9 10 9 9
19 9 8 10 9 9
20 8.62 7 10 9 9
21 9 8 10 9 9
22 9 8 10 9 9
23 9.15 7 10 9 9
24 9 8 10 9 9
25 8.62 7 10 9 9
26 9 9 10 10 10
27 9 9 11 11 11
28 9.08 10 11 11 11
29 9.08 9 11 11 11
30 8.85 8 10 10 11
31 9.08 10 10 10 10
32 8.85 9 10 10 10
33 9.85 9 11 10 10
34 8.85 9 10 10 10
The negative correlations for Level C and Level D provide some validity evidence with regard to the judges’ understanding of the difficulty of the items. Correlations are negative because the lower the CEFR level, the higher the percentage correct indicating lower item difficulty. Only significant correlations are presented here. Correlations for Level B may not be significant because only half of the item statistics were available (see discussion in Section 5). For Level A correlations are positive most probably because of the narrow range of the difficulty of items (see discussion in Section 5). For Level D, the non-significant correlation appeared to be the case because of the narrow range of judgments (all of them either numbers 9 or 10).

Familiarization
24
Table 4.14 Spearman correlations between reading item difficulty and judgments
Judgments Item difficulty
Mean Median
Level A .432 .520
Level B ns ns
Level C -.565 -.537
Level D -.488 ns
4.4 Listening Standardization task
The judgments for listening are presented in this section. Table 4.17 presents full agreement about all Level C items, which is not observed elsewhere in this section. This might be because B2 is in general wider than other CEFR levels (Council of Europe, 2001: 35) therefore judges may have referred to different aspects of listening comprehension at B2 level. In order to further validate the results, the mean and median of the judgments are correlated with item difficulty in Table 4.19.
Table 4.15 Descriptive statistics-Listening Level A Standardization task
Item Mean Min Max Median Mode
1 2 1 3 2 3
2 1.92 1 4 1 1
3 3.15 1 4 3 3
4 2.23 1 4 3 3
5 3.08 3 4 3 3
6 3 1 4 3 3
7 3.23 3 4 3 3
8 2.46 1 4 3 3
9 3.08 1 4 3 3
10 3.15 2 4 3 3
11 2.92 1 4 3 3
12 2.92 1 4 3 3
13 2.85 1 4 3 3
14 3.15 3 4 3 3
15 3.08 2 4 3 3
16 3.31 3 4 3 3
17 3.46 3 5 3 3
18 3.62 2 5 4 4
19 3.23 3 4 3 3
20 2.92 1 4 3 3
21 3.38 3 4 3 3
22 3.15 3 4 3 3
23 3.62 3 4 4 4
24 3.54 3 5 3 3
25 3.38 3 4 3 3
Familiarization
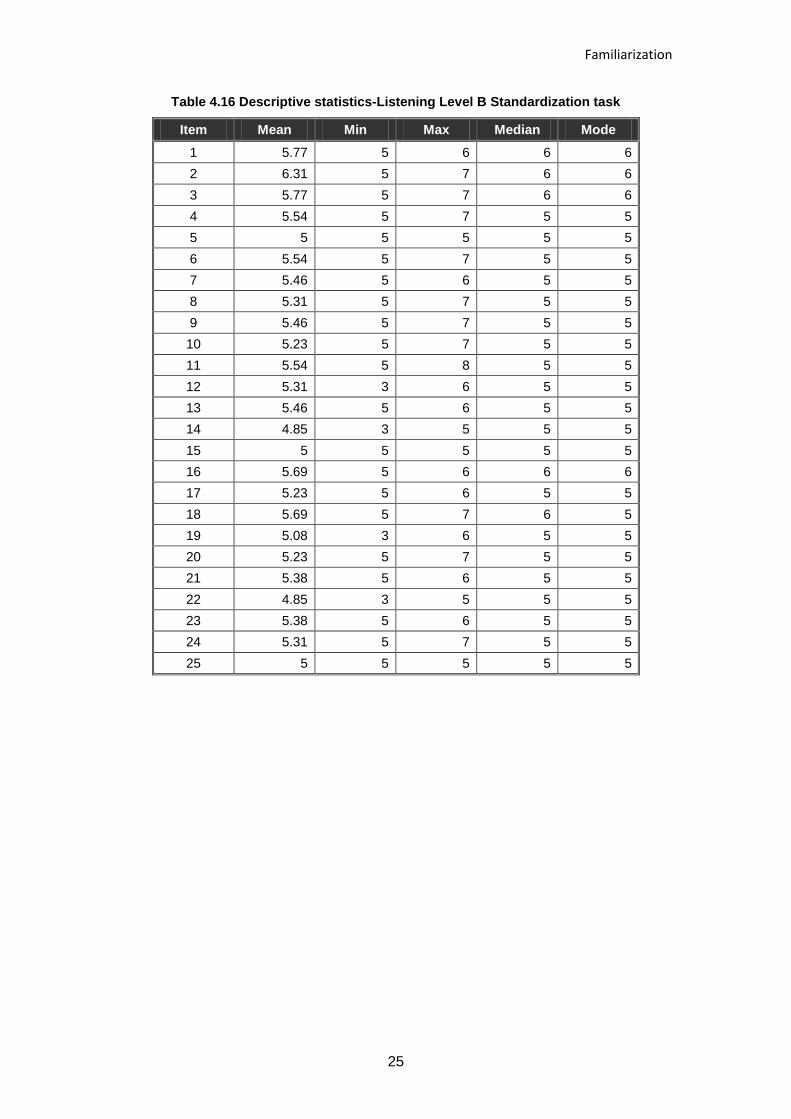
25
Table 4.16 Descriptive statistics-Listening Level B Standardization task
Item Mean Min Max Median Mode
1 5.77 5 6 6 6
2 6.31 5 7 6 6
3 5.77 5 7 6 6
4 5.54 5 7 5 5
5 5 5 5 5 5
6 5.54 5 7 5 5
7 5.46 5 6 5 5
8 5.31 5 7 5 5
9 5.46 5 7 5 5
10 5.23 5 7 5 5
11 5.54 5 8 5 5
12 5.31 3 6 5 5
13 5.46 5 6 5 5
14 4.85 3 5 5 5
15 5 5 5 5 5
16 5.69 5 6 6 6
17 5.23 5 6 5 5
18 5.69 5 7 6 5
19 5.08 3 6 5 5
20 5.23 5 7 5 5
21 5.38 5 6 5 5
22 4.85 3 5 5 5
23 5.38 5 6 5 5
24 5.31 5 7 5 5
25 5 5 5 5 5

Familiarization
26
Table 4.17 Descriptive statistics-Listening Level C Standardization task
Item Mean Min Max Median Mode
1 7 7 7 7 7
2 7.08 7 8 7 7
3 7 7 7 7 7
4 7 7 7 7 7
5 7 7 7 7 7
6 7 7 7 7 7
7 7 7 7 7 7
8 7 7 7 7 7
9 7 7 7 7 7
10 7 7 7 7 7
11 7 7 7 7 7
12 7 7 7 7 7
13 7 7 7 7 7
14 7 7 7 7 7
15 7 7 7 7 7
16 7 7 7 7 7
17 7 7 7 7 7
18 7 7 7 7 7
19 7 7 7 7 7
20 7 7 7 7 7
21 7 7 7 7 7
22 7 7 7 7 7
23 7 7 7 7 7
24 7 7 7 7 7
25 7 7 7 7 7
Familiarization
27
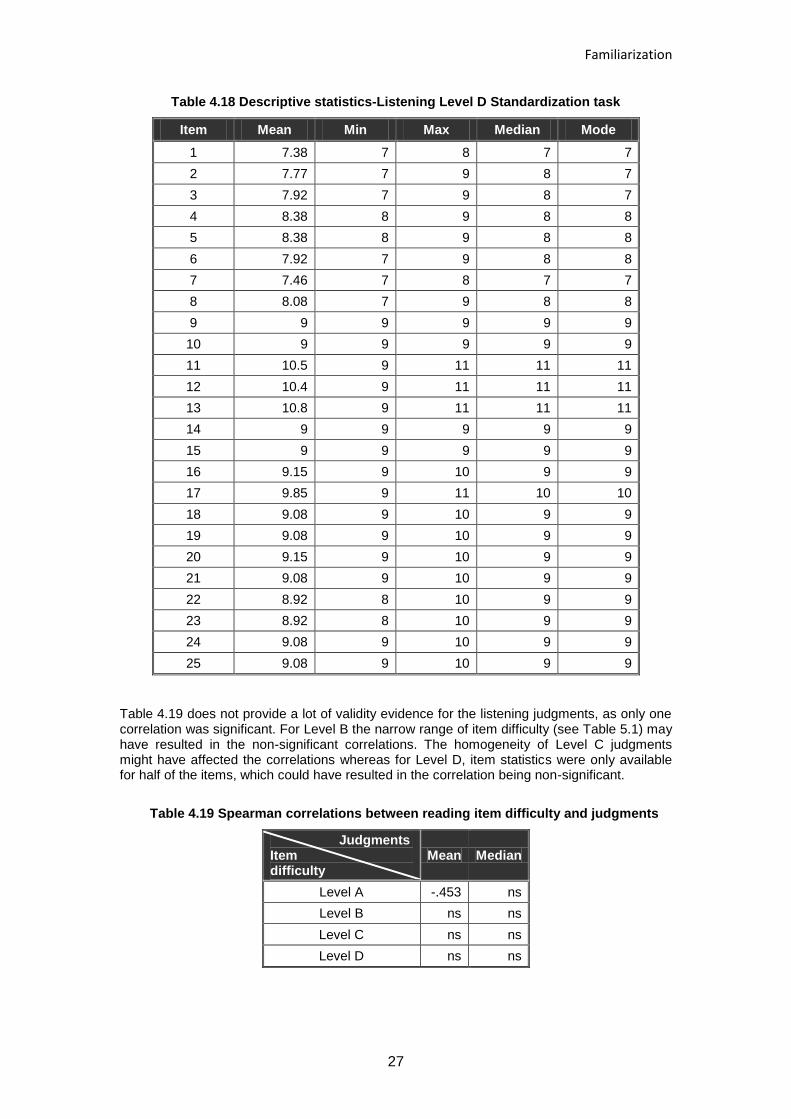
Table 4.18 Descriptive statistics-Listening Level D Standardization task
Item Mean Min Max Median Mode
1 7.38 7 8 7 7
2 7.77 7 9 8 7
3 7.92 7 9 8 7
4 8.38 8 9 8 8
5 8.38 8 9 8 8
6 7.92 7 9 8 8
7 7.46 7 8 7 7
8 8.08 7 9 8 8
9 9 9 9 9 9
10 9 9 9 9 9
11 10.5 9 11 11 11
12 10.4 9 11 11 11
13 10.8 9 11 11 11
14 9 9 9 9 9
15 9 9 9 9 9
16 9.15 9 10 9 9
17 9.85 9 11 10 10
18 9.08 9 10 9 9
19 9.08 9 10 9 9
20 9.15 9 10 9 9
21 9.08 9 10 9 9
22 8.92 8 10 9 9
23 8.92 8 10 9 9
24 9.08 9 10 9 9
25 9.08 9 10 9 9
Table 4.19 does not provide a lot of validity evidence for the listening judgments, as only one correlation was significant. For Level B the narrow range of item difficulty (see Table 5.1) may have resulted in the non-significant correlations. The homogeneity of Level C judgments might have affected the correlations whereas for Level D, item statistics were only available for half of the items, which could have resulted in the correlation being non-significant.
Table 4.19 Spearman correlations between reading item difficulty and judgments
Judgments Item difficulty
Mean Median
Level A -.453 ns
Level B ns ns
Level C ns ns
Level D ns ns
Familiarization
28
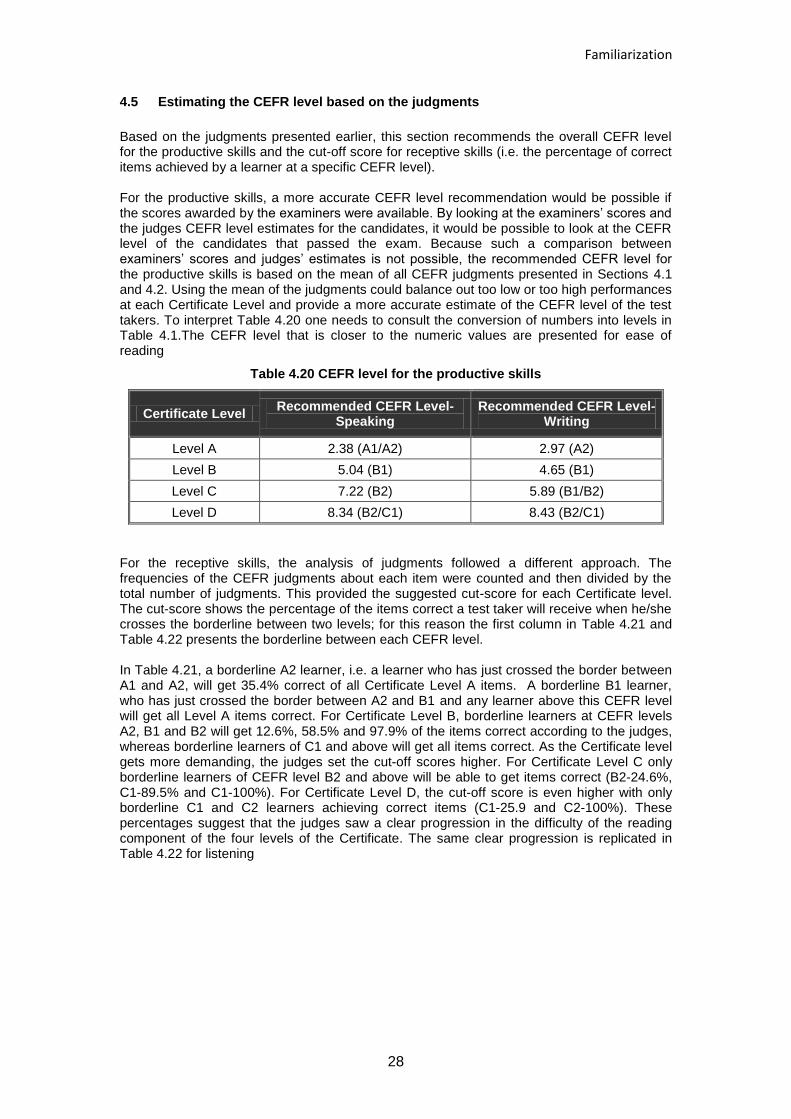
4.5 Estimating the CEFR level based on the judgments
Based on the judgments presented earlier, this section recommends the overall CEFR level for the productive skills and the cut-off score for receptive skills (i.e. the percentage of correct items achieved by a learner at a specific CEFR level). For the productive skills, a more accurate CEFR level recommendation would be possible if the scores awarded by the examiners were available. By looking at the examiners’ scores and the judges CEFR level estimates for the candidates, it would be possible to look at the CEFR level of the candidates that passed the exam. Because such a comparison between examiners’ scores and judges’ estimates is not possible, the recommended CEFR level for the productive skills is based on the mean of all CEFR judgments presented in Sections 4.1 and 4.2. Using the mean of the judgments could balance out too low or too high performances at each Certificate Level and provide a more accurate estimate of the CEFR level of the test takers. To interpret Table 4.20 one needs to consult the conversion of numbers into levels in Table 4.1.The CEFR level that is closer to the numeric values are presented for ease of reading
Table 4.20 CEFR level for the productive skills
Certificate Level Recommended CEFR Level-
Speaking Recommended CEFR Level-
Writing
Level A 2.38 (A1/A2) 2.97 (A2)
Level B 5.04 (B1) 4.65 (B1)
Level C 7.22 (B2) 5.89 (B1/B2)
Level D 8.34 (B2/C1) 8.43 (B2/C1)
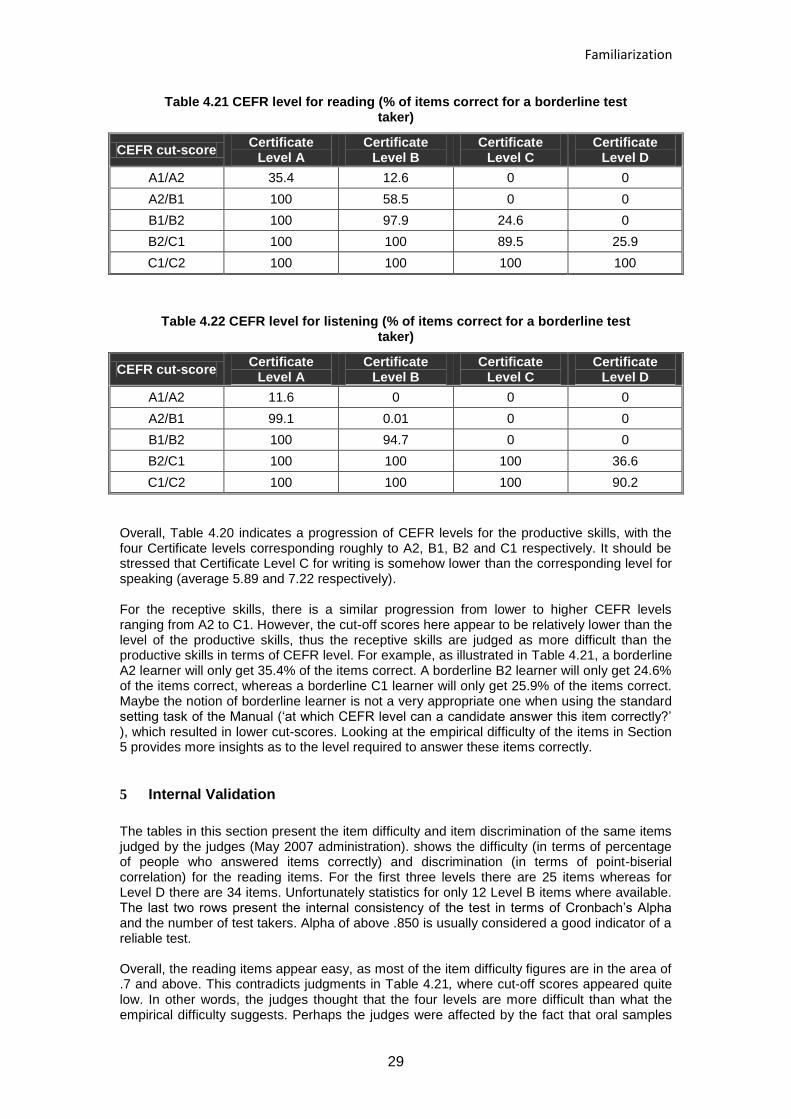
For the receptive skills, the analysis of judgments followed a different approach. The frequencies of the CEFR judgments about each item were counted and then divided by the total number of judgments. This provided the suggested cut-score for each Certificate level. The cut-score shows the percentage of the items correct a test taker will receive when he/she crosses the borderline between two levels; for this reason the first column in Table 4.21 and Table 4.22 presents the borderline between each CEFR level. In Table 4.21, a borderline A2 learner, i.e. a learner who has just crossed the border between A1 and A2, will get 35.4% correct of all Certificate Level A items. A borderline B1 learner, who has just crossed the border between A2 and B1 and any learner above this CEFR level will get all Level A items correct. For Certificate Level B, borderline learners at CEFR levels A2, B1 and B2 will get 12.6%, 58.5% and 97.9% of the items correct according to the judges, whereas borderline learners of C1 and above will get all items correct. As the Certificate level gets more demanding, the judges set the cut-off scores higher. For Certificate Level C only borderline learners of CEFR level B2 and above will be able to get items correct (B2-24.6%, C1-89.5% and C1-100%). For Certificate Level D, the cut-off score is even higher with only borderline C1 and C2 learners achieving correct items (C1-25.9 and C2-100%). These percentages suggest that the judges saw a clear progression in the difficulty of the reading component of the four levels of the Certificate. The same clear progression is replicated in Table 4.22 for listening
Familiarization
29
Table 4.21 CEFR level for reading (% of items correct for a borderline test taker)
CEFR cut-score Certificate
Level A Certificate
Level B Certificate
Level C Certificate
Level D
A1/A2 35.4 12.6 0 0
A2/B1 100 58.5 0 0
B1/B2 100 97.9 24.6 0
B2/C1 100 100 89.5 25.9
C1/C2 100 100 100 100
Table 4.22 CEFR level for listening (% of items correct for a borderline test taker)
CEFR cut-score Certificate
Level A Certificate
Level B Certificate
Level C Certificate
Level D
A1/A2 11.6 0 0 0
A2/B1 99.1 0.01 0 0
B1/B2 100 94.7 0 0
B2/C1 100 100 100 36.6
C1/C2 100 100 100 90.2
Overall, Table 4.20 indicates a progression of CEFR levels for the productive skills, with the four Certificate levels corresponding roughly to A2, B1, B2 and C1 respectively. It should be stressed that Certificate Level C for writing is somehow lower than the corresponding level for speaking (average 5.89 and 7.22 respectively). For the receptive skills, there is a similar progression from lower to higher CEFR levels ranging from A2 to C1. However, the cut-off scores here appear to be relatively lower than the level of the productive skills, thus the receptive skills are judged as more difficult than the productive skills in terms of CEFR level. For example, as illustrated in Table 4.21, a borderline A2 learner will only get 35.4% of the items correct. A borderline B2 learner will only get 24.6% of the items correct, whereas a borderline C1 learner will only get 25.9% of the items correct. Maybe the notion of borderline learner is not a very appropriate one when using the standard setting task of the Manual (‘at which CEFR level can a candidate answer this item correctly?’ ), which resulted in lower cut-scores. Looking at the empirical difficulty of the items in Section 5 provides more insights as to the level required to answer these items correctly.
5 Internal Validation
The tables in this section present the item difficulty and item discrimination of the same items judged by the judges (May 2007 administration). shows the difficulty (in terms of percentage of people who answered items correctly) and discrimination (in terms of point-biserial correlation) for the reading items. For the first three levels there are 25 items whereas for Level D there are 34 items. Unfortunately statistics for only 12 Level B items where available. The last two rows present the internal consistency of the test in terms of Cronbach’s Alpha and the number of test takers. Alpha of above .850 is usually considered a good indicator of a reliable test. Overall, the reading items appear easy, as most of the item difficulty figures are in the area of .7 and above. This contradicts judgments in Table 4.21, where cut-off scores appeared quite low. In other words, the judges thought that the four levels are more difficult than what the empirical difficulty suggests. Perhaps the judges were affected by the fact that oral samples

Familiarization
30
were quite advanced. As mentioned earlier (Section 4.1), the Certificate is regularly taken by test takers of Greek origin, born outside Greece, who tend to perform much better in speaking than other skill areas. This might have affected the judges, resulting in perceiving the receptive skills components as more difficult than they actually were. Discrimination indices in bold show indices below the generally acceptable .25. These items do not contribute to the measurement of language proficiency by the test. Finally, apart from Level A, Cronbach’s Alpha appears lower than the ‘industry standard’ of .850, although it should be pointed out that given the small number of items (because the more items the higher the Alpha), Alpha is not unsatisfactory. Similar results are presented in for listening. The very low reliability of Level D (Alpha .430) is probably due to the many items with low discrimination. The item analysis suggests that all levels are easy for the test takers, as the majority of the reading and listening items are in the area of .7 difficulty and above. These contradict judgments for receptive skills in Section 4.5, or simply suggest that the notion of borderline test taker is not very appropriate when employing the judgment task of the Manual. The analysis in this section provides some useful insights into the psychometric qualities of the items. Generally speaking, increasing the number of items will increase Alpha. Moreover, adding some more difficult items will also contribute to a more reliable test and the level of difficulty will be more appropriate for the test taking population. Finally, items with low discrimination should be checked for aspects of their design that do not allow for efficient measurement of language proficiency. A systematic investigation of the properties of items and productive skills tasks is required from now on to allow for the appropriate level of difficulty to be established.

Familiarization
31
Table 5.1 Item difficulty and discrimination (point-biserial) for reading
Level A Level B Level C Level D
Difficulty Discrim. Difficulty Discrim. Difficulty Discrim. Difficulty Discrim.
Item 1 .92 .46 .95 .31 .8 .4 .92 .28
Item 2 .81 .69 .91 .4 .84 .55 .52 .42
Item 3 .88 .52 .9 .51 .77 .42 .93 .19
Item 4 .75 .55 .96 .52 .8 .46 .66 .34
Item 5 .81 .61 .84 .36 .78 .23 .91 .35
Item 6 .86 .43 .86 .47 .8 .37 .82 .19
Item 7 .75 .53 .97 .47 .88 .55 .67 .23
Item 8 .72 .6 .76 .35 .73 .45 .54 .4
Item 9 .83 .57 .88 .45 .8 .4 .96 .26
Item 10 .69 .5 .88 .45 .85 .5 .7 .35
Item 11 .81 .51 .82 .3 .83 .55 .95 .31
Item 12 .67 .61 .85 .48 .84 .51 .83 .4
Item 13 .85 .36 .69 .19 .6 .39
Item 14 .91 .45 .55 .13 .48 .42
Item 15 .83 .6 .69 .26 .76 .47
Item 16 .9 .55 .94 .48 .76 .27
Item 17 .86 .63 .6 .09 .95 .32
Item 18 .93 .57 .78 .07 .34 .21
Item 19 .9 .49 .75 .12 .88 .32
Item 20 .79 .6 .27 .02 .89 .35
Item 21 .9 .61 .39 .08 .8 .34
Item 22 .88 .51 .37 .05 .92 .45
Item 23 .91 .54 .48 .28 .88 .33
Item 24 .94 .57 .88 .49 .97 .31
Item 25 .9 .47 .85 .34 .87 .34
Item 26 .76 .33
Item 27 .7 .42
Item 28 .66 .36
Item 29 .83 .43
Item 30 .89 .29
Item 31 .72 .27
Item 32 .85 .26
Item 33 .85 .37
Item 34 .72 .34
Alpha .919 .767 .763 .809
N 144 225 225 225

Familiarization
32
Table 5.2 Item difficulty and discrimination (point-biserial) for listening
Level A Level B Level C Level D
Difficulty Discrim. Difficulty Discrim. Difficulty Discrim. Difficulty Discrim.
Item 1 .96 .23 1 .03 .44 .4 .95 .37
Item 2 .98 .05 .99 .17 .72 .5 .98 .07
Item 3 .96 .26 .97 .45 .97 .22 .91 .29
Item 4 .97 .22 .93 .28 .96 .29 .91 .23
Item 5 .95 .25 .99 .45 .77 .28 .69 .17
Item 6 .99 .11 1 N/A .96 .25 .77 .12
Item 7 .92 .1 .96 .38 .94 .42 .96 .2
Item 8 .98 .12 .99 .37 .86 .5 .99 .41
Item 9 .92 .27 .95 .38 .75 .5 .93 .38
Item 10 .89 .11 .91 .36 .9 .41 .95 .08
Item 11 .94 .31 .99 .5 .86 .32 .93 .24
Item 12 .96 .29 .98 .26 .79 .58 .83 .06
Item 13 .9 .29 .98 .19 .78 .53 .25 -.14
Item 14 .94 .3 .98 .24 .79 .42 .97 .11
Item 15 .83 .88 .99 .41 .96 .31 .92 .27
Item 16 .61 .43 .98 .33 .83 .38 .96 .2
Item 17 .89 .74 .93 .26 .99 .16 .64 -.05
Item 18 .94 -.13 .94 .28 .95 .18
Item 19 1 N/A2 .87 .36 .87 .18
Item 20 .78 .8 .97 .46 .76 .49
Item 21 .94 .65 .96 .31 .9 .23
Item 22 .89 .74 .74 .17
Item 23 .39 .31 .98 .55
Item 24 .94 .65 .99 .34
Item 25 .83 .55 .99 .47
Alpha .730 .756 .806 .430
N 180 250 250 200
2 Because an item with difficulty of 1 is answered by all test takers, no point-biserial
correlation can be calculated to establish item discrimination

Conclusion
33
6 Conclusion
This report outlined a research project to standardize the four levels of the Certificate of Attainment in Greek on the levels of Common European Framework of Reference (CEFR). The project followed the CEFR linking process described in the Council of Europe’s (2003) Manual as closely as possible, in particular the Familiarization, Standardization and Empirical Validation stages. Thirteen judges were recruited and familiarized with the CEFR levels and then made CEFR level judgments about the receptive and productive skills of the four Certificate levels. The analysis of judgments shows that the four Certificate levels aim at CEFR Levels A2, B1, B2 and C1 respectively, with a clear progression of difficulty from lower to higher levels. The lack of significant correlations between judgments and empirical difficulty, as well as item analysis results, in particular some low Alpha indices, may indicate that further research is necessary. A follow-up study using different standard setting methods and judges might be useful to validate the results of this study.

Familiarization
34
References
Alderson, J. C. (2005). Diagnosing foreign language proficiency: The interface
between learning and assessment. London: Continuum.
Bachman, L. F. (2004). Statistical analyses for language assessment. Cambridge:
Cambridge University Press.
Cizek, G. J. (2001). Setting performance standards: Concepts, methods, and
perspectives. Mahwah, N.J.: Lawrence Erlbaum Associates.
Cizek, G. J., & Bunch, M. (Eds.). (2007). Standard setting: A guide to establishing
and evaluating performance standards on tests. London: Sage Publications.
Council of Europe. (2001). Common European Framework of Reference for
Languages: Learning, teaching, assessment. Cambridge: Cambridge
University Press.
Council of Europe. (2003). Manual for relating language examinations to the
Common European Framework of Reference for Languages: Learning,
teaching, assessment. Preliminary pilot version. Strasbourg: Council of
Europe.
Figueras, N., North, B., Takala, S., Verhelst, N., & Van Avermaet, P. (2005). Relating
examinations to the Common European Framework: a manual. Language
Testing, 22(3), 261–279.
Kaftandjieva, F. (2004). Standard setting. Section B of the Reference Supplement to
the preliminary version of the Manual for relating language examinations to
the Common European Framework of Reference for Languages: Learning,
teaching, assessment. Strasbourg: Council of Europe.
Kaftandjieva, F., & Takala, S. (2002). Council of Europe scales of language
proficiency: A validation study. In J. C. Alderson (Ed.), Common European
Framework of Reference for Languages: Learning, teaching, assessment.
Case studies. (pp. 106-129). Strasbourg: Council of Europe.
North, B. (2004). Relating assessments, examinations and courses to the CEF. In K.
Morrow (Ed.), Insights from the Common European Framework (pp. 77-90).
Oxford: Oxford University Press.
Papageorgiou, S. (2007). Setting standards in Europe: The judges' contribution to
relating language examinations to the Common European Framework of
Reference. Unpublished PhD thesis, Lancaster University.
Van Ek, J. A., & Trim, J. L. M. (1998). Threshold 1990. Cambridge: Cambridge
University Press.

Familiarization
35
Appendix 1
Stages of the linking process suggested in the Council of Europe’s (2003) Manual 1. Familiarisation. This stage is meant to ensure that the members of the linking panel are
familiar with the content of the CEFR and its scales before proceeding further in the linking process. The Manual recommends Familiarisation be repeated before each of the next two stages (Specification and Standardization) and suggests a number of familiarisation tasks.
2. Specification. This stage involves describing the content of the test to be related to the CEFR first on its own right and then in relation to the levels and categories of the CEFR. Forms for the mapping of the test are provided in the Manual. The outcome of this stage is a claim regarding the content of the test in relation to the CEFR.
3. Standardization. This stage examines the performance by test-takers and relates this performance to the CEFR. Much of the process suggested in the Manual comes from the educational measurement literature, in particular research in setting performance standards and cut-off scores (e.g. Cizek, 2001; Cizek & Bunch, 2007), which is further discussed in the Reference Supplement.
4. Empirical validation. This stage introduces two categories of empirical validation: internal validation, aiming at establishing the quality of the test on its own right, and external validation, aiming at a confirmation of the linking claim by either using an anchor test properly calibrated to the CEFR or by using judgments of teachers familiar with the CEFR. The outcome of this stage is the confirmation or rejection of the claims made in stages 2 and 3, using analysed test data.

36
Appendix 2
Sample of Familiarization Material Common Reference Levels: self-assessment grid
Speaking
S1
I can express myself fluently and convey finer shades of meaning precisely.
S2
I can connect phrases in a simple way in order to describe events.
S3 I can use simple phrases to describe where I live.
S4
I can use a series of phrases and sentences to describe in simple terms my family and other people.
S5
I can use language flexibly and effectively for social purposes.
S6
I can interact with a degree of fluency and spontaneity that makes regular interaction with native speakers quite possible.
S7
I can present clear, detailed descriptions on a wide range of subjects related to my field of interest.
S8
I can narrate a story and describe my reactions.
37
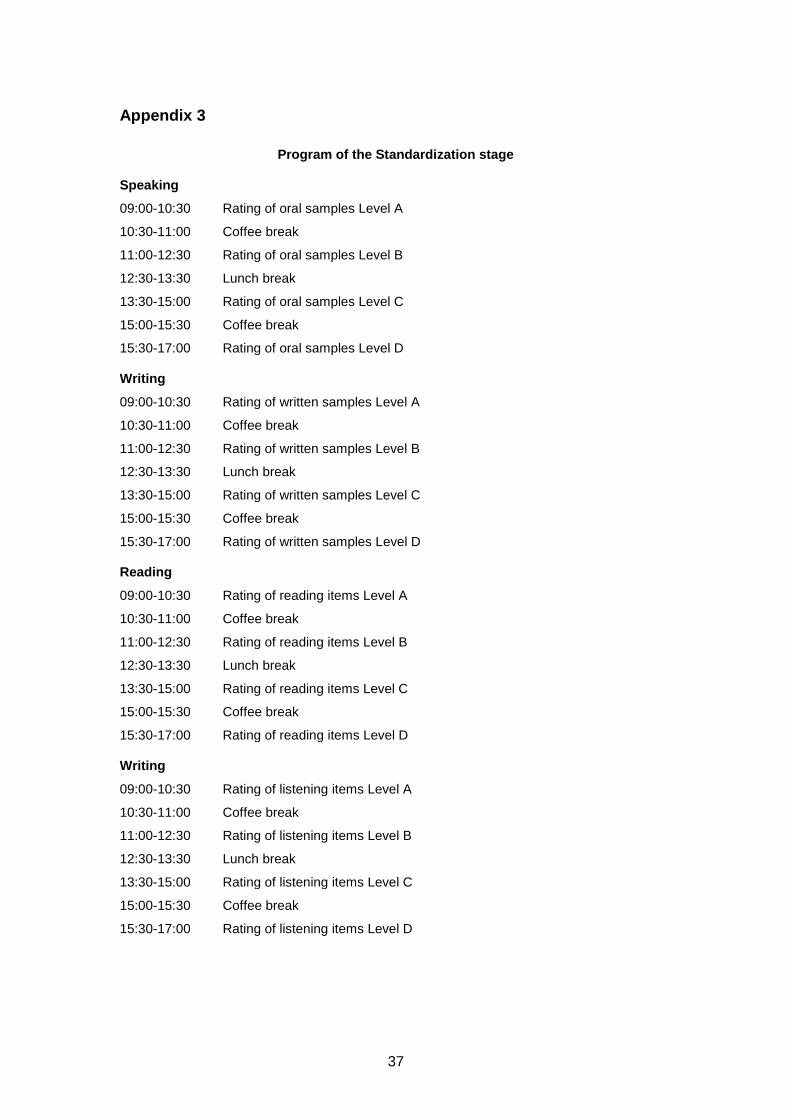
Appendix 3
Program of the Standardization stage Speaking
09:00-10:30 Rating of oral samples Level A
10:30-11:00 Coffee break
11:00-12:30 Rating of oral samples Level B
12:30-13:30 Lunch break
13:30-15:00 Rating of oral samples Level C
15:00-15:30 Coffee break
15:30-17:00 Rating of oral samples Level D Writing
09:00-10:30 Rating of written samples Level A
10:30-11:00 Coffee break
11:00-12:30 Rating of written samples Level B
12:30-13:30 Lunch break
13:30-15:00 Rating of written samples Level C
15:00-15:30 Coffee break
15:30-17:00 Rating of written samples Level D Reading
09:00-10:30 Rating of reading items Level A
10:30-11:00 Coffee break
11:00-12:30 Rating of reading items Level B
12:30-13:30 Lunch break
13:30-15:00 Rating of reading items Level C
15:00-15:30 Coffee break
15:30-17:00 Rating of reading items Level D Writing
09:00-10:30 Rating of listening items Level A
10:30-11:00 Coffee break
11:00-12:30 Rating of listening items Level B
12:30-13:30 Lunch break
13:30-15:00 Rating of listening items Level C
15:00-15:30 Coffee break
15:30-17:00 Rating of listening items Level D

38
Appendix 4
CEFR Rating Form for Speaking
DETAILS
Your name:
Learner’s name:
LEVEL ASSIGNMENT USING SCALED DESCRIPTORS FROM THE CEFR
GLOBAL RANGE ACCURACY FLUENCY INTERACTION COHERENCE
Justification/rationale (Please include reference to documentation)
(Continue overleaf if necessary)

39
Appendix 5
CEFR Rating Form for Writing
DETAILS
Your name:
Learner’s name:
LEVEL ASSIGNMENT USING SCALED DESCRIPTORS FROM THE CEFR
GLOBAL RANGE COHERENCE ACCURACY DESCRIPTION ARGUMENT
Justification/rationale (Please include reference to documentation)
(Continue overleaf if necessary)

40
Appendix 6
Rating Form used for the receptive skills Judge’s name: ________________________________________________________ Level: _______________________________________________________________ Judgement task: At which CEFR level can a candidate answer this item correctly? For example if you think that a candidate has to be at least at B1 level to answer Item 1 correctly, then write ‘B1’ in the decision column. Feel free to add any comments you might have.
Item Decision
Item 1
Item 2
Item 3
Item 4
Item 5
Item 6
Item 7
Item 8
Item 9
Item 10
Item 11
Item 12
Item 13
Item 14
Item 15
Item 16
Item 17
Item 18
Item 19
Item 20
Item 21
Item 22
Item 23
Item 24
Item 25


