
Central Training Report - WordPress.com RAYMOND KASEI SVN 0208388164 [email protected]...
184
Consultancy Services for Development of Disaster Risk and Early Warning Systems in Ghana Central Training Report December 2015 UNDP Ghana 9 December 2015 Final Report BC5721-101-100
Transcript of Central Training Report - WordPress.com RAYMOND KASEI SVN 0208388164 [email protected]...
Consultancy Services for Development of Disaster Risk and Early Warning Systems in Ghana
Central Training Report December 2015
UNDP Ghana
9 December 2015
Final Report
BC5721-101-100

- i - BC5721-101-100/CTR/411750/Nijm
Central Training Report 9 December 2015
Document title Central Training Report
December 2015
Document short title CTR
Status Final Report
Date 9 December 2015
Project name Consultancy Services for Development of Disaster Risk and Early Warning Systems in Ghana
Project number BC5721-101-100
Author(s) Willem Kroonen
Client UNDP Ghana
Reference BC5721-101-100/CTR/411750/Nijm
Jonkerbosplein 52
Postbus 151
Nijmegen 6500 AD
The Netherlands
+31 88 348 70 00 Telephone
+31 24 323 16 03 Fax
[email protected] E-mail
www.royalhaskoningdhv.com Internet
Amersfoort 56515154 CoC
HASKONINGDHV NEDERLAND B.V.
RIVERS, DELTAS & COASTS


- iii - BC5721-101-100/CTR/411750/Nijm
Central Training Report 9 December 2015
CONTENTS Page
1 INTRODUCTION 1
2 CENTRAL TRAINING 2 2.1 Setup 2 2.2 Short Description of Central Training Sessions 2 2.3 Involvement of Stakeholders 3 2.4 Linking Local Training to Central Training 3
3 PARTICIPANTS 5
4 CAPACITY ASSESSMENT 10
5 COURSE HANDOUTS 15


- 1 - BC5721-101-100/CTR/411750/Nijm
Central Training Report 9 December 2015
1 INTRODUCTION
As per the Training Programme that was agreed with the CREW Team, the training that was conducted consisted of 2 main elements: central training (in Accra, for technical professionals) and local training (in the pilot districts, for hotspot communities). The local training covered participatory vulnerability and capacity assessment and EWS embedding and anchoring. The local training took place in the pilot districts; was conducted in the appropriate local language by local specialists and targeted local institutions, NADMO volunteers and community-based organisations. Consultant has contracted SNV Ghana to implement the local training. SNV Ghana prepared a Training Manual for the local training that was shared with the CREW Team before local training started. The central training sessions was given by Consultant’s Team members, in the English language and for an audience of technical professionals from relevant stakeholders. This document describes the central training component. It also contains the course material (presentations) and the description of the EWS working procedure.
BC5721-101-100/CTR/411750/Nijm - 2 -
9 December 2015 Central Training Report
2 CENTRAL TRAINING
2.1 Setup
The central training consisted of courses and workshops. Courses are lecture-style sessions intended for a larger audience that present an overview of what has been done in the project and what should be done after the project ends. Workshops are aimed at a more specialized and smaller audience consisting of staff members of the main stakeholders charged with the tasks being presented. Workshops contained hands-on computer-based exercises to practice with the procedures presented. The CREW Team has indicated that the following 30 participants were to attend all central courses: Ten NADMO staff members, one from each region Ten NADMO staff members, one from each pilot district Four staff members from NADMO HQ Six representatives from the main stakeholders (WRC, GMET, HSD, VRA,
Universities)
The central component consisted of the following training sessions: 12 October 2015 Risk Assessment Basic (course)13 October 2015 Risk Assessment Advanced (workshop)14 October 2015 EWS Concepts (course)15 October 2015 EWS Operations (workshop)16 October 2015 Disaster Database Management (workshop)19 October 2015 Strategic/Tactical Level Overview (course) The central training sessions took place in Koforidua (12-16 October) and In Accra (19 October). Participants of the Koforidua sessions received a handout of the presentation and any other documentation that was used, such as procedure descriptions and examples for hands-on exercises. Attendance sheets were used to record the names and contact details of the participants.
2.2 Short Description of Central Training Sessions
The Risk Assessment Basic course gives an overview of the work done to prepare the national level and district-level hazard, vulnerability and risk maps for floods and droughts. This session also describes the proposed procedure for updating the resulting maps in the future and the role of the distributed stakeholders in this process. The Risk Assessment Advanced workshop goes into more detail of the approaches and tools used to create the hazard, vulnerability and risk maps. This workshop prepares assigned staff for their role in the updating procedures of the maps. This involves work with the ArcGIS software and other tools.

- 3 - BC5721-101-100/CTR/411750/Nijm
Central Training Report 9 December 2015
The EWS Concepts course gives an overview of the work done on the CREW Early Warning System (EWS). The basics of a EWS were explained and the approaches used to create the CREW EWS were discussed. Special attention was given to the operational aspects of the CREW EWS with a description of what happens before, during and after a flood or drought disaster strikes. This was centred around the roles played by the stakeholders on all levels of government and the local communities. The EWS Operations workshop delved into more detail, describing how the CREW EWS can be used and how warning thresholds can be updated. This workshop was intended to prepare assigned staff members to their role in the management and operation of the CREW EWS using the Delft-FEWS software and other computer-based tools. The Disaster Database Management workshop presented the database that was prepared to collect and store information on flood and drought-related disasters. This database has been connected to the ArcGIS software to enable a visual representation of these location-linked events. The database has been filled with the information on historical disasters provided by the CREW Team and is equipped with software functions to facilitate basic database operations. This workshop showed how the disaster database management system works but also how it should be kept up-to-date. The Strategic/Tactical Level Overview course provides an overview of the work done by Consultant in the course of the current project. It contained the highlights of the above-mentioned other central training sessions and it also presented the link with the local training sessions. This course allowed participants to gather a good understanding of the goals and achievements of the projects as well as of the proposed follow-up actions.
2.3 Involvement of Stakeholders
Special attention was given to describe the role of stakeholders at the different levels of the public authority’s hierarchy and of the communities involved. This was achieved by focussing on the task, responsibilities and benefits for each of the main stakeholders. Because the training sessions were attended by representatives of all these stakeholders, they were not only presented with a description of their own role, but they were also made aware of the roles of the other stakeholders, thereby increasing the likelihood of an efficient and effective cooperation.
2.4 Linking Local Training to Central Training
To enable a thorough embedding of the outcome of the current project, it is essential that the local communities involved are made aware of the efforts made in the fields of risk assessment and EWS. Only when the communities are well informed and engaged can the new tools be put to an effective use. This was achieved by presenting the outcomes of the risk mapping and the EWS to the local communities during the local training sessions in the pilot districts. During these local sessions the emphasis was not on technical details but rather on the community

BC5721-101-100/CTR/411750/Nijm - 4 -
9 December 2015 Central Training Report
involvement and community participation. It is through these mechanisms that the hoped-for results of the current project can be achieved. The communities were made aware of the benefits the risk maps can bring and their help was sought in the validation of the vulnerability and risk maps. The results of this validation will be an important input to achieve improved reliability in a subsequent updating cycle of these maps. The EWS was also introduced at the local level with a description of what it is and how it can be of use to the local communities. By means of a description of what will happen before, during and after a disaster strikes, the whole process was explained. The communities’ help is essential to validate and improve the thresholds used in the initial version of the EWS. Their input was asked to report on the performance of the EWS to improve its effectiveness. Other EWS aspects that require the communities’ cooperation are the choice of the most appropriate means of communicating the EWS warnings to the community members and the use of indigenous knowledge in the EWS. Both aspects were also on the agenda during the local training sessions. To allow for a good transfer of the material presented during the central training to the local training sessions, the responsible for the local training also attended the central training sessions in Koforidua.
- 5 - BC5721-101-100/CTR/411750/Nijm
Central Training Report 9 December 2015
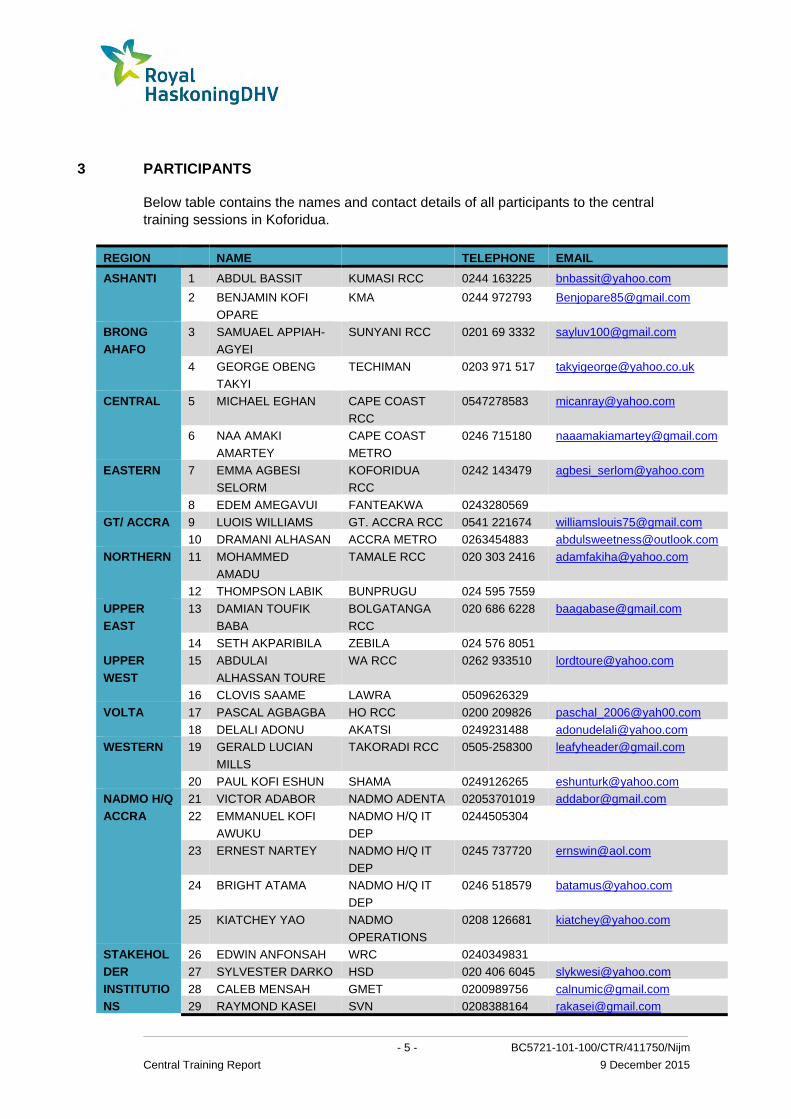
3 PARTICIPANTS
Below table contains the names and contact details of all participants to the central training sessions in Koforidua.
REGION NAME TELEPHONE EMAIL
ASHANTI 1 ABDUL BASSIT KUMASI RCC 0244 163225 [email protected]
2 BENJAMIN KOFI
OPARE
KMA 0244 972793 [email protected]
BRONG
AHAFO
3 SAMUAEL APPIAH-
AGYEI
SUNYANI RCC 0201 69 3332 [email protected]
4 GEORGE OBENG
TAKYI
TECHIMAN 0203 971 517 [email protected]
CENTRAL 5 MICHAEL EGHAN CAPE COAST
RCC
0547278583 [email protected]
6 NAA AMAKI
AMARTEY
CAPE COAST
METRO
0246 715180 [email protected]
EASTERN 7 EMMA AGBESI
SELORM
KOFORIDUA
RCC
0242 143479 [email protected]
8 EDEM AMEGAVUI FANTEAKWA 0243280569
GT/ ACCRA 9 LUOIS WILLIAMS GT. ACCRA RCC 0541 221674 [email protected]
10 DRAMANI ALHASAN ACCRA METRO 0263454883 [email protected]
NORTHERN 11 MOHAMMED
AMADU
TAMALE RCC 020 303 2416 [email protected]
12 THOMPSON LABIK BUNPRUGU 024 595 7559
UPPER
EAST
13 DAMIAN TOUFIK
BABA
BOLGATANGA
RCC
020 686 6228 [email protected]
14 SETH AKPARIBILA ZEBILA 024 576 8051
UPPER
WEST
15 ABDULAI
ALHASSAN TOURE
WA RCC 0262 933510 [email protected]
16 CLOVIS SAAME LAWRA 0509626329
VOLTA 17 PASCAL AGBAGBA HO RCC 0200 209826 [email protected]
18 DELALI ADONU AKATSI 0249231488 [email protected]
WESTERN 19 GERALD LUCIAN
MILLS
TAKORADI RCC 0505-258300 [email protected]
20 PAUL KOFI ESHUN SHAMA 0249126265 [email protected]
NADMO H/Q
ACCRA
21 VICTOR ADABOR NADMO ADENTA 02053701019 [email protected]
22 EMMANUEL KOFI
AWUKU
NADMO H/Q IT
DEP
0244505304
23 ERNEST NARTEY NADMO H/Q IT
DEP
0245 737720 [email protected]
24 BRIGHT ATAMA NADMO H/Q IT
DEP
0246 518579 [email protected]
25 KIATCHEY YAO NADMO
OPERATIONS
0208 126681 [email protected]
STAKEHOL
DER
INSTITUTIO
NS
26 EDWIN ANFONSAH WRC 0240349831
27 SYLVESTER DARKO HSD 020 406 6045 [email protected]
28 CALEB MENSAH GMET 0200989756 [email protected]
29 RAYMOND KASEI SVN 0208388164 [email protected]

BC5721-101-100/CTR/411750/Nijm - 6 -
9 December 2015 Central Training Report
PROJECT
STAFF
30 ISRAEL FIAGBE CREW PMU 0269842803 [email protected]
31 DR. KINGSFORD
ASAMOAH
CREW PMU 05447776056 [email protected]
32 STEPHEN KANSUK CREW PMU 0204751972 [email protected]
33 DR. PHILIP MANTEY CREW PMU 0261563166 [email protected]
From Consultant’s side the central training in Koforidua was conducted by:
Willem Kroonen Dr. Hanneke Schuurmans Job Udo Dr. Anthony Duah
The Strategic/Tactical Level Overview session in Accra was conducted by Willem Kroonen who also participated in the Launch Event for the Risk Maps that took place the same day. The central training in Koforidua was completed successfully by all participants. Certificates of completion (example shown below) were handed out by NADMO’s Acting National Coordinator, Brigadier General Francis Vib Sanziri who joined the training course in Koforidua on the final day.
- 7 - BC5721-101-100/CTR/411750/Nijm
Central Training Report 9 December 2015

BC5721-101-100/CTR/411750/Nijm - 8 -
9 December 2015 Central Training Report

- 9 - BC5721-101-100/CTR/411750/Nijm
Central Training Report 9 December 2015
BC5721-101-100/CTR/411750/Nijm - 10 -
9 December 2015 Central Training Report
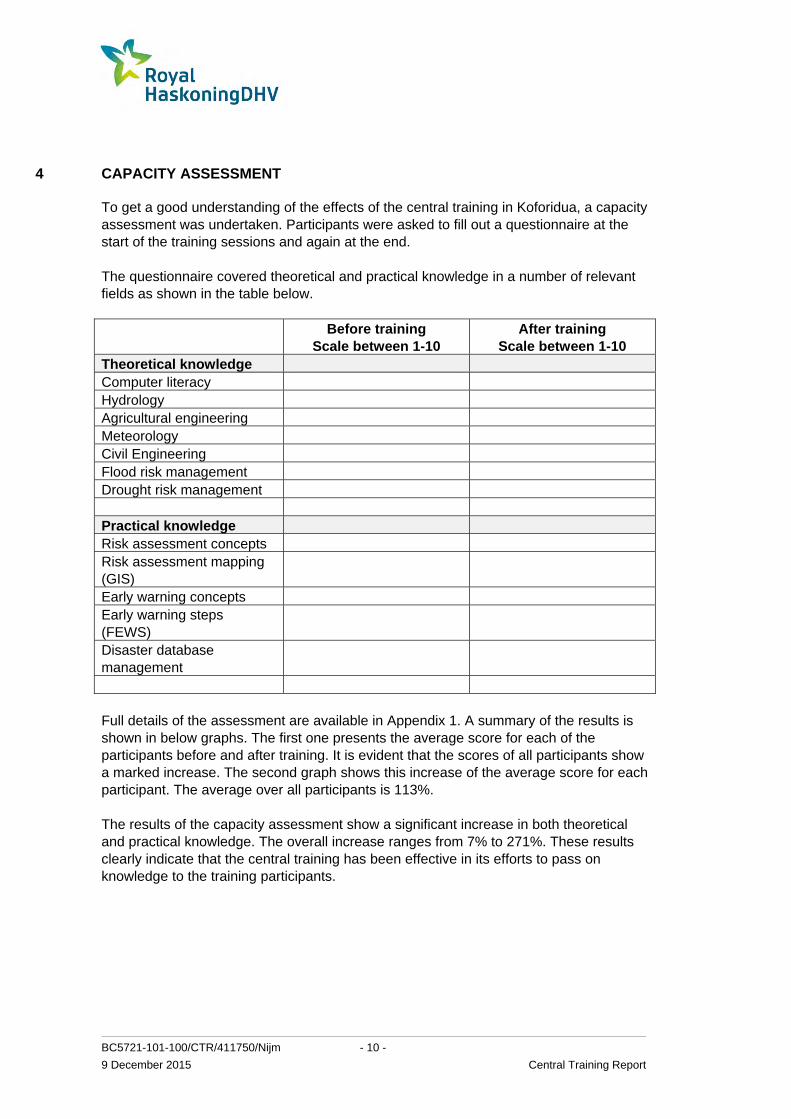
4 CAPACITY ASSESSMENT
To get a good understanding of the effects of the central training in Koforidua, a capacity assessment was undertaken. Participants were asked to fill out a questionnaire at the start of the training sessions and again at the end. The questionnaire covered theoretical and practical knowledge in a number of relevant fields as shown in the table below. Before training
Scale between 1-10 After training
Scale between 1-10 Theoretical knowledge Computer literacy Hydrology Agricultural engineering Meteorology Civil Engineering Flood risk management Drought risk management Practical knowledge Risk assessment concepts Risk assessment mapping (GIS)
Early warning concepts Early warning steps (FEWS)
Disaster database management
Full details of the assessment are available in Appendix 1. A summary of the results is shown in below graphs. The first one presents the average score for each of the participants before and after training. It is evident that the scores of all participants show a marked increase. The second graph shows this increase of the average score for each participant. The average over all participants is 113%. The results of the capacity assessment show a significant increase in both theoretical and practical knowledge. The overall increase ranges from 7% to 271%. These results clearly indicate that the central training has been effective in its efforts to pass on knowledge to the training participants.

- 11 - BC5721-101-100/CTR/411750/Nijm
Central Training Report 9 December 2015
0.00
1.00
2.00
3.00
4.00
5.00
6.00
7.00
8.00
9.00
10.00
1 2 3 4 5 6 7 8 9 101112131415161718192021222324252627
Score
Training Participant
Central Training Assessment
Before
After
0%
50%
100%
150%
200%
250%
300%
1 3 5 7 9 11 13 15 17 19 21 23 25 27
Increase in
Score
Training Participant
Central Training Effect
Increase

BC5721-101-100/CTR/411750/Nijm - 12 -
9 December 2015 Central Training Report

- 13 - BC5721-101-100/CTR/411750/Nijm
Central Training Report 9 December 2015

BC5721-101-100/CTR/411750/Nijm - 14 -
9 December 2015 Central Training Report

- 15 - BC5721-101-100/CTR/411750/Nijm
Central Training Report 9 December 2015
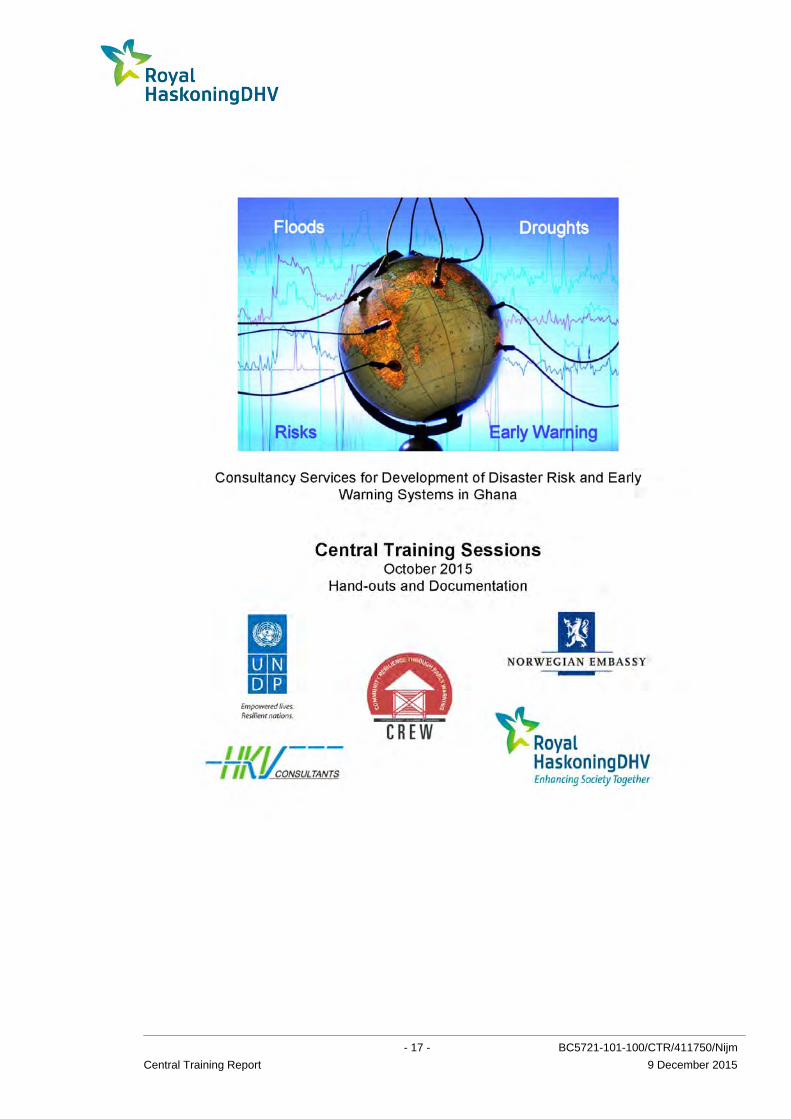
5 COURSE HANDOUTS
This section of the report contains the following elements: Introductory Presentation (12 October Koforidua, Willem Kroonen) Risk Assessment Basics Presentation (12 October, Koforidua, Dr Hanneke
Schuurmans) Risk Assessment Advanced Presentation (13 October, Koforidua, Dr Hanneke
Schuurmans) EWS Basics Presentation (14 October, Koforidua, Job Udo) EWS Advanced Presentation (15 October, Koforidua, Job Udo) Disaster Database Management Presentation (16 October, Koforidua, Dr Anthony
Duah) Strategic/Tactical Level Overview Presentation (19 October, Accra, Willem Kroonen) Presentation from one of the Koforidua trainees (16 October, Koforidua, Sylvester
Darko) Risk Maps Launch Event Presentation (19 October, Accra, Willem Kroonen) Training Manual Risk Assessment Training Manual EWS Web Access Training manual EWS Expert Access

BC5721-101-100/CTR/411750/Nijm - 16 -
9 December 2015 Central Training Report
- 17 - BC5721-101-100/CTR/411750/Nijm
Central Training Report 9 December 2015

BC5721-101-100/CTR/411750/Nijm - 18 -
9 December 2015 Central Training Report

1
Project introduction
Willem KroonenOctober 2015
Title | 07 July 2015
Opening
2

2
Title | 07 July 2015
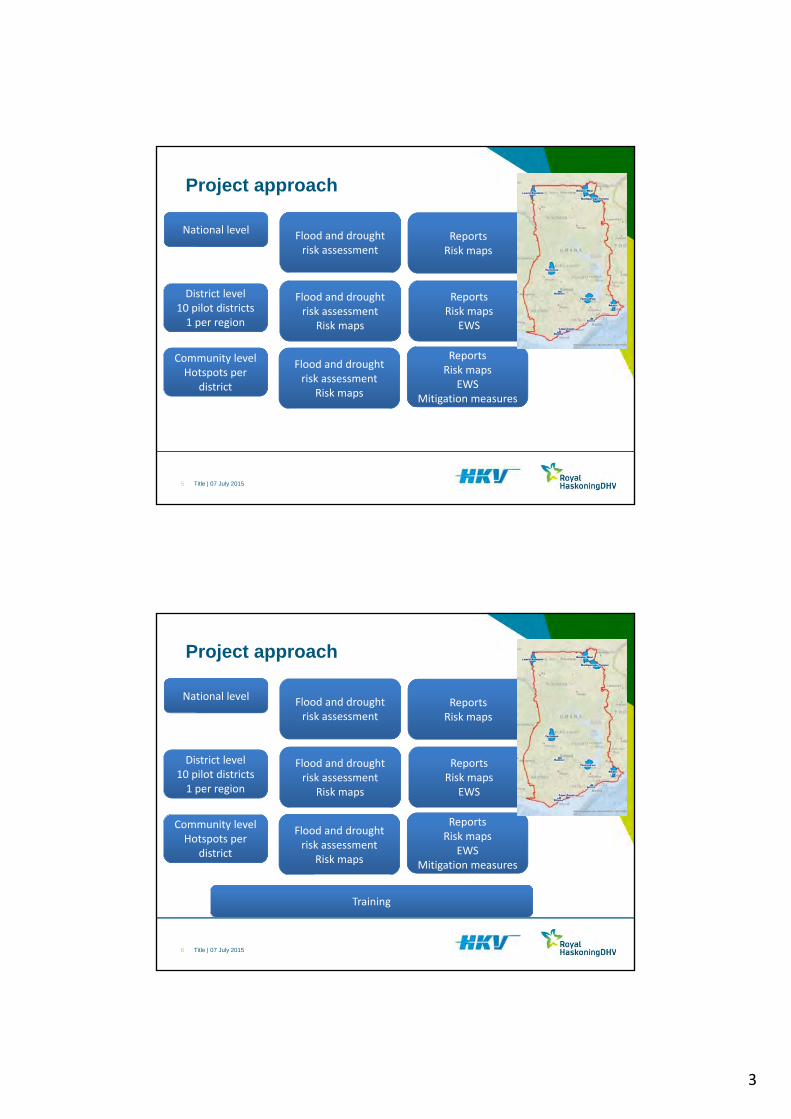
Project approach
National level Flood and droughtrisk assessment
ReportsRisk maps
3
Title | 07 July 2015
Project approach
National level Flood and droughtrisk assessment
District level10 pilot districts1 per region
Flood and droughtrisk assessment
Risk maps
ReportsRisk maps
ReportsRisk maps
EWS
4
3
Title | 07 July 2015
Project approach
National level Flood and droughtrisk assessment
District level10 pilot districts1 per region
Flood and droughtrisk assessment
Risk maps
ReportsRisk maps
ReportsRisk maps
EWS
Community levelHotspots per
district
Flood and droughtrisk assessment
Risk maps
ReportsRisk maps
EWSMitigation measures
5
Title | 07 July 2015
Project approach
National level Flood and droughtrisk assessment
District level10 pilot districts1 per region
Flood and droughtrisk assessment
Risk maps
ReportsRisk maps
ReportsRisk maps
EWS
Community levelHotspots per
district
Flood and droughtrisk assessment
Risk maps
ReportsRisk maps
EWSMitigation measures
6
Training

4
Title | 07 July 2015
Training
7
• Risk assessment and mapping• Early warning system
Objectives• Improved understanding of flood and drought risk
assessment• Improve flood and drought risk maps• Improve flood and drought early warning process• Roles in this process
Title | 07 July 2015
Training
8
• Risk assessment and mapping• Early warning system
Objectives• Improved understanding of flood and drought risk
assessment• Improve flood and drought risk maps• Improve flood and drought early warning process• Roles in this process
Date CourseMon 12 October 2015 Risk Assessment Basic (course) full dayTue 13 October 2015 Risk Assessment Advanced (workshop) full dayWed 14 October 2015 EWS Concepts (course) full dayThu 15 October 2015 EWS Operations (workshop) full dayFri 16 October 2015 Disaster Database Management (workshop) half day
5
Title | 07 July 2015
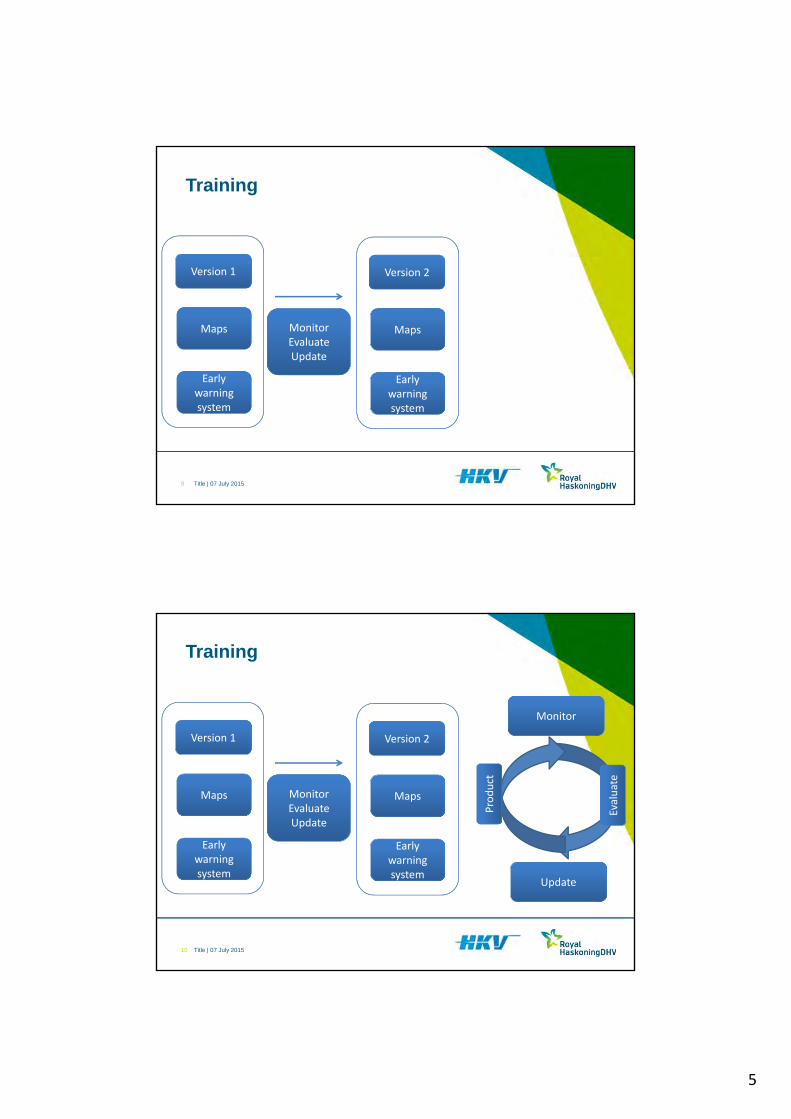
Training
9
Maps
Earlywarningsystem
MonitorEvaluateUpdate
Version 1
Maps
Earlywarningsystem
Version 2
Title | 07 July 2015
Training
10
Maps
Earlywarningsystem
MonitorEvaluateUpdate
Version 1
Maps
Earlywarningsystem
Version 2
Product
Monitor
Update
Evaluate

6
Title | 07 July 2015
Training
11
• Training documents• Hand outs• Manuals
• USB‐stick• Training documents digitally• Early warning system• Mapping database• Disaster database• Supporting software
Title | 07 July 2015
Training
12
• Capacity assessment

1
Risk Assessment
Basic Course
Hanneke SchuurmansOctober 2015
October 2015
Overview Course program
2
Date Course Venue
Mon 12 October 2015 Risk Assessment Basic (course) full day HotelTue 13 October 2015 Risk Assessment Advanced (workshop) full day Hotel
Wed 14 October 2015 EWS Concepts (course) full day HotelThu 15 October 2015 EWS Operations (workshop) full day HotelFri 16 October 2015 Disaster Database Management (workshop) half day HotelFri 16 October 2015 Strategic/Tactical Level Overview (course) half day Hotel
2
October 2015
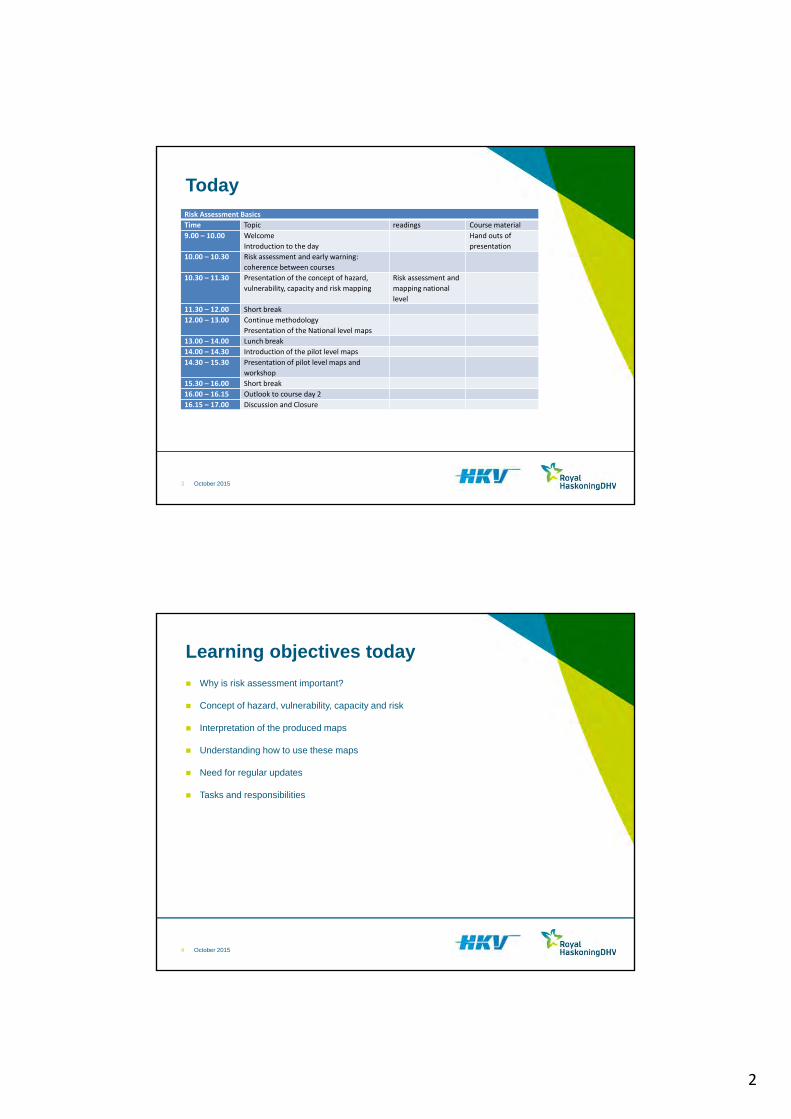
Today
3
Risk Assessment Basics
Time Topic readings Course material
9.00 – 10.00 Welcome
Introduction to the day
Hand outs of
presentation
10.00 – 10.30 Risk assessment and early warning:
coherence between courses
10.30 – 11.30 Presentation of the concept of hazard,
vulnerability, capacity and risk mapping
Risk assessment and
mapping national
level
11.30 – 12.00 Short break
12.00 – 13.00 Continue methodology
Presentation of the National level maps
13.00 – 14.00 Lunch break
14.00 – 14.30 Introduction of the pilot level maps
14.30 – 15.30 Presentation of pilot level maps and
workshop
15.30 – 16.00 Short break
16.00 – 16.15 Outlook to course day 2
16.15 – 17.00 Discussion and Closure
October 2015
Learning objectives today
Why is risk assessment important?
Concept of hazard, vulnerability, capacity and risk
Interpretation of the produced maps
Understanding how to use these maps
Need for regular updates
Tasks and responsibilities
4

3
October 2015
The need for risk assessment
Better information leads to better decisions
Improve the tasks of NADMO
A way to become more pro-active in disaster response: focus on the high risk areas
Essential for environmental policy and planning e.g. no urban development in high flood risk areas; Long term planning of agricultural activities
5
Data Information Decisions
October 2015
Risk assessment levels
National level: General overview Allows comparison between different areas Allows prioritisation of risk reduction efforts
District level: 10 selected districts More detailed assessement – same methodology, more detailed data Reference for high risk areas in early warning system
Community level: Hotspots within districts Causes of high risk were analyzed Potential mitigation measures are proposed Mitigation measures can be structural (e.g. culverts) or non-structural (awareness)
6

4
October 2015
Pilots and hotspots
7
October 2015
Coherence between courses
Mapping: static – assessment of the risk profiles Based on general approaches and climatological data
Early warning system: current status of system. Risk maps are needed to make the proper local interpretation
8
Data Information Decisions
Date Course Venue Mon 12 October 2015 Risk Assessment Basic (course) full day Hotel
Tue 13 October 2015 Risk Assessment Advanced (workshop) full day HotelWed 14 October 2015 EWS Concepts (course) full day Hotel
Thu 15 October 2015 EWS Operations (workshop) full day HotelFri 16 October 2015 Disaster Database Management (workshop) half day HotelFri 16 October 2015 Strategic/Tactical Level Overview (course) half day Hotel

5
October 2015
Definitions
Hazard: A dangerous phenomenon, substance, human activity or condition that may cause loss of life, injury or other health impacts, property damage, loss of livelihoods and services, social and economic disruption, or environmental damage.
Vulnerability: The characteristics and circumstances of a community, system or asset that make it susceptible to the damaging effects of a hazard.
Capacity: The combination of all the strengths, attributes and resources available within a community, society or organization that can be used to achieve agreed goals
Risk: The combination of the probability of an event and its negative consequences.
As defined in the CREW programme, disaster risk can be shown as: Disaster risk = hazard * vulnerability / capacity
This methodology is applied to floods and droughts
9
October 2015
Produced maps
National level: 12 maps First assessement of the risk profiles for all the disctricts Based on data which is available nation wide
Pilot district level: 60 maps Same procedure as national wide maps but Based on additional, more detailed, district level data
Example: flood vulnerability
10
National level District level

6
October 2015
Produced maps
National level: 12 maps
Pilot district level: 10 x 6 = 60 maps
11
national grid flood hazard current
national grid flood hazard future (2050)
national grid drought hazard current
national grid drought hazard future (2050)
national grid flood vulnerability current
national grid flood vulnerability future (2050)
national grid drought vulnerability current
national grid drought vulnerability future (2050)
national grid flood risk current
national grid flood risk future (2050)
national grid drought risk current
national grid drought risk future (2050)
10 pilot districts flood hazard current
10 pilot districts drought hazard current
10 pilot districts flood vulnerability current
10 pilot districts drought vulnerability current
10 pilot districts flood risk current
10 pilot districts drought risk current
October 2015
Clarification of methodology
Flooding Flood hazard Flood vulnerability Flood risk Future scenario (2050)
Drought Drought hazard Drought vulnerability Drought risk Future scenario (2050)
12

7
October 2015
Flood hazard methodology (1)
Height Above Nearest Drainage (HAND) Key parameter: relative height of a certain area (pixel) in relation to the local drainage
network as a key parameter. Other topographical characteristics like slope and drainage area are also taken into
account. The method is described by Rennó et al. (2008).
Input data: digital elevation model (DEM) National level: SRTM data – free – resolution of 90 m x 90 m Pilot district level: SPOT data – ordered for this project – resolution of 20 m x 20 m Example: part of Fanteakwa district
13
October 2015
Flood hazard methodology (2)
14

8
October 2015
National Flood Hazard MapSpatially distributed map Area [km2] Area [%]
High hazard 28,640 12%
Medium hazard 30,753 13%
Low hazard 24,137 10%
No hazard 155,413 65%
15
October 2015
Flood vulnerability methodology (1)
The characteristics and circumstances of a community, system or asset that make it susceptible to the damaging effects of a hazard.
Characteristics: land use
Damaging effects: destruction / loss of property (flood); Indicator for loss of life under threat
16

9
October 2015
Flood vulnerability methodology (2)
Input data: FAO land use map - classification per land use type Population density from census data - classification Urban areas from open street map – urban areas highly vulnerable to flood District level: more detailled outline of urban areas
17
Flood DroughtRainfed croplands HIGH HIGHMosaic cropland (50‐70%) / vegetation (grassland/shrubland/forest) (20‐50%) MEDIUM MEDIUM
Mosaic vegetation (grassland/shrubland/forest) (50‐70%) / cropland (20‐50%) MEDIUM MEDIUM
Mosaic forest (50‐70%) / cropland (20‐50%) LOW MEDIUMClosed to open (>15%) broadleaved evergreen or semi‐deciduous forest (>5m) NO LOW
Closed (>40%) broadleaved evergreen and/or semi‐deciduous forest (>5m) NO LOW
Open (15‐40%) broadleaved deciduous forest/woodland (>5m) NO LOWMosaic forest or shrubland (50‐70%) / grassland (20‐50%) NO LOWMosaic grassland (50‐70%) / forest or shrubland (20‐50%) NO MEDIUMClosed to open (>15%) (broadleaved or needleleaved, evergreen or deciduous) shrubland (<5m) NO LOW
Closed to open (>15%) broadleaved deciduous shrubland (<5m) NO LOWClosed to open (>15%) herbaceous vegetation (grassland, savannas or lichens/mosses) NO LOW
Closed (>40%) grassland NO LOWGrassland NO LOWSparse (<15%) vegetation NO NOSparse (<15%) grassland NO NOClosed to open (>15%) broadleaved forest regularly flooded (semi‐permanently or temporarily) ‐ Fresh or brackish water
NO LOW
Closed (>40%) broadleaved forest or shrubland permanently flooded ‐ Saline or brackish water NO LOW
Artificial surfaces and associated areas (Urban areas >50%) HIGH LOWBare areas NO NONon‐consolidated bare areas (sandy desert) NO NOWater bodies NO NOResidential HIGH LOW
October 2015
Flood vulnerability national map
18
Vulnerability Area [km2]
NO (incl. water bodies) 7,318
LOW 200,377
MEDIUM 28,008
HIGH 3,159

10
October 2015
Flood risk methodology
Risk = hazard x vulnerability / capacity Capacity: current situation = 1 (reference situation)
19
October 2015
Short break
20

11
October 2015
Climate change
Climate – long-term pattern (~30 years) of weather in a particular area Climate is expected to change Selection of IPCC Scenario’s
21
October 2015
Climate – changes in Ghana
Expert knowledge - Emmanuel Obuobie, PhD
22

12
October 2015
Climate – changes in Ghana
23
October 2015
Future scenario (2050) - Flood hazard
precipitation parameters are used to determine the change in flood hazard Relative change of volume of yearly rainfall Number of days with precipitation Number of events with large intensities (e.g. > 50 or > 100 mm/day) Maximum daily rainfall intensity
24
Sketch of yearly precipitation pattern
Description Change in HAND indexes wrtcurrent scenario
Parameter A1B
Volume ±
Period +
Intensity -
No.events -
Type of river
A1B
Large 0
Medium -1
Small -1
13
October 2015
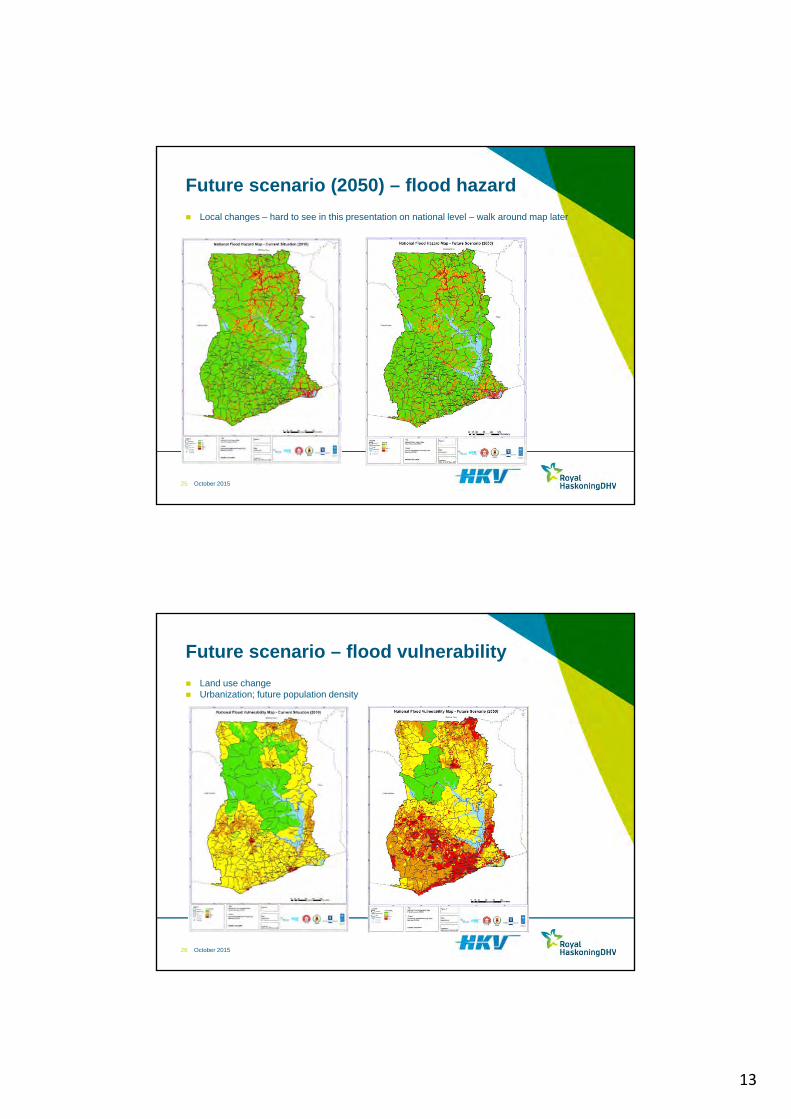
Future scenario (2050) – flood hazard
Local changes – hard to see in this presentation on national level – walk around map later
25
October 2015
Future scenario – flood vulnerability
Land use change Urbanization; future population density
26

14
October 2015
Future scenario – flood risk
27
October 2015
Clarification of methodology
Flooding Flood hazard Flood vulnerability Flood risk Future scenario
Drought Drought hazard Drought vulnerability Drought risk Future scenario
28

15
October 2015
Drought hazard methodology
Drought is defined in this project as a meteorological drought Based on rainfall deficit – method
29
Rodell et al. (2015)
October 2015
Drought hazard methodology
Example (one year, station Wa) Used in Netherlands by meteorological institute
30
16
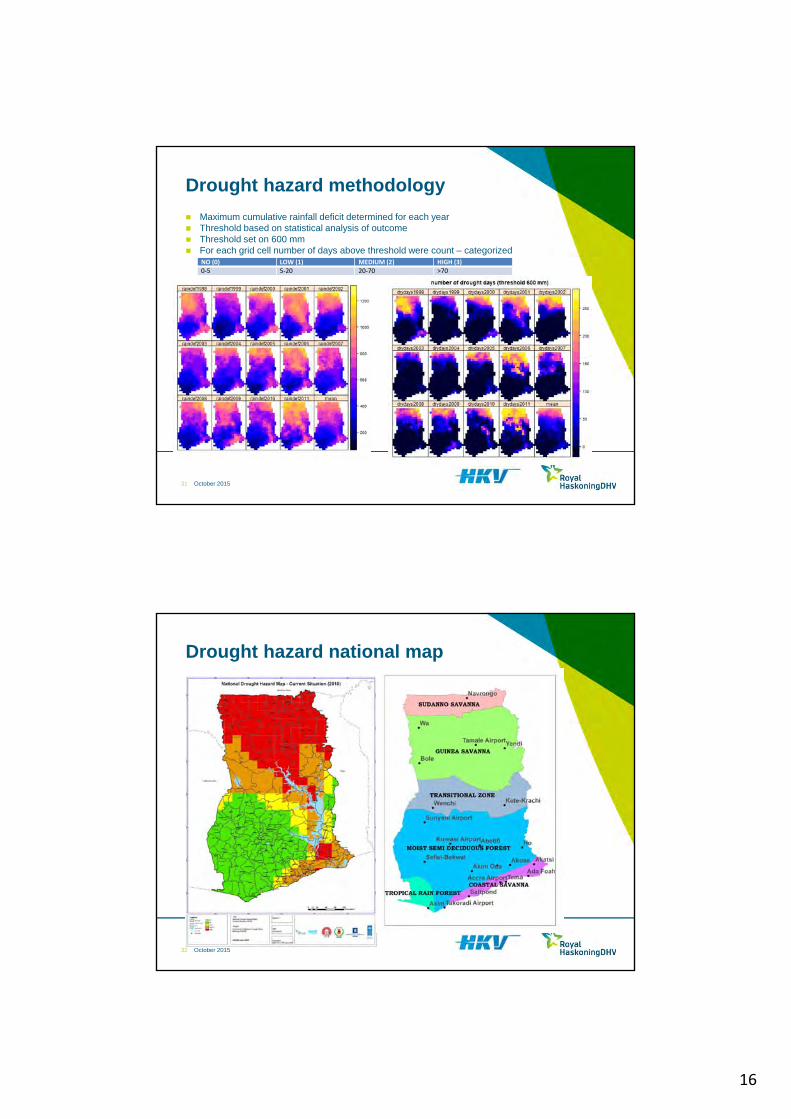
October 2015
Drought hazard methodology
Maximum cumulative rainfall deficit determined for each year Threshold based on statistical analysis of outcome Threshold set on 600 mm For each grid cell number of days above threshold were count – categorized
31
NO (0) LOW (1) MEDIUM (2) HIGH (3)0‐5 5‐20 20‐70 >70
October 2015
Drought hazard national map
32

17
October 2015
Drought vulnerability methodology
Methodology comparable to vulnerability floods
Characteristics: land use
Damaging effects: no or less harvest (drought)
Input data: FAO land use map - classification per land use type Urban areas from open street map – urban areas have ‘no’ vulnerability to drought District level: more detailled outline of urban areas (and thus no drought vulnerability)
33
October 2015
Drought vulnerability national map
Checked with Atlas for Ghana (cashcrops – geographical pattern)
34

18
October 2015
Drought risk methodology
Risk = hazard x vulnerability / capacity Capacity: current situation = 1 (reference situation)
35
October 2015
Future climate – drought hazard
New timeseries for daily rainfall and daily ET based on climate scenario
Climate zones change annual rainfall change annual ET
36

19
October 2015
Future climate – drought hazard
There is change but this is not reflected in the hazard categorization (no-low-medium-high)
37
October 2015
Future climate – drought vulnerability
Land use change Urbanization; future population density
38

20
October 2015
Future climate – drought risk
39
October 2015
Lunch break
40
Risk Assessment Basics
Time Topic readings Course material
9.00 – 9.30 Welcome
Introduction to the day
Hand outs of
presentation
9.30 – 10.00 Risk assessment and early warning:
coherence between courses
10.00 – 11.00 Presentation of the concept of hazard,
vulnerability, capacity and risk mapping
Risk assessment and
mapping national
level
11.00 – 11.30 Short break
11.30 – 12.30 Continue methodology
Presentation of the National level maps
12.30 – 13.30 Lunch break
13.30 – 14.00 Introduction of the pilot level maps
14.00 – 15.30 Presentation of pilot level maps and
workshop
15.30 – 16.00 Short break
16.00 – 16.15 Outlook to course day 2
16.15 – 17.00 Discussion and Closure
21
October 2015
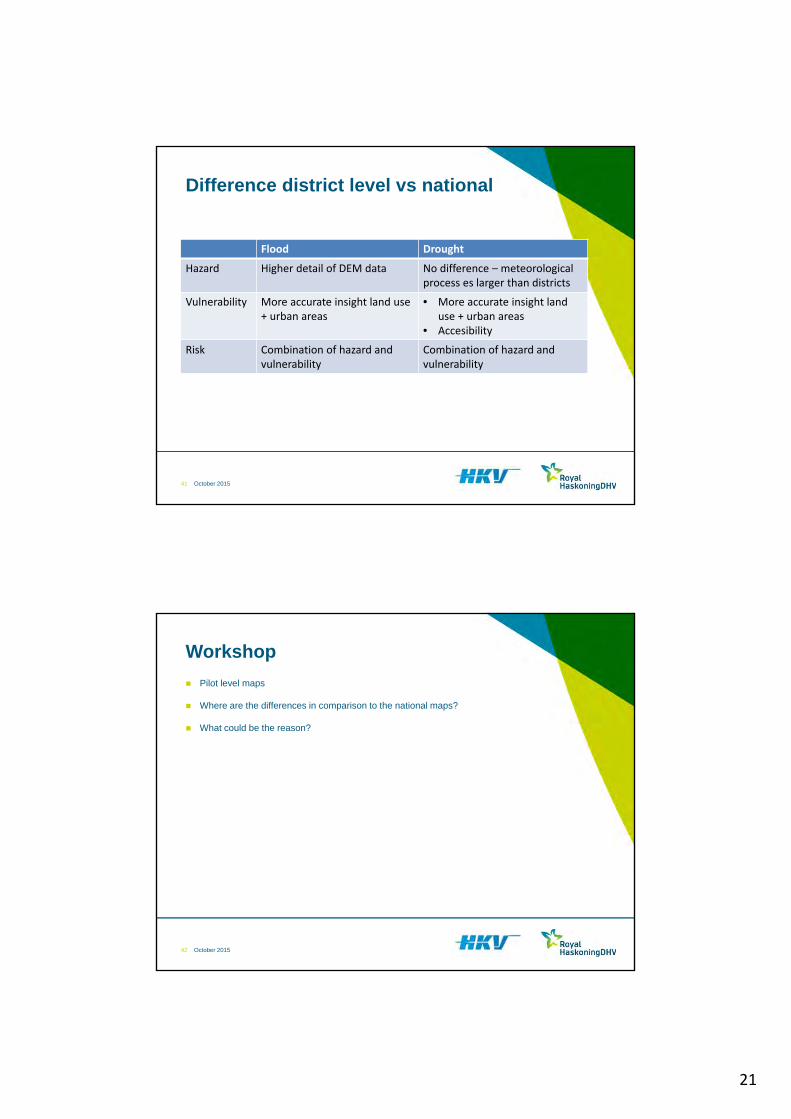
Difference district level vs national
Flood Drought
Hazard Higher detail of DEM data No difference – meteorological process es larger than districts
Vulnerability More accurate insight land use+ urban areas
• More accurate insight land use + urban areas
• Accesibility
Risk Combination of hazard andvulnerability
Combination of hazard andvulnerability
41
October 2015
Workshop
Pilot level maps
Where are the differences in comparison to the national maps?
What could be the reason?
42

22
October 2015
Learning objectives today
Why is risk assessment important?
Concept of hazard, vulnerability, capacity and risk
Interpretation of the produced maps
How to use these maps
Need for regular updates
Tasks and responsibilities
43
October 2015
Interpretation flood hazard maps
The HAND method only takes into account the physical parameters within the catchment: the upstream area and the height and distance from the drainage system.
What can be causes for differences between maps and reality?
Mainly due to impact of local drainage systems: small drainage systems are not properly represented in the (coarse) DEM data and
can reduce the flood hazard because in reality there is more drainage capacity Clogged drainage or badly constructed systems can increase the risk of local
flooding which is not taken into account by the HAND method.
44

23
October 2015
Interpretation flood hazard maps
Hazard maps are static. The following aspects which are not incorporated in the HAND-method, but have an impact on flood hazard occurrence:
Rainfall: Whether a hazard really occurs depends on the rainfall characteristics. This is part of the information in the early warning system
Reservoir spills: besides rainfall, spilling from reservoirs is another important cause of flooding. It is adviced to incorporate this in the early warning system in future, mainly for: The Northern White Volta, threatened by spilling from the Bagre dam in Burkina
Faso Southern White Volta, due to spilling from the Akosombo dam. Bui dam in the West.
Surface type: In areas where there is hardly any infiltration (e.g. hard rock, paved areas), response times are increased and floods will occur more quickly and frequently compared to areas where infiltration is possible. This is the case for example in Accra. This is incorporated in the early warning system
45
October 2015
Interpretation drought hazard map
Drought definition is based on meteorological drought Access to alternative water sources (surface water) only taken into account in pilot
level maps In reality also groundwater level and soil type have influence on water availability for
plants
46

24
October 2015
Learning objectives today
Why is risk assessment important?
Concept of hazard, vulnerability, capacity and risk
Interpretation of the produced maps
How to use these maps
Need for regular updates
Tasks and responsibilities
47
October 2015
How to use these maps in practice?
Maps are essential part within Early Warning System
Early Warning System – course day 3
Already a glance
48

25
October 2015
Maps identify the hotspots
Example flood warning in Techiman
49
High priority area. Flood warningactive
Medium priority area. Threat of flood
Reponse
October 2015
Warning procedures
EWS gives warning alert for both droughts and floods
Maps gives locations of the highest flood and drought risks within the district
Local Nadmo staff should focus on these high risk areas:
In case of flood (fast process) Take precautionary measures (e.g. local dams); Warn people to evacuate, harvest crops or move belongings
In case of drought (slow process) Warning should be identification to seek for alternative water resources Be careful with water use Decide to harvest earlier Request aid in case threat of famine
50

26
October 2015
Learning objectives ..tomorrow
Why is risk assessment important?
Concept of hazard, vulnerability, capacity and risk
Interpretation of the produced maps
How to use these maps
Need for regular updates
Tasks and responsibilities
51
October 2015
Cyclic updates
Following changes are to be expected: Natural development (population growth, climate change) Socio-economical developments (e.g. urbanisation, industrialisation) Implementation of mitigation measures (structural and non structural) More detailed data of parameters – input for maps (land use, elevation)
We recommend a cyclic update of once every 6 years Following international standards like ‘European Flood Directive’ Incorporate in policy – sustainable approach
Every update: Collect new data Take in account new methodologies/strategies Use experience / reviews from local nadmo offices and communities Consider adding additional districts
52

27
October 2015
Tasks and responsibility
53
Nadmo head office
Nadmo regional office
Local district office
Community
maps
• Policy for cyclic update• Collection of new data/approaches• Contact with regional office
• Execute policy• Contact with local district office• Deccision about additional districts
• Execute policy• Contact with communities• Collect data and input of communities
• Review the risk maps• Communicate changes / measures with
local Nadmo officers
October 2015
Capacity
Capacity is all about institutional and organisational strength.
To assess and quantify the capacity based on the preparedness of the NADMO district offices, it is suggested to put in place a procedure that stimulates and challenges NADMO district staff to increase the local capacity.
54

28
October 2015
Capacity
The procedure comprises the following elements: Prepare a list with phone numbers of all relevant agencies that play a role during an
event, also define procedures on how to communicate in case phone is not working. Make an inventory of the number of hospital beds. Make an inventory of the number of fire trucks. Make an assessment of the number of police men that can assist during an event. Make an inventory of suitable evacuation routes and disseminate these among
potential affected residents. Identify potential safe havens during floods. Keep track of the availability of emergency supplies Test public communication means (sirens, speaker systems) regularly, test and verify
communication lines with related agencies. Organizes drills (e.g. once or twice a year). Ensure the presence of EWS and trained personnel. Develop and implement a protocol to (yearly) test and update this assessment and
report the outcomes to either the regional or the central NADMO office.
55

1
Risk Assessment
Advanced Course
Hanneke SchuurmansOctober 2015
October 2015
Overview Course program
2
Date Course Venue
Mon 12 October 2015 Risk Assessment Basic (course) full day HotelTue 13 October 2015 Risk Assessment Advanced (workshop) full day Hotel
Wed 14 October 2015 EWS Concepts (course) full day HotelThu 15 October 2015 EWS Operations (workshop) full day HotelFri 16 October 2015 Disaster Database Management (workshop) half day HotelFri 16 October 2015 Strategic/Tactical Level Overview (course) half day Hotel

2
October 2015
Today
3
Risk Assessment Basics
Time Topic readings Course material
9.00 – 9.30 Introduction to the day Hand outs of
presentation
9.30 – 10.30 Recap concepts, need for regular update,
tasks and responsibilities
Risk assessment and
mapping pilot level
pilot risk maps
10.30 – 11.00 Introduction ArcGIS, mapping database Usb stick computer
11.00 – 11.30 Short break
11.30 – 12.30 Continue ArcGis, mapping database computer
12.30 – 13.30 Lunch break
13.30 – 16.30 Hands on training exercises computer
16.30 – 16.45 Outlook to course day 3
16.45 – 17.00 Closure
October 2015
Learning objectives today
Recap of yesterday Need for regular updates Tasks and responsibilities definitions
Hands-on training Produce new pdf’s Adjust maps
Hazard Vulnerability
Produce new risk maps VERSION CONTROL
Improved understanding about the methodology behind risk assessment the need for risk mapping Necessity of updating the maps Your own role
4

3
October 2015
The need for risk assessment
Better information leads to better decisions
Improve the tasks of NADMO
A way to become more pro-active in disaster response: focus on the high risk areas
Essential for environmental policy and planning e.g. no urban development in high flood risk areas; Long term planning of agricultural activities
5
Data Information Decisions
October 2015
Cyclic updates
Following changes are to be expected: Natural development (population growth, climate change) Socio-economical developments (e.g. urbanisation, industrialisation) Implementation of mitigation measures (structural and non structural) More detailed data of parameters – input for maps (land use, elevation)
We recommend a cyclic update of once every 6 years Following international standards like ‘European Flood Directive’ Incorporate in policy – sustainable approach
Every update: Collect new data Take in account new methodologies/strategies Use experience / reviews from local nadmo offices and communities Consider adding additional districts
6

4
October 2015
Tasks and responsibility
7
Nadmo head office
Nadmo regional office
Local district office
Community
maps
• Policy for cyclic update• Collection of new data/approaches• Contact with regional office
• Execute policy• Contact with local district office• Deccision about additional districts
• Execute policy• Contact with communities• Collect data and input of communities
• Review the risk maps• Communicate changes / measures with
local Nadmo officers
October 2015
Recap - Definitions
Hazard: A dangerous phenomenon, substance, human activity or condition that may cause loss of life, injury or other health impacts, property damage, loss of livelihoods and services, social and economic disruption, or environmental damage.
Vulnerability: The characteristics and circumstances of a community, system or asset that make it susceptible to the damaging effects of a hazard.
Capacity: The combination of all the strengths, attributes and resources available within a community, society or organization that can be used to achieve agreed goals
Risk: The combination of the probability of an event and its negative consequences.
As defined in the CREW programme, disaster risk can be shown as: Disaster risk = hazard * vulnerability / capacity
This methodology is applied to floods and droughts
8

5
October 2015
Flood risk methodology
Risk = hazard x vulnerability / capacity Capacity: current situation = 1 (reference situation)
9
October 2015
Drought risk methodology
Risk = hazard x vulnerability / capacity Capacity: current situation = 1 (reference situation)
10

6
October 2015
Capacity
Capacity is all about institutional and organisational strength.
To assess and quantify the capacity based on the preparedness of the NADMO district offices, it is suggested to put in place a procedure that stimulates and challenges NADMO district staff to increase the local capacity.
11
October 2015
Capacity
The procedure comprises the following elements: Prepare a list with phone numbers of all relevant agencies that play a role during an
event, also define procedures on how to communicate in case phone is not working. Make an inventory of the number of hospital beds. Make an inventory of the number of fire trucks. Make an assessment of the number of police men that can assist during an event. Make an inventory of suitable evacuation routes and disseminate these among
potential affected residents. Identify potential safe havens during floods. Keep track of the availability of emergency supplies Test public communication means (sirens, speaker systems) regularly, test and verify
communication lines with related agencies. Organizes drills (e.g. once or twice a year). Ensure the presence of EWS and trained personnel. Develop and implement a protocol to (yearly) test and update this assessment and
report the outcomes to either the regional or the central NADMO office.
12

7
October 2015
And now…
13
October 2015
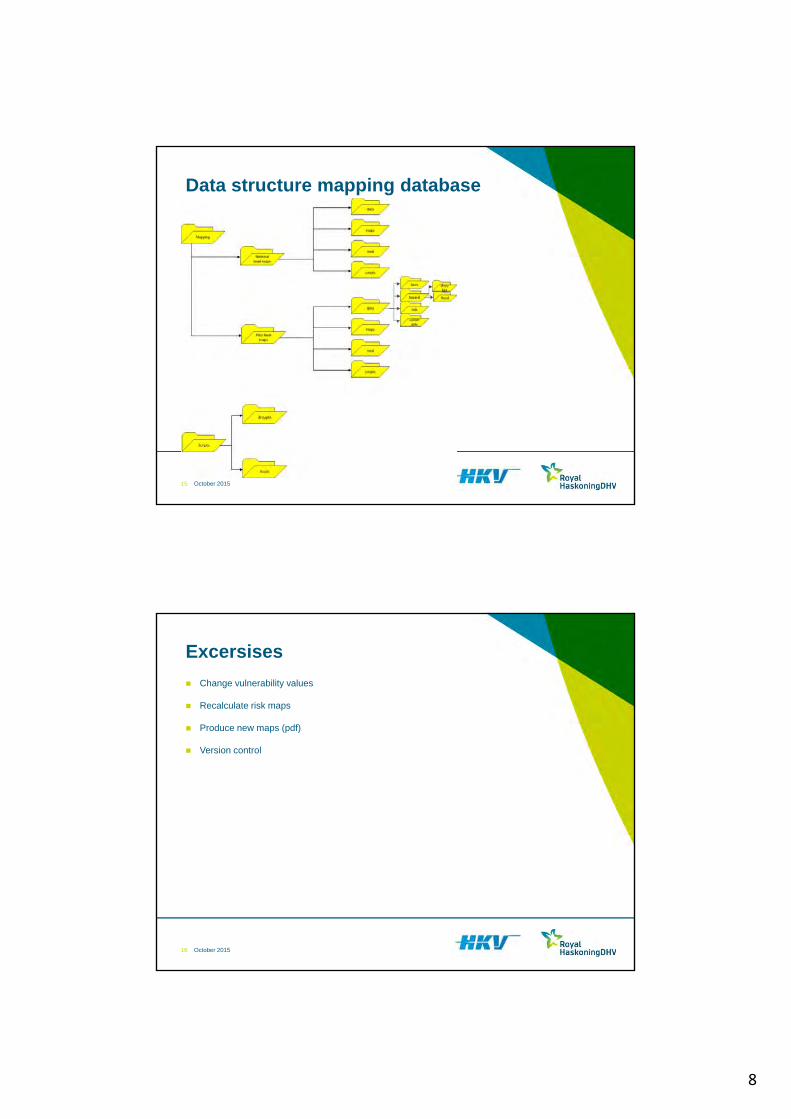
Excercises
Data structure Produce maps (pdf’s) Adjust the maps
Hazard vulnerability
Recalculate risk maps
14
8
October 2015
Data structure mapping database
15
October 2015
Excersises
Change vulnerability values
Recalculate risk maps
Produce new maps (pdf)
Version control
16

9
October 2015
Today
17
Risk Assessment Basics
Time Topic readings Course material
9.00 – 9.30 Introduction to the day Hand outs of
presentation
9.30 – 10.30 Recap concept s, need for regular update,
tasks and responsibilities
Risk assessment and
mapping pilot level
pilot risk maps
10.30 – 11.00 Introduction ArcGIS, mapping database Usb stick computer
11.00 – 11.30 Short break
11.30 – 12.30 Continue ArcGis, mapping database computer
12.30 – 13.30 Lunch break
13.30 – 16.30 Hands on training exercises computer
16.30 – 16.45 Outlook to course day 3
16.45 – 17.00 Closure
October 2015
Outlook to next course
Mapping: static – assessment of the risk profiles Based on general approaches and climatological data
Early warning system: current status of system. Risk maps are needed to make the proper local interpretation
18
TRAINING COMPONENT Subject
1 RISK ASSESSMENT BASICS (COURSE) mapping2 RISK ASSESSMENT ADVANCED (WORKSHOP) mapping3 GIS‐BASED DISASTER DATABASE MANAGEMENT (WORKSHOP) Future improvements – feedback loop
4 EWS CONCEPTS (COURSE) Early warning
5 EWS OPERATIONS (WORKSHOP) Early warning
6 STRATEGIC/TACTICAL LEVEL OVERVIEW (COURSE) Institutional corporation – future improvements
7 LOCAL TRAINING Awareness within communities
Data Information Decisions

10
October 2015
How to use these maps in practice?
Maps are essential part within Early Warning System
Early Warning System
Already a glance
19
October 2015
Warning procedures
EWS gives warning alert for both droughts and floods
Maps gives locations of the highest flood and drought risks within the district
Local Nadmo staff should focus on these high risk areas:
In case of flood (fast process) Take precautionary measures (e.g. local dams); Warn people to evacuate, harvest crops or move belongings
In case of drought (slow process) Warning should be identification to seek for alternative water resources Be careful with water use Decide to harvest earlier Request aid in case theat of famine
20

11
October 2015
Thanks and…
21

1
Early Warning System
Basic Course
Job UdoOctober 2015
Title | 07 July 2015
Training hindcast and forecast
2
Hindcast Flood and drought disaster concepts were explained Advantages and use of flood and drought maps were explained Hands on training to update flood and drought maps Roles, responsibilities and procedures in risk assessment were
discussed
Forecast Today will be focussed on early warning concepts Risk assessment knowledge is needed to interpret, operate and
use early warning Advantages and use of early warning Risk maps and early warning Hands-on training in web based early warning tool Roles, responsibilities and procedures in web based early warning

2
Title | 07 July 2015
Maps in Early Warning
3
High priority area. Flood warningactive
Medium priority area. Threat of flood
Reponse
Example flood warning in TechimanFlood risk map
Title | 07 July 2015
Today
4
EWS conceptsTime Topic readings Course material Presenter9.00 – 9.30 Get to know
Introduction to the dayHandouts of presentation
9.30 – 10.00 Presentation of EWS conceptsInternational examples
10.00 – 10.30 Presentation and discussion on EWS‐CREW concepts, data, functionality and conditions: general
Masterplan
10.30 – 11.00 Short break11.00 – 12.30 Presentation and discussion
on EWS‐CREW concepts, data, functionality and conditions: general
12.30 – 13.30 Lunch-break13.30 – 16.30 Hands‐on training with web‐
EWS (including procedure)Internet and computers
16.30 – 17.00 Discussion and closure

3
Title | 07 July 2015
EWS Concepts
5
Early Warning System (UNISDR)The set of capacities needed to generate and disseminate timely and meaningful warning information to enable individuals, communities and organizations threatened by a hazard to prepare and to act appropriately and in sufficient time to reduce the possibility of harm or loss.
EWS CREW Goal of the early warning system is to create the essential time for authorities and communities to react to a developing disaster, which can be either flood or drought related.
Title | 07 July 20156
EWS Concepts

4
Title | 07 July 20157
EWS Concepts
Data: • Meteorology• Hydrology
Title | 07 July 20158
EWS Concepts
T0
Hazard
Date

5
Title | 07 July 20159
EWS Concepts
T0
Hazard
Date
History Future
T0
Hazard
Date
History Future
Title | 07 July 201510
EWS Concepts

6
Title | 07 July 201511
EWS Concepts
?? ?? ??
Data Models Thresholds
??
Measures
Title | 07 July 201512
International Examples: lessons learnt
Focus on different aspects based on other early warningsystems.

7
Title | 07 July 201513
International Examples: the Netherlands
The Netherlands is under flood threat from both rivers as well as the sea:
Title | 07 July 201514
International Examples: the Netherlands
When the sea water level is too high, a storm surge barriercloses:

8
Title | 07 July 201515
Forecasting Examples: The Netherlands
National Centre for Water Management
Royal National Meteorological Institute
Countries upstream
- Provinces- Municipalities- Waterboards- Civil securities- Public
The inflow from the major rivers is forecasted at the country border in close cooperation with other countries in theriver basin
Title | 07 July 2015
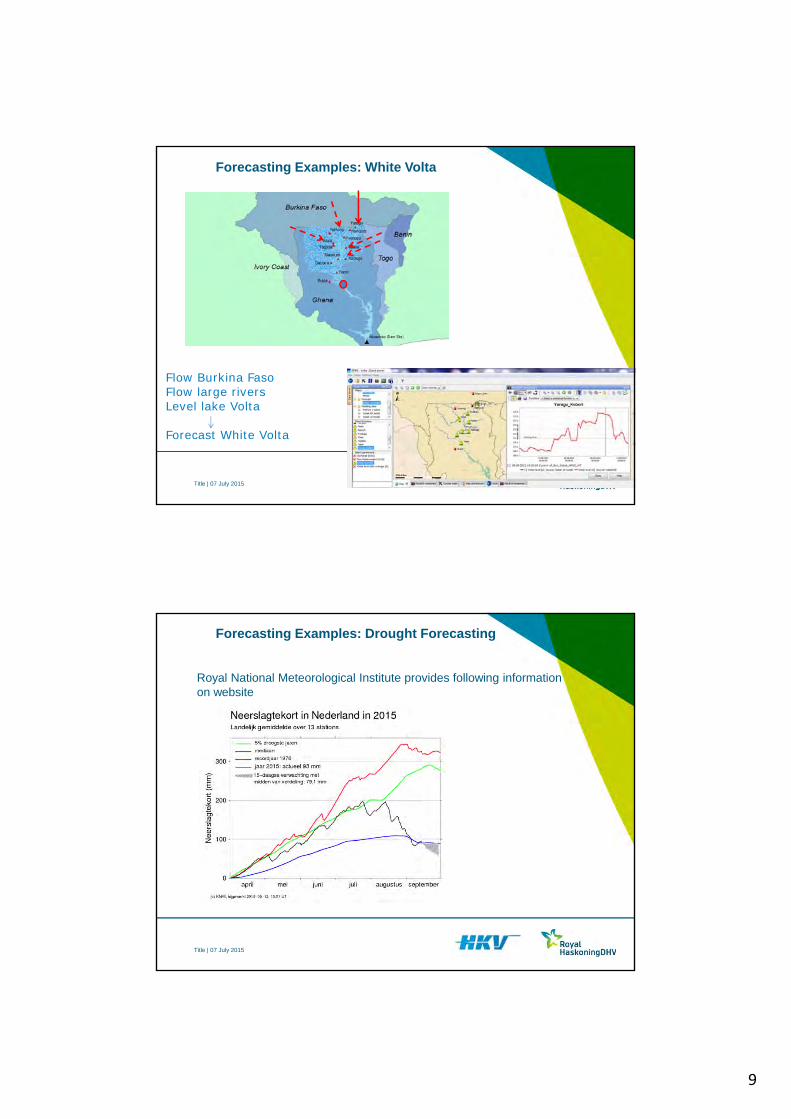
Forecasting Examples: White Volta
Flow Burkina FasoFlow large riversLevel lake Volta
Forecast White Volta
9
Title | 07 July 2015
Forecasting Examples: White Volta
Flow Burkina FasoFlow large riversLevel lake Volta
Forecast White Volta
Title | 07 July 2015
Forecasting Examples: Drought Forecasting
Royal National Meteorological Institute provides following informationon website

10
Title | 07 July 201519
Irrigation advise
Title | 07 July 2015
Forecasting Examples: Infrastructure
Crisis centres:• Converge information• Effective and efficient
decision making• Central coordination on
different levels

11
Title | 07 July 2015
Forecasting Examples: Essentials
What are essential elements for effective flood and drought forecasting?
Title | 07 July 2015
Forecasting Examples: Essentials
What are essential elements for effective flood and drought forecasting?
Always operational• Robust• Crisis proof: stable operation, 24/7 accesible• Aways operational: generator, back-up, maintenance and support
Accuracy versus lead time• Understand the system and disaster processes• Evaluation and validation for improvement
Swift action• Clear responsibilities and procedures• Training • Emergency plans• Tools (phone, satellite)• Preparedness
Other?

12
Title | 07 July 201523
Conditions for EWS-CREW
• Focus on high operational percentage• Basic forecast always available• Where possible improvements should be made related to district
specific problems
Data Models Thresholds Measures
Title | 07 July 201524
Conditions for EWS-CREW
• Focus on high operational percentage• Basic forecast always available• Where possible improvements should be made related to district
specific problems
Data Models Thresholds Measures
13
Title | 07 July 2015
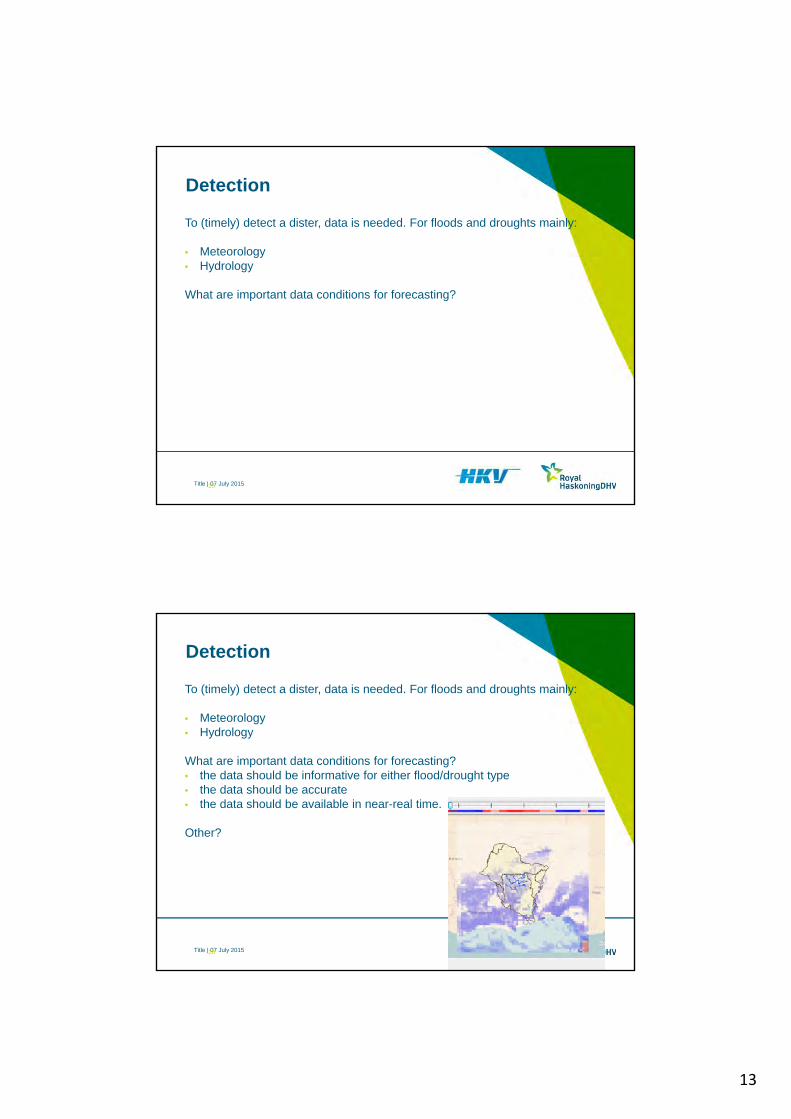
Detection
25
To (timely) detect a dister, data is needed. For floods and droughts mainly:
• Meteorology• Hydrology
What are important data conditions for forecasting?
Title | 07 July 2015
Detection
26
To (timely) detect a dister, data is needed. For floods and droughts mainly:
• Meteorology• Hydrology
What are important data conditions for forecasting?• the data should be informative for either flood/drought type• the data should be accurate • the data should be available in near-real time.
Other?

14
Title | 07 July 2015
Detection
27
What types of floods that can cause a disaster can be considered andwhat are the characteristics in terms of:• Scale• Time• Impact
Title | 07 July 2015
Detection
28
What types of floods that can cause a disaster can be considered andwhat are the characteristics in terms of scale, time and impact? • Flash floods
• Fast reaction (hours), difficult to predict• Very destructive on local scale• Accra
• Medium sized floods• Floods can be detected, days• Regional scale, mitigation possible if response is timely taken• Tordzi
• Large floods• Floods can be detected, days or even weeks• National or international, mitigation possible, but difficult
because of the scale• White Volta
15
Title | 07 July 2015
Detection
29
What types of droughts that can cause a disaster can be consideredand what are the characteristics in terms of scale, time and impact?
Title | 07 July 2015
Detection
30
What types of droughts that can cause a disaster can be consideredand what are the characteristics in terms of scale, time and impact? • No drought types (We consider meteorological drought)• We consider drought as the `slow killer` -> trend analysis!• However the impact and scale can be enormous.
• Other droughts definitions are agricultural droughts andhydrological droughts
16
Title | 07 July 2015
Detection
31
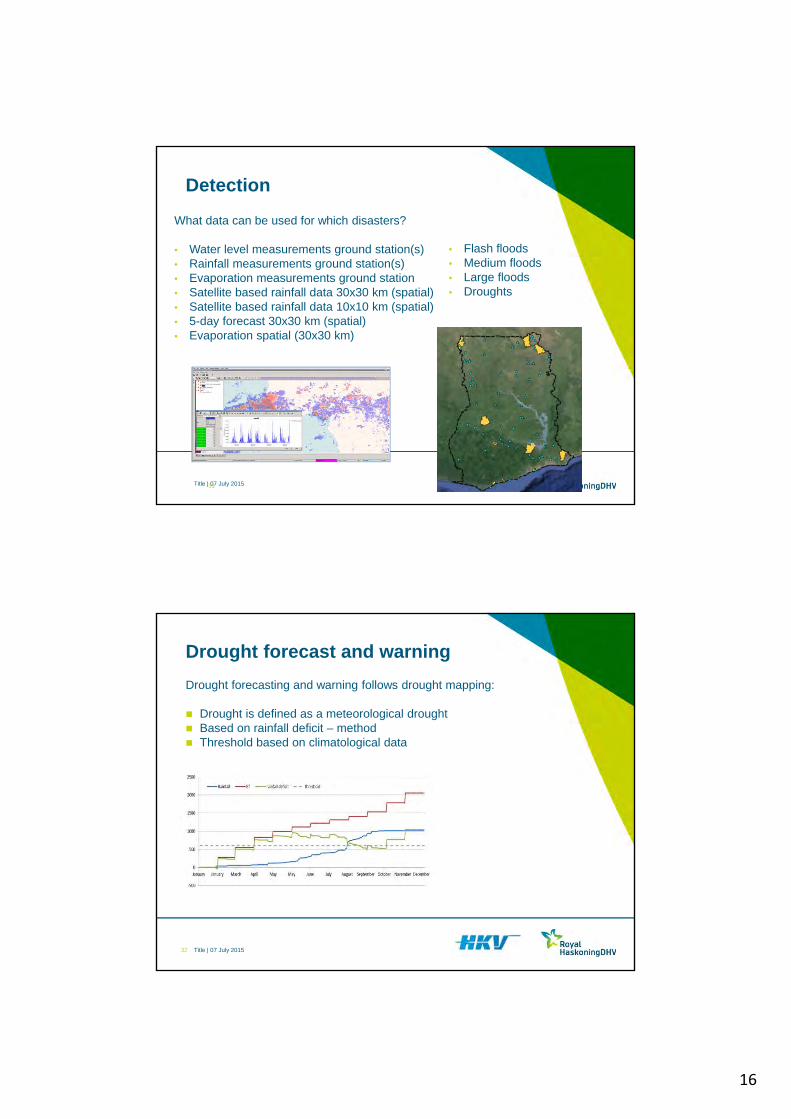
What data can be used for which disasters?
• Water level measurements ground station(s)• Rainfall measurements ground station(s)• Evaporation measurements ground station• Satellite based rainfall data 30x30 km (spatial)• Satellite based rainfall data 10x10 km (spatial)• 5-day forecast 30x30 km (spatial)• Evaporation spatial (30x30 km)
• Flash floods• Medium floods• Large floods• Droughts
Title | 07 July 201532
Drought forecast and warning
Drought forecasting and warning follows drought mapping:
Drought is defined as a meteorological drought Based on rainfall deficit – method Threshold based on climatological data

17
Title | 07 July 201533
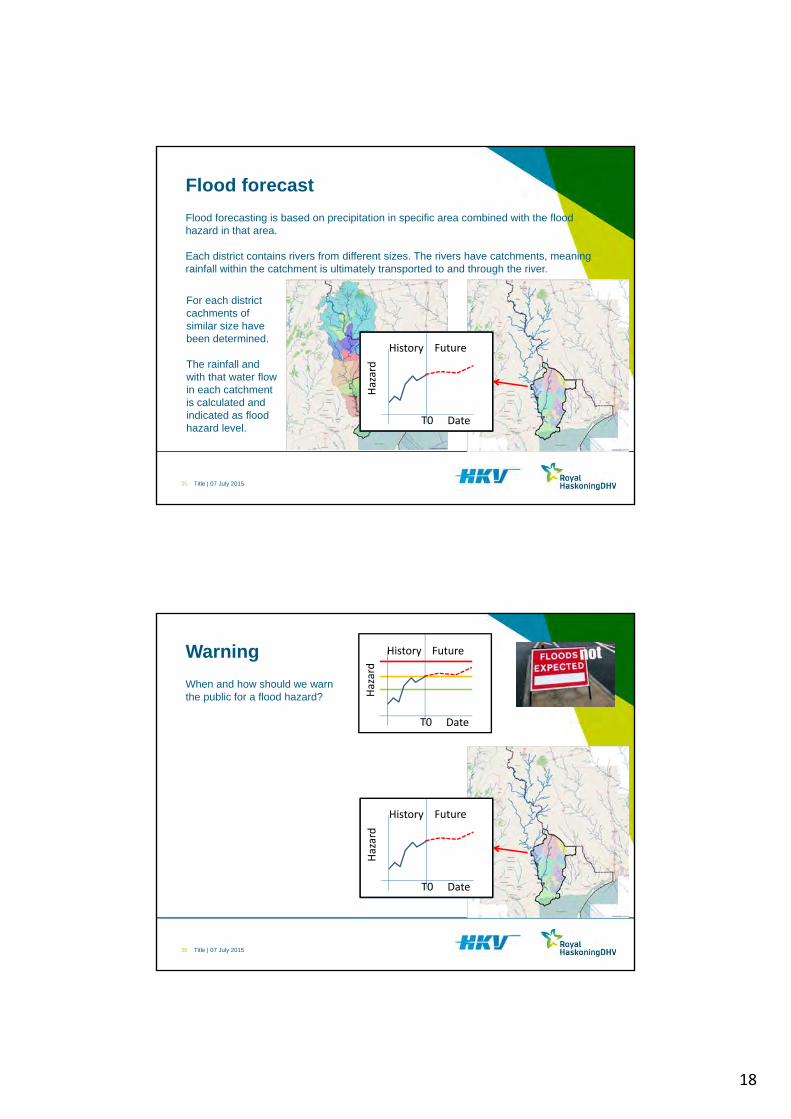
Flood forecast
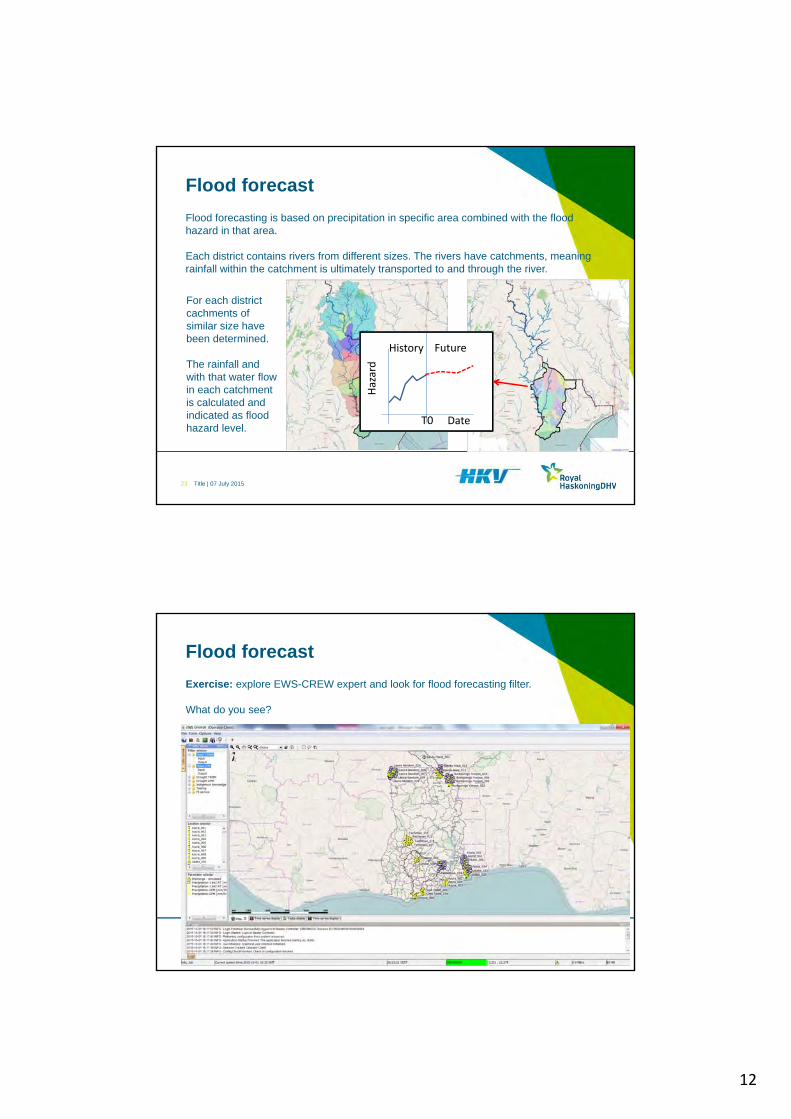
Flood forecasting is based on precipitation in specific area combined with the floodhazard in that area.
Each district contains rivers from different sizes. The rivers have catchments, meaningrainfall within the catchment is ultimately transported to and through the river.
Title | 07 July 201534
Flood forecast
Flood forecasting is based on precipitation in specific area combined with the floodhazard in that area.
Each district contains rivers from different sizes. The rivers have catchments, meaningrainfall within the catchment is ultimately transported to and through the river.
For each district cachments of similar size have been determined.
18
Title | 07 July 2015
Flood forecasting is based on precipitation in specific area combined with the floodhazard in that area.
Each district contains rivers from different sizes. The rivers have catchments, meaningrainfall within the catchment is ultimately transported to and through the river.
35
Flood forecast
For each district cachments of similar size have been determined.
The rainfall andwith that water flow in each catchmentis calculated andindicated as floodhazard level.
T0
Hazard
Date
History Future
Title | 07 July 201536
Warning
T0
Hazard
Date
History Future
T0
Hazard
Date
History Future
When and how should we warnthe public for a flood hazard?
19
Title | 07 July 201537
Warning
T0
Hazard
Date
History Future
T0
Hazard
Date
History Future
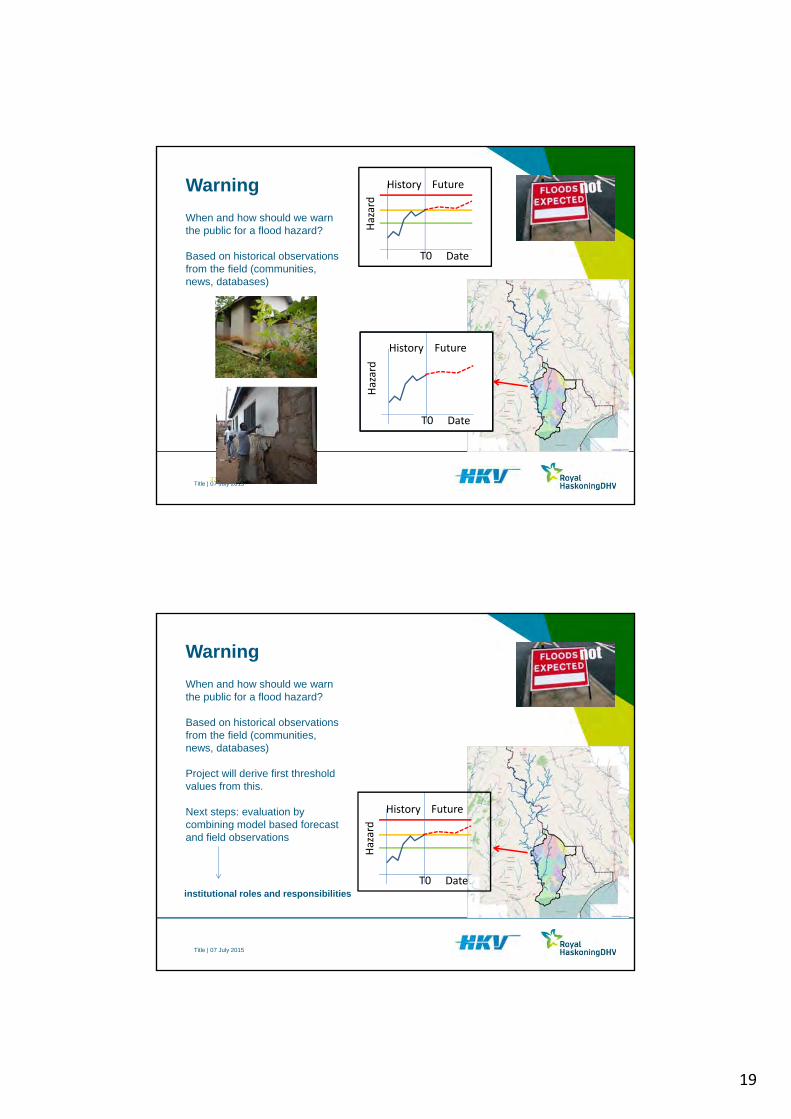
When and how should we warnthe public for a flood hazard?
Based on historical observationsfrom the field (communities, news, databases)
Title | 07 July 2015
Warning
T0
Hazard
Date
History Future
When and how should we warnthe public for a flood hazard?
Based on historical observationsfrom the field (communities, news, databases)
Project will derive first thresholdvalues from this.
Next steps: evaluation bycombining model based forecast and field observations
institutional roles and responsibilities

20
Title | 07 July 2015
Response general
What to do with a flood or drought warning?
Project: Clarify area at risk expert judgement of the warning disseminate to the proper stakeholders
Future: take specific actions (based on assessment and trainings)
Title | 07 July 2015
Drought response
How to react on a drought warning?

21
Title | 07 July 2015
Drought response
How to react on a drought warning?• Warning should be identification to seek for alternative water resources• Be careful with water use• Decide to harvest earlier• Request aid in case threat of famine
Title | 07 July 2015
Response flood
T0
Hazard
Date
History Future
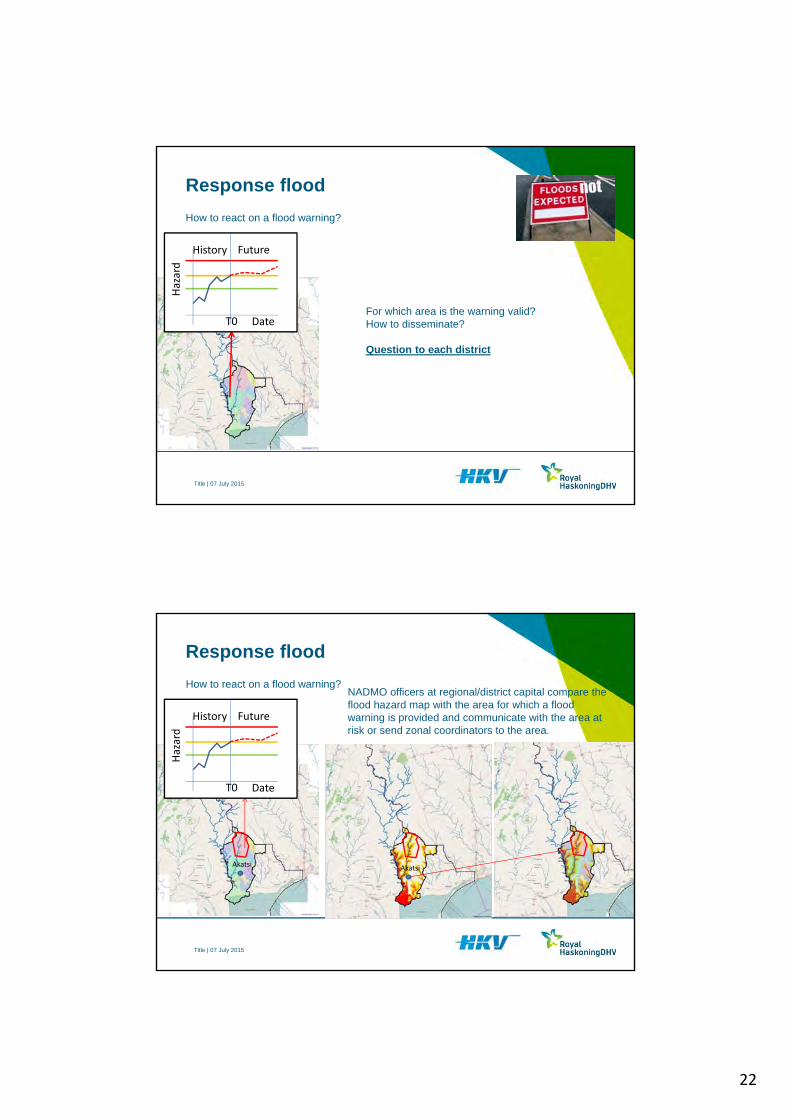
How to react on a flood warning?
22
Title | 07 July 2015
Response flood
T0
Hazard
Date
History Future
How to react on a flood warning?
For which area is the warning valid?How to disseminate?
Question to each district
Title | 07 July 2015
Response flood
T0
Hazard
Date
History Future
How to react on a flood warning?
Akatsi Akatsi
NADMO officers at regional/district capital compare the flood hazard map with the area for which a floodwarning is provided and communicate with the area at risk or send zonal coordinators to the area.

23
Title | 07 July 201545
Indigenous knowledge
EWS-CREW is a science based forecasting system Communities have their own methods of predicting flood problems or
droughts through so-called indigenous knowledge indicators EWS-CREW will enable reporting of flood or drought indicators for
validation purposes
Title | 07 July 201546
Indigenous knowledge
EWS-CREW is a science based forecasting system Communities have their own methods of predicting flood problems or
droughts through so-called indigenous knowledge indicators EWS-CREW will enable reporting of flood or drought indicators for
validation purposes Who can provide examples of indigenous knowledge?

24
Title | 07 July 201547
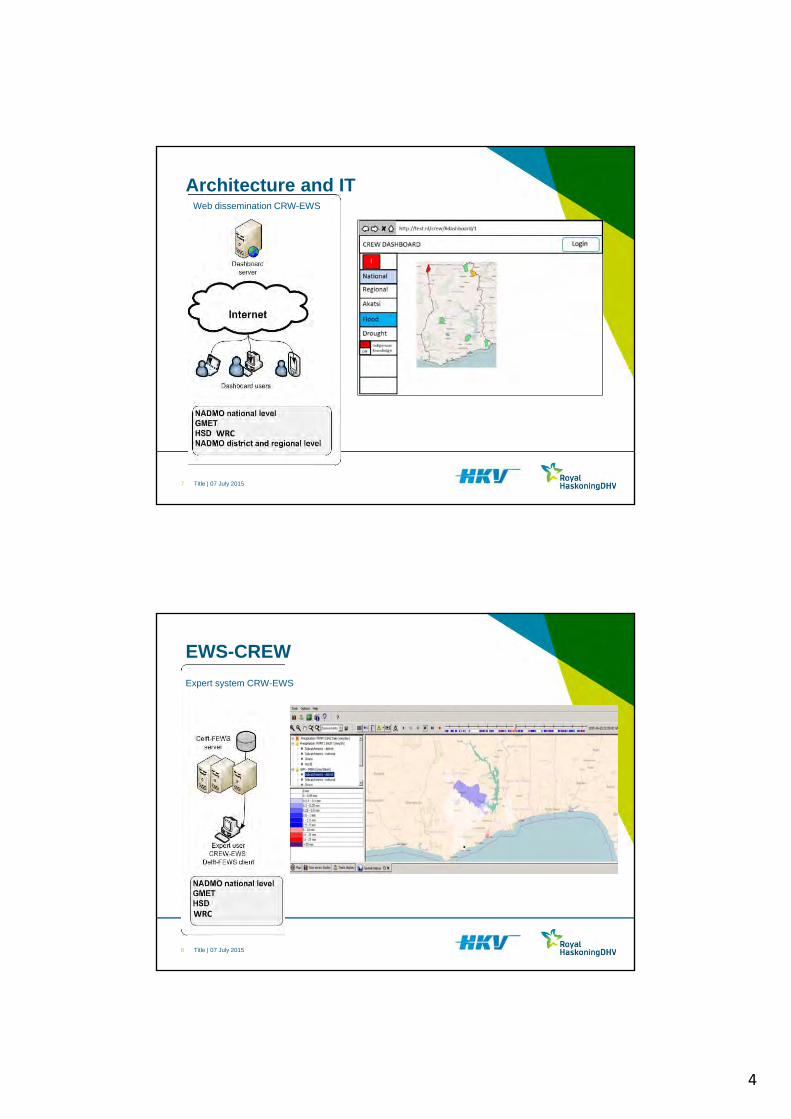
Architecture and IT
Expert system CRW-EWS
WRC
Title | 07 July 201548
Architecture and ITWeb dissemination CREW-EWS
WRC

25
Title | 07 July 201549
Architecture and IT
Communities
WRCWRC
Title | 07 July 2015
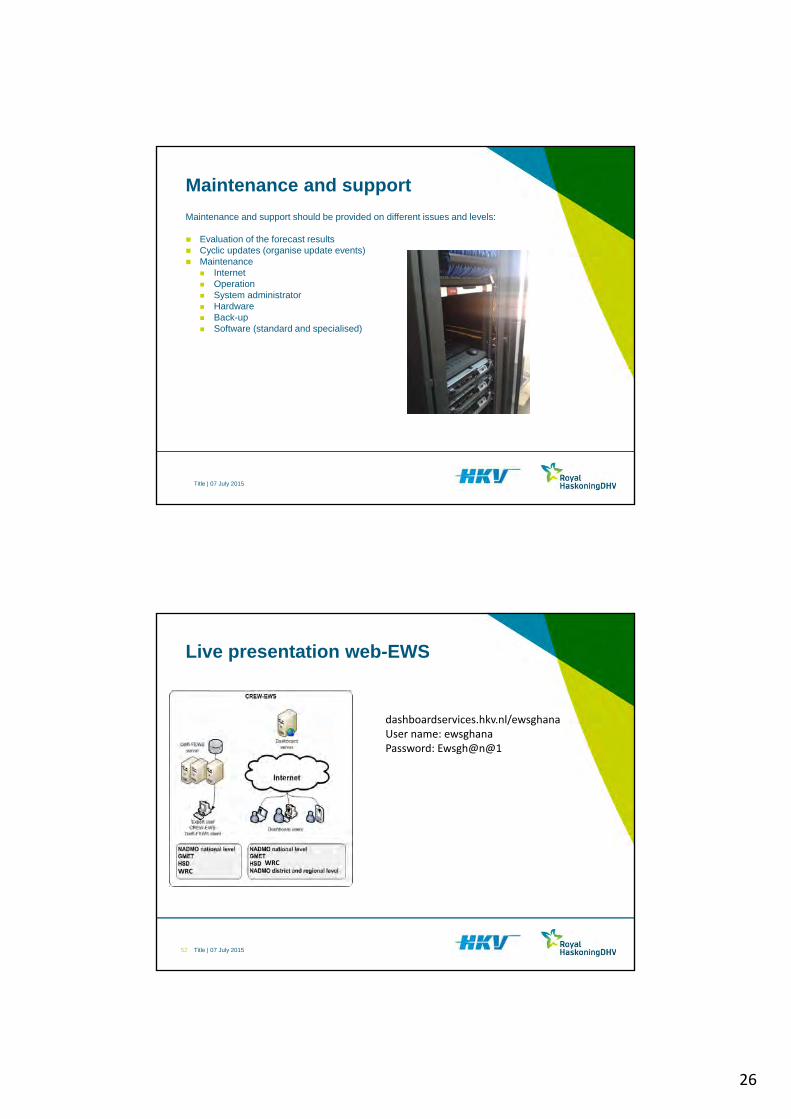
Maintenance and support
Maintenance and support should be provided on different issues and levels:
Evaluation of the forecast results
Example:EWS CREW provides a flood warningLocal officials should evaluate if the warning is valid in terms of timing and severtityLocal officials should report back to NADMO head office and GMET/HSD specialists ifthe field observation showed- Similarities to the warning -> do nothing- Nothing -> set threshold higher- Much larger floods -> set threshold lower
T0
Hazard
Date
History Future
?
Product
Monitor
Update
Evaluate
26
Title | 07 July 2015
Maintenance and support
Maintenance and support should be provided on different issues and levels:
Evaluation of the forecast results Cyclic updates (organise update events) Maintenance
Internet Operation System administrator Hardware Back-up Software (standard and specialised)
Title | 07 July 201552
Live presentation web-EWS
dashboardservices.hkv.nl/ewsghanaUser name: ewsghanaPassword: Ewsgh@n@1
WRCWRC
27
Title | 07 July 201553
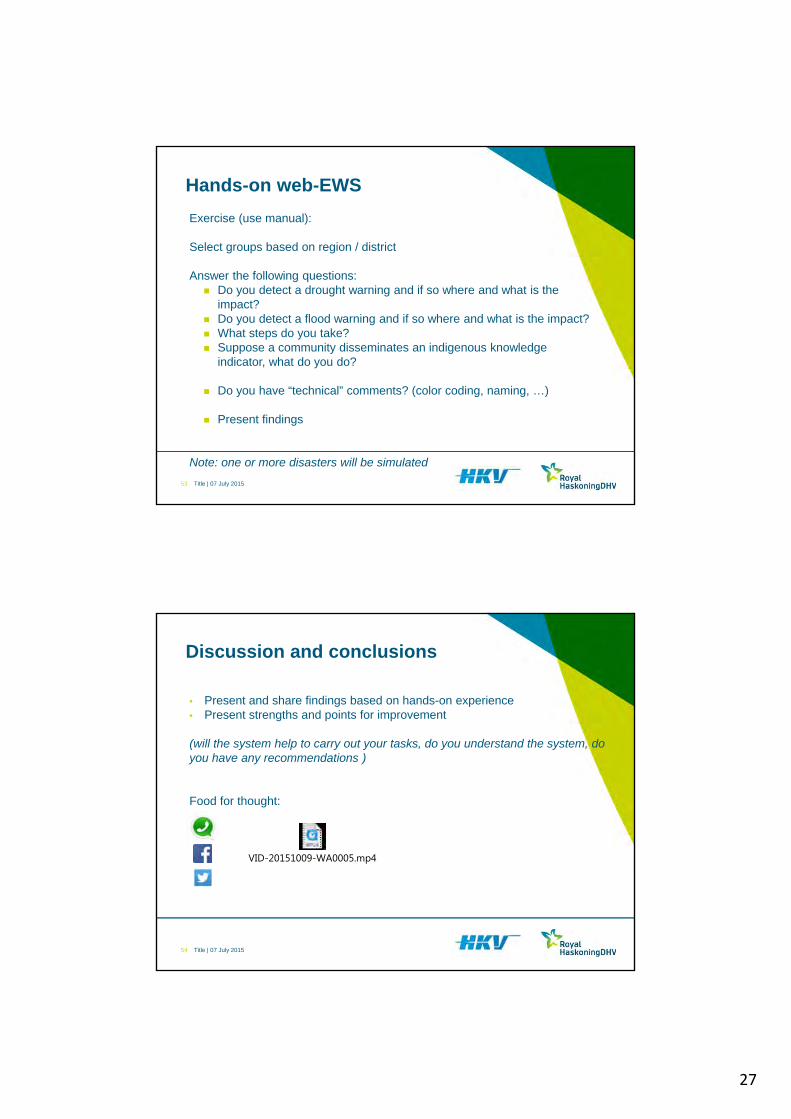
Hands-on web-EWS
Exercise (use manual):
Select groups based on region / district
Answer the following questions: Do you detect a drought warning and if so where and what is the
impact? Do you detect a flood warning and if so where and what is the impact? What steps do you take? Suppose a community disseminates an indigenous knowledge
indicator, what do you do?
Do you have “technical” comments? (color coding, naming, …)
Present findings
Note: one or more disasters will be simulated
Title | 07 July 201554
Discussion and conclusions
• Present and share findings based on hands-on experience• Present strengths and points for improvement
(will the system help to carry out your tasks, do you understand the system, do you have any recommendations )
Food for thought:
VID-20151009-WA0005.mp4

28
Title | 07 July 2015
Institutional
National level
Regionallevel
District level
Community level
Web Dashboard
NADMO
NADMO GMET HSD WRC
NADMO
NADMO
Title | 07 July 201556
Discussion and conclusions
• Present and share findings based on hands-on experience• Present strengths and points for improvement
(will the system help to carry out your tasks, do you understand the system, do you have any recommendations )

1
Early Warning System
Advanced course
Job UdoOctober 2015
Title | 07 July 20152
Discussion and conclusions
• Present and share findings based on hands-on experience• Present strengths and points for improvement
(will the system help to carry out your tasks, do you understand the system, do you have any recommendations )
Food for thought:
VID-20151009-WA0005.mp4
Amazing Flash Flood Footage - Extreme Flooding.mp4

2
Title | 07 July 2015
Training hindcast and forecast
3
Hindcast Early warning concepts explained Use of web tool explained and trained
Forecast Today early warning concepts in more (technical) detail Expert system is presented and explained that feeds web tool How to use web tool and expert system (crew ews ghana version 1) How to update the crew ews ghana
Title | 07 July 2015
Today
4
EWS Operation and MaintenanceTime Topic readings Course material Presenter9.00 – 9.15 Introduction to the day Handouts of
presentation9.15 – 10.00 Presentation EWS‐CREW
concepts, data, functionality and conditions: detail
Masterplan
10.00 – 11.00 Hands‐on expert EWS General
Internet and computers
11.00 – 11.30 Short break11.30 – 12.15 Hands‐on expert EWS
Simulate disaster floodInternet and computers
12.15 – 13.15 Lunch break13.15 – 14.00 Hands‐on expert EWS
Simulate disaster droughtInternet and computers
14.00 – 14.30 Presentation updating14.30 – 15.00 Hands‐on expert EWS
Update flood alertsInternet and computers
15.00 – 15.30 Short break15.30 – 16.00 Hands‐on expert EWS
Update drought alertsInternet and computers
16.00 – 17.00 Presentation and discussion maintenance
17.00 – 17.15 Closure

3
Title | 07 July 20155
EWS-CREW
Expert system CRW-EWS
WRCWRC
Title | 07 July 20156
EWS-CREW
Expert system CRW-EWS
WRC
4
Title | 07 July 20157
Architecture and ITWeb dissemination CRW-EWS
WRC
Title | 07 July 20158
EWS-CREW
Expert system CRW-EWS
WRC

5
Title | 07 July 2015
Delft‐FEWS introduction
Delft-FEWS: EWS-CREW expert
Title | 07 July 2015
Delft-FEWS
Professional platform for automatic forecasting and early warning processes:• Data handling• Data imports• Forecast model management• Forecasting• Warning• Presentation

6
Title | 07 July 201511
EWS-CREW expert concepts
?? ?? ??
Data Models Thresholds
??
Measures
Field and system
Title | 07 July 2015
Detection
12
To (timely) detect a disaster, data is needed. For floods and droughtsmainly:
• Meteorology• Hydrology
What are important data conditions for forecasting?• the data should be informative for either flood/drought type• the data should be accurate • the data should be available in near-real time.
Other?

7
Title | 07 July 2015
Detection
13
What data can be used for which disasters?
• Water level measurements ground station(s)• Rainfall measurements ground station(s)• Evaporation measurements ground station• Satellite based rainfall data 30x30 km (spatial)• Satellite based rainfall data 10x10 km (spatial)• 5-day forecast 30x30 km (spatial)• Evaporation spatial (30x30 km)
• Flash floods• Medium floods• Large floods• Droughts
Title | 07 July 201514
Detection
Data in current version of EWS-CREW
DataParameter Source Resolution Frequency Delay Remark
TRMM‐RTP NASA 30x30km 3‐h 6‐12 h
TRMM‐dailyP NASA 30x30km 1‐d 2 mon
GPM P NASA 10x10km 0.5‐h 4‐6h Beta
Global‐PETPET CGIAR 1 km x 1 km Climatology
Ground meteo P GMET Point 5 to 10 min 15 min Not accessible
Ground hydro h HSD Point 5 to 10 min 15 min Not available

8
Title | 07 July 201515
EWS-CREW expert first look and feel
Open EWS-CREW expert
General presentation Delft-FEWS platform
Exercise: Look for different data sets used for EWS
Full User Guide:
https://publicwiki.deltares.nl/display/FEWSDOC/Delft-FEWS+User+GuideDelft-FEWS Full User Guide.pdf
Title | 07 July 201516
Drought forecast and warning
Drought forecasting and warning follows drought mapping method:
Drought is defined as a meteorological drought Based on rainfall deficit – method Rainfall – Evaporation cumulative per year

9
Title | 07 July 201517
Drought forecast and warning
Drought forecasting and warning follows drought mapping method:
Drought is defined as a meteorological drought Based on rainfall deficit – method Rainfall – Evaporation cumulative per year
Drought warning is based on historical series: 25% drier years 50% drier years
Title | 07 July 201518
Drought forecast and warning
Drought forecasting and warning follows drought mapping method:
Drought is defined as a meteorological drought Based on rainfall deficit – method Rainfall – Evaporation cumulative per year
Drought warning is based on historical series: 25% drier years 50% drier years
Developed for each pilot district!
Threshold

10
Title | 07 July 201519
Drought forecast and warning
Drought forecasting and warning follows drought mapping:
Drought is defined as a meteorological drought Based on rainfall deficit – method Rainfall – Evaporation cumulative per year
Drought warning is based on historical series: Historical driest year 25% drier years Warning threshold 50% drier years
Develop for each pilot district
Title | 07 July 201520
Drought forecast and warning
Go back in time… 2015-9-29Exercise: explore EWS-CREW Expert and look for the drought forecasting filterWhat do you see?

11
Title | 07 July 201521
Flood forecast
Flood forecasting is based on precipitation in specific area combined with the floodhazard in that area.
Each district contains rivers from different sizes. The rivers have catchments, meaningrainfall within the catchment is ultimately transported to and through the river.
Title | 07 July 201522
Flood forecast
Flood forecasting is based on precipitation in specific area combined with the floodhazard in that area.
Each district contains rivers from different sizes. The rivers have catchments, meaningrainfall within the catchment is ultimately transported to and through the river.
For each district cachments of similar size have been determined.
12
Title | 07 July 2015
Flood forecasting is based on precipitation in specific area combined with the floodhazard in that area.
Each district contains rivers from different sizes. The rivers have catchments, meaningrainfall within the catchment is ultimately transported to and through the river.
23
Flood forecast
For each district cachments of similar size have been determined.
The rainfall andwith that water flow in each catchmentis calculated andindicated as floodhazard level.
T0
Hazard
Date
History Future
Title | 07 July 2015
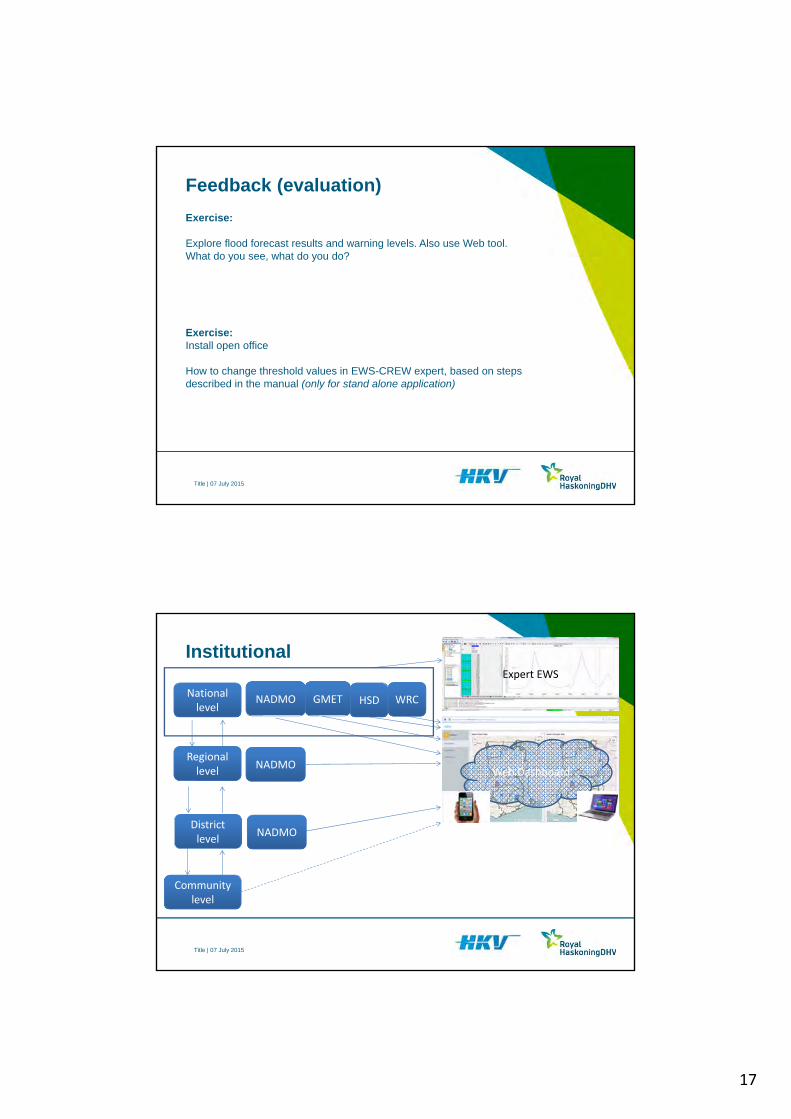
Exercise: explore EWS-CREW expert and look for flood forecasting filter.
What do you see?
Flood forecast

13
Title | 07 July 201525
Warning
T0
Hazard
Date
History Future
T0
Hazard
Date
History Future
When and how should we warnthe public for a flood hazard?
Title | 07 July 201526
Warning
T0
Hazard
Date
History Future
T0
Hazard
Date
History Future
When and how should we warnthe public for a flood hazard?
Based on historical observationsfrom the field (communities, news, databases)

14
Title | 07 July 2015
Warning
Exercise:
find flood warning thresholds in EWS-CREW expert
Title | 07 July 201528
Operational procedures EWS-CREW Expert
Institution Tasks/responsibility
NADMO
crisis information management setup disaster response plan at national and
pilot level scale definition and coordination of dissemination
procedures Hosting of EWS (Delft‐FEWS and Dashboards) maintenance of EWS
GMET Provide meteorological measurements Assess quality meteorological measurements Assess quality meteorological forecasts
HSD Provide hydrological measurements Assess quality hydrological measurements Assess quality hydrological forecasts
WRC Support HSD until HSD has sufficient capacity Link with policy and legal embedding Manage cross‐border information exchange
Which are related to EWS-CREW expert?

15
Title | 07 July 201529
Hands-on EWS-CREW
Exercise (use manual):
Work in groups each from perspective of:NADMO nationalNADMO regional / districtHSDGMET
Simulate drought disaster according to the drought forecasting steps described in the manual.
Present the results!
Title | 07 July 201530
Hands-on EWS-CREW
Exercise (use manual):
Work in groups each from perspective of:NADMO nationalNADMO regional / districtHSDGMET
Simulate flood disaster according to the flood forecasting steps described in the manual.
Present the results!

16
Title | 07 July 201531
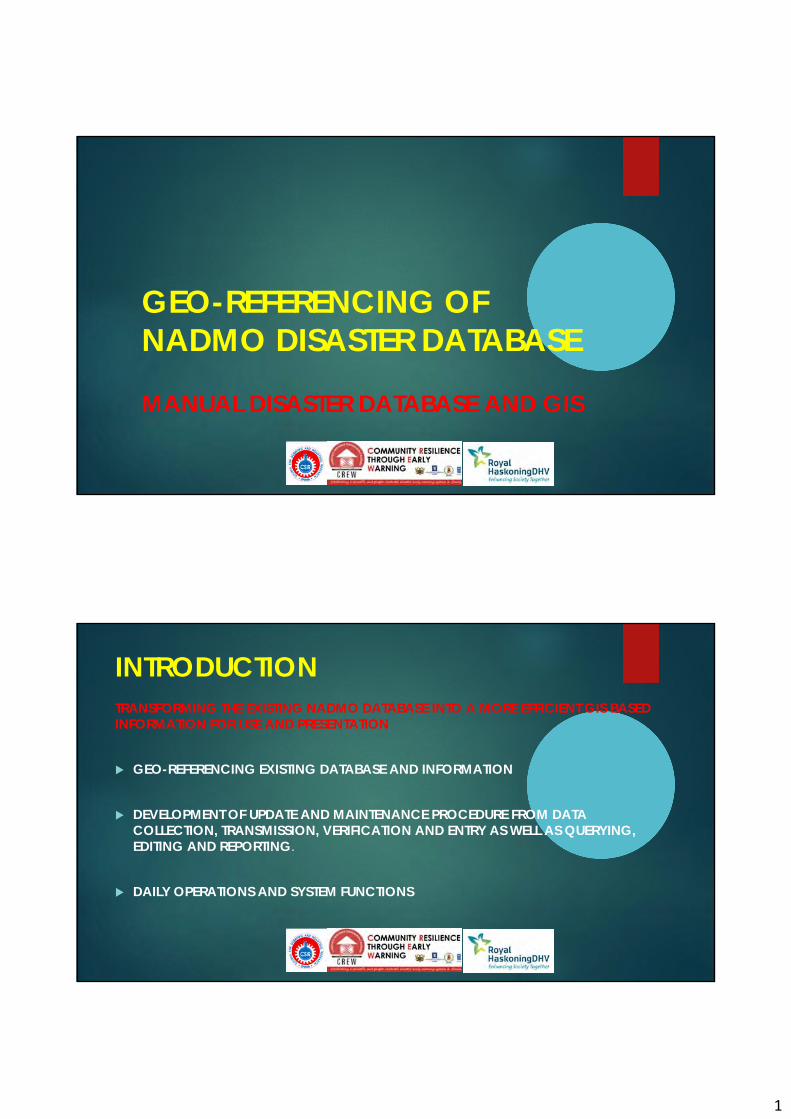
Feedback (evaluation)
Drought threshold is more or less fixed (related to the approach)
Flood warning threshold is based on historical data, field observations andexpert judgementShould be evaluated and corrected in the future
Title | 07 July 201532
Feedback (evaluation)
Evaluation of the forecast results
Example:
EWS CREW provides a flood warningLocal officials should evaluate if the warning is valid in terms of timing andsevertityLocal officials should report back to NADMO head office and GMET/HSD specialists if the field observation showed- Similarities to the warning -> do nothing- Nothing -> set threshold higher- Much larger floods -> set threshold lower
T0
Hazard
Date
History Future?
17
Title | 07 July 2015
Feedback (evaluation)
Exercise:
Explore flood forecast results and warning levels. Also use Web tool. What do you see, what do you do?
Exercise: Install open office
How to change threshold values in EWS-CREW expert, based on steps described in the manual (only for stand alone application)
Title | 07 July 2015
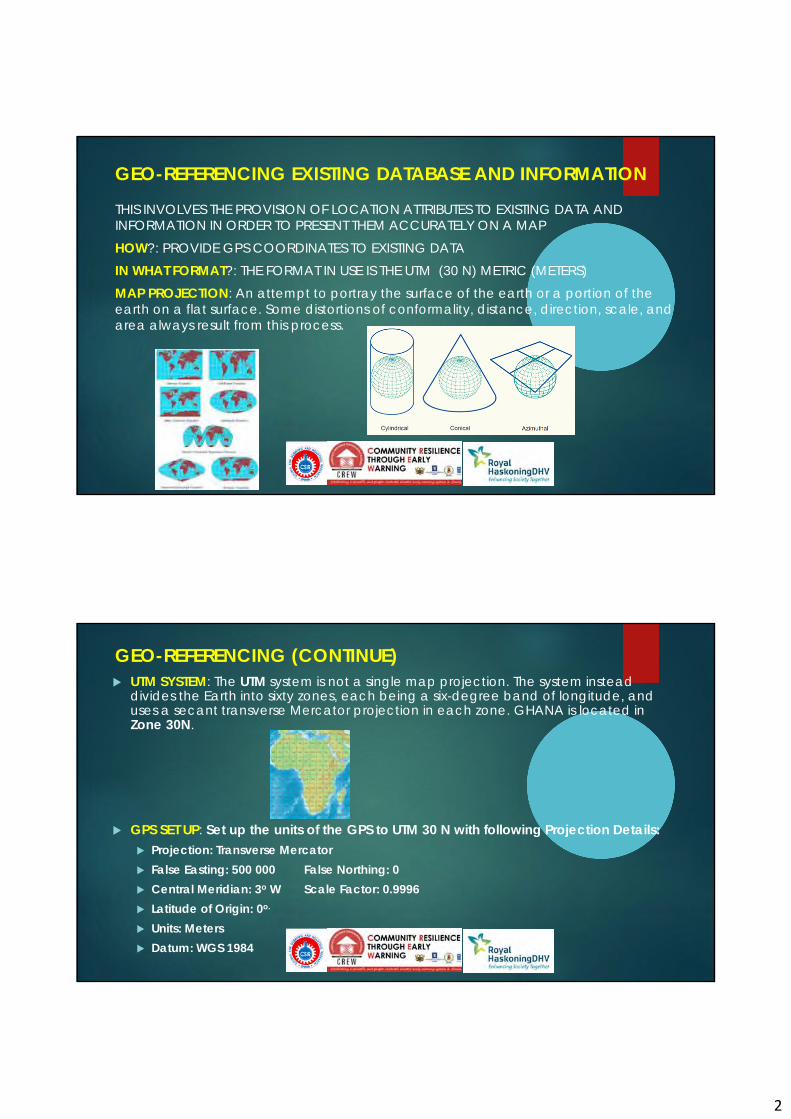
Institutional
National level
Regionallevel
District level
Community level
Web Dashboard
NADMO
NADMO GMET HSD WRC
NADMO
NADMO
Expert EWS

18
Title | 07 July 2015
Institutional
Given the previous subjects presented, what do you consider as your role andresponsibility during day-to-day forecasting, mind web-ews and expert-ews?
Institution DetectionData
Forecast Warning Response MaintenanceSupport
NADMO national
NADMO regional
NADMO district
GMET
HSD
WRC
Title | 07 July 2015
Institutional
Given the previous subjects presented, what do you consider as your role andresponsibility during threat situation, mind web-ews and expert-ews?
Institution DetectionData
Forecast Warning Response MaintenanceSupport
NADMO national
NADMO regional
NADMO district
GMET
HSD
WRC

19
Title | 07 July 201537
Discussion and conclusions
Present and share findings based on hands-on experienceDiscuss conclusions
(will the system help to carry out your tasks, do you understand the system, do you have anyrecommendations, )
1
GEO-REFERENCING OF NADMO DISASTER DATABASE
MANUAL DISASTER DATABASE AND GIS
INTRODUCTIONTRANSFORMING THE EXISTING NADMO DATABASE INTO A MORE EFFICIENT GIS BASED INFORMATION FOR USE AND PRESENTATION
GEO-REFERENCING EXISTING DATABASE AND INFORMATION
DEVELOPMENT OF UPDATE AND MAINTENANCE PROCEDURE FROM DATA COLLECTION, TRANSMISSION, VERIFICATION AND ENTRY AS WELL AS QUERYING, EDITING AND REPORTING.
DAILY OPERATIONS AND SYSTEM FUNCTIONS
2
GEO-REFERENCING EXISTING DATABASE AND INFORMATION
THIS INVOLVES THE PROVISION OF LOCATION ATTRIBUTES TO EXISTING DATA AND INFORMATION IN ORDER TO PRESENT THEM ACCURATELY ON A MAPHOW?: PROVIDE GPS COORDINATES TO EXISTING DATAIN WHAT FORMAT?: THE FORMAT IN USE IS THE UTM (30 N) METRIC (METERS)MAP PROJECTION: An attempt to portray the surface of the earth or a portion of the earth on a flat surface. Some distortions of conformality, distance, direction, scale, and area always result from this process.
GEO-REFERENCING (CONTINUE) UTM SYSTEM: The UTM system is not a single map projection. The system instead
divides the Earth into sixty zones, each being a six-degree band of longitude, and uses a secant transverse Mercator projection in each zone. GHANA is located in Zone 30N.
GPS SET UP: Set up the units of the GPS to UTM 30 N with following Projection Details: Projection: Transverse Mercator False Easting: 500 000 False Northing: 0 Central Meridian: 3o W Scale Factor: 0.9996 Latitude of Origin: 0o.
Units: Meters Datum: WGS 1984
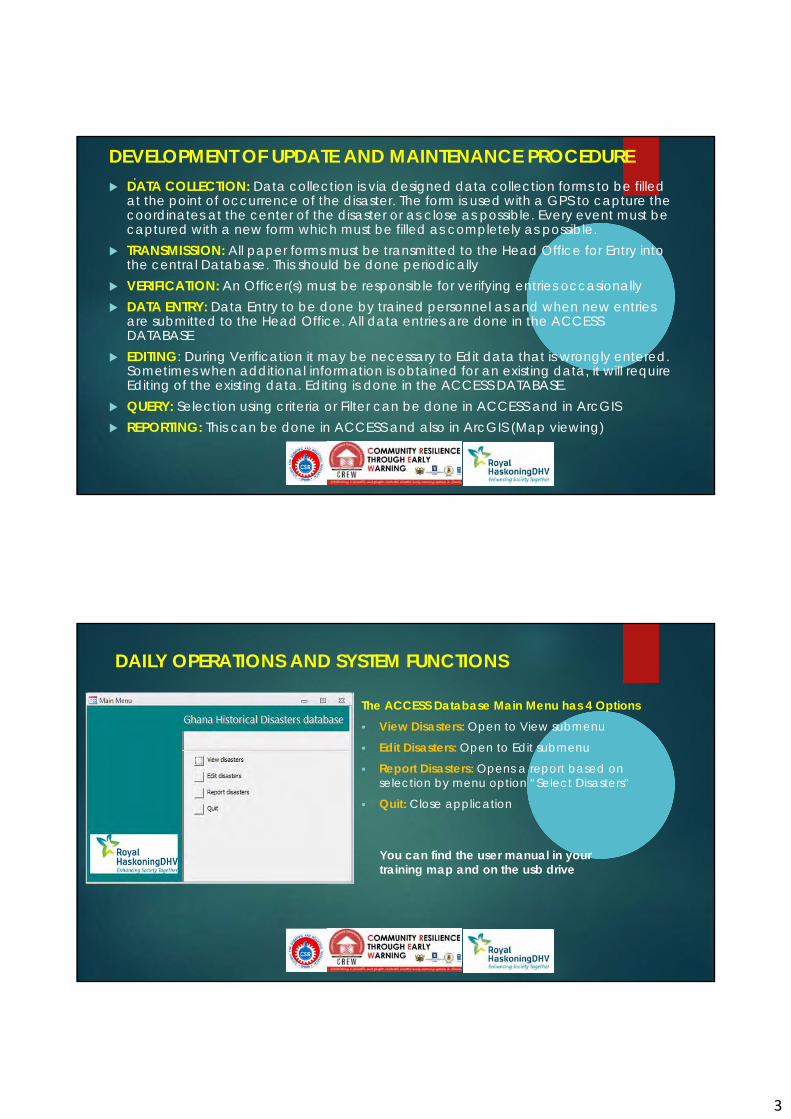
3
DEVELOPMENT OF UPDATE AND MAINTENANCE PROCEDURE.
DATA COLLECTION: Data collection is via designed data collection forms to be filled at the point of occurrence of the disaster. The form is used with a GPS to capture the coordinates at the center of the disaster or as close as possible. Every event must be captured with a new form which must be filled as completely as possible.
TRANSMISSION: All paper forms must be transmitted to the Head Office for Entry into the central Database. This should be done periodically
VERIFICATION: An Officer(s) must be responsible for verifying entries occasionally DATA ENTRY: Data Entry to be done by trained personnel as and when new entries
are submitted to the Head Office. All data entries are done in the ACCESS DATABASE
EDITING: During Verification it may be necessary to Edit data that is wrongly entered. Sometimes when additional information is obtained for an existing data, it will require Editing of the existing data. Editing is done in the ACCESS DATABASE.
QUERY: Selection using criteria or Filter can be done in ACCESS and in ArcGIS REPORTING: This can be done in ACCESS and also in ArcGIS (Map viewing)
DAILY OPERATIONS AND SYSTEM FUNCTIONS
The ACCESS Database Main Menu has 4 Options View Disasters: Open to View submenu
Edit Disasters: Open to Edit submenu
Report Disasters: Opens a report based on selection by menu option “Select Disasters”
Quit: Close application
You can find the user manual in your training map and on the usb drive

4
DAILY OPERATIONS AND SYSTEM FUNCTIONS
ACCESS DISASTER DATABASE FUNCTIONALITYPRINCIPLES
All Tables, Forms, Queries, Fields have specific names. DO NOT ALTER NAMES OR DELETE FIELDS.
Do not append Records to the DISASTER TABLE (“DISASTERS”)
ID’s for New Records are generated Automatically. DO NOT DELETE OR CHANGE ID’s
There are 3 Tables present in the Database. Add DISASTER to ArcGIS: This is the Table where New Data with geographic coordinates are added, i.e
Data Entry in ACCESS is stored in this table by entering information from the Data Collection Form.
Disaster: Once data is stored in the “Add DISASTER to ArcGIS” table from ACCESS, the data can be transferred into ArcGIS using the Tool “Update DisasterTable” from ArcGIS. The Data will then be transferred into this table and stored. This table is used to view Data in ArcGIS.
DISASTER-TABLE: This table contains all the original Data without coordinates. In future when coordinates are provided for the records in this table they will be transferred to the “Add DISASTER to ArcGIS” table. With time all records in this table will be moved once they have coordinates and the table will become empty.
DAILY OPERATIONS AND SYSTEM FUNCTIONS (cont)
View Disasters Submenu Geo-referenced disasters: View the form with records
from the feature class.
Non Geo-referenced disasters: View the form with records from the “DISASTER-TABLE”
In ArcGIS selected disasters: If a selection is made in ArcGIS it can be visible in ACCESS in View mode
Select Disasters: Opens a query form to filter data in the feature table “Disasters.” Result is visible in a separate layer in ArcMap (“Selected Disasters”)
Back: Returns to Main Menu
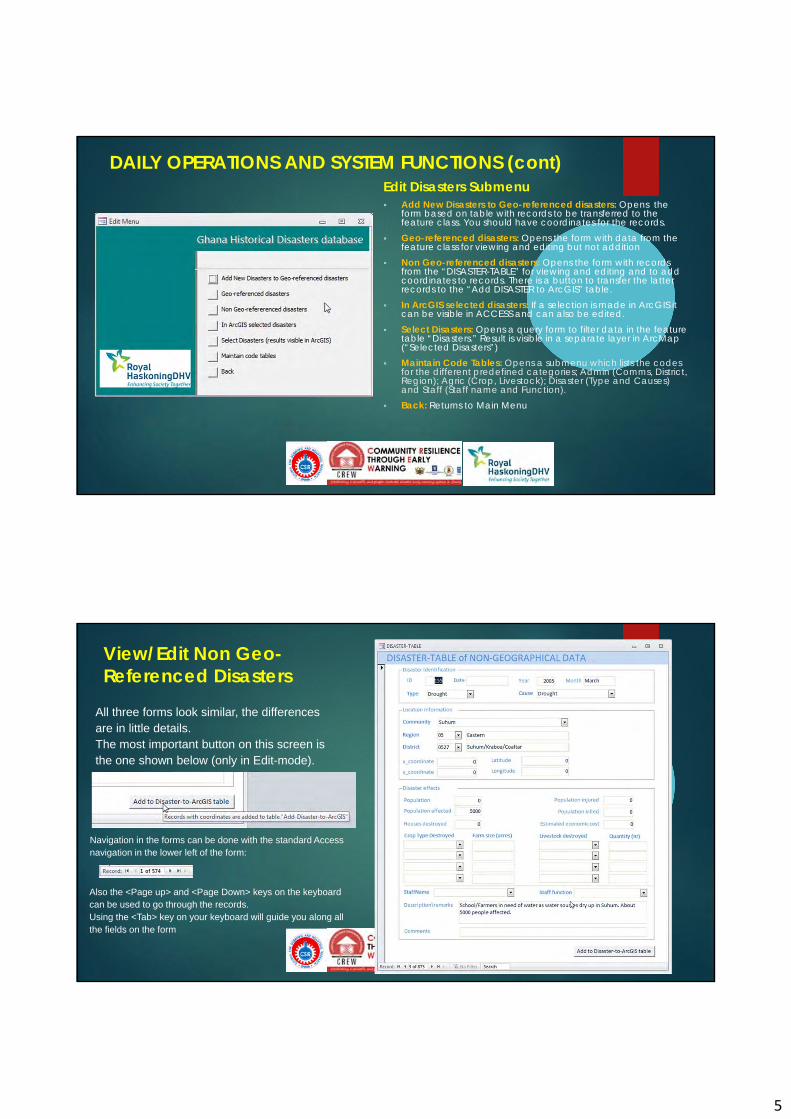
5
DAILY OPERATIONS AND SYSTEM FUNCTIONS (cont)Edit Disasters Submenu Add New Disasters to Geo-referenced disasters: Opens the
form based on table with records to be transferred to the feature class. You should have coordinates for the records.
Geo-referenced disasters: Opens the form with data from the feature class for viewing and editing but not addition
Non Geo-referenced disasters: Opens the form with records from the “DISASTER-TABLE” for viewing and editing and to add coordinates to records. There is a button to transfer the latter records to the “Add DISASTER to ArcGIS” table.
In ArcGIS selected disasters: If a selection is made in ArcGIS it can be visible in ACCESS and can also be edited.
Select Disasters: Opens a query form to filter data in the feature table “Disasters.” Result is visible in a separate layer in ArcMap(“Selected Disasters”)
Maintain Code Tables: Opens a submenu which lists the codes for the different predefined categories; Admin (Comms, District, Region); Agric (Crop, Livestock); Disaster (Type and Causes) and Staff (Staff name and Function).
Back: Returns to Main Menu
View/Edit Non Geo-Referenced Disasters
All three forms look similar, the differences are in little details.The most important button on this screen is the one shown below (only in Edit-mode).
Navigation in the forms can be done with the standard Access navigation in the lower left of the form:
Also the <Page up> and <Page Down> keys on the keyboard can be used to go through the records.Using the <Tab> key on your keyboard will guide you along all the fields on the form
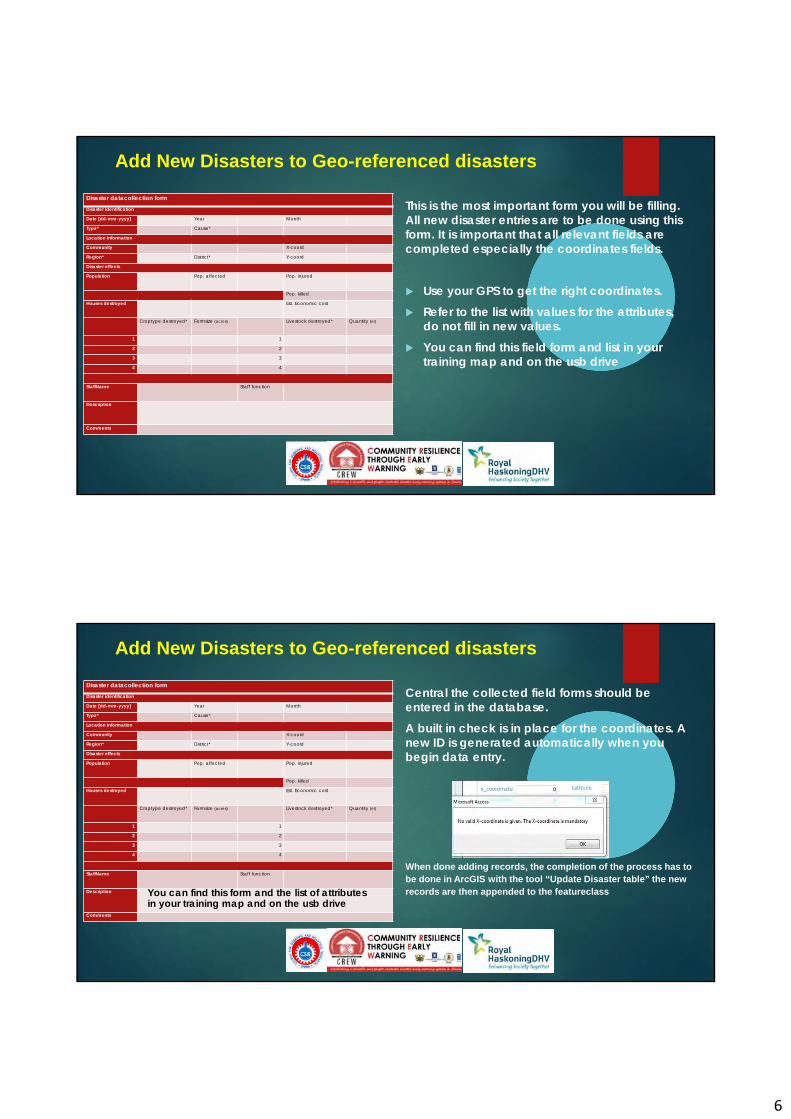
6
Add New Disasters to Geo-referenced disasters
Disaster datacollection form
Disaster identification
Date [dd-mm-yyyy] Year Month
Type* Cause*
Location information
Community X-coord
Region* District* Y-coord
Disaster effects
Population Pop. affected Pop. injured
Pop. killed
Houses destroyed Est. Economic cost
Croptype destroyed* Farmsize (acres) Livestock destroyed* Quantity (nr)
1 1
2 2
3 3
4 4
StaffName Staff function
Description
Comments
This is the most important form you will be filling. All new disaster entries are to be done using this form. It is important that all relevant fields are completed especially the coordinates fields.
Use your GPS to get the right coordinates. Refer to the list with values for the attributes,
do not fill in new values. You can find this field form and list in your
training map and on the usb drive
Add New Disasters to Geo-referenced disasters
Disaster datacollection form
Disaster identification
Date [dd-mm-yyyy] Year Month
Type* Cause*
Location information
Community X-coord
Region* District* Y-coord
Disaster effects
Population Pop. affected Pop. injured
Pop. killed
Houses destroyed Est. Economic cost
Croptype destroyed* Farmsize (acres) Livestock destroyed* Quantity (nr)
1 1
2 2
3 3
4 4
StaffName Staff function
Description
Comments
Central the collected field forms should be entered in the database.A built in check is in place for the coordinates. A new ID is generated automatically when you begin data entry.
When done adding records, the completion of the process has to be done in ArcGIS with the tool “Update Disaster table” the new records are then appended to the featureclassYou can find this form and the list of attributes
in your training map and on the usb drive
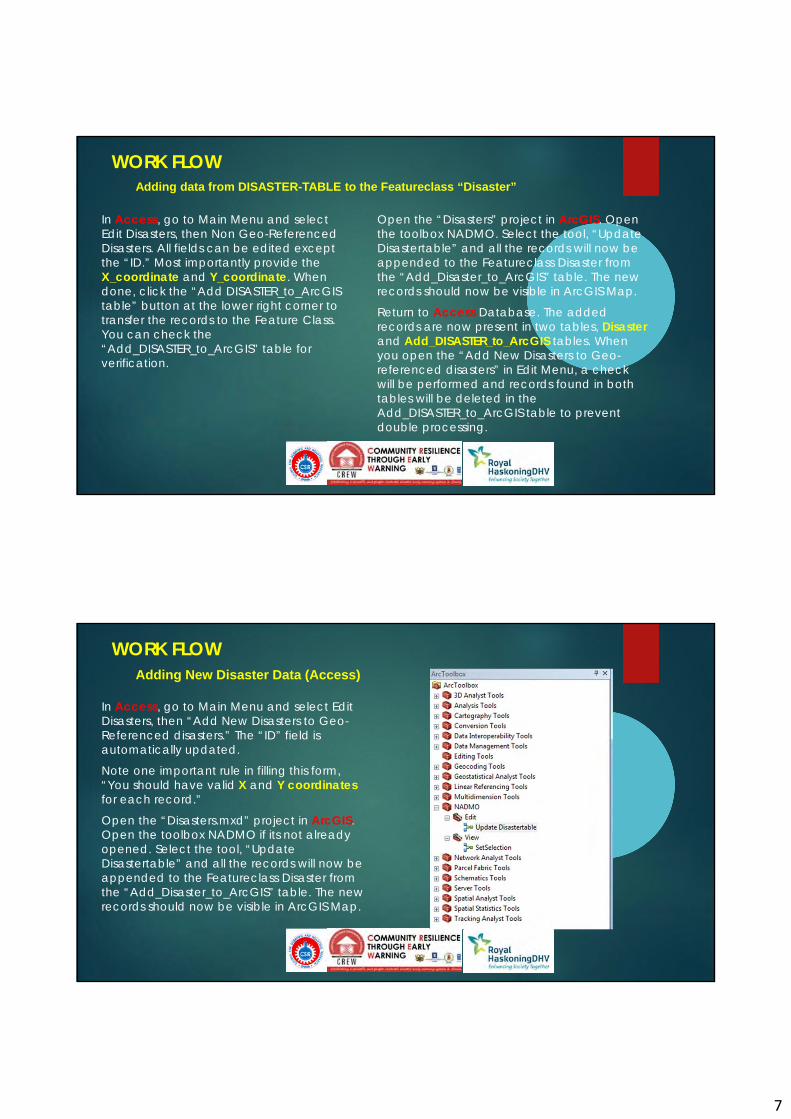
7
WORK FLOW
In Access, go to Main Menu and select Edit Disasters, then Non Geo-Referenced Disasters. All fields can be edited except the “ID.” Most importantly provide the X_coordinate and Y_coordinate. When done, click the “Add DISASTER_to_ArcGIStable” button at the lower right corner to transfer the records to the Feature Class. You can check the “Add_DISASTER_to_ArcGIS” table for verification.
Open the “Disasters” project in ArcGIS. Open the toolbox NADMO. Select the tool, “Update Disastertable” and all the records will now be appended to the Featureclass Disaster from the “Add_Disaster_to_ArcGIS” table. The new records should now be visible in ArcGIS Map.
Return to Access Database. The added records are now present in two tables, Disasterand Add_DISASTER_to_ArcGIS tables. When you open the “Add New Disasters to Geo-referenced disasters” in Edit Menu, a check will be performed and records found in both tables will be deleted in the Add_DISASTER_to_ArcGIS table to prevent double processing.
Adding data from DISASTER-TABLE to the Featureclass “Disaster”
WORK FLOW
In Access, go to Main Menu and select Edit Disasters, then “Add New Disasters to Geo-Referenced disasters.” The “ID” field is automatically updated.
Note one important rule in filling this form, “You should have valid X and Y coordinatesfor each record.”
Open the “Disasters.mxd” project in ArcGIS. Open the toolbox NADMO if its not already opened. Select the tool, “Update Disastertable” and all the records will now be appended to the Featureclass Disaster from the “Add_Disaster_to_ArcGIS” table. The new records should now be visible in ArcGIS Map.
Adding New Disaster Data (Access)

8
WORK FLOW
In Access, go to Main Menu and select Edit Disasters, then “Select Disasters (results visible in ArcGIS). A form will be opened which can be used to create a selection or query. Check the desired search criteria and choose the appropriate value in each case. Up to five criteria can be chosen. Every extra criteria will narrow down the results. When done making selection click the “Run query” button. Close the query.Open the “Disasters.mxd” project in ArcGIS. The results of the selection is visible in ArcGIS in the layer “SelectedDisasters.” It may be necessary to refresh the Map to see the results. Note that this layer is not suitable for editing in ArcGIS.
Creating a Selection in Access which will be reflected in ArcGIS
WORK FLOW
Make a selection in ArcGIS with the various selection tools. When done, open the tool “SetSelection” in the NADMO tool in ArcToolbox and run it (double click).
In Access, select the “In ArcGIS selected disasters” a form will open showing only your ArcGIS selected records.
To unselect these records in ArcGIS, first clear the selection in ArcGIS and then run the tool “SetSelection” again.
To make a new selection, repeat the process above and make sure you run the tool “SetSelection” any time you make or clear a selection.
Creating a Selection in ArcGIS which will be reflected in Access

1
Consultancy Services for
Development of Disaster Risk and
Early Warning Systems in Ghana
Willem Kroonen19 October 2015
Strategic/Tactical Overview
Strategic/Tactical Overview | 19 October 2015
Today’s Programme
2
Monday 19 October 2015
Time Topic
9.00 ‐ 09:45 National and District Level Risk Maps Launch Event
10.30 ‐ 13.00 Strategic/Tactical Overview training
• Introduction to the Project
• Risk Assessment
• EWS
• Disaster Database Management
• Tasks and Responsibilities
• Future Developments
• Policy
• Training
13.00 ‐ 14.00 Lunch

2
Strategic/Tactical Overview | 19 October 2015
Project
3
Community Resilience through Early Warning project: CREW
Funding: Norwegian EmbassyExecuting Agency: UNDPImplementing Partner: NADMOInternational Consultants: Royal HaskoningDHV with HKV
Strategic/Tactical Overview | 19 October 2015
International Consultants’ Scope
4
• Risk Assessment• Early Warning System• Disaster Database• Training: central and local
• Floods• Droughts
• Started in March 2014• Currently nearly completed

3
Strategic/Tactical Overview | 19 October 2015
Project’s Zoom Levels
5
• National ‐ Risk Assessment• Pilot Districts ‐ Risk Assessment, EWS• Hotspot Communities ‐ Risk Profiling,
Mitigating Measures
Strategic/Tactical Overview | 19 October 2015
Project approach
National levelFlood and drought risk assessment
ReportsRisk maps
6

4
Strategic/Tactical Overview | 19 October 2015
Project approach
National levelFlood and drought risk assessment
District level10 pilot districts1 per region
More detailedflood and drought risk assessment
ReportsRisk maps
ReportsRisk maps
EWS
7
Strategic/Tactical Overview | 19 October 2015
Project approach
National levelFlood and drought risk assessment
District level10 pilot districts1 per region
More detailed flood and drought risk assessment
ReportsRisk maps
ReportsRisk maps
EWS
Community level1‐3 hotspots per
district
Flood and drought risk profiling
Reports/Risk mapsEWS
Mitigation measures
8

5
Strategic/Tactical Overview | 19 October 2015
Project approach
National levelFlood and drought risk assessment
District level10 pilot districts1 per region
More detailed flood and drought risk assessment
ReportsRisk maps
ReportsRisk maps
EWS
Community level1‐3 hotspots per
district
Flood and drought risk profiling
Reports/Risk mapsEWS
Mitigation measures
9
Training
Strategic/Tactical Overview | 19 October 2015
Version 1
10
Hazard, vulnerability, risk maps
Early Warning System
MonitorEvaluateUpdate
Version 1
Hazard, vulnerability, risk maps
Early Warning System
Version 2
Product
Monitor
Update
Evaluate

6
Strategic/Tactical Overview | 19 October 2015
Risk Assessment: Why?
• Better information leads to better decisions• Allows well‐founded choices and priorities• A way to move from reactive to pro‐active in disaster management• Facilitates focusing on the high risk areas• Essential for policy making and spatial planning
o no urban development in high flood hazard areaso long term planning of agricultural activities
• As information source for the Early Warning System operations
11
Strategic/Tactical Overview | 19 October 2015
Risk Assessment Concepts
12
Basic Principle: Risk = (Hazard * Vulnerability) / Capacity
• Hazard: possibility that a physical phenomenon such as a flood strikes• Vulnerability: damage done by, for example, a flood • Capacity: resources, skills etc. that allow a community to achieve goals
Examples:• Low lying areas next to a river: high flood hazard• High ground: low flood hazard• Bush: low vulnerability• Urban and agricultural areas: high vulnerability• Town next to river: high risk (high flood hazard, high vulnerability)• Town on high ground: low risk (low flood hazard, high vulnerability)• Bush next to river: low risk (high flood hazard, low vulnerability)

7
Strategic/Tactical Overview | 19 October 2015
Risk Assessment Approach
13
• All processing done through GIS tools• ArcGIS with licensing issues, alternative: free software e.g. QGIS• Using data that is available for the whole map, free data where possible• Resolution adapted to mapping level
How Hazard has been determined‐ Floods: HAND index (Height Above Nearest Drainage)‐ Droughts: cumulative rainfall deficit
How Vulnerability has been determined‐ Floods: land use, population density‐ Droughts: land use
How Risk has been determined:‐ Risk = Hazard * Vulnerability (assuming Capacity = 1)
Strategic/Tactical Overview | 19 October 2015
Flood Hazard
14
Based on:• Drainage pattern• Elevation and slope• Size of river basin• Size of river
Categories:• High 12%• Medium 13%• Low 10%• No 65%

8
Strategic/Tactical Overview | 19 October 2015
Flood Vulnerability
15
Based on:• Land use map FAO• Population density (census)• Urban areas detailed from
OpenStreetMap
Categories:• High 1%• Medium 12%• Low 84%• No 3%
Strategic/Tactical Overview | 19 October 2015
Flood Risk
16

9
Strategic/Tactical Overview | 19 October 2015
National level Risk Assessment
17
National level:• Flood hazard/vulnerability/risk current situation (2010)• Drought hazard/vulnerability/risk current situation (2010)• Flood hazard/vulnerability/risk future situation (2050)• Drought hazard/vulnerability/risk future situation (2050)• Future situation based on:
o Climate changeo Socio‐economic development
Strategic/Tactical Overview | 19 October 2015
District and Community levelRisk Assessment
18
For each of the ten pilot districts:• Flood hazard/vulnerability/risk current situation (2010)• Drought hazard/vulnerability/risk current situation (2010)• Approach identical as for national level maps but using more detailed
information on elevation and urban areas
In the 23 hotspot communities:• Field visit to ascertain local issues• Sociological survey• Establishment of risk profiles• Drafting of proposed mitigating measures
Validation of district risk maps:• In the central training course• In the communities

10
Strategic/Tactical Overview | 19 October 2015
Risk Assessment - Results
19
Direct outcome:• Many maps, reports, notes, data sources, proposed measures etc.
Indirect outcome:• Thorough understanding of the risk processes• Solid basis for decision making• Starting point (‘version 1’) for cyclic updates• Awareness of the concepts with stakeholders• Input for Early Warning System• Opportunity for NADMO to move towards proactiveness
Possible future improvements:• Better data (higher resolution, more recent)• Mapping on community level, requires detailed data
Strategic/Tactical Overview | 19 October 2015
Early Warning System - Principles
20
Always operational and available• Robust• Crisis proof: stable, 24/7 accessible• Generator, back-up, maintenance and support
Accuracy versus lead time• Understand the system and disaster processes• Evaluation and validation for improvement
Requirements• Clear responsibilities and procedures• Training • Emergency plans• Tools (phone, satellite)• Preparedness

11
Strategic/Tactical Overview | 19 October 2015
CREW EWS - Concepts
21
• Basic forecast should always be available -> reliability and availability of the data is paramount
• Generically applicable• Tailored on district level: depending on the districts’
characteristics and the data available • Learning system based on common efforts • Web tool for easy dissemination and communication• Expert tool for warning assessment and validation
EWS Elements:
Strategic/Tactical Overview | 19 October 2015
CREW EWS - Detection
22
Satellite based data:• 10x10 km, 4-6 hours delay, every 30 minutes• Free of charge, provided by NASA• Used for floods and drought• Resolution and delay is too long for flash floods: need for GMet’s
radar data (to be repaired) and ground station data (real time and every 5-15 minutes)
• Real time data from automatic water level recorders on strategic locations will allow improvements

12
Strategic/Tactical Overview | 19 October 2015
CREW EWS - Flood Forecasting
23
Based on rainfall
Sub-catchments
Flow propagation
Flow = Hazard
T0
Hazard
Date
History Future
Strategic/Tactical Overview | 19 October 2015
CREW EWS - Flood Warning
24
T0
Hazard
Date
History FutureWhen to issue a warning?
Threshold
When hazard level (flow) exceeds the threshold level -> Warning
Initial threshold levels (version 1) based on historical data: communities (flood markers), news reports etc.

13
Strategic/Tactical Overview | 19 October 2015
CREW EWS - Drought Forecasting/Warning
25
• Drought is defined as meteorological drought
• Based on cumulative rainfall deficit: rainfall - evaporation over the year
• Drought warning is based on historical data:
• 25% drier years (threshold)• 50% drier years
• Calculated for each pilot district
Strategic/Tactical Overview | 19 October 2015
CREW EWS - Response
26

14
Strategic/Tactical Overview | 19 October 2015
CREW EWS - IT Architecture
27
Two parts:• Expert system• Dashboard
Expert system:• Specialists• Verification• Supervision
Dashboard:• All Stakeholders• Easy access• Clear presentation
Strategic/Tactical Overview | 19 October 2015
CREW EWS - Expert System
28

15
Strategic/Tactical Overview | 19 October 2015
CREW EWS - Dashboard, National View
29
ACCRA 16TH OCT. 2015
Strategic/Tactical Overview | 19 October 2015
CREW EWS - Dashboard, District View
30
Mapped Prioritized Community
Intervention Areas
Indigenous Knowledge
ACCRA 16TH OCT. 2015

16
Strategic/Tactical Overview | 19 October 2015
CREW EWS - A Learning System
31
Example:• EWS CREW provides a flood warning• Local officials evaluate if the warning is valid in terms of timing
and severity• Local officials should report back to NADMO head office and
GMET/HSD specialists if the field observation showedo Similarities to the warning -> do nothingo Nothing -> set threshold highero Much larger floods -> set threshold lower
• Community participation/involvement
T0
Hazard
Date
History Future
Strategic/Tactical Overview | 19 October 2015
CREW EWS - Strong Points
32
• Combining risk maps and EWS: risk maps show high risk areas and EWS shows areas where a flood or drought is expected.
• Allows a targeted priority response to the communities at risk within the areas for which a warning is valid.
• All information is presented in a web-based dashboard.• Expert EWS system to be used by forecasting experts (HSD,
NADMO HQ, GMET, WRC) to assess the forecast; results are communicated to the districts and regions for dissemination (‘last mile’).
• Unique feature: indigenous knowledge indicator.It registers and presents for each district if a flood or drought hazard indicator is active. Can be used to validate the science-based forecast.
• Tailored for specific districts and flood characteristics.

17
Strategic/Tactical Overview | 19 October 2015
Disaster Database Management
33
• Core task of NADMO• Never well implemented until…• CREW project collected historical data• This was geo‐referenced, can be presented in GIS environment• Software tool was developed to manage the disaster database• NADMO recently started working with new tools:
• Ushahidi• Sahana
• Data from CREW database can be used
Strategic/Tactical Overview | 19 October 2015
Tasks and Responsibilities
34
• Both for Risk Assessment and EWS• At all levels:
o Nationalo Regionalo Districto Community
• Note: to ensure data integrity all changes need to be approved and communicated with NADMO HQ following the appropriate protocol!
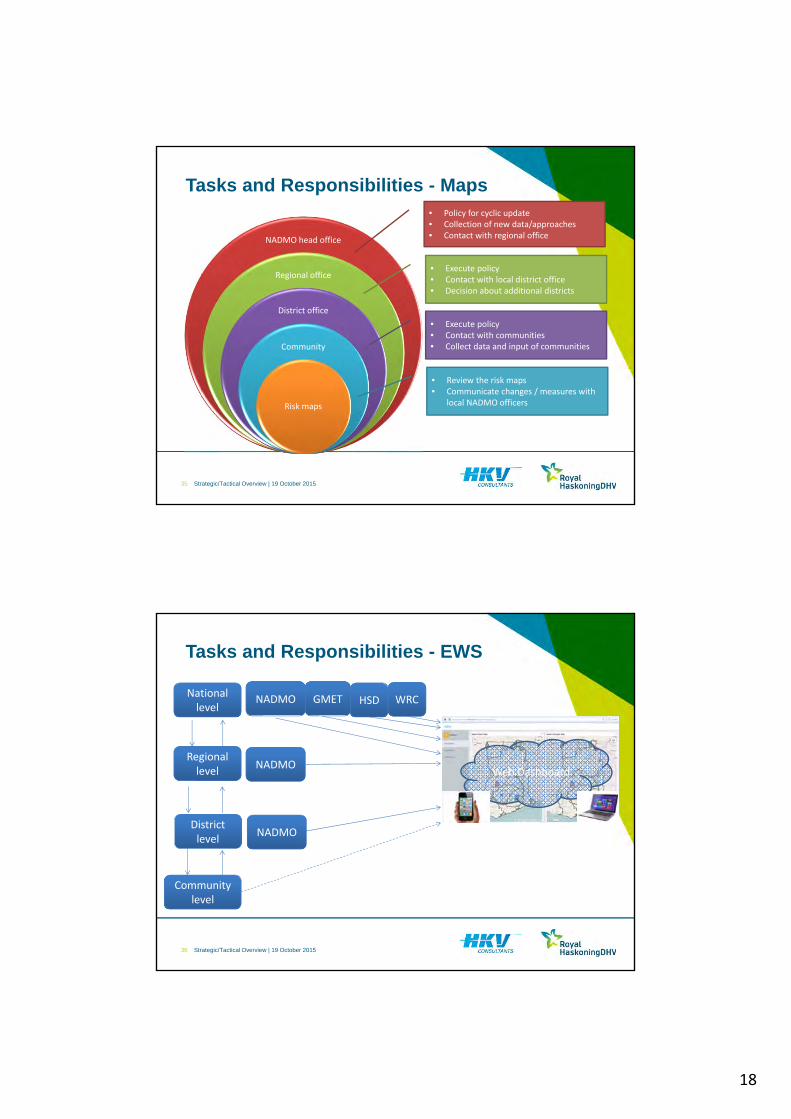
18
Strategic/Tactical Overview | 19 October 2015
Tasks and Responsibilities - Maps
35
NADMO head office
Regional office
District office
Community
Risk maps
• Policy for cyclic update• Collection of new data/approaches• Contact with regional office
• Execute policy• Contact with local district office• Decision about additional districts
• Execute policy• Contact with communities• Collect data and input of communities
• Review the risk maps• Communicate changes / measures with
local NADMO officers
Strategic/Tactical Overview | 19 October 2015
Tasks and Responsibilities - EWS
36
National level
Regional level
District level
Community level
Web Dashboard
NADMO
NADMO GMET HSD WRC
NADMO
NADMO

19
Strategic/Tactical Overview | 19 October 2015
Future Developments (Version 2)
37
• Validate and update version 1 risk maps • Use newer and better nation‐wide data sources:
o Recent census datao Updated land use maps (DLR, German space agency)
• Monitor and update EWS thresholds• Implement national data for EWS
Note: must be 24/7, online accessible and (near) real time!o GMet’s rainfall radar data (flash floods)o Local meteorological stations (rainfall, evapotranspiration)o River stage recorders (HSD)
• Elaborate on use of indigenous knowledge• Monitor and improve dissemination experience (‘last mile’)• Explore possibilities to ‘merge’ CREW EWS and WRC EWS
(White Volta)
Strategic/Tactical Overview | 19 October 2015
Policy
38
• Hyogo Framework of Action 2005‐2015 ‐ HFA2 Sendai 2015‐2025o Framework for national Disaster Risk Reduction programmeso Endorsed by the United Nations
• Risk Assessment results show increased risks in future• Mitigating measures proposed for pilot hotspots
o Structuralo Non‐structural (vulnerability, capacity)
• Anchor Risk Assessment in policyo Decide on approacho Extend coverageo Prescribe cyclic updates
• Example: European Flood Directiveo Compulsory for all EU member stateso Must perform flood risk assessmento Must be updated every 6 years
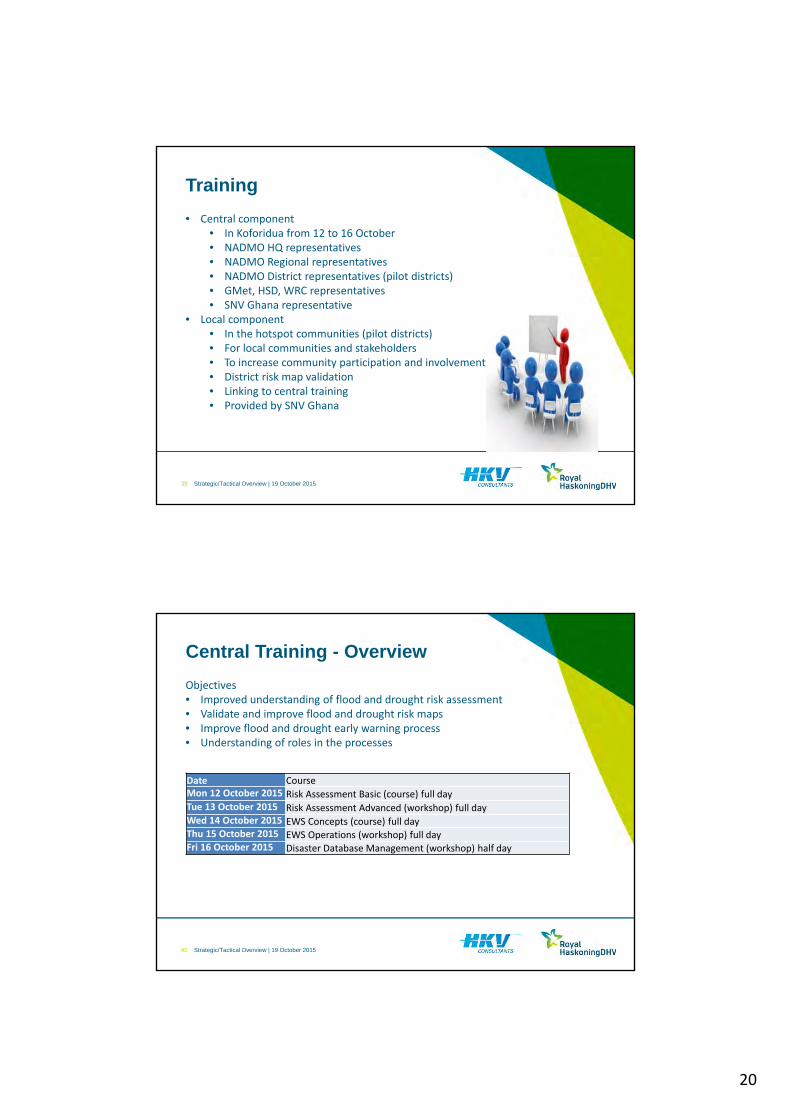
20
Strategic/Tactical Overview | 19 October 2015
Training
39
• Central component• In Koforidua from 12 to 16 October• NADMO HQ representatives• NADMO Regional representatives• NADMO District representatives (pilot districts)• GMet, HSD, WRC representatives• SNV Ghana representative
• Local component• In the hotspot communities (pilot districts)• For local communities and stakeholders• To increase community participation and involvement• District risk map validation• Linking to central training• Provided by SNV Ghana
Strategic/Tactical Overview | 19 October 2015
Central Training - Overview
40
Objectives• Improved understanding of flood and drought risk assessment• Validate and improve flood and drought risk maps• Improve flood and drought early warning process• Understanding of roles in the processes
Date CourseMon 12 October 2015 Risk Assessment Basic (course) full dayTue 13 October 2015 Risk Assessment Advanced (workshop) full dayWed 14 October 2015 EWS Concepts (course) full dayThu 15 October 2015 EWS Operations (workshop) full dayFri 16 October 2015 Disaster Database Management (workshop) half day

21
Strategic/Tactical Overview | 19 October 2015
Central Training - Impressions
41
Strategic/Tactical Overview | 19 October 2015
Central Training - Outcomes
42
• Very good attitude of participants• Eager to learn, not wanting to leave the hall….• Hands‐on parts much appreciated• District risk maps validated; good results• Awareness of roles and responsibilities of all stakeholders• Benefit from input of GMet, HSD and WRC staff• Willingness to share and help each other• WhatsApp group created to stay in touch• Certificates handed out by
NADMO National Coordinator
22
Strategic/Tactical Overview | 19 October 2015
Central Training - Certificates
43
Strategic/Tactical Overview | 19 October 2015
Central Training - Family Picture
44

23
Strategic/Tactical Overview | 19 October 2015
Central Training - Comments
45
Strategic/Tactical Overview | 19 October 2015
Local Training - Status
46
• Draft Training Programme discussed• Currently being updated to
incorporate CREW comments• SNV Ghana representative attended
central training to facilitate linkage between central and local sessions
• Final Training Programme to be handed over soonest
• Planning for sessions in hot spot communities to start
• Provisional dates starting 1 November
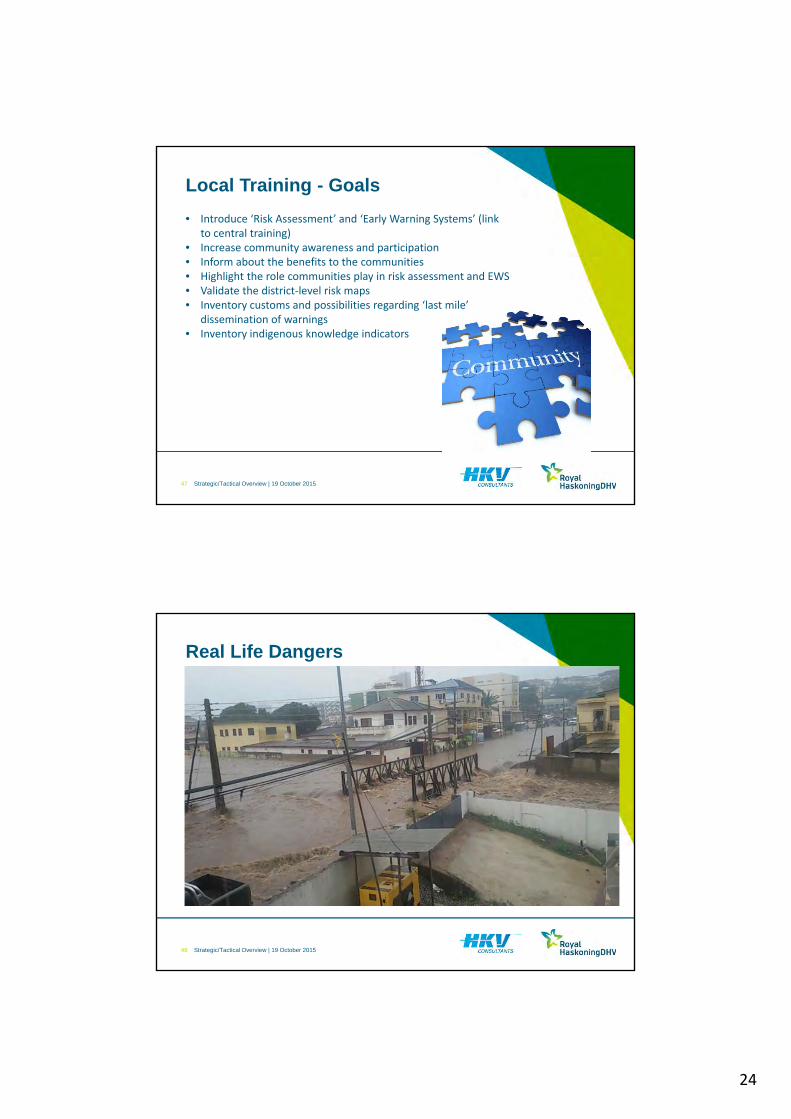
24
Strategic/Tactical Overview | 19 October 2015
Local Training - Goals
47
• Introduce ‘Risk Assessment’ and ‘Early Warning Systems’ (link to central training)
• Increase community awareness and participation• Inform about the benefits to the communities• Highlight the role communities play in risk assessment and EWS• Validate the district‐level risk maps• Inventory customs and possibilities regarding ‘last mile’
dissemination of warnings• Inventory indigenous knowledge indicators
Strategic/Tactical Overview | 19 October 2015
Real Life Dangers
48

1
Community Resilience throughout early warning
DSD28 October 2015
Community Resilience throughout early warning | 28 October 2015
Risk assessment and early warning
2
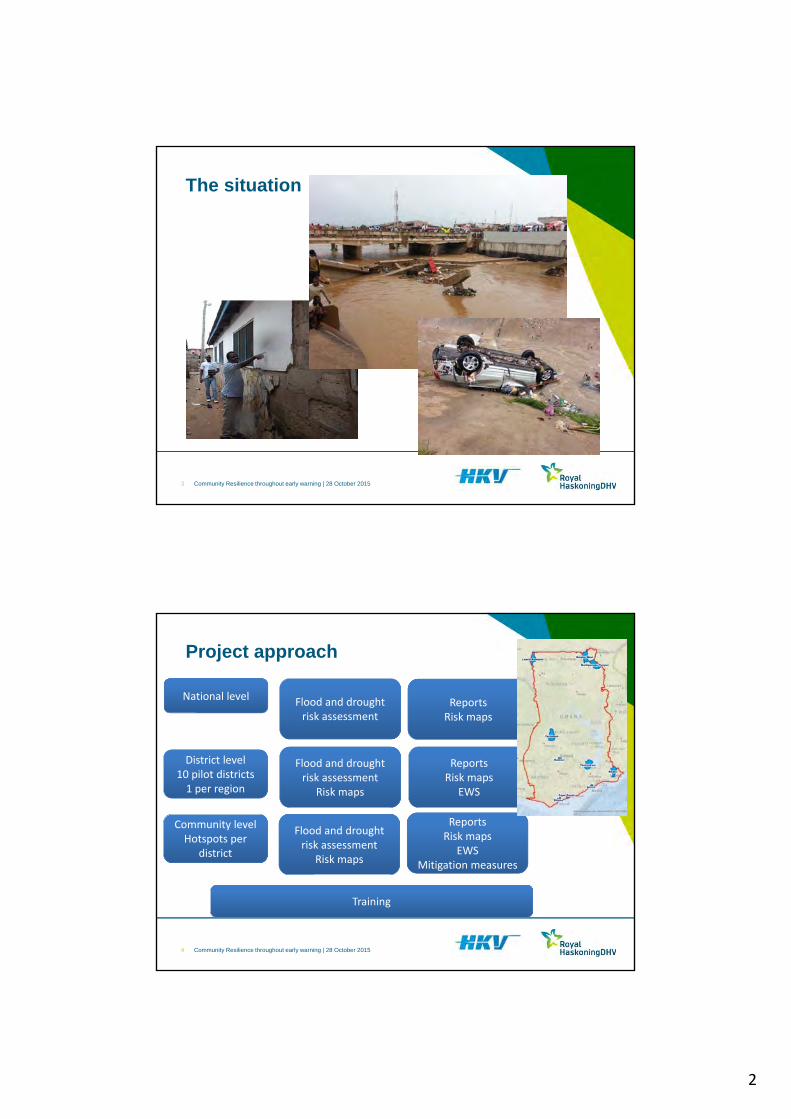
2
Community Resilience throughout early warning | 28 October 2015
The situation
3
Community Resilience throughout early warning | 28 October 2015
Project approach
National level Flood and droughtrisk assessment
District level10 pilot districts1 per region
Flood and droughtrisk assessment
Risk maps
ReportsRisk maps
ReportsRisk maps
EWS
Community levelHotspots per
district
Flood and droughtrisk assessment
Risk maps
ReportsRisk maps
EWSMitigation measures
4
Training

3
Community Resilience throughout early warning | 28 October 2015
Main components: maps and EWS
5
Community Resilience throughout early warning | 28 October 2015
Flood and drought risk maps
Risk = hazard x vulnerability / capacity Capacity: current situation = 1 (reference situation)
6

4
Community Resilience throughout early warning | 28 October 2015
Mapping -> Early Warning
7
Reponse
Example flood warning in TechimanFlood risk map
Community Resilience throughout early warning | 28 October 2015
Early Warning System
8
• Robust• Accurate • Fast
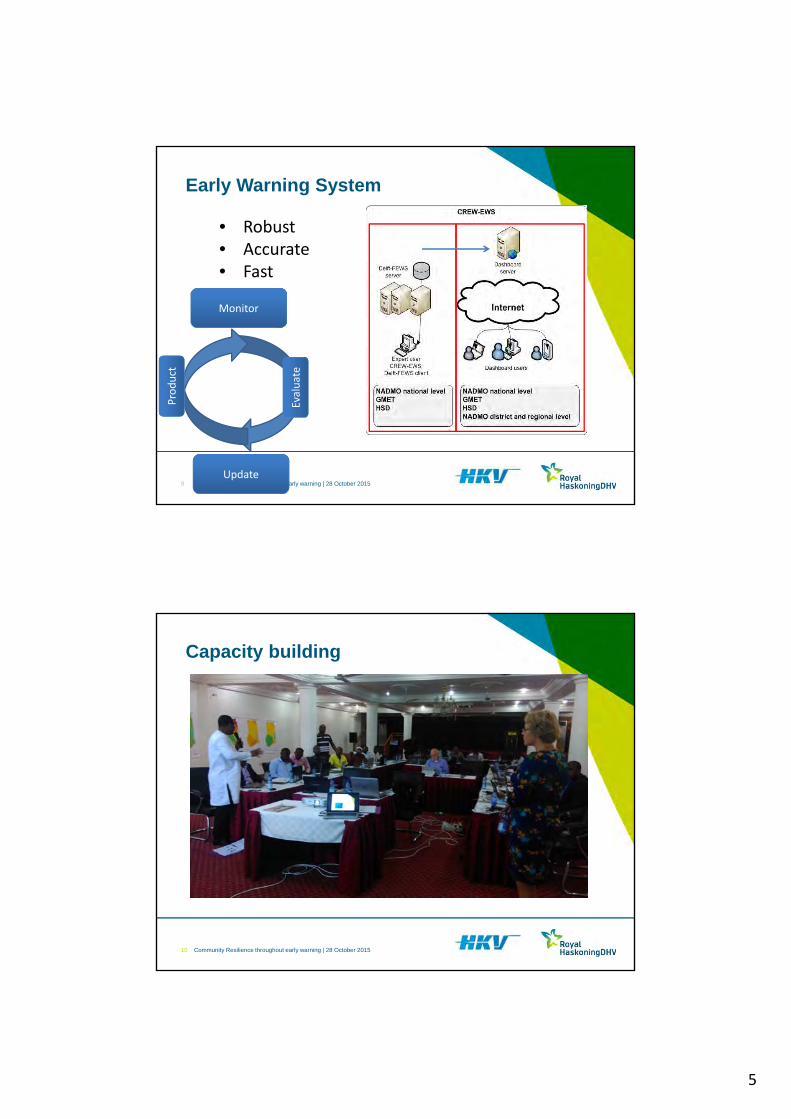
5
Community Resilience throughout early warning | 28 October 2015
Early Warning System
9
• Robust• Accurate • Fast
Product
Monitor
Update
Evaluate
Community Resilience throughout early warning | 28 October 2015
Capacity building
10

6
Community Resilience throughout early warning | 28 October 2015
Capacity building
11

1
Launch of National and District-level
Risk Maps
Willem Kroonen19 October 2015
Consultant’s Presentation
Launch of Risk Maps | 19 October 2015
Project
2
Community Resilience through Early Warning project: CREW
Funding: Norwegian EmbassyExecuting Agency: UNDPImplementing Partner: NADMOInternational Consultants: Royal HaskoningDHV with HKV

2
Launch of Risk Maps | 19 October 2015
Risk Assessment Zoom Levels
3
• National ‐ Risk Maps• Pilot Districts ‐ Risk Maps• Hotspot Communities ‐ Risk Profiling,
Mitigating Measures
• Ten pilot districts selected• One in each Region
Launch of Risk Maps | 19 October 2015
Risk Assessment: Why?
• Better information leads to better decisions• Allows well‐founded choices and priorities• A way to move from reactive to pro‐active in disaster management• Facilitates focusing on the high risk areas• Essential for policy making and spatial planning
o no urban development in high flood hazard areaso long term planning of agricultural activities
• As information source for the Early Warning System operations
4

3
Launch of Risk Maps | 19 October 2015
National level Risk Assessment
5
National level:• Flood risk and drought risk• Hazard * Vulnerability = Risk• Current situation and future situation• Future situation based on:
o Climate changeo Socio‐economic development
Launch of Risk Maps | 19 October 2015
Flood Hazard
6
Based on:• Drainage pattern• Elevation and slope• Size of river basin• Size of river

4
Launch of Risk Maps | 19 October 2015
Flood Vulnerability
7
Based on:• Land use map FAO• Population density (census)• Urban areas detailed from
OpenStreetMap
Launch of Risk Maps | 19 October 2015
Flood Risk Calculation
8

5
Launch of Risk Maps | 19 October 2015
Future Flood Risk
9
Launch of Risk Maps | 19 October 2015
District and Community levelRisk Assessment
10
For each of the ten pilot districts:• Flood and drought risk maps• Approach identical as for national level
maps but using more detailed information on elevation and urban areas
Validation of district risk maps:• In the central training course• In the communities

6
Launch of Risk Maps | 19 October 2015
Risk Assessment - Results
11
Direct outcome:• Credible maps, based on a solid approach
Indirect outcome:• Solid basis for decision making• Starting point (‘version 1’) for cyclic updates and extension• Input for Early Warning System• Opportunity for NADMO to move towards proactiveness
Possible future improvements:• Better data (higher resolution, more recent)• Mapping on community level, requires detailed data
Launch of Risk Maps | 19 October 2015
Tasks and Responsibilities - Maps
12
NADMO head office
Regional office
District office
Community
Risk maps
• Policy for cyclic update• Collection of new data/approaches• Contact with regional office
• Execute policy• Contact with local district office• Decision about additional districts
• Execute policy• Contact with communities• Collect data and input of communities
• Review the risk maps• Communicate changes / measures with
local NADMO officers
Changes need to be approved with NADMO HQ following the appropriate protocol!

7
Launch of Risk Maps | 19 October 2015
Policy
13
• Risk Assessment results show increased risks in future• Anchor Risk Assessment in policy
o Decide on approacho Extend coverageo Prescribe cyclic updates
• Example: European Flood Directiveo Compulsory for all EU member stateso Must perform flood risk assessmento Must be updated every 6 years
Launch of Risk Maps | 19 October 2015
Central Training
14
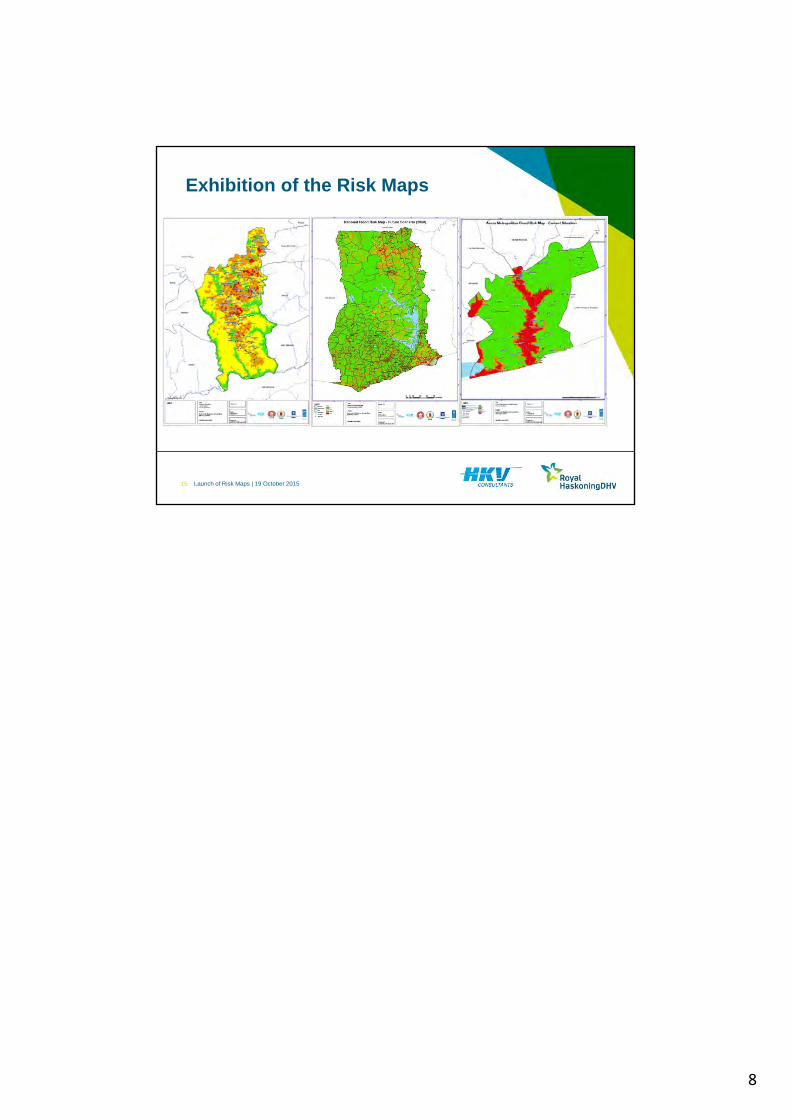
8
Launch of Risk Maps | 19 October 2015
Exhibition of the Risk Maps
15

01 October 2015 BC5721-101-100/M/411750/Nijm 1/9
Note / Memo HaskoningDHV Nederland B.V.Rivers, Deltas & Coasts
To: Attendees central Training From: Hanneke Schuurmans Date: 01 October 2015 Copy: Team Memers Our reference: BC5721-101-100/M/411750/Nijm Classification: Open Subject: Training Manual Risk Assessement
Consultancy Services for Development of Disaster Risk and Early Warning Systems in Ghana
Introduction
This manual describes the database structure as well as the tools in order to update and produce new maps for the risk assessment. The maps are made within the ArcGis 10.2 environment (ESRI software). During the course every attendee receives a trial version. This manual deals the subsequent subjects:
1. Database structure 2. How to produce new risk maps within ArcGis? 3. How to change the risk maps within ArcGis?
The manual is not a GIS course, some basic skills are required.
Database structure
Figure 1 shows the directory structure of the delivered database. There are two main folders; mapping contains all the files that are needed to produce either the national or district maps. scripts contains the scripts that were used during the hydrological risk assessments, which
transform raw input data into data that is input for the risk mapping. For flood this is the transformation from DEM data into the HAND index, for drought this is the transformation of rainfall (TRMM) and evapotranspiration (CGIAR database) into rainfall deficit data.
In this manual we focus on the mapping database. Figure 1 shows that the mapping folder contains two subfolders (i) National level maps and (ii) Pilot level maps. Both the National level maps and Pilot level maps contain the following subfolders:
- Data: contains the input GIS data - Maps: contains the final produced maps - Mxd: are the mxd files from which the maps are produced. - Scripts: can contain scripts which are used to automatically produce intermediary results.

01 October 2015 BC5721-101-100/M/411750/Nijm 2/9
Figure 1. Directory structure
How to produces new risk maps within ArcGis?
1. Produce new pilot maps If you want to produce new pilot maps please go first to the mxd file of the map you want to change. There are 6 mxd’s for the pilot level:
Fig1_FloodHazard_pilot_yyyymmdd.mxd Fig2_DroughtHazard_pilot_yyyymmdd.mxd Fig3_FloodVulnerability_pilot_yyyymmdd.mxd Fig4_DroughtVulnerability_pilot_yyyymmdd.mxd Fig5_FloodRisk_pilot_yyyymmdd.mxd Fig6_DroughtRisk_pilot_yyyymmdd.mxd
Each mxd contains the 10 pilot districts. Within the mxd you can change the layout of the maps. For example adding new GIS layers.

01 October 2015 BC5721-101-100/M/411750/Nijm 3/9
If you are going to change the layout, you should save the mxd under a new name with the correct data. Only this way you have version control. With the option ‘Data Driven Pages’ you can scroll through the maps of the 10 pilot districts. Select in the main meny Customize > Toolbars > Data Driven Pages
Export maps The maps can be exported to pdf files (or png files) via File > Export Map. You then see a screen like below.
Save as type: select PDF Below that you see Options (if it is not shown please click on Option and they appear)
Tab Pages: choose “All (10 pages) Export Pages as: choose “multiple PDF files (page names)
These pdf’s should be saved under the folder ‘Mapping > Pilot level maps > maps.
1. Produce new national maps
For the production of new national maps you can use the same procedure. Within the mxd folder there are 5 mxd’s that produce the following maps:

01 October 2015 BC5721-101-100/M/411750/Nijm 4/9
floodhazard20150312.mxd – produce the following maps: o Figure 1 – Flood Hazard – Current o Figure 2 – Flood Hazard – Future Scenario (2050)
droughthazard20150312.mxd o Figure 3 – Drought Hazard – Current o Figure 4 – Drought Hazard – Future Scenario (2050)
Vulnerabilitymapping20150312.mxd o Figure 5 – Flood Vulnerability – Current o Figure 6 – Flood Vulnerability – Future Scenario (2050) o Figure 7 – Drought Vulnerability – Current o Figure 8 – Drought Vulnerability – Future Scenario (2050)
floodrisk20150312.mxd o Figure 9 – Flood Risk – Current o Figure 10 – Flood Risk – Future Scenario (2050)
droughtrisk20150312.mxd o Figure 11 – Drought Risk – Current o Figure 12 – Drought Risk – Future Scenario (2050)
The procedure to produce the pdf files is the same as described in the pilot level maps. Please note that within each mxd of the National map you have to change the title by hand, depending on the data layer you show on the map.
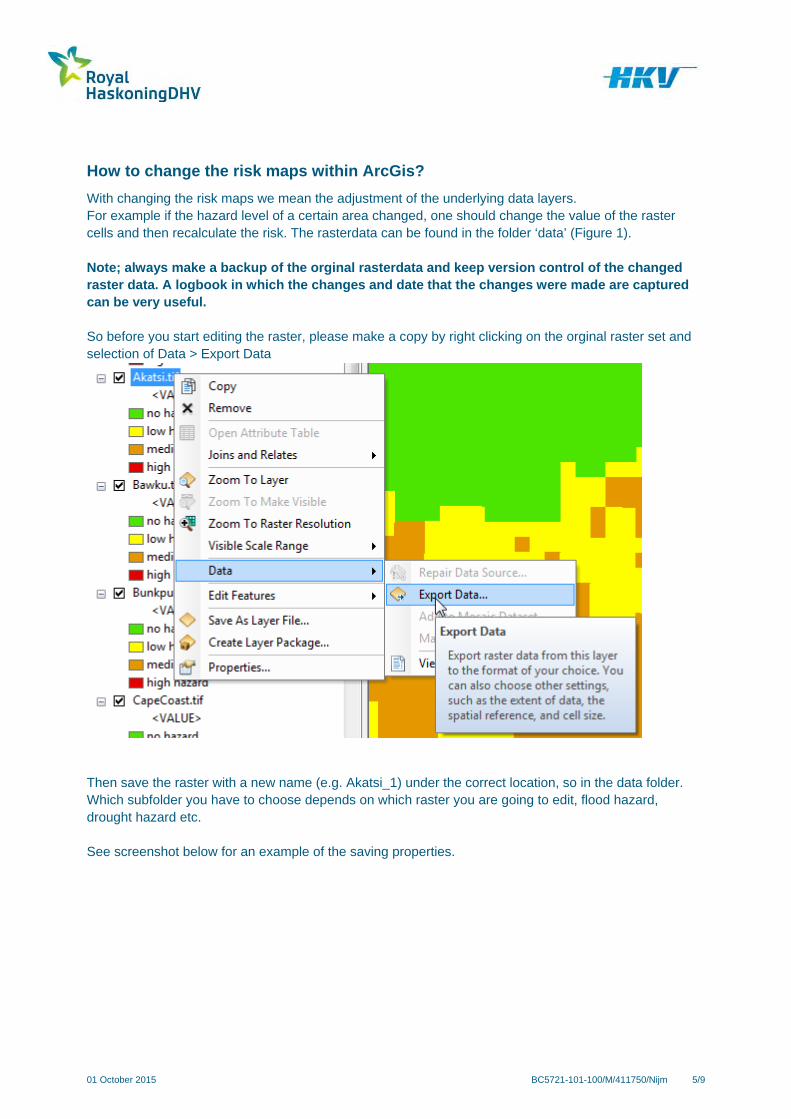
01 October 2015 BC5721-101-100/M/411750/Nijm 5/9
How to change the risk maps within ArcGis?
With changing the risk maps we mean the adjustment of the underlying data layers. For example if the hazard level of a certain area changed, one should change the value of the raster cells and then recalculate the risk. The rasterdata can be found in the folder ‘data’ (Figure 1). Note; always make a backup of the orginal rasterdata and keep version control of the changed raster data. A logbook in which the changes and date that the changes were made are captured can be very useful. So before you start editing the raster, please make a copy by right clicking on the orginal raster set and selection of Data > Export Data
Then save the raster with a new name (e.g. Akatsi_1) under the correct location, so in the data folder. Which subfolder you have to choose depends on which raster you are going to edit, flood hazard, drought hazard etc. See screenshot below for an example of the saving properties.
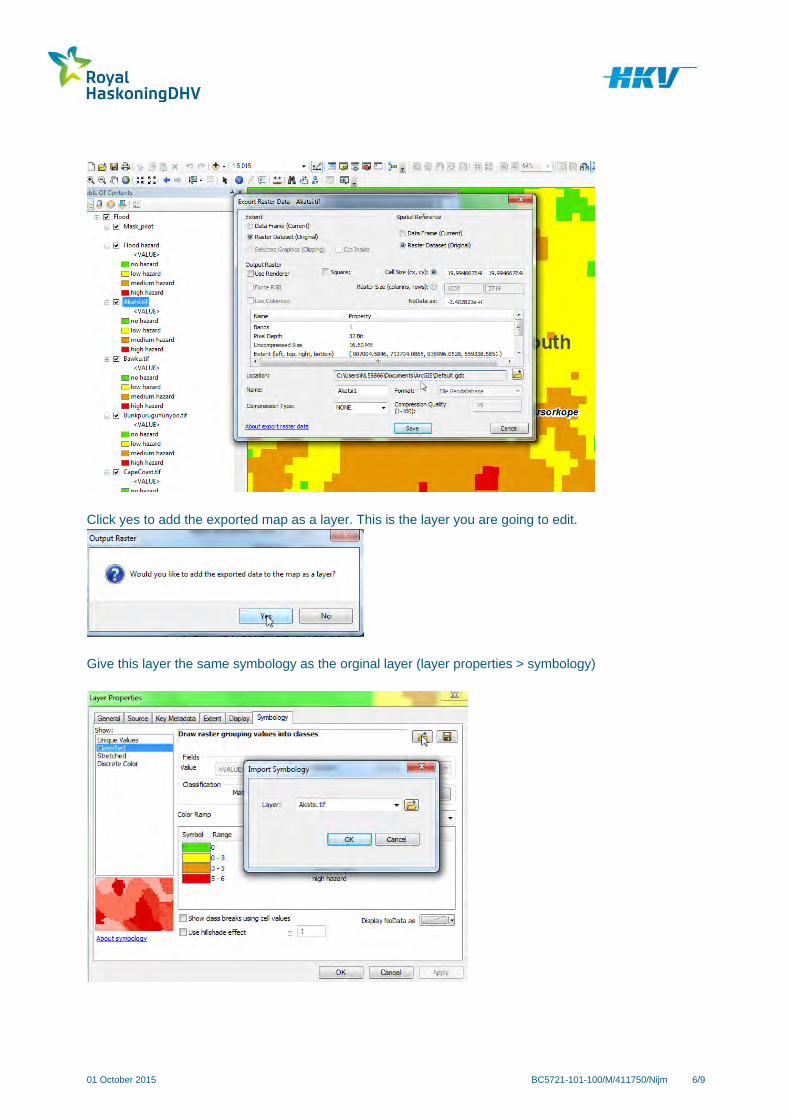
01 October 2015 BC5721-101-100/M/411750/Nijm 6/9
Click yes to add the exported map as a layer. This is the layer you are going to edit.
Give this layer the same symbology as the orginal layer (layer properties > symbology)
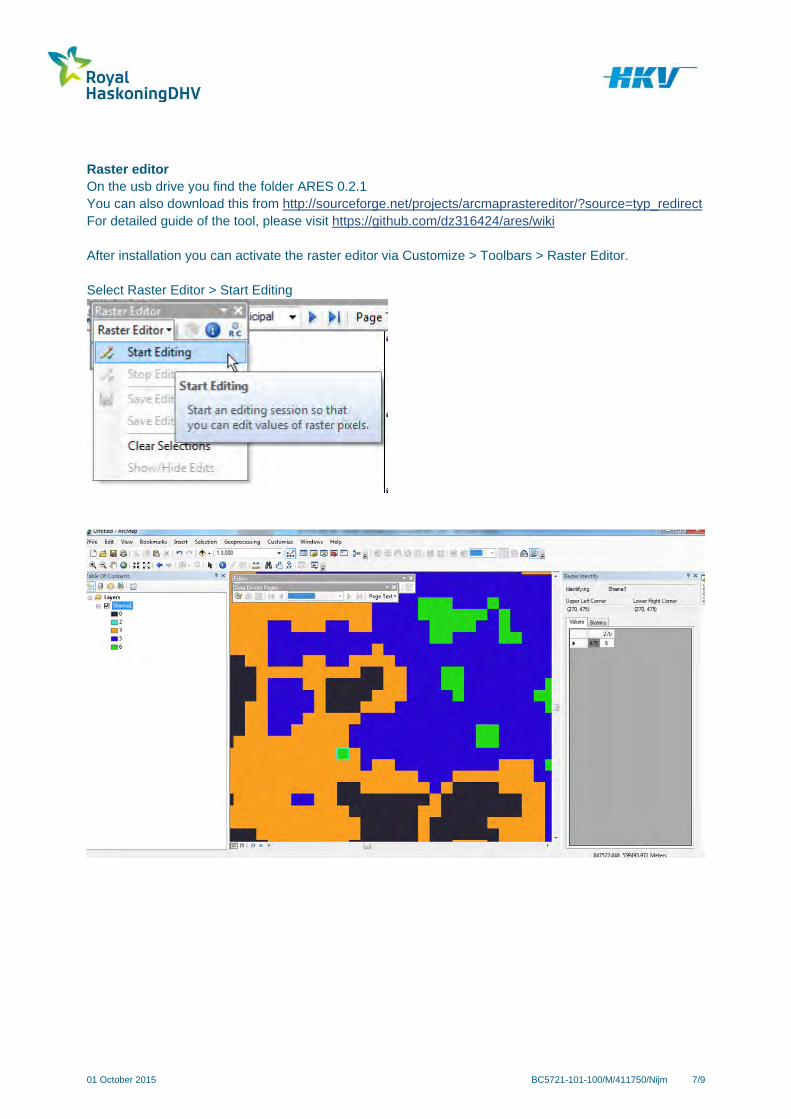
01 October 2015 BC5721-101-100/M/411750/Nijm 7/9
Raster editor On the usb drive you find the folder ARES 0.2.1 You can also download this from http://sourceforge.net/projects/arcmaprastereditor/?source=typ_redirect For detailed guide of the tool, please visit https://github.com/dz316424/ares/wiki After installation you can activate the raster editor via Customize > Toolbars > Raster Editor. Select Raster Editor > Start Editing
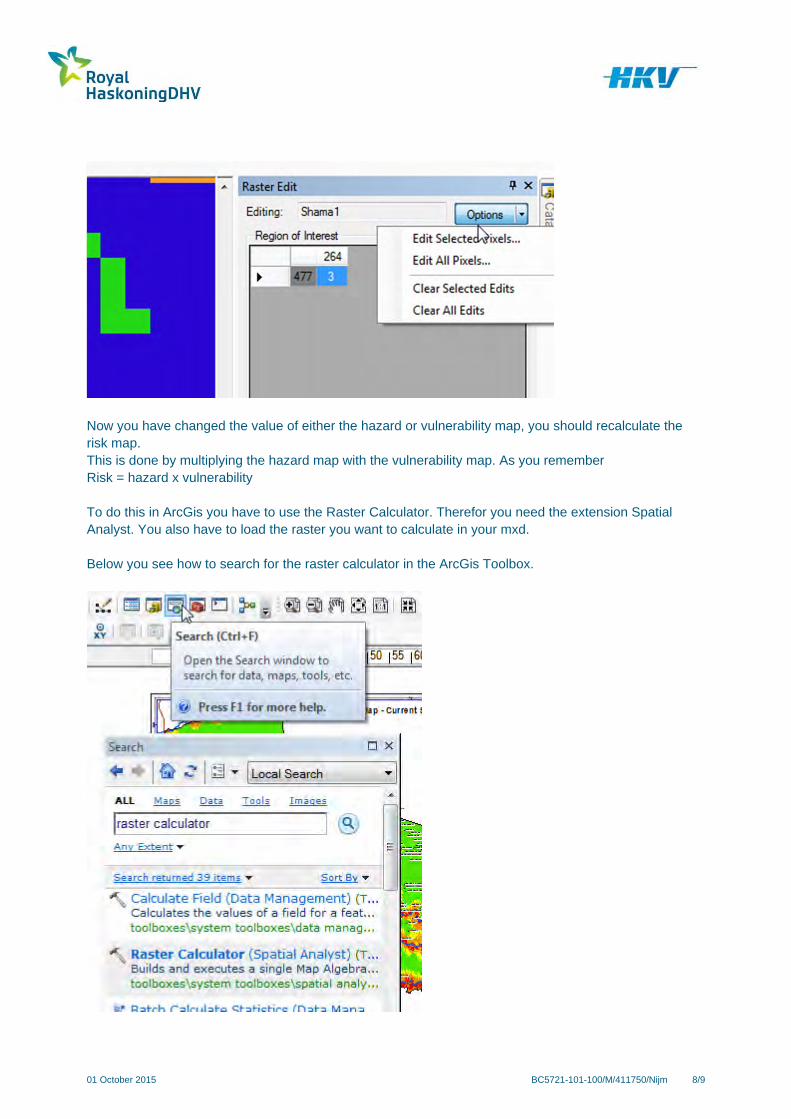
01 October 2015 BC5721-101-100/M/411750/Nijm 8/9
Now you have changed the value of either the hazard or vulnerability map, you should recalculate the risk map. This is done by multiplying the hazard map with the vulnerability map. As you remember Risk = hazard x vulnerability To do this in ArcGis you have to use the Raster Calculator. Therefor you need the extension Spatial Analyst. You also have to load the raster you want to calculate in your mxd. Below you see how to search for the raster calculator in the ArcGis Toolbox.
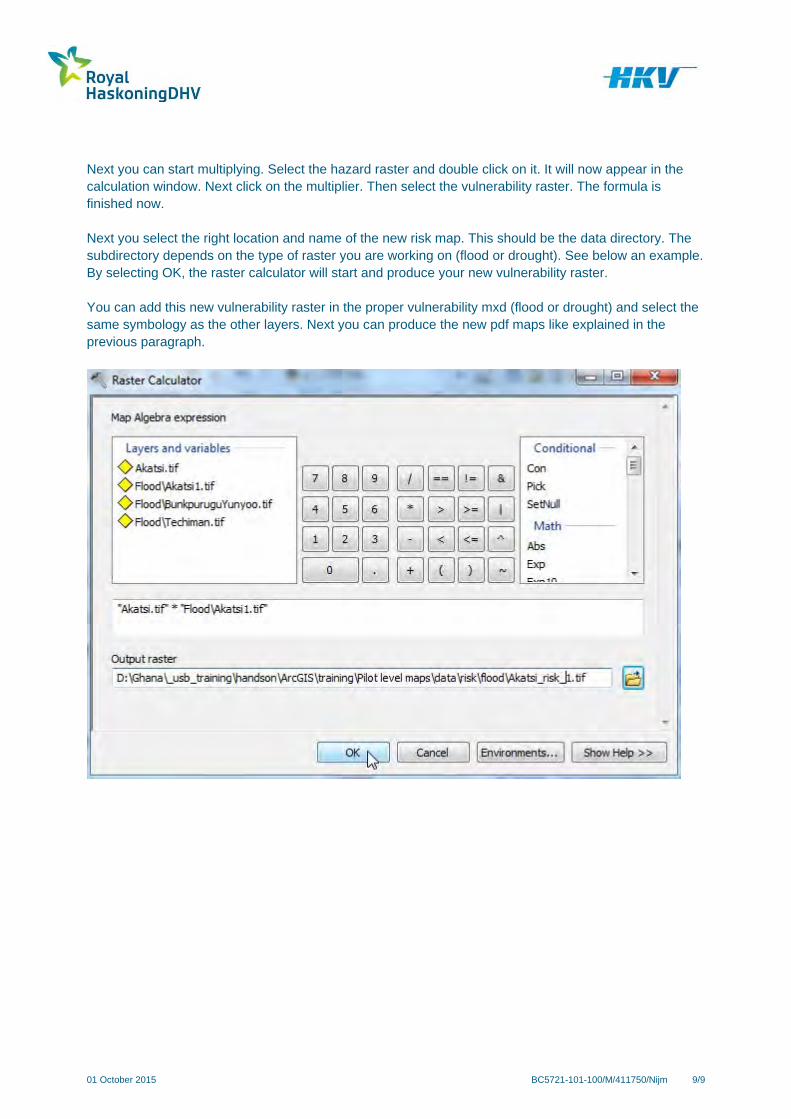
01 October 2015 BC5721-101-100/M/411750/Nijm 9/9
Next you can start multiplying. Select the hazard raster and double click on it. It will now appear in the calculation window. Next click on the multiplier. Then select the vulnerability raster. The formula is finished now. Next you select the right location and name of the new risk map. This should be the data directory. The subdirectory depends on the type of raster you are working on (flood or drought). See below an example. By selecting OK, the raster calculator will start and produce your new vulnerability raster. You can add this new vulnerability raster in the proper vulnerability mxd (flood or drought) and select the same symbology as the other layers. Next you can produce the new pdf maps like explained in the previous paragraph.

October 2015 BC5721-101-100/M/411750/Nijm
1/5
HASKONINGDHV NEDERLAND B.V.
RIVERS, DELTAS & COASTS
A company of Royal HaskoningDHV
Memo
To : EWS CREW Web users From : Job Udo Date : October 2015 Copy : Team members Our reference : BC5721-101-100/M/411750/Nijm Subject : Training Manual – EWS CREW WEB
Consultancy Services for Development of Disaster Risk and Early Warning Systems in Ghana
1. Introduction This short manual describes the use of EWS-CREW WEB. The screenshots used might be slightly different from reality, because the web-site is still under construction. 2. Start EWS-CREW WEB Open the dedicated web site (provided during the presentation). Internet access is needed for access. Login with the details provided. The web site shows three levels: National, regional and district level. 3. National level
From left to right the web site shows:
Alarm flood map: shows in which district a flood alarm is active. Alarm drought map: shows in which district a drought alarm is active. Precipitation map: shows an animation of the current rainfall pattern.
4. Regional level

October 2015 BC5721-101-100/M/411750/Nijm 2/5
From left to right the web site shows:
Alarm flood map: shows in which district a flood alarm is active. Alarm drought map: shows in which district a drought alarm is active. Precipitation map: shows an animation of the current rainfall pattern.
For now the maps only show one district, because the project was implemented in 10 districts in the different regions. 5. District level flood warning
On the left side a district can be selected for flood warning or drought warning. The national and regional level maps show in which district a flood or drought warning is active. From left to right the panels show:
Sub-basins in the district for which a flood warning might be given.

October 2015 BC5721-101-100/M/411750/Nijm 3/5
A graph that is activated when a sub-basin is selected. The flood risk map for the district. A button that can be used to active or deactivate indigenous knowledge based flood
warning. To view the forecast the following steps should be followed:
Select the sub-basin for which a warning is active (showing in red) in the most left panel. The flood hazard level graph shows in the middle panel. The graph shows the historical
flood hazard and several days of forecast hazard level (right from T0 line). Based on this figure the forecaster should decide whether to send officers to the sub-basin at risk.
Zoom in to the sub-basin that is under threat in the flood risk map on the right, notice the areas in the sub-basin that have increased flood risk. This is the area where NADMO officers should be send to or the area to which the warning should be communicated.

October 2015 BC5721-101-100/M/411750/Nijm 4/5
6. District level drought warning
On the left side a district can be selected for flood warning or drought warning. The national and regional level maps show in which district a flood or drought warning is active. From left to right the panels show:
The district for which a drought warning might be given. The warning is given for the district as a whole, so not on sub-basin level as with the flood warning.
A graph showing the actual drought hazard (rainfall deficit) and the threshold level drought hazard. When the actual drought hazard is higher than the threshold drought hazard a warning is activated.
The drought risk map for the district. The user can zoom in to have a more detailed look of the drought risk level in the district.
A button that can be used to active or deactivate indigenous knowledge based drought warning.
7. Indigenous knowledge Each district has an on-off switch to active or deactivate flood or drought indigenous knowledge warnings from local people. The warning should be provided from local people. The district NADMO officer should activate and deactivate the warning using the website. The period during which a warning was active is stored in the expert EWS-CREW and can be used to validate simulated and measured floods and droughts afterwards.

October 2015 BC5721-101-100/M/411750/Nijm 5/5
8. Additional options When clicking on the information button on a panel (i), additional information is presented such as the legend (see below).
It is also possible to select google maps, google satellite or activate/deactivate presented shape files as presented below.

October 2015 BC5721-101-100/M/411750/Nijm
1/8
HASKONINGDHV NEDERLAND B.V.
RIVERS, DELTAS & COASTS
A company of Royal HaskoningDHV
Memo
To : EWS CREW Web users From : Job Udo Date : October 2015 Copy : Team members Our reference : BC5721-101-100/M/411750/Nijm Subject : Training Manual – EWS CREW Expert
Consultancy Services for Development of Disaster Risk and Early Warning Systems in Ghana
1. Introduction This manual is additional to the general Delft-FEWS guide (Delft-FEWS Full User Guide.pdf) and focusses on the procedures relevant for EWS-CREW expert users . 2. Start EWS-CREW expert EWS-CREW runs as a client-server application. The operator client (OC) synchronises with the server when internet is available, but it can also be opened without internet. In this case the system will use data from the most recent synchronisation. EWS-CREW can be started with ***\EWS-CREW-SA\trunk\bin\crew_SA.exe. We recommend to create a short cut of crew_SA.exe and place it on your desktop. The start screen should be similar to the screenshot below:

October 2015 BC5721-101-100/M/411750/Nijm 2/8
When the screen does not contain data you should make sure that the red circled name (your user name on your computer) is listed in \EWS-CREW-SA\trunk\FEWS\Config\ SystemConfigFiles\ UserGroups.xml under “managers”. The blue circled area shows the system status. When it is red, the OC is logged off, purple means it is synchronising and green means it is logged on and synchronised.
3. Viewing data When the Data viewer panel is activated, the data selection appears. You can select data by combining a filter, location and parameter. It is also possible to select a location directly from the map interface. The figure below shows a selection of Flood GPM (filter), Accra (location)and discharge (parameter). It is possible to zoom and pan using the red lined buttons. It is easier to this using your mouse wheel (right click and drag for pan, mouse wheel for in-out zooming).
When selected you can view the data series by clicking Multiple data series can be viewed as well by pressing Ctrl button while selecting.
button opens the grid display, showing the spatial distributed data. You can view it as an animation, but also by double clicking an active data set. The series at the selected location will be made visible in a graph.

October 2015 BC5721-101-100/M/411750/Nijm 3/8
4. Flood forecasting Data relevant for flood forecasting can be selected under the “Flood TRMM” or “Flood GPM” filter. At the moment two types of data are used to make the forecast: TRMM and GPM (both satellite data). This is because GPM is the successor of TRMM and at this moment we are in a transition phase. The forecasting routine is calculated on the server and the results are synchronized with the OC. The forecaster should be able to interpret the results and provide its expert judgement on the forecast. When a flood warning is provided an exclamation mark will become visible on the map and in the location filter
.
The following steps should be made by the forecaster:
We recommend using the Flood GPM data, which is normally more accurate, but sometimes not stable. A warning should be checked for TRMM based as well as GPM based forecasts.
Locate the warning location(s) on the map. Mind: in most cases this will be more than one. In the example below we show Akatsi district.

October 2015 BC5721-101-100/M/411750/Nijm 4/8
Select the sub-catchments that show a warning, select the parameter (Discharge –
simulated) and select the time series display , in this case Akatsi_001, Akatsi_028 and Akatsi_036.
The graph will now show the calculated flood hazard level(s) both historical as well as the forecast. The threshold levels are also displayed.
Note: we use a discharge to illustrate the flood hazard level. The discharges are simulated and not measured. In the dashboard the discharges are presented as “Flood hazard level”.
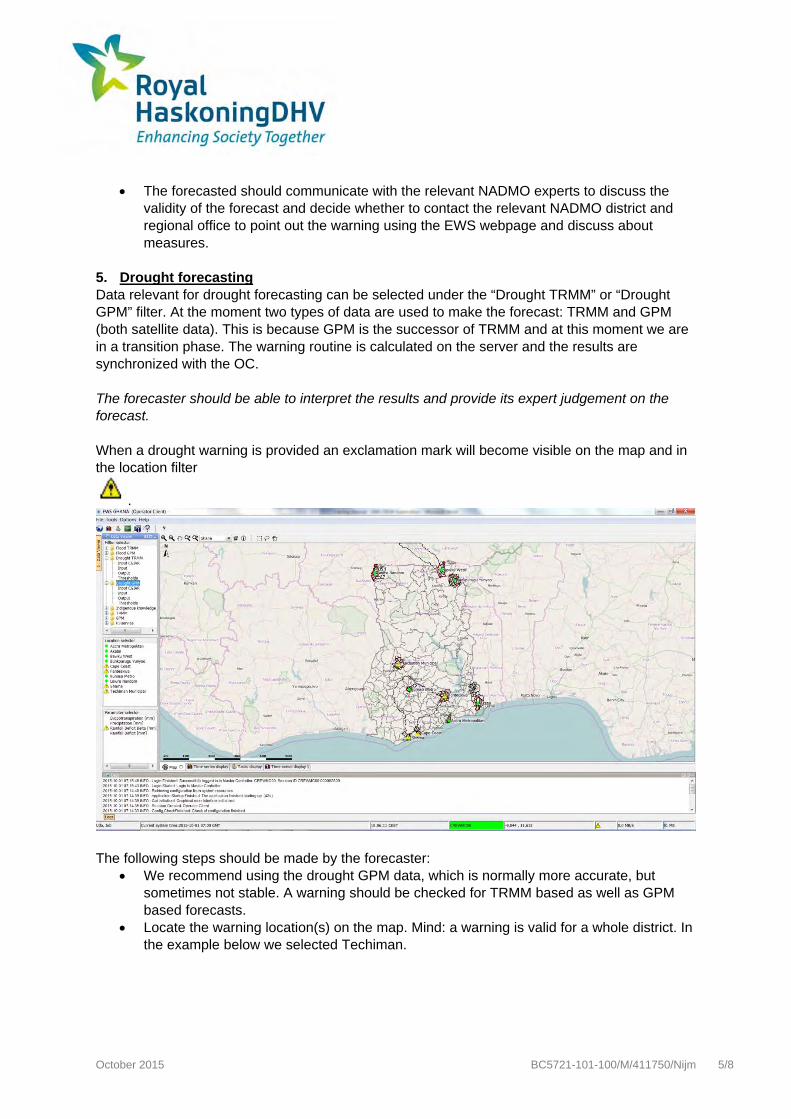
October 2015 BC5721-101-100/M/411750/Nijm 5/8
The forecasted should communicate with the relevant NADMO experts to discuss the
validity of the forecast and decide whether to contact the relevant NADMO district and regional office to point out the warning using the EWS webpage and discuss about measures.
5. Drought forecasting Data relevant for drought forecasting can be selected under the “Drought TRMM” or “Drought GPM” filter. At the moment two types of data are used to make the forecast: TRMM and GPM (both satellite data). This is because GPM is the successor of TRMM and at this moment we are in a transition phase. The warning routine is calculated on the server and the results are synchronized with the OC. The forecaster should be able to interpret the results and provide its expert judgement on the forecast. When a drought warning is provided an exclamation mark will become visible on the map and in the location filter
.
The following steps should be made by the forecaster:
We recommend using the drought GPM data, which is normally more accurate, but sometimes not stable. A warning should be checked for TRMM based as well as GPM based forecasts.
Locate the warning location(s) on the map. Mind: a warning is valid for a whole district. In the example below we selected Techiman.

October 2015 BC5721-101-100/M/411750/Nijm 6/8
Select the threshold filter under Drought GPM, select the district (Techiman) that shows a
warning, select the parameter (rainfall deficit delta) and select the time series display
The graph will now show the calculated drought hazard level, being the difference
between actual rainfall deficit and the 25% rainfall deficit. When this value is greater than zero, a warning is issued.
When selecting the “Ouput filter”, “Rainfall deficit” parameter and the time series display you will see the actual rainfall deficit and synthetic rainfall deficit series like 25% and

October 2015 BC5721-101-100/M/411750/Nijm 7/8
50%. In the example below, the current rainfall deficit is large compared to normal standards.
The warnings should be communicated with the relevant NADMO experts to discuss the
validity of the warning and decide whether to contact the relevant NADMO district and regional office to point out the warning using the EWS webpage and discuss about measures.
6. Adjusting flood warning levels (thresholds) Flood warning levels should be evaluated with field observations. When a flood warning is provided, but the no floods were observed in the field, flood warning level(s) for the specific area(s) should be raised. When a flood warning was not issued, but a flood in the field was observed, flood warning level(s) for the specific area(s) should be lowered. The observations should be made in the field by local staff or community members. The most important thing is that the location (area) should be clearly communicated. Adjusting of the levels can only be done by forecast specialists. We assume that local observations differed from the system outcome and forecast specialists decided to change the warning level. The following steps should be made:
Make sure to have open office installed. Define which area(s) you want to change the level for (for instance Akatsi_001), and what
value you prefer (for instance 60 instead of 40), also see below.
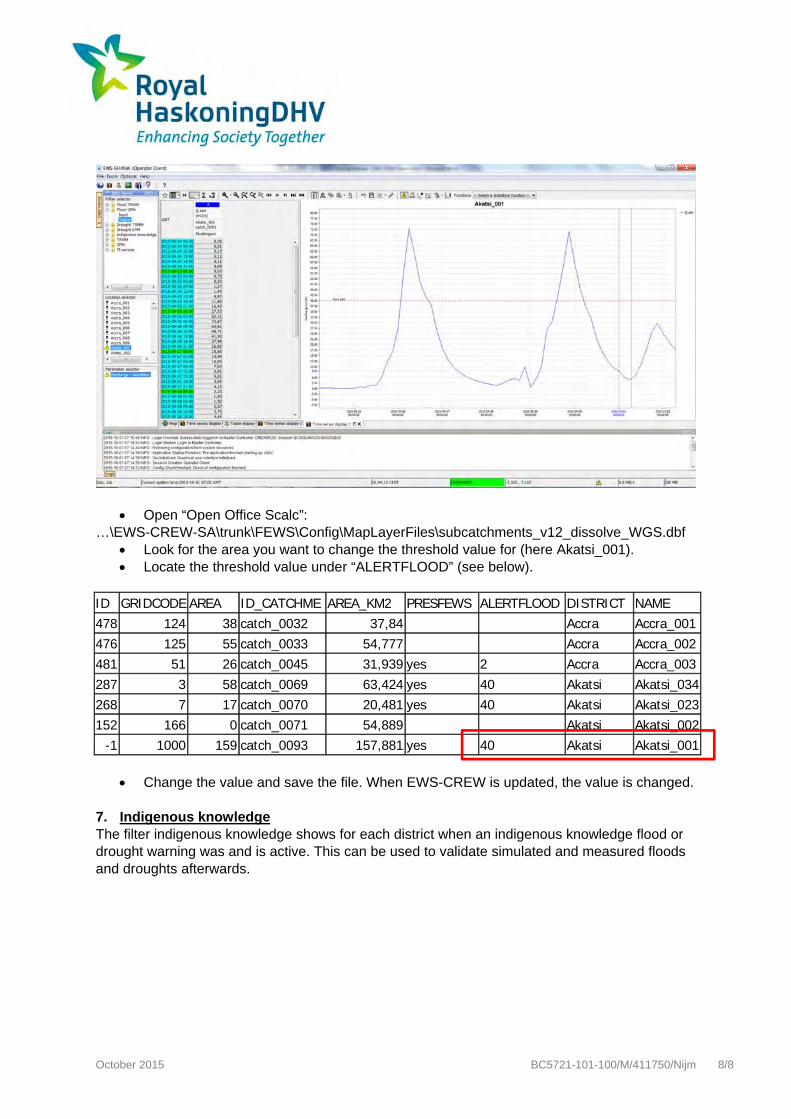
October 2015 BC5721-101-100/M/411750/Nijm 8/8
Open “Open Office Scalc”: …\EWS-CREW-SA\trunk\FEWS\Config\MapLayerFiles\subcatchments_v12_dissolve_WGS.dbf
Look for the area you want to change the threshold value for (here Akatsi_001). Locate the threshold value under “ALERTFLOOD” (see below).
ID GRIDCODE AREA ID_CATCHME AREA_KM2 PRESFEWS ALERTFLOOD DISTRICT NAME 478 124 38 catch_0032 37,84 Accra Accra_001476 125 55 catch_0033 54,777 Accra Accra_002481 51 26 catch_0045 31,939 yes 2 Accra Accra_003287 3 58 catch_0069 63,424 yes 40 Akatsi Akatsi_034268 7 17 catch_0070 20,481 yes 40 Akatsi Akatsi_023152 166 0 catch_0071 54,889 Akatsi Akatsi_002
-1 1000 159 catch_0093 157,881 yes 40 Akatsi Akatsi_001
Change the value and save the file. When EWS-CREW is updated, the value is changed.
7. Indigenous knowledge The filter indigenous knowledge shows for each district when an indigenous knowledge flood or drought warning was and is active. This can be used to validate simulated and measured floods and droughts afterwards.


![ASAHI KASEI [AK4702EQ] - AKM - Asahi Kasei … KASEI [AK4702EQ] MS0424-E-00 2005/09 - 5 - PIN/FUNCTION No. Pin Name I/O Function 1 VCRC O Chrominance Output Pin for VCR 2 VVSS - Video](https://static.fdocuments.net/doc/165x107/5b0475c77f8b9a8c688db33a/asahi-kasei-ak4702eq-akm-asahi-kasei-kasei-ak4702eq-ms0424-e-00-200509.jpg)


