Central & Southern Scotland Future Energy Scenarios - RIIO ... · SP Energy Networks are part of...
14
R e l i a b i l i t y I n n o v a t i o n E n v i r o n m e n t & S u s t a i n a b i l i t y N e w C o n n e c t i o n s O u r N e t w o r k V a l u e F o r M o n e y W o r k i n g W i t h Y o u F u t u r e R e a d y Central & Southern Scotland Future Energy Scenarios spenergynetworks.co.uk RIIO-T2, 2019 Update
Transcript of Central & Southern Scotland Future Energy Scenarios - RIIO ... · SP Energy Networks are part of...

Relia
bility
Inno
vation
Enviro
nment & Sustainability
New
Connections
Our
N
etwork
Valu
e For Money
Wor
king With You
Futu
re Ready
Central & Southern Scotland Future Energy Scenarios
spenergynetworks.co.uk
RIIO-T2, 2019 Update

SP Transmission
Scottish Hydro-Electric Transmission
National Grid Electricity
TransmissionOur Business
Our network area serves around 6% of all customers in Great Britain, and we have connected 28% of all GB wind generation to date
Our transmission network comprises over 4,300 kilometres of circuits and 156 substations operating at 400kV, 275kV and 132kV
4,300KM
28%
Regulatory Asset Value is forecast to be £2.5bn at the end of RIIO-T1
£2.5bn
SP Energy Networks owns three regulated electricity network businesses in the UK: SP Transmission plc (SPT), SP Distribution plc (SPD) and SP Manweb plc (SPM).
SPT is the licensed Transmission Owner (TO) for the Central Belt and South of Scotland. We serve 2 million customers connected via our distribution network and our workforce of 488 internal employees are supported by around 160 major contractors and suppliers.
Our network is crucial to the delivery of the Government’s renewable energy objectives due to its geographical location in an area of outstanding renewable resource. We therefore have a unique role in connecting renewable generation and delivering the bulk transfer of renewable energy from Scotland into the centres of demand in England & Wales, benefiting consumers well beyond our licence area.
SP Energy Networks are part of the Iberdrola Group. Iberdrola is a global energy leader, the number-one producer of wind power and one of the world’s biggest electricity utilities by market capitalisation. Iberdrola will invest 34 billion euros during 2018–2022, laying the foundations for sustainable growth over the next decade in the countries in which it operates. The UK makes up 17% of this total global investment portfolio.
At SP Transmission we take electricity generated from power stations, windfarms and various other utilities and transport it through our extensive transmission network to get it to where it is required.
Page
Contents Introduction 2
Future Challenges for the Network 4
Key changes to the transmission network 5
Our Future Energy Scenarios 6
Electricity Generation 8
Electricity Consumption 12
Electricity Transmission 18
Conclusions 22
1Central & Southern Scotland Scenarios

We would welcome any feedback that stakeholders have on this document to: [email protected]
8,125 Electric vehicles are registered in our network area, 0.4% of cars in the SPT network area
2010 to 2018 Projections for 2026
By 2026, we expect the share of electric vehicles registered in our network area to rise up to 8.1%
8,125Reduction of 3,386MW of coal generation since 2010 due to decommissioning of power stations
Total generation to rise from 7,892MW in 2018 to between 10,061MW and 14,243MW
–3,386MW3,076MW of connected wind generation since 2010
Between 7,188MW and 10,353MW largely due to offshore wind
Approximately 6,000 properties are heated using heat pumps
Further reductions in peak demand of between 2.2% and 9.4%
Between 0.7% and 5% of properties will be heated by heat pumps6,000
2.9%Peak demand has reduced by 2.9%
This period will see many changes on the electricity network as greater volumes of renewable generation connect to the system, the existing nuclear generation approaches the end of its operational life and the first offshore wind farms connect.
We also expect to see the way electricity is consumed to evolve as more customers move to electric vehicles for transportation and the decarbonisation of heat could lead to greater reliance on electricity for a clean source of energy rather than gas.
A refresh of the scenarios was published by the ESO in July 2019 and we had previously committed to examining the impact if any that this had on our previous assumptions.
Separately, we had also published a document detailing some of the historic trends that we have seen with electricity supply and consumption since 2010. This was designed to help provide context to the future scenarios by outlining some of the historic changes that we have seen.
In this refresh of the electricity scenarios for 2019, we have now incorporated the historic trends to provide a complete view on some of the notable changes both in the past as well as looking forward. We have also sought to help provide some context to these changes by referencing the relevant parts of our business plans to address the issues which will emerge as a result of these changes. To help explore the interactions with these various elements, we
published a range of energy scenarios and consulted on them with stakeholders in the summer of 2018. These scenarios were based on the National Grid Electricity System Operator (ESO) Future Energy Scenarios (FES) published in 2018. Overall these were broadly supported by stakeholders with feedback in some areas which we have reflected into the creation of our business plan. Since then, we have also published the first draft of our RIIO-T2 business plan which applied these scenarios to help inform the changes we expect we need to make on the network.
UP TO 158,000UP TO 6,351MW
UP TO 67,000
2.2–9.4%
Over the last twelve months, we have been developing our RIIO-T2 business plan which details our vision for the transmission network in Central & Southern Scotland for the period 2021-2026.
+3,076MW +5,904MW
3Central & Southern Scotland Scenarios2 SP Energy Networks , RIIO-T2 2019 Update

Many of the changes which the transmission network will need to adapt to are still relevant following this refresh of the scenarios. The one major change that we have seen is a move towards a target of 2045 for net zero greenhouse gas emissions in Scotland, and 2050 more widely across Great Britain.
Stakeholders are asking us what this will mean for the electricity network. At this stage it is still too early to tell exactly the implications over the longer term due to the level of uncertainty and changes that will be required in response to government policy and other changes in the market to enable this.
The Committee on Climate Change (CCC) have identified the key changes that need to be undertaken in their report ‘Net Zero – The UK’s contribution to stopping global warming’. This outlines some of the short term changes that will need to take place before 2030, and those in the longer term. A summary of the key changes in the 2020s are shown opposite which is most relevant to the RIIO-T2 period. The majority of these factors are included in the scenarios which this document details. Some of the more radical changes required in the longer term, post 2030, are not accounted for as part of our analysis for RIIO-T2 such as the extensive use of hydrogen or deployment of carbon capture. These are much more difficult to understand where and how these will be realised.
CCC net-zero Greenhouse Gas steps for the 2020s:
Electricity – Largely decarbonise electricity: renewables, flexibility, coal phase-out
Hydrogen – Start large-scale hydrogen production with CCS
Buildings – Efficiency, heat networks, heat pumps (new-build, off-gas, hybrids)
Road transport – Ramp up of EV market, decisions on HGVs
Industry – Initial CCS clusters, energy and resource efficiency
Infrastructure – Industrial CCS clusters, decisions on gas grid and HGV infrastructure, expand vehicle charging and electricity grids.
Future Challenges for the Network
Key changes to the transmission network
In addition to this, the Scottish Government has set a number of ambitions for 2030 which we are accounting for in our approach:
By 2030, the equivalent of 50% of the energy for Scotland’s heat, transport and electricity to be supplied from renewable sources.
Scotland should have the capacity, connections, flexibility and resilience necessary to maintain secure and reliable supplies of energy to all of our homes and businesses as our energy transition takes place.
By 2032, phase out the need to buy petrol and diesel cars or vans.
Generation New connections As new generators seek to connect to the transmission network, new assets are required to accommodate them. This can include overhead lines, cables or substations depending on the location and size of the generator. This may also result in increasing the capacity at other points on the network to allow power to get to the areas of demand.
Changes to existing connections
As existing generators such as windfarms increase capacity, this may require new assets, but at other times can be managed using smarter techniques to manage the generator within the existing equipment limits.
Removal of generation
As generation plant comes to end of life; the removal can impact the operating conditions of the wider network. The loss of thermal generation in the SPT network area has had an impact on system inertia which changes how the system as a whole reacts to events. We are also seeing greater fluctuations in the transmission voltage as the generation mix changes. This can trigger reinforcement to ensure the system continues to be safe and operates reliably.
Demand Existing demand The electricity being consumed by all types of customers; domestic, industrial or commercial, has an impact on the power which flows through the network. Over the last ten years we have seen a progressive decrease in demand due to changes in the industrial landscape in Scotland as well as major progress in energy efficiency measures.
New demands The move towards electrifying transport will result in increasing demand for electricity. The decarbonisation of heat may also result in more buildings being heated by electric heat pumps.
Flexibility The time at which electric vehicles are charged will need to be flexible to minimise the impact on the network. An example of this is when an electric vehicle is charging overnight, it may be cost effective to delay the charge until demands on the network are lower.
Other changes Interconnection in Great Britain
The SP Transmission network is interconnected with SSEN to the north and National Grid to the south. In these respective areas, the generation mix and consumption profile is quite different. For large parts of the year, power is transmitted from Scotland to England due to the amount of wind generation located here. At other times, the flows can reverse due to the increasing volumes of solar generation in England as well as other traditional generation when the wind levels in Scotland are low. Across Great Britain, the number of points of connection with Europe is increasing.
Storage Historically electricity has been difficult to store at large scale, only pumped-storage was technically and economically feasible. We are now seeing a greater interest in large scale batteries connecting to the distribution and transmission network. This allows power to be stored when it is plentiful and low cost, and provided back to the network when generation is constrained.
Decentralisation As energy is increasingly generated locally and decentralised, the transmission network will continue to play a role to link and allow for coordination of these different resources nationally. In the SPT area, we are already experiencing high levels of generation connected to the distribution network and are now exporting onto transmission.
5Central & Southern Scotland Scenarios4 SP Energy Networks , RIIO-T2 2019 Update

Our Future Energy Scenarios
The SPT scenarios use the four National Grid 2019 Future Energy Scenarios as the starting point. The Future Energy Scenarios are intended to identify a range of credible scenarios across gas and electricity on a GB-wide basis. They are developed through extensive engagement with stakeholders and are widely recognised as a reference point.
Following the publication of our previous document, we engaged with a range of stakeholders including directly connected customers, consumer representative groups, trade bodies and other interested parties.
This engagement has included bilateral meetings, response to our previous consultation, feedback from our webinar and views from our TO User Group. We have sought to include the feedback in this refresh and in how we have developed our RIIO-T2 business plan.
Stakeholder feedback How we have reflected this
Strong support for the use of scenarios and the FES as the basis for informing our business plan on some of the key changes going forward
We have continued to use the FES for this refresh and the overall structure is consistent with the previous approach. This approach helps to ensure consistency with other industry processes which also rely on this data and ensures a consistent approach.
Small scale gas turbines are likely to play a greater role in the future network but are not considered in the FES
Small scale gas turbines are included in the scenarios as controllable distributed generation. We will continue to monitor this with SGN as the gas network operator in Scotland to ensure consistency and effective whole system planning.
Levels of solar generation may be substantially higher than the FES
We have maintained our projections to be consistent with the FES but modelled the potential impact of greater volumes of solar generation on the network. We are confident the mechanisms we have will allow us to flex our plans to accommodate this should it happen. We have also incorporated a number of GSP upgrades at sites which are currently constrained. Over the course of RIIO-T2, we will continue to work closely with SP Distribution to ensure the transmission network can cater for any changes which are beyond our current projections.
The scenarios did not consider economic factors which may impact the future pathways
Assumptions are made on the future economic trends as part of the FES which we have maintained in our analysis. Some of the changes which will be required will depend on policy and economic factors but we have not sought to take a view on these to reduce the number of variables.
It is not reasonable to select a single scenario due to the level of uncertainty and the plans should consider how they can adapt to the different scenarios
We have continued to use all four scenarios to test our plans that they can adapt to different outcomes. The Energy Networks Association have developed a common scenario for RIIO-T2 which we have reflected in our business plan.
Support for the assumptions relating to flexibility of demand
The FES has updated its assumptions for flexible demand following further research and we have incorporated this into our own analysis. These changes include assumptions behind the size of vehicle batteries, the charging pattern of electric vehicles and other elements of demand response from both domestic and industrial and commercial customers.
The scenarios did not consider the changes required for black start resiliency, system security or staff.
We have considered these separately in our business plan as changes we need to make as a consequence of the different scenarios rather than input variables to the scenarios.
National Grid Future Energy Scenarios Incorporating stakeholder feedback
The National Grid Future Energy Scenarios, are framed by two key drivers of change:
Whether the scenarios meet the overarching 2050 carbon reduction targets
The degree of decentralisation of the energy system
The National Grid Future Energy Scenarios already contain a spatial breakdown within SPT’s licence area by grid supply points. However, this breakdown is generally based on simple GB-wide proxies and hence a key focus of this analysis has been to tailor better the final scenarios to SPT’s area. This was undertaken via a number of routes including use of supplementary data sources, refinement of the methodology to disaggregate to grid supply point level, and feedback from SPEN and external stakeholders.
All data in the scenarios reflects the SPT network area of Central & Southern Scotland. Data is projected out to 2040 although the main analysis covers the period out to 2030. This encompasses the RIIO-T2 period as well as the early years following that to consider the impact on the network.
The Future Energy Scenarios also consider gas and the future role of hydrogen. No modelling has been undertaken of these at a local level, as it has been assumed that the FES projections apply within Central & Southern Scotland.Whilst the scenarios extend beyond 2026, it is the potential pace of
change through the RIIO-T2 period – 2021-2026 – and in the years shortly thereafter that is of most importance to SPEN when planning investment for our RIIO-T2 submission.
The scenarios do not yet reflect the updated ambition for Scotland to have a net-zero greenhouse gas emissions by 2045 nor the UK target of 2050. Further consideration of the impact of this ambition is currently being examined and the effect on our plans.
Overview of National Grid’s 2019 Future Energy Scenarios
The key focus of our analysis has been to tailor the scenarios to SPT’s network area.
7Central & Southern Scotland Scenarios6 SP Energy Networks , RIIO-T2 2019 Update

Electricity Generation
In 2010, there was 8,000MW of connected generation in Central & Southern Scotland; most of this was connected to the transmission system. This generation portfolio primarily comprised of fossil fuel powered generators, most of which have since been decommissioned.
This capacity has been replaced with renewable sources resulting in around the same level of overall generation in 2018 as there was in 2010. However, more of this generation capacity is being connected to the distribution network. This is significantly different when compared with 2010 when only 11% of generation was connected to the distribution network.
One of the major changes has been the change to the location of generation. Thermal generation had been located across the central belt of Scotland, but we now have large volumes across Ayrshire, Dumfries & Galloway and the Borders. These are a long way from the demand and are dependent on the transmission network to move the power around the country.
The transmission generation portfolio in Central & Southern Scotland has undergone a number of significant changes in the past 8 years.
Notably, the closure of the coal power stations, Cockenzie in 2013 and Longannet in 2016, has resulted in 3,400MW being removed from the network. This loss was predominantly offset by an increase in the generation capacity of onshore wind. The graph opposite shows how this has altered the mix of generation directly connected to the transmission network.
From 2017 to 2018, the main change we have seen is further growth in wind generation from 2,458MW to 2,722MW, an 11% increase.
Increase in wind generation from 2017-2018
Increase in capacity from 2017-2018
The generation capacity connected to the distribution network has increased significantly.
Overall, embedded generation has increased from 900MW in 2010 to 2,400MW in 2018. This is primarily due to an increase in onshore wind generation from 609MW in 2010 to 1,727MW in 2018.
Transmission Connected Generation
Distribution Connected Generation
Total Connected Generation
2018
DistributionTransmission
Overall generation split
30%70%
+11%
+1,482MW
Hydro
Onshore windNuclear
Pumped StorageCoal
BiomassOther
CHP
Onshore windPV
Capacity (MW)
8,000
7,000
6,000
5,000
4,000
3,000
2,000
1,000
2010 2017 2018
Capacity (MW)
2,500
2,000
1,500
1,000
500
2010 2017 2018
Geographic Location of Renewable Generation
BiomassSolar PVWindHydro
Biogas
Technology
Capacity (MW)
>200
100-20030-10010-20<10
9Central & Southern Scotland Scenarios8 SP Energy Networks , RIIO-T2 2019 Update

Combining both distribution and transmission generation there is a large degree of uncertainty in the scale and timing of new generation.
Solar photovoltaics (PV) capacity can be split broadly into small-scale building rooftop (or “Behind the Meter”) schemes and larger scale solar farms, which connect directly into the distribution network. This table shows the growth in PV generation from 2010 to 2030.
In addition to the growth of Wind Generation and PV, the mix of distribution generation includes storage, non-renewable thermal, renewable thermal and hydro.
Growth in wind generation is expected to continue throughout the RIIO-T2 period.
From the scenarios in 2030 it is anticipated to have between 9,300MW and 13,700MW of connected generation compared with 8,000MW in 2010. From 2026 to 2030, we expect a slight decline in overall generation with the closure of the last nuclear generator in Scotland. This will bring with it different challenges as we lose further synchronous generation.
Beyond 2030, this loss will be quickly offset by further renewable generation which is expected to connect, in particular, large contributions from offshore wind.
Future increases in PV capacity are highly uncertain, but could be significant by 2030. Increases in the RIIO-T2 period are relatively small and from a low starting point. There was very little PV in 2010 and below 50MW in 2017 and 2018. The actual impact of solar by itself on the network is more limited given its low output, particularly at times of winter peak which coincide with the times of least daylight in Scotland.
Across RIIO-T2 period PV will have a minimal impact on winter peak in Scotland, and have a relatively low impact on summer minimum demand.
These types of generation tend to have much smaller capacity and combined together they make up just 7% of the overall generation mix. However, they remain an important consideration throughtout the RIIO-T2 period with the potential to increase by around 500MW from 2018 to 2026.
In the above categories combined, there is a projected increase through the RIIO-T2 period and into 2026. In 2010 there was no Distribution connected Storage. In 2018 there was 50MW of Storage generation, which could rise to 352MW in 2026 under the high scenario.
Through the remainder of RIIO-T1, increases will be seen through further onshore wind generation connecting to the network. From 2021 onwards, offshore wind is anticipated to be connected and will make a major contribution to the overall levels of generation we have connected. By 2026 up to 2,550MW of offshore wind is expected.
Total Generation Scenarios Solar Photovoltaics
Other Distributed Generation
Wind Generation
Up to 71% increase in total generation by 2030.
Growth of up to 477% by 2030
Up to 137% growth in wind generation by 2030 Growth of up to 120% by 2030
+71%+477%
+137% +120%
Low
Low
Onshore wind
StorageHydro
Pumped StorageNuclear
Coal
Non-Renewable ThermalRenewable Thermal
Tx Onshore Dx Onshore
PV
Distributed Generation (small <30MW)
Other Generation
Low
Low
High
High
High
High
Capacity (MW)
12,000
10,000
8,000
6,000
4,000
2,000
2010 2017 2018 2021 2026 2030
Capacity (MW)
16,000
14,000
12,000
10,000
8,000
6,000
4,000
2,000
2010 2017 2018 2021 2026 2030
Capacity (MW)
300
250
200
150
100
50
2010 2017 2018 2021 2026 2030
Capacity (MW)
1,400
1,200
1,000
800
600
400
200
2010 2017 2018 2021 2026 2030
11Central & Southern Scotland Scenarios10 SP Energy Networks , RIIO-T2 2019 Update

Electricity Consumption
Between 2010 and 2017, the average domestic property in Central & Southern Scotland used slightly less electricity than the average household in Great Britain as a whole.
The average consumption in Central & Southern Scotland fell 12% between 2010 and 2017, from 3,997kWh to 3,530kWh. This is a similar reduction to GB overall, where the average consumption fell 10%.
This trend is consistent with what we have previously seen and is a result of improved domestic appliance efficiency, more efficient lighting as well as other improvements to building standards. Behind the meter generation such as rooftop solar generation will also have played a part. In the long term this reduction may be negated as domestic properties install EV charging facilities or make greater use of electricity for heating and cooking.
Glasgow continues to have the highest average at 4,661kWh in 2017 with Stirling the second highest at 4,102kWh. In 2017, Falkirk and West Dunbartonshire have the lowest average consumption rates in this area at 2,935kWh and 2,995kWh. Those with the highest consumption is likely to be due to electricity being the primary energy source for heating such as in multi-occupancy buildings.
The average industrial and commercial demand has seen a net decrease between 2010 and 2017.
However, this decline has not been as linear as domestic properties. In Scotland, the average consumption decreased from 85.1MWh to 69.7MWh, approximately 18.1%, while Great Britain overall has seen a 12.6% decrease from 77.7MWh to 67.9MWh. This is illustrated in the figure opposite.
I&C consumption can be dominated by a small number of major energy users, the closure of a major user or investment in new equipment will have a notable impact. The overall decrease in industrial and commercial electricity demand could be a result of large sites installing behind the meter generation reducing the demand placed on the electricity network. Ultimately, the average values consider a wide variety of business types from large factories to local shops so actual consumption will be highly variable and some areas of industry will be more sensitive to economic factors than others.
Domestic Consumer Trends
Industrial & Commercial Consumer Trends
A consequence of decarbonisation of the electricity sector and energy efficiency measures has been changes to the amount of energy consumed.
As a result of roof top solar generation, improving efficiency of appliances and lighting, electricity consumption patterns have changed significantly.
This is only likely to change further as electric vehicles become more prevalent. Our changing consumption trends are highlighted in the following sections.
Domestic Consumption The average consumption in Central & Southern Scotland fell between 2010 and 2017
I&C Consumption Average consumption has decreased from 2010-2017. This decline has not been as linear as domestic
–12%
–18.1%
Demand changes
Consumption (kMh)
4,200
4,000
3,800
3,600
3,400
2010 2011 2012 2013 2014 2015 2016 2017
Consumption (MWh)
90
85
80
75
70
65
2010 2011 2012 2013 2014 2015 2016 2017
South & Central Scotland Great Britain
South & Central Scotland Great Britain
Factors increasing electricity demand
Factors reducing electricity demand
Electric vehicles
More in-home appliances i.e. air-conditioning
Electrification of heat i.e. heat pumps in
place of gas heating
Electrification of cooking
Increasing population
Building energy efficiency i.e. insulation reducing
heat requirements
Appliance efficiency
In-house generation
Factors changing electricity flexibility
Electricity storage
EV time of charging
Demand response
13Central & Southern Scotland Scenarios12 SP Energy Networks , RIIO-T2 2019 Update

Understanding how electricity demand could evolve on SPT’s network is a key factor informing the need for reinforcement. The situation is made more complicated by the uncertainty surrounding the speed of introduction of new sources of demand such as electric vehicles and heat pumps, as well as the degree to which both existing and new load can be shifted or reduced at times of system peak demand.
New demands
Peak demand is the point in time, historically during the winter months, when the electricity system as a whole sees the highest demand. This is an important point as this is when the network is studied to ensure it can accommodate the needs of connected customers.
Scotland has the ambition to end the need for any new petrol or diesel car to be purchased by 2032, some eight years ahead of the UK governments comparable target. There is also a UK Government target to ensure almost every car and van is a zero emission vehicle by 2050.
The number of EVs in Central & Southern Scotland increased from 270 in 2012 to 8,125 by Q4 2018. Growth in the last year was around 58%, higher than the overall growth in Scotland of 53% and Great Britain of 41%.
In Central & Southern Scotland, EVs are predominantly found in highly populous areas such as Renfrewshire, Edinburgh and Stirling. The number of registered EVs in Renfrewshire has increased from 1,024 to 2,053 in the last year alone, resulting in this region having the most EVs registered in Scotland.
The majority of the registered EVs to date have been cars. In 2018, cars accounted for 92.8% of all EVs registered in Scotland. Light Goods vehicles account for 4.5% and 2.7% for all other categories. It is evident that there has been a slow uptake in all non-car categories. The numbers are particularly low for Heavy Goods Vehicles with only 9 registered and only 28 Buses and Coaches registered in Scotland.
To achieve the government’s targets for decarbonising transport will require a significant growth in the number of EVs. The future scenarios show a wide range of potential outcomes depending on technology advancements, customer acceptability of EVs and the establishment of supporting infrastructure such as EV charging facilities.
In the short term, peak demand is forecast to continue to reduce or remain flat across all scenarios. The overall impact is largely dictated by the differing impact of electric vehicles and heating in each of the scenarios. A major factor in the longer term is the proportion of this demand which is flexible and can be controlled to minimise the impact on the network and generation required to meet the demands. In the different scenarios, different uptakes of technology are assumed as well as different levels of flexibility which are discussed in the following sections.
Summer minimum demands are largely unchanged in all scenarios in both the short and long term. This is due to this period (early morning in a summer’s day) when electric heating does not have an impact, and very few electric vehicles would be expected to be charging.
Minimum demand generally occurs during the summer months when the demand is lowest due to low requirements for heating and lighting. This is also an important condition as minimum demand creates different challenges on the electricity network, a lightly loaded network can lead to voltage control issues on the transmission network.
Winter Peak Demands
Electric Vehicles (EVs)
Summer Minimum Demand
Widespread adoption of electric vehicles is expected to provide a significant challenge to the electricity sector due to the large increase in demand and potential for new technologies such as vehicle to grid services.
At the upper end of the uptake range the impact on peak demand could be significant if left unmanaged. This increase can be mitigated by the extent to which flexible load can be shifted away from peak e.g. through smart charging.
In addition, some electric vehicle owners may be incentivised to not only shift their charging, but to export energy back to the grid (“Vehicle to Grid” or “V2G”) at times of peak system demand. This would offer a number of benefits to the network by providing additional resources which can be dispatched when required.
Minimising Peak Demand
Steady Progression 19
Steady Progression 19
Community Renewables 19
Community Renewables 19
Two Degrees 19
Two Degrees 19
Consumer Evolution 19
Consumer Evolution 19
Residual EV demand
Demand flexibility
High Scenario Low Scenario
Total unmanaged demand
Vehicle to grid
Demand (MW)
4,000
3,000
2,000
1,000
2018 2020 2022 2024 2026 2028 2030 2032 2034 2036 2038 2040
Demand (MW)
1,000
500
0
-500
2018 2020 2022 2024 2026 2028 2030 2032 2034 2036 2038 2040
Share of EVs in car population (SPT area %)
100
80
60
40
20
2018 2020 2022 2024 2026 2028 2030 2032 2034 2036 2038 2040
Minimising Peak Electric Vehicle Charging (MW)
1,200
1,000
800
600
400
200
2018 2020 2022 2024 2026 2028 2030 2032 2034 2036 2038 2040
15Central & Southern Scotland Scenarios14 SP Energy Networks , RIIO-T2 2019 Update
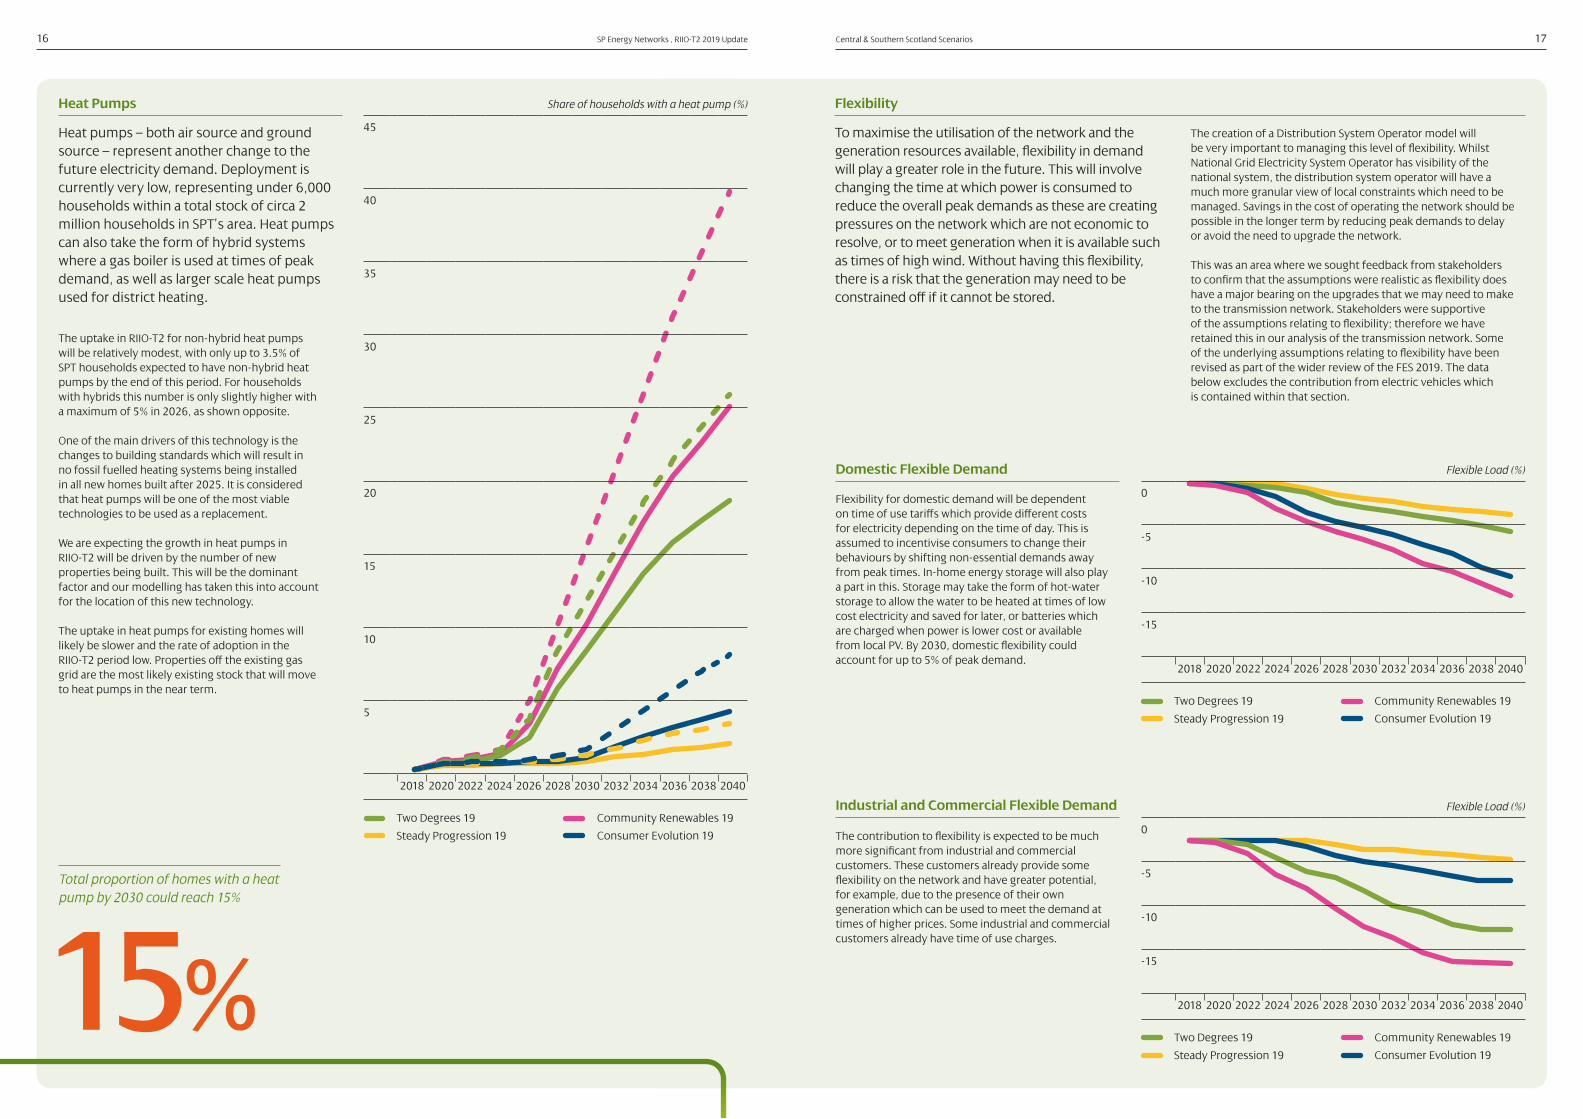
Heat pumps – both air source and ground source – represent another change to the future electricity demand. Deployment is currently very low, representing under 6,000 households within a total stock of circa 2 million households in SPT’s area. Heat pumps can also take the form of hybrid systems where a gas boiler is used at times of peak demand, as well as larger scale heat pumps used for district heating.
To maximise the utilisation of the network and the generation resources available, flexibility in demand will play a greater role in the future. This will involve changing the time at which power is consumed to reduce the overall peak demands as these are creating pressures on the network which are not economic to resolve, or to meet generation when it is available such as times of high wind. Without having this flexibility, there is a risk that the generation may need to be constrained off if it cannot be stored.
The uptake in RIIO-T2 for non-hybrid heat pumps will be relatively modest, with only up to 3.5% of SPT households expected to have non-hybrid heat pumps by the end of this period. For households with hybrids this number is only slightly higher with a maximum of 5% in 2026, as shown opposite.
One of the main drivers of this technology is the changes to building standards which will result in no fossil fuelled heating systems being installed in all new homes built after 2025. It is considered that heat pumps will be one of the most viable technologies to be used as a replacement.
We are expecting the growth in heat pumps in RIIO-T2 will be driven by the number of new properties being built. This will be the dominant factor and our modelling has taken this into account for the location of this new technology.
The uptake in heat pumps for existing homes will likely be slower and the rate of adoption in the RIIO-T2 period low. Properties off the existing gas grid are the most likely existing stock that will move to heat pumps in the near term.
The creation of a Distribution System Operator model will be very important to managing this level of flexibility. Whilst National Grid Electricity System Operator has visibility of the national system, the distribution system operator will have a much more granular view of local constraints which need to be managed. Savings in the cost of operating the network should be possible in the longer term by reducing peak demands to delay or avoid the need to upgrade the network.
This was an area where we sought feedback from stakeholders to confirm that the assumptions were realistic as flexibility does have a major bearing on the upgrades that we may need to make to the transmission network. Stakeholders were supportive of the assumptions relating to flexibility; therefore we have retained this in our analysis of the transmission network. Some of the underlying assumptions relating to flexibility have been revised as part of the wider review of the FES 2019. The data below excludes the contribution from electric vehicles which is contained within that section.
Flexibility for domestic demand will be dependent on time of use tariffs which provide different costs for electricity depending on the time of day. This is assumed to incentivise consumers to change their behaviours by shifting non-essential demands away from peak times. In-home energy storage will also play a part in this. Storage may take the form of hot-water storage to allow the water to be heated at times of low cost electricity and saved for later, or batteries which are charged when power is lower cost or available from local PV. By 2030, domestic flexibility could account for up to 5% of peak demand.
The contribution to flexibility is expected to be much more significant from industrial and commercial customers. These customers already provide some flexibility on the network and have greater potential, for example, due to the presence of their own generation which can be used to meet the demand at times of higher prices. Some industrial and commercial customers already have time of use charges.
Heat Pumps Flexibility
Domestic Flexible Demand
Industrial and Commercial Flexible Demand
Total proportion of homes with a heat pump by 2030 could reach 15%
15%
Steady Progression 19
Steady Progression 19
Steady Progression 19
Community Renewables 19
Community Renewables 19
Community Renewables 19
Two Degrees 19
Two Degrees 19
Two Degrees 19
Consumer Evolution 19
Consumer Evolution 19
Consumer Evolution 19
Flexible Load (%)
0
-5
-10
-15
2018 2020 2022 2024 2026 2028 2030 2032 2034 2036 2038 2040
Flexible Load (%)
0
-5
-10
-15
2018 2020 2022 2024 2026 2028 2030 2032 2034 2036 2038 2040
Share of households with a heat pump (%)
45
40
35
30
25
20
15
10
5
2018 2020 2022 2024 2026 2028 2030 2032 2034 2036 2038 2040
17Central & Southern Scotland Scenarios16 SP Energy Networks , RIIO-T2 2019 Update

Electricity Transmission
There are two main boundaries that cover the SPT transmission network. These are the B4 (SHETL – SPT) and B6 (SPT – NGET) Boundaries shown in the map below. The changes to the generation landscape in the SPT area have been matched by changes in the SHETL and NGET areas to different extents. This has had an impact on the flow of power around the country.
The B4 boundary separates the section of the transmission network owned by SPT and SHETL. Since 2010, SPT have imported more electricity from SHETL each year than exported.
For the north of Scotland, demand has been broadly unchanged whilst large amounts of new generation have been connected. As this generation is not consumed locally, the power is then transferred through the transmission network south to SPT.
Over 3,000GWh more has been imported as of the end of 2018 than the previous peak of 6,000GWh in 2017. 2016 to 2017 also saw a considerable rise from 3,000GWh to 6,000GWh. This is partly a result of the closure of Longannet in 2016, allowing more generation from the north to generate unconstrained through the additional network capacity combined with the increasing amount of wind generation in Northern Scotland.
In 2018, power was transferred from SHETL to SPT on 356 days of the year.
B4 Boundary
To Northern Ireland
B4
B5
B6
Western HVDC Link
Note, positive values indicate an import into the SPT network and negative values indicate an export from the SPT network.
2018 showed a record high for imported electricity across this boundry
+9,000GWh
Energy Transferred (GWh)
10,000
8,000
6,000
4,000
2,000
0
-2,000
2010 2011 2012 2013 2014 2015 2016 2017 2018
19Central & Southern Scotland Scenarios18 SP Energy Networks , RIIO-T2 2019 Update

B6 Peak Transfer Requirements 2030 (MW)
The B6 boundary follows the border between Scotland and England and separates the areas of the transmission network owned by SPT and NGET.
In 2018, power flowed from Scotland to England for 326 days of the year. This is largely consistent with previous years. The large volumes of energy transferred to England and Wales is as a result of the significant volumes of renewable generation which have connected across Scotland, combined with reducing demand.
What is notable however is that over the last three years, the total amount of power which is imported to Scotland from England and Wales has increased compared to the prior years. This is due to the greater penetration of renewable generation in Scotland and loss of thermal generation. When renewable generation is not available, there is an increasing dependency on generation in other parts of Great Britain to support Scotland’s requirements.
Over the last five years, a number of major upgrades have been completed to ensure that there is sufficient capacity to allow the power from Scotland to be transferred from Scotland to England when it is required, and similarly, the ability to import power. This has included the HVDC Western Link which provides almost one third more capacity than was previously available.
B6 Boundary Future Boundary changes
Note, positive values indicate an import into the SPT network and negative values indicate an export from the SPT network.
The ongoing connection of new generation in Northern Scotland, as well as what is connecting in Central & Southern Scotland is leading to greater volumes of power being transferred across these boundaries. The Future Energy Scenarios allow us to estimate what the future requirements will be as shown opposite.
Using the Future Energy Scenarios developed by National Grid Electricity System Operator, we are able to consider the changes that are happening at a national level and the impact this has on our boundaries. We undertake this process in collaboration with other network operators to ensure our plans are coordinated and efficient.
The ongoing increase in generation in Scotland, from both onshore and offshore wind, is the largest factor in increasing boundary transfer requirements. As we have seen historically, energy demand is unlikely to change significantly so additional generation will continue to lead to power being transferred from the north to south of Great Britain.
Without upgrades to these boundaries, renewable generation will be constrained and generation in other parts of the country such as gas generation will need to be utilised which will impact the transition to net-zero for the energy sector.
B4 Peak Transfer Requirements 2030 (MW)
10,000
8,000
6,000
4,000
2,000
2018 Two Degrees
Community Renewables
Steady Progression
Consumer Evolution
B6 Peak Transfer Requirements 2030 (MW)
14,000
12,000
10,000
8,000
6,000
4,000
2,000
2018 Two Degrees
Community Renewables
Steady Progression
Consumer Evolution
B4 Boundry Significant increase in capacity required by 2030s
B6 Boundry Further enhancements to increase capacity by 2030
+100%
+60%
Energy Transferred (GWh)
2,000
0
-2,000
-4,000
-6,000
-8,000
-10,000
-12,000
-14,000
-16,000
2010 2011 2012 2013 2014 2015 2016 2017 2018
Current capacity
Current capacity
21Central & Southern Scotland Scenarios20 SP Energy Networks , RIIO-T2 2019 Update
Conclusions
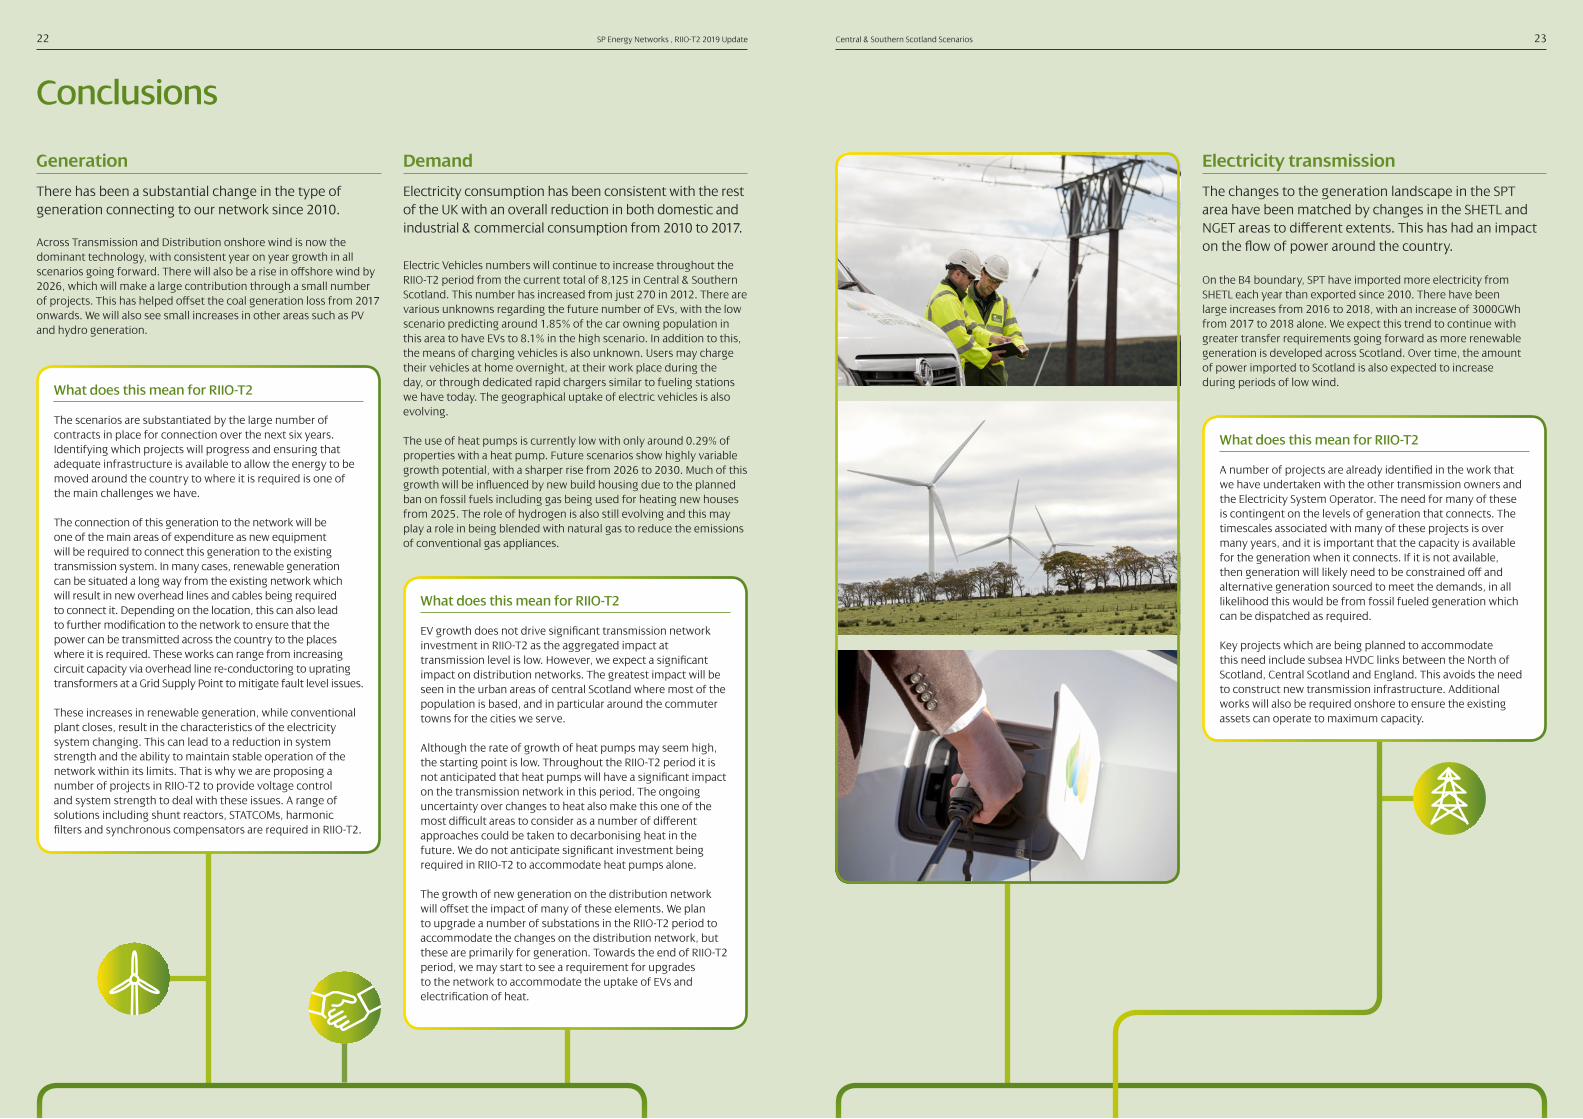
The scenarios are substantiated by the large number of contracts in place for connection over the next six years. Identifying which projects will progress and ensuring that adequate infrastructure is available to allow the energy to be moved around the country to where it is required is one of the main challenges we have.
The connection of this generation to the network will be one of the main areas of expenditure as new equipment will be required to connect this generation to the existing transmission system. In many cases, renewable generation can be situated a long way from the existing network which will result in new overhead lines and cables being required to connect it. Depending on the location, this can also lead to further modification to the network to ensure that the power can be transmitted across the country to the places where it is required. These works can range from increasing circuit capacity via overhead line re-conductoring to uprating transformers at a Grid Supply Point to mitigate fault level issues.
These increases in renewable generation, while conventional plant closes, result in the characteristics of the electricity system changing. This can lead to a reduction in system strength and the ability to maintain stable operation of the network within its limits. That is why we are proposing a number of projects in RIIO-T2 to provide voltage control and system strength to deal with these issues. A range of solutions including shunt reactors, STATCOMs, harmonic filters and synchronous compensators are required in RIIO-T2.
EV growth does not drive significant transmission network investment in RIIO-T2 as the aggregated impact at transmission level is low. However, we expect a significant impact on distribution networks. The greatest impact will be seen in the urban areas of central Scotland where most of the population is based, and in particular around the commuter towns for the cities we serve.
Although the rate of growth of heat pumps may seem high, the starting point is low. Throughout the RIIO-T2 period it is not anticipated that heat pumps will have a significant impact on the transmission network in this period. The ongoing uncertainty over changes to heat also make this one of the most difficult areas to consider as a number of different approaches could be taken to decarbonising heat in the future. We do not anticipate significant investment being required in RIIO-T2 to accommodate heat pumps alone.
The growth of new generation on the distribution network will offset the impact of many of these elements. We plan to upgrade a number of substations in the RIIO-T2 period to accommodate the changes on the distribution network, but these are primarily for generation. Towards the end of RIIO-T2 period, we may start to see a requirement for upgrades to the network to accommodate the uptake of EVs and electrification of heat.
A number of projects are already identified in the work that we have undertaken with the other transmission owners and the Electricity System Operator. The need for many of these is contingent on the levels of generation that connects. The timescales associated with many of these projects is over many years, and it is important that the capacity is available for the generation when it connects. If it is not available, then generation will likely need to be constrained off and alternative generation sourced to meet the demands, in all likelihood this would be from fossil fueled generation which can be dispatched as required.
Key projects which are being planned to accommodate this need include subsea HVDC links between the North of Scotland, Central Scotland and England. This avoids the need to construct new transmission infrastructure. Additional works will also be required onshore to ensure the existing assets can operate to maximum capacity.
Electricity consumption has been consistent with the rest of the UK with an overall reduction in both domestic and industrial & commercial consumption from 2010 to 2017.
Electric Vehicles numbers will continue to increase throughout the RIIO-T2 period from the current total of 8,125 in Central & Southern Scotland. This number has increased from just 270 in 2012. There are various unknowns regarding the future number of EVs, with the low scenario predicting around 1.85% of the car owning population in this area to have EVs to 8.1% in the high scenario. In addition to this, the means of charging vehicles is also unknown. Users may charge their vehicles at home overnight, at their work place during the day, or through dedicated rapid chargers similar to fueling stations we have today. The geographical uptake of electric vehicles is also evolving.
The use of heat pumps is currently low with only around 0.29% of properties with a heat pump. Future scenarios show highly variable growth potential, with a sharper rise from 2026 to 2030. Much of this growth will be influenced by new build housing due to the planned ban on fossil fuels including gas being used for heating new houses from 2025. The role of hydrogen is also still evolving and this may play a role in being blended with natural gas to reduce the emissions of conventional gas appliances.
The changes to the generation landscape in the SPT area have been matched by changes in the SHETL and NGET areas to different extents. This has had an impact on the flow of power around the country.
On the B4 boundary, SPT have imported more electricity from SHETL each year than exported since 2010. There have been large increases from 2016 to 2018, with an increase of 3000GWh from 2017 to 2018 alone. We expect this trend to continue with greater transfer requirements going forward as more renewable generation is developed across Scotland. Over time, the amount of power imported to Scotland is also expected to increase during periods of low wind.
There has been a substantial change in the type of generation connecting to our network since 2010.
Across Transmission and Distribution onshore wind is now the dominant technology, with consistent year on year growth in all scenarios going forward. There will also be a rise in offshore wind by 2026, which will make a large contribution through a small number of projects. This has helped offset the coal generation loss from 2017 onwards. We will also see small increases in other areas such as PV and hydro generation.
What does this mean for RIIO-T2
What does this mean for RIIO-T2
What does this mean for RIIO-T2
Demand Electricity transmissionGeneration
23Central & Southern Scotland Scenarios22 SP Energy Networks , RIIO-T2 2019 Update

Relia
bility
Inno
vation
Enviro
nment & Sustainability
New
Connections
Our
N
etwork
Valu
e For Money
Wor
king With You
Futu
re Ready
We would welcome any feedback that stakeholders have on this document to: [email protected]
National Grid Future Energy Scenarios: fes.nationalgrid.com/fes-document
BEIS, Regional and local authority Domestic electricity consumption statistics: 2005 to 2017: www.gov.uk/government/statistical-data-sets/regional-and-local-authority-electricity-consumption-statistics
BEIS, Regional and local authority Industrial and Commercial electricity consumption statistics: 2005 to 2017: www.gov.uk/government/statistical-data-sets/regional-and-local-authority-electricity-consumption-statistics
Department for Transport, Table VEH0131 – Plug-in cars and vans licensed at the end of quarter by location of registered keeper: www.gov.uk/government/collections/vehicles-statistics
References