Central Oregon Food Hub Feasibility Study 1 2011 -2012 Central Oregon Food Hub Feasibility Study...
79
|1 Central Oregon Food Hub Feasibility Study Conducted and Prepared by: Central Oregon Intergovernmental Council Katrina Van Dis, Program Administrator [email protected] | 541.504.3307 Funded by:
-
Upload
hoanghuong -
Category
Documents
-
view
219 -
download
3
Transcript of Central Oregon Food Hub Feasibility Study 1 2011 -2012 Central Oregon Food Hub Feasibility Study...

| 1
2011 -2012
Central Oregon Food Hub Feasibility Study
Conducted and Prepared by:
Central Oregon Intergovernmental Council Katrina Van Dis, Program Administrator [email protected] | 541.504.3307
Funded by:

| 2
Author, Researcher and Project Coordinator
Central Oregon Intergovernmental Council Katrina Van Dis, Community and Economic Development Natural Resource Program Administrator
Steering Committee
Bend‐LaPine Schools Nutrition Services and Bend Farmers Market Katrrina Weist, Wellness Specialist and Bend Farmers Market Manager
Cascadia Enterprise Brad Hunter, Business Lender
Central Oregon Community College Business Development Center Beth Wickham, Director
Central Oregon Intergovernmental Council Andrew Spreadborough, Community and Economic Development Manager
City of Redmond, Oregon James Lewis , Long Range Planner
Economic Development of Central Oregon Jason Carr, Crook County Manager
FoodHub Amanda Oborne, Director
NeighborImpact Steve Murray, Food and Winter Energy Manager
Oregon State University Crook County Open Campus Jeff Papke, Campus Coordinator, Crook County
Oregon State University Extension Service Mylen Bohle, Forage & Cereals and Forage & Alfalfa Specialist
Sysco Randy Gehrig , Northwest Operational Manager

| 3
Table of Contents EXECUTIVE SUMMARY ....................................................................................................................................... 5 INTRODUCTION.................................................................................................................................................. 6
PURPOSE OF THE STUDY ................................................................................................................................................... 6 METHODOLOGY ............................................................................................................................................................. 6 TIMEFRAME .................................................................................................................................................................. 7 NEXT STEPS ................................................................................................................................................................... 7
SECTION 1: PROFILE OF CENTRAL OREGON ......................................................................................................... 7 DEMOGRAPHICS ............................................................................................................................................................. 8 AGRICULTURE: FARM AND RANCH LAND AND PRODUCTION ................................................................................................... 9 LAND USE ................................................................................................................................................................... 13 HEALTHY FOOD ACCESS ................................................................................................................................................. 14 CONCLUSION ............................................................................................................................................................... 15
SECTION 2: CENTRAL OREGON FOOD SYSTEM ................................................................................................... 17 AGRICULTURE AND THE ECONOMY ................................................................................................................................... 18
Trends in Local Food Sales .................................................................................................................................. 18 Oregon’s Agricultural Economy .......................................................................................................................... 18
EXISTING INFRASTRUCTURE ............................................................................................................................................ 20 Occupation and Processing ................................................................................................................................. 20 Manufacturing .................................................................................................................................................... 21 Agricultural Support Services .............................................................................................................................. 22 Farm Expenses .................................................................................................................................................... 22 Transportation, distribution and warehousing ................................................................................................... 23 Commercial Kitchens ........................................................................................................................................... 24 Local Food Marketplace ...................................................................................................................................... 24
SUPPLY ....................................................................................................................................................................... 24 Commercial Crops ............................................................................................................................................... 24 Specialty Crops .................................................................................................................................................... 26
DEMAND .................................................................................................................................................................... 27 Consumer Demand and Education ...................................................................................................................... 27 Institutional ......................................................................................................................................................... 28 Food Businesses .................................................................................................................................................. 30
BARRIERS AND OPPORTUNITIES TO BUYING LOCALLY ........................................................................................................... 32 CONCLUSION ............................................................................................................................................................... 33
SECTION 3: FOOD HUB ...................................................................................................................................... 35 DEVELOPMENT OF FOOD HUBS ....................................................................................................................................... 35 OPPORTUNITIES & BENEFITS .......................................................................................................................................... 37 OWNERSHIP STRUCTURE ................................................................................................................................................ 39 BUSINESS RISKS ........................................................................................................................................................... 42 SERVICES PROVIDED ...................................................................................................................................................... 43
Core Services ....................................................................................................................................................... 43 Ancillary services ................................................................................................................................................. 43
FACILITY AND LOCATION ................................................................................................................................................ 44 FINANCE AND REVENUE OPTIONS .................................................................................................................................... 44 TYPOLOGY OF A FOOD HUB ............................................................................................................................................ 45 CONCLUSION ............................................................................................................................................................... 45

| 4
SECTION 4: CASE STUDIES.................................................................................................................................. 47
FoodHub, Portland OR ........................................................................................................................................ 48 Local Food Hub, Charlottesville, VA .................................................................................................................... 49 Farm Fresh Connection, Portland ME ...................................................................................................................... 50 Okanogan Producers Marketing Association, Okanogan, WA............................................................................ 50 Western Montana Growers Cooperative, Arlee, MT ........................................................................................... 52 Immokalee State Farmers’ Market, Florida ........................................................................................................ 52
OVERVIEW OF CASE STUDIES .......................................................................................................................................... 54 CONCLUSION ............................................................................................................................................................... 56
SECTION 5: NEXT STEPS AND STRATEGIES .......................................................................................................... 57 STRATEGIC OVERVIEW ................................................................................................................................................... 58
Strategy 1. Develop a Regional Policy Committee and Supportive Framework .................................................. 58 Strategy 2. Develop a Leadership Role, Enable Community Buy‐In .................................................................... 58 Strategy 3. Secure Financial Resources ............................................................................................................... 59 Strategy 4 Implement a Pilot Project .................................................................................................................. 59 Strategy 5: Support the Development of a Balanced Supply and Demand ......................................................... 59 Strategy 6. Improve Healthy Food Access and Review Policies ........................................................................... 60 Strategy 7. Assess Impacts and Analyze the Implementation Process ................................................................ 60
APPENDIX A: AGRICULTURE EMPLOYMENT STATISTICS ..................................................................................... 60 APPENDIX B: AGRICULTURAL PRODUCER SURVEY ............................................................................................. 63 APPENDIX C: LOCAL FOOD PROCUREMENT SURVEY ........................................................................................... 65 APPENDIX D: FINANCING OPTIONS .................................................................................................................... 72 APPENDIX E: FURTHER ANALYSIS ....................................................................................................................... 77

| 5
Executive Summary
For decades, agriculture has dominated the landscape and provided strong economic roots; in the last few decades, however, production techniques and market for producers have changed the traditional commercial model. Traditionally dependent on commercial markets, producers recognize the advantage of utilizing direct markets to increase product value and on‐farm income and decrease overhead costs. Given the market trend and greater consumer awareness of the advantage of buying locally produced, fresh products, producers seek to expand their production capacities. While the prospective gains are evident, the current food system in Central Oregon has limitations.
As with many rural areas, the Central Oregon region struggles to meet the balance between supply and demand. Given the growing challenges of the high desert plateau and the isolation from market centers, the region would benefit from a centralized system that incorporates all aspects of the food system into the value chain. The local food economy would be improved by the establishment of: an aggregation area for post‐harvest products to increase volume and consistency as well as price points; small services such as wash basins for post‐harvest cleaning and a commercial kitchen for small processing such as cutting of carrots or value‐added production; increased cold and freezer storage space for product waiting to be distributed or picked‐up; improved distribution options through a wider geographic range including local food banks and pantries; and transportation of local goods out of the region to increase markets and sales.
The broader social and economic benefits beyond direct producer consumer interactions would provide more affordable access to healthy foods; local job creation in food production, distribution and value added processing; import substitution through expanding consumption of local foods; and strengthening and preserving the agricultural lifestyle.
The vision for the Central Oregon food system is one in which stable, long term revenues derived from the local food production and sales are integrated into a robust marketplace. The true benefits of a food hub are increases in: employment in the agriculture sector, revenue for food and farm businesses, tax base, and sustainability of our farming community, as well as healthier citizens. With public resource limitations, duplication of existing efforts is not a viable option. The development of a food hub facility must build upon existing efforts. In particular, the region would benefit from a public‐private partnership to maximize efficiency, pool resources, and leverage existing relationships to strengthen the local food economy.
Using an incremental approach, a food hub pilot project will assess the viability of a food hub facility in practice. To fund this project, multiple funding sources will be needed to support start‐up capital and operational costs. Guided by a regional steering committee, multiple stakeholders from various sectors would provide input and oversight. Public officials will be included in the conversation to provide information about policies at the local level that can alleviate barriers to entry into markets for producers. Local food procurement standards set at the city level by local officials could encourage retail businesses and consumer to support a local economy.

| 6
Introduction
Central Oregon is on the cusp of developing a strong local food system. In an effort to identify barriers and opportunities, a Community Food Needs Assessment was conducted in 2010. Lack of infrastructure was identified as a barrier in the food system. This project will determine the feasibility of Central Oregon to support a local food hub, integrating micro‐enterprise and existing businesses into the project. This project will engage stakeholders from various aspects of the food system in a comprehensive review of the study, and to analyze how their organizations can support the development of the agricultural industry to increase food‐related business viability and increase workforce opportunities.
Purpose of the study
The purpose of this study is to assess the capacity of the region to support a local food hub – defined as a centrally located facility with a business management structure facilitating the aggregation, storage, processing, distribution and marketing of regionally produced food products. The siting of a food hub could provide the following systems: aggregation of food products to be delivered to retail and institutional outlets, washing and packaging area, freezer storage for bulk meats for Community Supported Agriculture or retail distribution, and centralized location for a pick‐up and drop off delivery system. These systems will narrow the gaps in the flow of food from the source to the consumer.
Methodology Central Oregon Intergovernmental Council (COIC) established a regional Steering Committee that represents the food system. This Committee guided the study to ensure that each process in the food system was equally represented. COIC collected primary and secondary data and research to determine a snap shot in time of the current food system. COIC, local organizations, farms and ranches determined the availability to produce “local” food. For the purpose of this study, local is defined as the geographic region of Crook, Deschutes and Jefferson and is often referred to as “Central Oregon”. Using this data COIC will develop business models and will determine adequate siting and financing opportunities.
Commonly Used Definitions
Barriers (to Entry): The obstacles that stand in the path of a firm entering a market.
Commercial Agriculture: Large‐scale production of crops for sale, intended for widespread distribution to wholesalers (industrial, commercial or professional business) or retail outlets. Commercial Crops (also referred to as cash crop) A salable crop that is grown or gathered for the markets on a large scale Direct markets: Farmer sells directly to a consumer such as farmers’ markets or road‐side stands. Economies of Scale: A situation in which average (per unit) cost falls as output increases. Local Food: Food produced, processed, and distributed within the tri‐county region of Central Oregon. Manufacturing: The making of goods such as frozen food or ice cream. Niche Market: A niche market focuses on a specific product or commodity. Processing: A series of actions or changes taking place in a definite manner, e.g. meat processing includes livestock slaughter and rendering. Specialty Crops: Fruits, vegetables, tree nuts, dried fruits, nursery crops, and floriculture, also referred to as horticulture crops. Value‐Added: Foods that have increased in value (price) from the post‐harvest stage of production due to alterations in size, shape, appearance, location, or convenience.

| 7
Timeframe This project was begun in October 2011 and was a 9‐month project.
Oct Nov Dec Jan Feb March April May June July Collect base-line data Develop project team Determine supply and demand Determine business models Determine geographic siting Determine potential funding options Finalize feasibility study Presentation
Next Steps
The following strategies provide a step‐by‐step framework to develop a Central Oregon Food hub. For more detail on these strategies please refer to Section 5: Next Steps.
Strategy 1: Develop a regional policy committee and supportive framework Strategy 2: Develop a leadership role and enable community buy‐in Strategy 3: Secure financial resources Strategy 4: Implement a pilot project Strategy 5: Support the Development of a Balanced Supply and Demand Strategy 6: Improve healthy food access and review policies Strategy 7: Assess impacts and analyze the implementation process
Section 1: Profile of Central Oregon
The Central Oregon region is comprised of Crook, Deschutes and Jefferson Counties and the Confederated Tribes of Warm Springs. For decades, forestry and agriculture have dominated the landscape and provided strong economic roots; in the last few decades however, structural shifts in these sectors have changed the profile of these resource dependent communities. Coupled with an explosive urban growth, Central Oregon is in the process of defining how to manage the rural landscape.
The Central Oregon region’s rapid population growth has lead to increases in several economic sectors, including manufacturing, research and service industries, including recreation and tourism; hobby farming; information technology; renewable energy; aviation; and medical and retirement services. Urban growths boundaries are slowly encroaching on rural lands previously devoted to irrigated agriculture and dryland ranching. This broad trend towards urban center expansion and the localized

| 8
trend of expanding development into rural areas have led to land use change, as farms become towns and as large commercial farms are partitioned into smaller “hobby” farms. These trends put pressure on agricultural producers with rising costs of production and land use regulations. Careful stewardship of the productive capacity of Central Oregon’s rural lands and the social capital of rural communities remains vital, even in the face of long‐term decline in the traditional productive activities.1
Demographics
Central Oregon is nearly the geographic size of New Jersey. In 2011, the population of the three counties was 200,431, according to the US Census Bureau, with the city of Bend being the largest urban center. The majority of the population is white with a small but strong Hispanic and Native American community. Median household incomes tend to be lower in Crook and Jefferson counties than the state average but are higher in Deschutes County. Central Oregon individual poverty rates and population mirror each other as they both increased over time (2000‐2009): individual poverty rates between 23% and 35% and population by 20%.
Not unlike many other regions in the United States, Central Oregon struggled with the impact of the national recession, with unemployment and nutritional assistance benefits rates being among the highest in the state and nation. In July of 2011, unemployment rates hovered between 12.5% in Deschutes County, 13.5% in Jefferson County and 14.8% in Crook County. Compared to 2009 levels, Deschutes is nearly the same, Jefferson increased 2.4% and Crook decreased one percent.2 A 2010 study published by the Partners for a Hunger‐Free Oregon estimated that on average 39,124 of Supplemental Nutrition Assistance Program (SNAP) recipients claimed their benefits (20% of the total population of Central Oregon). This is an annual value of $62 million dollars that could be used to purchase locally produced fresh foods. 3
1 Van Dis and Aylward. Financing Mechanisms that Advance Ecosystem Markets and Promote Rural Sustainability. Incentives and Financing for Ecosystem Services in Central Oregon for the Institute for Natural Resources at Oregon State University. 2010. 2 Oregon Employment Department (2011) 3 Partners for a Hunger‐Free Oregon. 2011 SNAP Participation Report.

| 9
Table 1.1 Demographics of Central Oregon 2010
Crook Deschutes Jefferson Oregon
Population 20,978 157,733 21,720 3,831,074
% White 89.4 88.4 61.8 78.5
% Hispanic 7.0 7.4 19.3 11.7
% Multiracial 2.0 2.5 3.8 3.8
% Other 1.6 1.7 15.1 6.0
% Under 18 years 21.9 23.0 25.3 22.6
% 18-64 years 58.1 62.1 59.4 63.5
% Over 65 years 20.0 14.9 15.3 13.9
Median Household Income $42,342 $51,959 $38,132 $48,325
Below Poverty Level 16.2% 11.8% 17.4% 14.3% Percent Rural (1990)* 62% 63% 75% 30% Data Source: United States Census Bureau * The percentage of the population who live in areas designated as rural by the U.S. Census Bureau. Rural is considered to be all territory, population and housing units not in urbanized areas and not in places of more than 2,500 persons outside of urbanized areas.
Agriculture: Farm and Ranch Land and Production
Agriculture dominates the landscape, with over 1.6 million acres of private land use dedicated to farming and livestock4. Located on the high plateau in the rainshadow of the Cascade Mountains, the landscape presents many challenges for farmers, including a short season and micro‐climates. Contributing factors include variations in temperature, precipitation, elevation, and soil types. The hardiness rating (the ability of a plant to withstand minimum temperatures) varies between Zone 3 (‐40° to ‐30°F) to Zone 5 (‐20° to ‐10°F). Most of the soils have a minimal amount of organic matter and are course and sandy. Average annual precipitation ranges from 8” (Redmond) to 22” (LaPine) per year (1971‐2000). Elevation ranges from 1,000 feet on the Warm Springs reservation to 4,200 feet in LaPine. Though Central Oregon boosts plenty of sunny days, it also contributes to loss of radiant heating and early frosts because of limited cloud cover. The growing season varies between 70‐80 days in Sunriver and LaPine to 100‐110 in Warm Springs. (For comparison, in the Willamette Valley, which is considered the most diverse agricultural area in the state, the growing season is 150‐180 days.) The median last frost (32°F) day for spring is May 27 in Madras and June 28 in Prineville, with a first occurrence of frost as early as August 17 in Sunriver, October 3 in Madras (1971‐2000).5
4 2007 National Agriculture Census 5 July 2009. Central Oregon Climate and How it Relates to Gardening. Oregon State University Extension Service.

| 10
Table 1.2 Farmland in Central Oregon Counties Crook Deschutes Jefferson Oregon
Farms 622 1,405 510 38,553
Farmland (acres) 761,548 129,369 708,974 16,399,647
% of farmland of the county 40% 7% 62% 26%
Average size of farm (acres) 1,224 92 1,390 425
Market value of production (millions) $31.2 $19.8 $56.5 $4,400
% Crop Production / Livestock Production 35 / 65 46 / 54 70 / 30 68 / 32
Average market value of agriculture product sold/ farm $50,219 $14,063 $110,887 $113,739
Average total farm production expenditures $51, 631 $25,818 $100,456 $96,876
Source: 2007 Census of Agriculture
The proportion of farm area that is irrigated is roughly one‐tenth, or 180,000 acres, reflecting the predominance of non‐irrigated ranchland in Crook and Jefferson counties. Central Oregon hosts many family farms with over 92% of owners living on the farm; sixty percent of farm operators also work part‐time of the farm and 40% effectively work full‐time off the farm. Agriculture makes up approximately 10% of county income in Crook and Jefferson County but only 1% in Deschutes County.1
Rangelands account for thousands of acres in Central Oregon (73% of the total acres in Crook County) and are composed of non‐irrigated, non‐tillable, non‐forested lands. Livestock production is a major industry and includes beef, dairy, sheep, goat, and poultry.
Crop production in Central Oregon is mainly commodity based. Vegetable seeds (carrot and garlic) are a main staple of the region, with carrot seeds being the main income producer. The main grass seed is Kentucky bluegrass and rough bluegrass. Potatoes were once the main staple of crops in Central Oregon; now they are mostly planted for the seeds. The major hay and cereal crops are alfalfa hay, grass hay and wheat. New crop projects that are receiving research attention include dill for oil, Echinacea, St. John’s Wort, and dry beans.6
Most of the agricultural crops grown in Central Oregon are high value crops and are typically exported out of the area. Even wheat has to be exported and imported back into the region for lack of a processing facility. Specialty crops (which are not cash crops) include the typical garden varieties (given the growing season) and are mainly marketed through direct markets. Vegetables for processing and fresh markets have fluctuated over the years from 1980 to 20097.
6 Oregon State University Extension Service

| 11
Figure 1.1 Value of Sales for all Vegetables* for Processing and Fresh Market *Vegetable crops include onions, snap beans, beets, sweet corn, carrots, broccoli, cauliflower, cucumbers, asparagus, cabbage, lima beans, green peas, tomatoes, spinach, lettuce, squash and pumpkins, cantaloupe, muskmelons, watermelons, rhubarb, radishes, garlic, rutabagas, and other miscellaneous vegetables sold or held for sale.
Note: Deschutes County information not available for 1980‐2000 Source: Oregon Agricultural Information Network (OAIN), Extension Economic Information Office, Oregon State University
The value of sales for vegetables (Figure 1.1) has generally increased throughout the state. A sharp rise in 2000 could be accounted for by change in the type of crops counted or a drastic change in market price. In 2008, Jefferson County saw an increase in the number of sales while Crook County decreased (unlike the state average). A large portion of Jefferson County is committed to commercial farming (an average of 1,390 acres per farm) focused largely on seeds crops, such as peppermint for tea leaves and specialized potatoes. Crook County hosts both smaller parcels of crop land and very large ranches (average farm acreage is 1,224). Deschutes County has smaller farms (92 acres on average) and largely lifestyle or hobby farming, with just a few areas of commercial farms remaining. In general, producers have mostly chosen a lifestyle of farming or ranching.5
Due to the relatively small scale of commercial farms (compared to other states), Central Oregon receives little in the way of farm subsidies from the government. In general, Oregon has increased the number of farms and decreased the average size of the farm from 2009 to 2010. The market value of agriculture products sold has increased but so too have the farm production expenses, especially hired farm labor.
Roughly 15% of farm sales for the state of Oregon originate in Central Oregon, with the majority selling less than $25,000 worth of farm goods. In comparison to the total sales for Oregon, Crook County is on par (77% of total sales less than $25,000) while Deschutes has a total of 91% and Jefferson County 66%. This demonstrates that Deschutes County’s farming community is smaller farmers most likely using small direct markets to sell their food. Jefferson County, on the other hand, is home to larger farms utilizing mainly commercial markets.
$‐
$100
$200
$300
$400
1980
1990
2000
2007
2008
2009
$ in
Millions
Oregon
$0
$1,000,000
$2,000,000
$3,000,000
$4,000,000
$5,000,000
1980
1990
2000
2007
2008
2009
Crook, Deschutes & Jefferson
Crook
Deschutes
Jefferson

| 12
Table 1.3 Numbers of Farms by Sales
Total Farms
Sales < $25,000 (% of total)
Sales $25,000-$99,999
(% of total)
Sales $100K - $250K
(% of total) Year 2002 2007 2002 2007 2002 2007 2002 2007
Crook 685 622
558 (81%)
477 (77%)
58 (8%)
82 (13%)
40 (6%)
28 (5%)
Deschutes 1,632 1,405 1,496 (92%)
1,275 (91%)
96 (6%)
96 (7%)
25 (2%)
20 (1%)
Jefferson 428 510 272 (64%)
335 (66%)
65 (15%)
82 (16%)
39 (9%)
37 (7%)
Oregon 40,003 38,553 31,564 (79%)
29,765 (77%)
4,282 (10%)
4,110 (11%)
1,935 (5%)
1,939 (5%)
2007 Census of Agriculture
The sales information for each farm (Table 1.3) helps to determine the capacity and the potential capability of farmers and ranchers to provide food for the region. For those 300 farmers selling between $25,000 to $99,999 worth of products, we could estimate that they are either selling their goods via direct and/or commercial markets. We can further estimate that these farmers could better utilize a food hub, and potentially provide a significant volume of product for the region. Similarly, the 85 farmers in the $100,000 to $250,000 range of sales mostly likely have enough production capacity that they may benefit from increased processing infrastructure and support.
According to the 2007 Agricultural Census Data, there are a total of 2,537 farms in Central Oregon that encompass nearly 1.6 million acres of the total land. Below are profiles of each county
Crook County is home to livestock production (65% of total production). Forty percent of the entire county is farmland with the majority farming 10‐49 acres. Although the average market value of product sold is $50,219, most of the farms (77%) in the county make less than $25,000. In 2011, the preliminary data shows commodity sales were 50% cattle, 24% alfalfa hay, and 26% other hay and crops.7
Deschutes County is home to a mix of crop (46%) and livestock (54%) production. There are a total of 1,405 farms, which make up 7% of the total County. The average market value is almost one‐third of Crook County ($14,063), which can be explained by the fact that over half of the farms are 1‐49 acres with the majority making less than $2,500 in farm sales. Deschutes County is considered more of a hobby farming community than Crook or Jefferson. In 2011, the preliminary data shows that commodity sales in Deschutes County were: 37% cattle; 35% alfalfa and other hay; 17% other animal products and crops; an 11% nursery crops,
Jefferson County produces the majority of crops (70% of total production) in the region. The average market value of products sold doubles that of Crook County ($110,887) while the market value of production is over $56 million, which is 1.3% of the state’s total. Government subsidies for this county are double that of Crook and Deschutes, but are half of the state’s average. The majority of farms (45%) have less than $2,500 in sales with nearly one‐fifth of the total farms making over $100,000. In 2011,
7 Oregon State University Oregon Agricultural Information Network (OAIN)

| 13
preliminary data shows that Jefferson County had 78% in crop production and 22% in livestock. Commodity sales were much more diversified with 19% wheat and cattle respectively, 18% vegetable and flower seeds, 13% grass and legume seed, 12% alfalfa hay, and the remainder (19%) garlic and other hay, crops and animal products.
Land Use
Oregon’s land use program places major emphasis on maintaining commercial agriculture. Exclusive Farm Use (EFU) zoning limits development that could conflict with farming practices. It keeps farmland from being divided into parcels too small for commercial agriculture. Lands in these zones are automatically eligible for lower property taxes based on the land being farmed. The minimum lot size is 80 acres for farmland and 160 acres for rangeland, unless counties can demonstrate through the application of specific standards that a lower minimum is appropriate for the continuation of commercial agriculture and unless the minimum is approved by the Oregon Department of Land Conservation and Development.1
EFU zoning includes various land management practices but allowed uses are limited to farming, ranching, grazing, and timber production. EFU zoning also allows certain farm‐related activities and limited conditional non‐farm uses. Farmland is considered land used for agricultural production. In the high desert of Central Oregon, there are nearly 160,000 acres of irrigated farmland. The EFU zones have changed over the years to be responsive to changing needs. Common and often debated non‐farm uses approved by counties include “commercial activities in conjunction with farm use” such as seed cleaning, fertilizer sales, berry processing, and weddings.8
A recent shift in agricultural practices is from commercial commodity farming to smaller units that engage in either “hobby” farming or speciality crop farming, especially in Deschutes County. Small acreage farms, often referred to as “hobby farms”, are often classified as non‐commercial farms which are characterized by a larger portion of income from off‐farm employment. Hobby farms tend to be managed more for lifestyle and enjoyment than for income. Such farms do contribute to the economy by purchasing general farm production inputs in terms of goods and services and selling smaller portions of local food, often at direct markets.1
A growing trend in the region is the interest in producing food for local consumption (i.e. the “local food” movement). This has been precipitated by a few factors including general consumer awareness about the benefits of eating locally, increased interest among younger generation farmers in growing and selling specialty crops through direct markets, and increased accessibility to technical trainings and workshops. With this shift in land management, producers are seeking new and exciting ways to add value to their crops through labels such as “sustainable” or “local” or certifications such as “organic”, which often provides a price premium. Farmers also work together with public agencies and organizations to apply for grants for the development of cooperatives, better distribution and processing centers, research projects, and local networking. Low interest loan programs are available through state and federal programs to increase farmer retention.
8 Oregon Department of Agriculture (2012)

| 14
0%
50%
100%
Crook Deschutes Jefferson
% of Healthy Food Access by County
Most farmland incentives focus on the preservation and conservation of farmland and riparian zones. Thousands of farmers throughout the nation, and many in Central Oregon, currently participate in the federal Conservation Reserve Program (CRP) or Conservation Reserve Enhancement Program (CREP). These voluntary programs pay farmers to manage their lands in ways that reduce soil erosion and runoff while increasing the provision of environmental services including wildlife habitat. As a way to increase their cash flow, landowners have tried to combine these cost share programs with the benefits offered by other non‐profit organizations that are simultaneously conserving riparian zones and placing the land in permanent versus short‐term easements.
Ranchland is considered an agricultural use and can include rangeland, grassland, and pasture land primarily used for livestock grazing. Because of the vastness of rangeland in Central Oregon – potentially over 1.4 million acres – many producers use the value‐added label or certification of “free range” or “sustainable” on their meat products as it allows a premium to be paid on their product and does not necessarily change land management practices.
Healthy Food Access
Research shows that a poor diet is linked to major health concerns such as obesity and other chronic diseases. In rural areas, access to food in general is an issue; however, even if healthy food is accessible, affordability is the next biggest concern. These and other limitations have led to numerous studies by United State Department of Agriculture (USDA) and other organizations about healthy food access.9
In Oregon, the County Health Rankings organization measures access to healthy foods by the percent of zip codes in a county with a healthy food outlet – defined as a grocery stores or produce stand/farmers’ markets as defined by the North American Industrial Classification System (NAICS) codes. This measure is based on data from the US Census Bureau’s Zip Code Business Patterns. The State of Oregon has 62% of zip codes with healthy food access; the national benchmark is 92%. The overall state ranking for health outcomes by county is: Crook 14th, Deschutes 7th and Jefferson 33rd (out of 33).
The USDA Economic Research Service Food Desert Locator tool uses census tract information to characterize areas where access to food is limited. To qualify as low income, a communitymust have either 1) a poverty rate 20% or higher or 2) a median family income at or below 80% of the area’s mean family income. To be classified as a low access community, at least 500 people and/or at least 33% of the population must reside over a mile from a supermarket or large grocery store. Within rural areas the distance is 10 miles. In Crook County, almost one‐third of the population meets this low access criteria. In Deschutes County, 12% of the population has low access, and 1.3% of the population is both low‐
9 Access to Affordable and Nutritious Food: Measuring and Understanding Food Deserts and Their Consequences United States Department of Agriculture ERS
| 15
income and low access. On the Warm Springs Indian Reservation in Jefferson County, 79% of the population has low access, while 24% of that total is low‐income.10
2010 Community Food Needs Assessment Report
During the research phase of the Central Oregon Food Assessment, community surveys were conducted throughout the spring and summer of 2010 in the Central Oregon region. When asked what type of food people would like to see in their community, the majority (350 people) wanted fresh local produce. The biggest factor prohibiting them from buying this was that food was not sold where they shop and the cost was too high. Currently the majority of fresh food is purchased through direct markets – such as Community Supported Agriculture (CSA) shares, farmers’ markets, and on‐farm sales. Conventional and small food stores have a limited supply. The top two stated priorities when making food purchases were to have a healthy and quality product and the price.
In the community of Warm Springs the outcomes had statistically significant differences. When asked where people regularly shop, the majority (over 50%) answered convenience store/gas station. Fresh local produce was what people would like to see in their community followed by a supermarket and a food bank. One respondent stated that the “Warm Springs [food bank] will only help once a month [whereas] the ones in Madras are open more often, but are hard to get to”.
Overall, healthy food access is limited in Central Oregon. Part of the reason is lack of infrastructure to provide food to area markets, while the ability to access food both through travel and by monetary means has a large impact. Access then becomes part of a larger issue beyond the food itself – how to tie into the existing transportation system and how to educate the public about healthy food choices. Taken a step further, affordability both in terms of the ability to produce enough and purchase local food products, is also an issue in Central Oregon. As it stands, local food in general is not affordable for low‐income residents and sometimes not for moderate income level residents. Economies of scale and improved infrastructure could lend support to this and the issue of access.
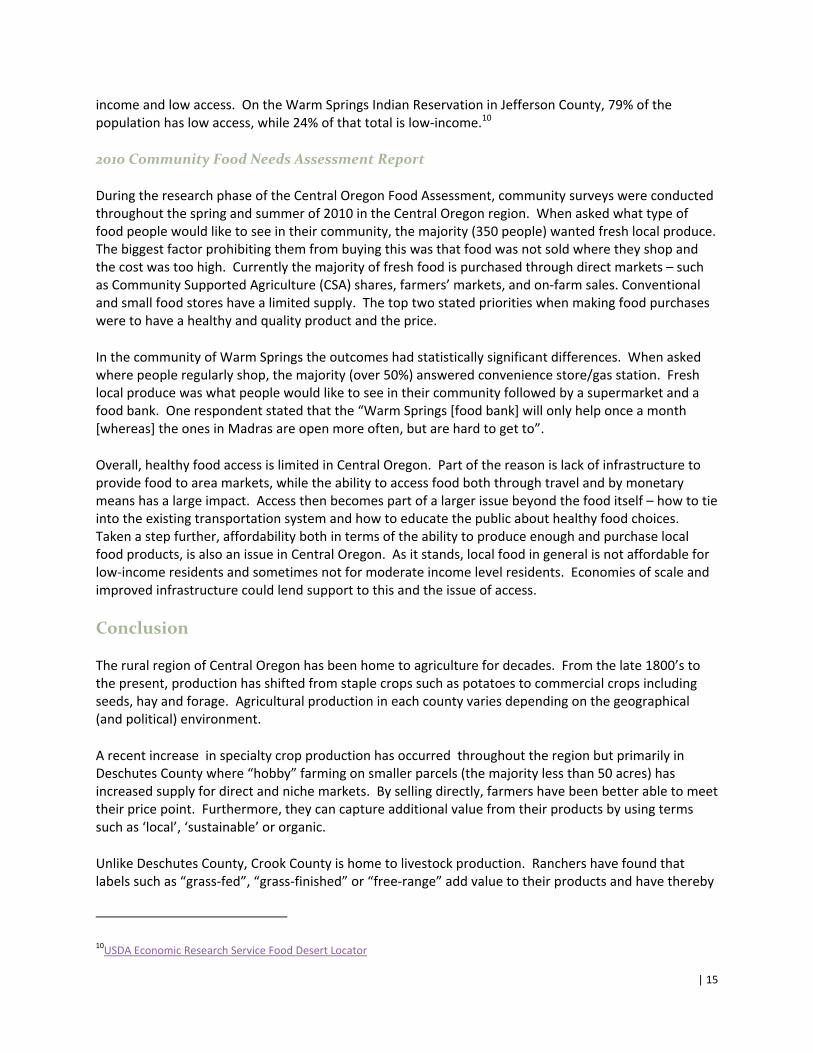
Conclusion The rural region of Central Oregon has been home to agriculture for decades. From the late 1800’s to the present, production has shifted from staple crops such as potatoes to commercial crops including seeds, hay and forage. Agricultural production in each county varies depending on the geographical (and political) environment.
A recent increase in specialty crop production has occurred throughout the region but primarily in Deschutes County where “hobby” farming on smaller parcels (the majority less than 50 acres) has increased supply for direct and niche markets. By selling directly, farmers have been better able to meet their price point. Furthermore, they can capture additional value from their products by using terms such as ‘local’, ‘sustainable’ or organic.
Unlike Deschutes County, Crook County is home to livestock production. Ranchers have found that labels such as “grass‐fed”, “grass‐finished” or “free‐range” add value to their products and have thereby
10USDA Economic Research Service Food Desert Locator

| 16
chosen to shift some of their production operations from commercial to direct market sales. In Jefferson County, commercial crops are the main agricultural product with twenty‐three percent of farms having more than 500 acres. Commercial crops have typically had a high market value but are often exported out of the region. Though the value of sales for all (commercial) vegetables for processing and the fresh market peaked in the early 2000’s, a sharp decline in 2007 has been a significant turn‐around for the region.
Building upon the Census of Agriculture data, our studies found that at least 300 farmers in the region are selling between $25,000 to $99,999 worth of agricultural products. Though these annual sales may be minor, they account for a small number of hobby farmers, which may be able to contribute to the supply chain to meet demand for local food. Just over 100 farmers make $100,000 to $250,000 in sales suggesting that perhaps they have a sufficient amount of production capacity to contribute to the local marketplace and benefit from increased processing infrastructure and support.
Our studies found that the largest land use barrier facing farmers is understanding how to be compliant with county and state laws, while at the same time increasing efficiencies in production, harvesting and processing. As an example, farmers may not be able to build secondary structures to house additional farm workers due to land use restrictions. Lack of regional infrastructure forces producers to process their goods on their farm, such as chickens; however, they feel hindered by the county permitting process, or by health inspections that pose the same limitations on small farmers as larger operations.
Although there is a reasonable amount of agricultural products being created, the region suffers from a limited growing season and a lack of access to fresh healthy food, particularly in the rural regions of Crook County, Jefferson County and the Confederated Tribes of Warm Springs. The County Health Rankings, which measures healthy food access, ranked Jefferson County the worst in the state of Oregon while the USDA Economic Research Service Food Desert Locator states that nearly 80% of Jefferson County’s populations have low access to food in general. These figures were furtherexplored in the 2010 Community Food Needs Assessment, which found that a majority people surveyed want fresh local food, but that affordability and transportation are key barriers.
Access to healthy food access could be increased through the development of a transportation and distribution system that provides excess product to the regional food bank or pantries. In areas of Jefferson County, where food access is considered to be the worst in the state, transportation and distribution of food has been found to be a key issue. Although there is a large amount of agricultural land, most of the production is shipped out of the region. Perhaps a small portion of the land could be designated for local food production.
This snapshot in time demonstrates that Central Oregonians are on par with the rest of the nation in their desire for local food. However, the limited growing season and lack of infrastructure cause the region’s farmers to struggle to keep up with the demand. Land use issues are a concern for producers while access and affordability is the greatest concern for individuals and food businesses. Building upon this information, Section 2 will further explore the current food system in Central Oregon.

| 17
Section 2: Central Oregon Food System
The purpose of this section is to describe the current food system infrastructure as it relates to processing, production, transportation distribution, and employment in Central Oregon. In order to determine the role of local food in the economy, an analysis of census trend data was collected and analyzed. The value of agriculture was identified in terms of production and exports, while employment in these sectors was used to analyze economic impacts on agricultural production and the associated jobs. Information regarding the local food supply and demand is limited and therefore extrapolated from commercial crop production data, measurements and trends. In an effort to integrate local food production into the overall food system in Central Oregon, certain assumptions were used and described throughout this section.
In the simplest form, a “food system” refers to the linkages between production and consumption of food. For the purpose of this study, Figure 2.1 represents the spokes in a Central Oregon food hub, which will help to define the structural typology that exists and can be expanded, or that needs to be created for a stable food economy. For the purpose of this study, the facility section will be the focus of the research. Although this section does not describe every aspect of the food system, it will cover storage, processing, distribution, employment, aggregation, production and agricultural support services.
Figure 2.1 Central Oregon Food System

| 18
Table 2.1 Value of Oregon Agriculture Exports
Value of Oregon Agricultural Exports ($1,000) 12
Fruits and preparations $229,100
Seeds $227,900
Wheat and products $220,725
Vegetables and preparations $151,800
Tree nuts $57,954
Nursery products $37,000
Feed and fodders $26,100
Christmas trees $17,708
Hides and skins $16,900
Live animals and red meat $16,100
Feed grains and products $ 9,500
Poultry and products $3,200
Fats, oils, and grease $800
Dairy products $400
Others $396,100
Agriculture and the Economy
Trends in Local Food Sales
According to empirical research conducted by the USDA Economic Research Service, local food sales account for a small but growing share of the total U.S. agricultural sales. In 2007, direct market sales for the U.S. accounted for $1.2 billion; 0.4% of the total sales. Although the percentage of sales is minimal, sales have more than doubled from 1997 to 2007. Research shows that direct market sales are more likely to occur on small farms growing a diversity of products with access to urban markets. The majority of these types of farms are located on the West Coast and in the Northeast and perform all the marketing functions that include storage, packaging, transportation, distribution and advertising, and typically have less than $50,000 in total farm sales. The direct‐to‐consumer sales are higher for entrepreneurial activities such as agri‐tourism. However, barriers to entry or expansion into local food markets for farmers includes: capacity constraints; lack of distribution; limited research, education, and training for marketing; and uncertainties related to regulations that affect food production.11
Oregon’s Agricultural Economy
In an effort to provide a context of agricultural infrastructure in relation to the food system, this section will explore the current agricultural economy of Oregon. Agriculture and timber production have been the backbone of Oregon’s economy for decades. Based upon the natural resource industry, an infrastructure was developed to meet supply and demand. Silos for grain storage, railroads for transportation of timber and wheat, and barges for shipping down the Columbia River to the Pacific Ocean were provided and served the exportation of goods. Currently, over 80% of commercial agricultural production leaves the state, and 40% of that leaves the country (Table 2.1). More than 60% of the exports moving out of the Port of Portland are agricultural products. Based on economies of scale, the existing infrastructure supports the movement of large amounts of goods from rural to urban areas. Global demand for items such as beef, oysters and wheat, all of which are produced in Oregon, puts pressure on these systems. 11
What drives Oregon’s agricultural economy has been estimated in a report titled Oregon Agriculture and the Economy: An Update,12 which suggests that the agricultural industry provides stability for Oregon’s economy. In 2009, agricultural was linked to 15% of all economic activity in the state. Globalization has contributed to stabilizing this sector as Oregon grown products are shipped across the U.S. and globally. While consumers and producers benefit from globalization, producers struggle to contribute to the local food economy given that exports are the
11 Martinez, Steve, et.al.,Local Food Systems Concepts, Impacts, and Issue. USDA ERS Number 97. 2010. 12 2011. Oregon Agriculture and the Economy: An Update. OSU Extension Service Rural Studies Program

| 19
main driver. This industry caters to large wholesalers and retailers and employs numerous people in the agricultural industry sector.
The infrastructure of agriculture is not only based on underlying facilities such as processing that support the system, but also the associated ancillary jobs. In general, 8% of jobs in Oregon are connected to agriculture. This not only includes agricultural production but also employment in the agriculture sector. Table 2.2 provides a summary of the total sales from the agricultural sector, employment, and value added expenditures (employee compensation, proprietor income, special business taxes, leases and rents). These sectors are the main drivers for the agricultural economy: infrastructure and human capital.
Table 2.2 Summary of Economic Activity of the Agricultural Industry in Oregon (2009)
Aggregated sector Output / Sales ($000) Employment
(full- & part-time jobs) Value added
expenditures ($000) Processing 12,355,613 31,308 2,232,797 Food services & drinking places 7,696,380 133,365 4,026,638 Production 4,321,666 54,120 1,607,990 Wholesale trade 2,568,297 12,958 1,689,559 Retail trade 980,933 16,369 828,492 Transportation & warehousing 743,518 4,859 356,620 Agriculture support services 238,105 7,762 182,820 Total agriculture 28,904,512 260,742 10,924,917 % agriculture (of total sectors in Oregon)
10% 12% 7%
Source: Oregon Agriculture and Economy: An Update. Oregon State University Extension Service Rural Studies Program. 2011
Throughout the U.S., small and large farms are increasing as middle‐sized farms (those that generate $10,000 to $250,000 in annual sales) shrink. According to the 2007 Agriculture Census, small farm operations (less than $10,000 in annual sales) generated less than 2% of the total agricultural output/sales for Oregon but own 13% of the total agricultural lands; perhaps suggesting there is excess land to build capacity for local food production and markets. Recognizing that land is under‐utilized, a review of policies or ordinances affecting farming regulations could be conducted to determine any barriers to increasing production opportunities.
For most of these producers, farming is not their primary occupation mainly due to lack of necessary income from farming. Although these producers may not generate a large amount of production they do provide an impact on direct “niche” markets accessed by consumers through farmers’ markets, road‐side stands, and community supported agriculture. One of the primary reasons farmers consider these markets versus commercial farming is that they have greater ability to influence the price of items, often referred to as “price makers”. 12
Economists recognize that markets are uncertain and sometimes disappointing but as agricultural sectors diversify their products they are less susceptible to economic swings. Still, producers struggle to stay in business. Policy decision makers can help the development of niche markets by reinforcing the development of economic markets for agricultural products through procurement incentive programs, land use regulations to encourage adaptive farming, support for research, and efforts to tailor regulations.

| 20
As an example, the Dane County Wisconsin Food Council suggested the following resolution be adopted by the County Board:
LOCAL FOOD PURCHASE POLICY – NOW, THEREFORE, BE IT RESOLVED that Dane County shall explore options for purchasing locally produced foods and using them in food service. Dane County, including Consolidated Food Service, is encouraged to investigate sourcing local food for the Themis Courthouse Café, senior centers, Sheriff’s office, Badger Prairie Nursing Home, as well as other Dane County facilities. This effort will provide added health benefits for private and institutional consumers and help to raise awareness about the positive impacts for Dane County’s agricultural economy and environment.
The Food Council further defined “local” the closest source geographically that meets a purchaser's nutritional, fiscal, and other guidelines. They also provided assistance to the food service company in identifying opportunities. This resolution was adopted by Dane County on March 15, 2007. Other policies could include procuring local food limited to an extra 10% of costs (Illinois Food, Farms and Job Act); procurement goals such as 10% procurement of local food in state‐funded institutions (Illinois); or land use policies that allow farm events to support agri‐tourism.
Existing infrastructure
Occupation and Processing
Oregon’s agricultural economy is strongly based in commercial farming operations. Crops and livestock produced on farms and ranches and fish harvested from the ocean are the basic inputs into the processing industry. This section will continue to provide data and trends to explain the basic infrastructure needs in a food system (employment, processing and manufacturing). In particular, this section will attempt to highlight the sectors of importance in Central Oregon.
Five processing sectors make up 64% of the total processing (in food, fiber and related products) sales in Oregon and include:
Frozen food (21%)
Baked goods, pasta and tortilla (14%)
Fruit and vegetable canning, pickling and drying (11%)
Breweries, wineries and distilleries (10%)
Dairy (8%) manufacturing.
The total processing sector for Oregon accounts for 31,308 full‐and part‐time jobs; the average wage for “food mixing and blending machine operators and tenders” was $11.33/hour in 2012. Although these sectors are modest in size compared to other states, Oregon ranks fifth in the nation for harvested acreage of processed vegetables, which is approximately 4.7% of the national total. Much of this processing is sweet corn, snap bean, green peas, garlic and squash.13,14
13 January 2011. USDA National Agricultural Statistics Services. 14 February 2008. Oregon Agriculture and the Economy. OSU Extension Service Rural Studies Program. Special Report 1080.

| 21
In Central Oregon, meat processing is largest processing sector (8th in Oregon) with 97 employees; total food processing is 4% of the state total. This 4% of employment will see a growth of 31% over 10years, as compared to 8% for the state. Of particular interest is a zero percent increase in “trimmers” in the state with an 18% increase in Central Oregon. In terms of agricultural workers, the largest increase (21%) will be graders and sorters of agricultural products (persons who grade, sort or classify unprocessed food). Second is “other” agriculture worker (15%), which could be general labor or production. The third likely sector are those who manually plant, cultivate and harvest agriculture or nursery products, and persons who tend to live farm and ranch animals (9%).14 For a complete overview of the total number of people employed by sector for the state of Oregon and Central Oregon (Crook, Deschutes and Jefferson counties) as well as the 10‐year growth projection from 2008‐2018 (see Appendix A, Table A‐1). In general, Central Oregon is poised to increase the occupations in both the food processing and agricultural workers sector. Although animal breeding will not increase, ranchers will continue to produce a sufficient amount of livestock to increase employment in meat related jobs. Manufacturing
The manufacturing of agricultural products is a stable part of the traded sector. Over the past 50 years, this sector has employed between 20,000‐26,000 people in Oregon. Nationally, food manufacturing made up 1.1% of total nonfarm employment in 2009 as compared to Oregon, which was 1.5% of total. This is primarily due to the frozen food manufacturing business (nationally 6% of total food manufacturing employment, 27% in Oregon in 2008). 15
Food Manufacturing Employment in Oregon (by % of total) Frozen food 27% Seafood product production and packaging 5% Fruit and vegetable canning and drying 15% Cookie, cracker and pasta 3% All other food 17% Coffee and tea 3% Bread and bakery 15% Animal food 1% Dairy product, except frozen 8% Flour milling and malt 1% Animal slaughtering and processing 5%
“Compared to the rest of Oregon's manufacturing sector, food manufacturing's wages are relatively low. In 2008, the average annual wage in Oregon's manufacturing sector was $53,130, significantly higher than the average across all industries, which was $40,486. Food manufacturing's average wage was less than both of those; its annual average wage in 2008 was $33,041.” 16
One of the reasons for the low wages has to do with the occupational mix of jobs within the industry, and the skill set required. Out of the ten largest occupations within food manufacturing, none require any postsecondary training; instead, they are on‐the‐job training or related work experience. Typically, jobs that require less training and education pay lower wages. 16
In Central Oregon, less than 10% of employment is based in manufacturing. In an effort to understand the total food processing and manufacturing businesses in Central Oregon, an inventory of the Oregon Department of Agriculture licensed businesses was compiled (excluding commercial operations that do
15 Oregon Labor Marketing Information System

| 22
not cater to locally produced foods). The largest employment in Central Oregon is in wholesale manufacturers of frozen dessert (Bonita Natural Artisan Gelato, Eberhard Dairy and Goody’s); poultry and rabbit slaughter (2 local farms); and custom stationary and mobile slaughter. A complete list of the businesses is provided in Appendix A, Table A.2
Again, a large amount of the industry sector is employed within meat production (primarily slaughtering and meat processing). Baked goods and food average 4.8% of the state’s total with food processing and bakeries (including breweries, coffee roasters, cookie companies, chocolates and others) being above average. Areas where employment could be added are egg production, confined animal feeding operations, and food warehouses.
Agricultural Support Services
Agricultural support service businesses provide food producers and processors specialized services that support their business practices. According to the Department of Agriculture, agricultural producers purchased more than $3 billion of inputs, including seed, feed, supplies and services from local companies (2011). For the purpose of this study, an inventory of Central Oregon licensed support through the Oregon Department of Agriculture was compiled. The top three services included: conveyance for transport (deceased animals) (18% of the state total); Central Oregon Livestock Auction (11%); and retail seed dealers (3%). Other support services include: commercial feed, deceased animal transporters, dairy haulers and pasteurizer operators, and fertilizers (recognizing there are other important support services). For a complete list see Appendix A, Table A.2
These services feed into the basic needs of farming and ranching but also have a large influence on the price point of products. As the cost of inputs (which also includes petroleum and feedstock) rise or fall, so too does the gross income and price of goods sold to consumers. Though the list is not all inclusive, it provides an overview of some of the types of agricultural support services that are necessary and important for agricultural production.
Farm Expenses
In general, Oregon farmers included in the 2007 Census Bureau data spent over $3.7 billion in farm expenses. The number one expense is farm labor, which has increased nearly $200 million in five years. The top three farm expenses (in $Millions) in the U.S. from 2002 and 2007 were:
2002 2007 $620 $817 Farm labor $259 $454 Feed $262 $312 Supplies, repairs and maintenance
Other costs include: fertilizers and chemicals, seeds and plants, livestock and poultry (purchased or leased), gas and fuels, utilities, rent and lease, interest and taxes and depreciated expenses. Not included in the census dataare the costs of land access, water use and pollution, energy production and soil health, which contribute to a sustainable food system.
Whether it is full‐time farmers or part‐time seasonal workers, Central Oregon’s economy is dependent on agriculture. In 2010, the average salary in Oregon for an agricultural production of crops was

| 23
$17,959 while livestock was $22,263. According to the Standard Industrial Classification for private agriculture, forestry and farming jobs, the average pay in Central Oregon in 2010 was $18,037.16 Table 2.2 provides an overview of crops harvested, the number of farm workers and the average pay.
Table 2.3 Central Oregon Crops and Farm Workers Data
# of crops harvested
% of State crops
harvested
# of full-time farm workers (150+ days)
# of seasonal farm workers (<150 days)
# of affordable farm worker
housing units
Average pay for agriculture, forestry
and fishing (’10) Crook 43,027 1.4% 190 246 0 $15,570
Deschutes 22,244 0.7% 219 607 0 $19,866 Jefferson 45,554 1.5% 265 843 47 $18,676
Source: Oregon Labor Market Information System (OLMIS)
Transportation, distribution and warehousing
Transportation of food products to consumer outlets and food retail buyers depends on the available infrastructure. Transportation options to and from Central Oregon are limited to three major highways: 97 (North/South) and 20 & 26 (West/East). The majority of Central Oregon’s resources are imported using this system, though rail is still used to transport goods. If the region were cut off from the rest of the state, it is estimated that consumers would run out of food supplies in three days.16 Transport of food is mainly limited to large trucking companies such as Sysco and Food Services of America, although small companies such as Agricultural Connections or vendors at farmers’ markets drive to or from the Willamette Valley, approximately 250 miles round‐trip, to bring food from small farms that cannot be grown or produced in large quantities in Central Oregon.
Economies of scale are often the barrier for entry into the food system for producers and food businesses. Typically, distributors buy food directly from farmers and processors and then re‐sell the food through food outlets such as grocers or restaurants. This process generally leaves out small to midsize farmers that do not have the capacity to provide large quantities of products.17 Large retail stores often have a vertically integrated system that tends to shut out businesses that do not meet their requirements. This means one firm general owns an entire production and distribution system versus working with multiple firms for each process.
The current food distributors in Central Oregon are either large corporations such as Sysco and Food Services of America or smaller businesses such as 24 Carrot Produce Company, Aloha Produce of Central Oregon, and High Desert Produce. The smaller businesses often procure food from growers throughout Oregon and neighboring states. Recently, a small distribution business, Cascade Couriers, began transporting and distributing Central Oregon food through pick‐up and delivery to direct markets. The movement of local food by this company is filling a necessary gap and providing a necessary service for producers and consumers.
16 2010 Central Oregon Food Assessment 17 June 2011. Context Matters: Visioning A Food Hub in Yolo and Solano Counties. The Ag and Food Alliance

| 24
Commercial Kitchens
Commercial kitchens provide a service that is otherwise inaccessible for many producers: value‐added production. Value‐added production takes a product from raw form to a product such as a salsa or jam. This type of processing allows agricultural producers to not only capitalize on creating a product that has more value in a different form but also provides an off‐season income. Commercial kitchens in Central Oregon are typically found by word of mouth or via the internet. Most often, producers rent kitchens from café or restaurant owners during evenings or early mornings when they are not being used for general purposes. A comprehensive list of kitchens would be useful as it would provide an infrastructure gap that has been identified in previous studies.
Local Food Marketplace
The local food marketplace in Central Oregon is limited to mainly small mom and pop‐owned markets or larger retail stores and includes: Devore’s Good Food (Bend), Melvin’s Fir Street Market (Sisters), Nature’s General Store (Bend), as well as the IGA franchise Newport Market (Bend) and Whole Foods (Bend). There are a total of seven farmers’ markets in the region and two online retailers: Agricultural Connections and Central Oregon Locavore (Locavore).
Central Oregon Locavore provided total sales information from January 2011 – March 2012 for (primarily) local food products. The highest selling items (32% of total sales) are frozen meat and poultry; second are beans, rice four, sweeteners, oils and nuts (16%); and third dairy, cultures and dairy‐free sorbettos (15%). Eggs are a hot commodity at 10%, while value‐added products such as sauces, salsas, jams, jellies and preserved/ready‐made foods make up 5% of sales. Many of these items are currently grown or raised in Central Oregon.
Supply
Commercial Crops
The question of whether or not Central Oregon can produce enough local food to feed residents is a common question, and a difficult one to assess. A known proxy for food production is to calculate the food availability per capita. This is calculated by adding the available commodity supply (total annual national production, imports and beginning stocks of a particular commodity) and then subtracting the measureable non‐food uses (exports, ending stocks, and nonfood uses)18. This total number is then divided by the population estimates for the United States.
In Table 2.3, this is shown as the total pounds of food available per person by product. For example, one person has available to them 61lbs of beef, 7 lbs of cabbage, 0.1 lbs of hazelnuts and 7 lbs of cucumbers per year. Whether a person is able to eat all these products is not part of the equation. It is simply to point out how many commercial crops are produced each year that could be used to feed our nation.
18 2001 Farm to Plate Strategic Plan Executive Summary, Vermont Sustainable Jobs Fund
Available commodity supply [ production + imports +
beginning stocks ]
Measureable nonfood use [ farm inputs + exports +
ending stocks, etc. ]
Total annual food supply of a commodity
US Population

| 25
One of the main weaknesses to this equation is that the pounds of food per person per year can only be calculated at an aggregated scale, not at county or any other regional scale.
In an attempt to determine how much food is available to people in Central Oregon, the commercial crop production was compared to the number of farms producing the food products in the region. Of the total products, the region produces mostly meat products with few vegetables; the majority of these farms are located in Deschutes County. Although the data does not directly demonstrate the supply of products in Central Oregon, it does suggest that supplies are limited and lack diversity; it should be noted that these are based on commodity products.19 Products that are produced in every county are highlighted in yellow.
Table 2.4 Food Availability in Central Oregon
Selected Commercial Food Products
Pounds of food available per
person in the US (2009)*
Number of Farms Producing Food Products
Crook Deschutes Jefferson Oregon
Beef 61(r) 384 556 242 16,062 Chicken 80(r) - - - 31 Dairy 190(f) 1 6 2 592 Pork 50(r) 29 54 8 1,283 Apples 16 2 3 3 1,330 Bell peppers 9 - 2 - 111 Broccoli 6 - 1 - 87 Cabbage 7 - - - 52 Carrots 7 - 4 1 176 Cucumbers 7 - 2 - 306 Greenhouse vegetables / fresh cut herbs - - 5 2 132 Green peas 3 - - - 27 Hazelnuts 0.1 - - - 850 Head lettuce 17 - - - 28 Leaf lettuce 11 - 3 - 110
Onion 19 - 10 - 300 Potatoes 36 1 6 4 299 Pumpkins 4 - 3 4 339 Snap beans 2 - 4 - 342 Sweet corn 9 - 6 - 382 Tomatoes 19 - 4 - 504 *2009 per capita availability, (r)retail, (f) fluid 2011 Farm to Plate strategic Plan Executive Summary, Vermont Sustainable Jobs Fund, 2007 US Agriculture Census
This data suggests that there are gaps (farms not producing certain crops) in the amount and diversity of commodity food crops produced in Central Oregon. These gaps provide an opportunity for farmers and ranchers to provide a niche product that is otherwise not available. Using direct markets, versus Oregon exports as previously explained, would allow the farmer to capitalize on these potential opportunities.
19 USDA Economic Research Service Food Availability Data System

| 26
Specialty Crops
Determining the amount of locally produced food sold through direct markets is much more difficult to assess. The 2007 Agriculture Census Data for Central Oregon shows that the number of farms with direct sales to individuals increased from 62 farms to 90 farms (45% increase) from 2002‐2007, while Deschutes decreased by 14% (241 to 207 farms) and Jefferson County increased by 8% from 37 to 40 farms. This suggests that more farmers or ranches in Crook County are monopolizing on direct to consumer sales. Given that livestock is a large part of the agricultural community, perhaps ranchers are direct selling their beef products. Results in Deschutes County could be from a decrease in the number of farms or ranches.
According to the Census of Agriculture, the reported value of direct sales, which includes locker beef (half and whole), farmers markets, community supported agriculture and farm stands, increased 124% in Crook County, 3% in Deschutes County and 187% in Jefferson County – which is interesting given that the number of farms with direct sales only increased 8%.
Farm direct sales in Deschutes County per person were $3.85 compared to $9.63 in Crook or $13.72 in Jefferson. This demonstrates that the prices of farm direct product is less expensive in Deschutes than the other two counties. However, the number of sales per farm in Deschutes County was $2,397, which is low compared to Jefferson at $7,450. This could mean that Deschutes County farms are underselling their products or that products are coming from other sources. Perhaps Jefferson County is selling more product or product that has a high value. Either way, direct sales for farmers could be improved upon in future years.
Producer Survey
In an effort to further determine Central Oregon production, a survey of agricultural producers and food businesses was conducted through various workshops and via an online survey (Appendix B). In the spring of 2012, select groups of small farmers who are known to have established direct markets were surveyed through online means. The return rate was nominal, with nine total respondents (out of an estimated 13 people).
The respondents were almost evenly divided between all three counties with every producer having irrigated water rights, half of them have season extenders and half of them participate in agri‐tourism events. When asked how many acres they farm, the majority farmed between 50‐179 acres with two farming over 500 acres. Most make between $10,000 ‐ $24,999 in gross farm income, with the lowest having a loss and the highest over $50,000.
Respondents were asked what products they sell and where they sell them. All of the respondents sell meat, with 5 selling eggs, and 4 selling vegetables. When asked what percentage of each item they sell, the majority sell meat and dairy. Between 40‐60% sell vegetables in addition to meat and dairy, and 20% or less include eggs, grain and fruits/berries in their available products.
| 27
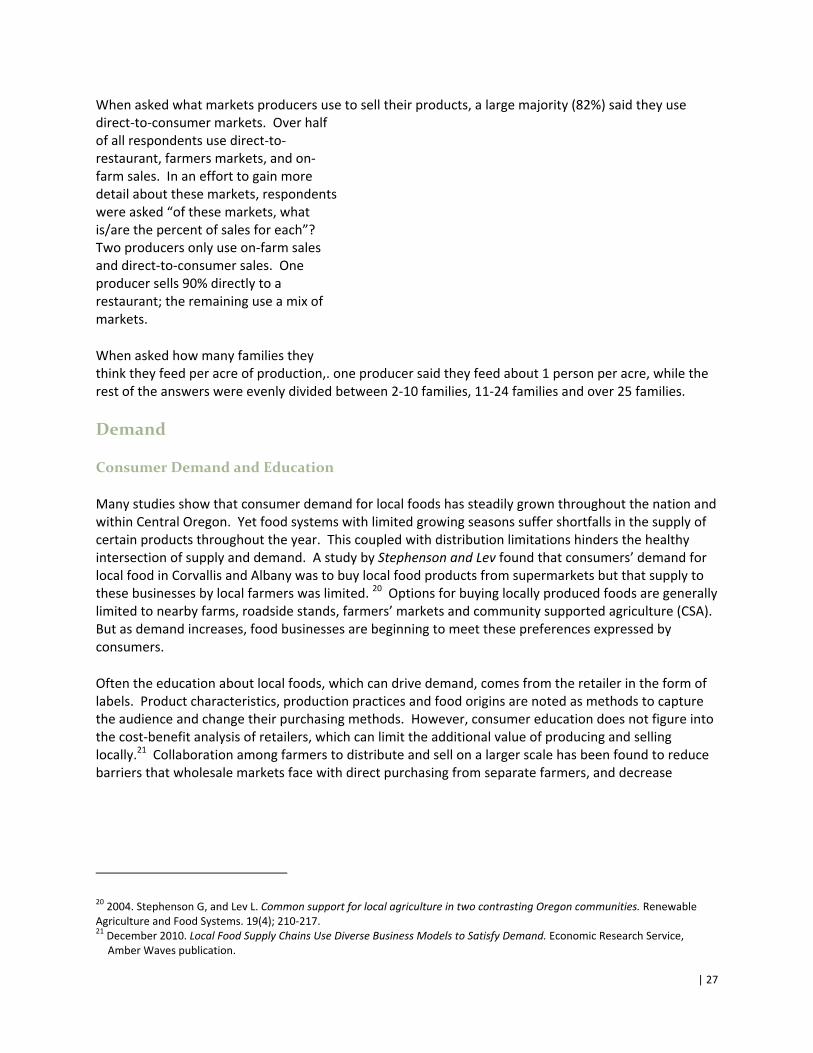
When asked what markets producers use to sell their products, a large majority (82%) said they use direct‐to‐consumer markets. Over half of all respondents use direct‐to‐restaurant, farmers markets, and on‐farm sales. In an effort to gain more detail about these markets, respondents were asked “of these markets, what is/are the percent of sales for each”? Two producers only use on‐farm sales and direct‐to‐consumer sales. One producer sells 90% directly to a restaurant; the remaining use a mix of markets.
When asked how many families they think they feed per acre of production,. one producer said they feed about 1 person per acre, while the rest of the answers were evenly divided between 2‐10 families, 11‐24 families and over 25 families.
Demand
Consumer Demand and Education
Many studies show that consumer demand for local foods has steadily grown throughout the nation and within Central Oregon. Yet food systems with limited growing seasons suffer shortfalls in the supply of certain products throughout the year. This coupled with distribution limitations hinders the healthy intersection of supply and demand. A study by Stephenson and Lev found that consumers’ demand for local food in Corvallis and Albany was to buy local food products from supermarkets but that supply to these businesses by local farmers was limited. 20 Options for buying locally produced foods are generally limited to nearby farms, roadside stands, farmers’ markets and community supported agriculture (CSA). But as demand increases, food businesses are beginning to meet these preferences expressed by consumers.
Often the education about local foods, which can drive demand, comes from the retailer in the form of labels. Product characteristics, production practices and food origins are noted as methods to capture the audience and change their purchasing methods. However, consumer education does not figure into the cost‐benefit analysis of retailers, which can limit the additional value of producing and selling locally.21 Collaboration among farmers to distribute and sell on a larger scale has been found to reduce barriers that wholesale markets face with direct purchasing from separate farmers, and decrease
20 2004. Stephenson G, and Lev L. Common support for local agriculture in two contrasting Oregon communities. Renewable Agriculture and Food Systems. 19(4); 210‐217. 21 December 2010. Local Food Supply Chains Use Diverse Business Models to Satisfy Demand. Economic Research Service, Amber Waves publication.

| 28
marketing and overhead costs while preserving farm identity, which is important for both the grower and the consumer. 22
Generally, consumers who value fresh, local and high quality foods are willing to pay more. Therefore, budgeting for food expenditures plays a large role in what consumers buy and eat and the demand it places on the marketplace. In an effort to understand how the population is using their money to purchase certain food items, an analysis of the 2010 consumer price index estimated that the amount a person spends per year on food at home* was $2,093 as compared to $1,923 away from home**. What this means is that 6% of a household are spending their disposable income on healthier foods purchased at the grocery store, retail outlets and food produced and consumed on farms as compared to the 4% spent on meals, snacks, or concessions.23 However, experts predict that per capita spending on restaurants will increase by 18%, with fast food purchases increasing by 6% between 2000 and 2020.24
Consumer education and outreach is key to providing knowledge about the benefits of spending money on more fresh and local food prepared in the home versus at restaurants or convenience stores. Not only are the health aspects of buying fresher food important, but also the benefit to the local economy and agricultural producers. Consumer education therefore plays an important role in consumer demand – demand for locally produced foods that support local farmers and ranchers.
Institutional
Consumer demand can also be created or increased through larger institutions that are buying locally. Hospitals and schools deliver large volumes of food to many people where consumer education can be integrated into the system, often educating people that may not otherwise have the opportunity to learn about healthy options. Institutions such as St. Charles Health System and Bend‐LaPine School District offer limited supplies of local foods.
In the summer of 2010, St. Charles Medical Center (SCMC) in Bend worked with a local farmer to provide goods that could be produced seasonally instead of buying from a major food distributor. The demand was to meet the needs of the hospital from May 1 – September 29, which included:
43,430 pounds Bean, beet, bok choy, broccoli, brussel sprout, cabbage, carrot, cauliflower, herbs, lettuce (head and blend), onion, parsnip, sugar pea, pepper, potato, radish, rutabaga, shallot, spinach, squash, tomatillo, tomato, and turnip.
1,776 pints Tomatoes 806 pieces Cabbage, chard, cucumber, eggplant, herbs, lettuce, onion, pepper, potato, radicchio,
and squash
*Food‐at‐home expenditures include food sales from (1) Food Stores; (2) Other Stores; (3) Home Delivery and Mail Order; (4) Farmers, Manufacturers, and Wholesalers; and (5) Home Production and Donations.
**Food‐away‐from‐home expenditures include food sales from (1) Eating and Drinking Places, (2) Hotels and Motels, (3) Retail Stores and Direct Selling, (4) Recreational Places, (5) Schools and Colleges, and (6) All Other.
22 2011. Schmidt, M., et.al. Increasing Farm Income and Local Food Access: A case study of a collaborative aggregation, marketing, and distribution strategy that links farmers to markets. Journal of Agriculture, Food Systems, and Community Development. Volume 1, Issue 4.
23 2010. Food Consumer Price Index and Expenditures: Measuring the ERS Food Expenditure Series 24 2004. The Demand for Food Away from Home: Full‐service or Fast Food?
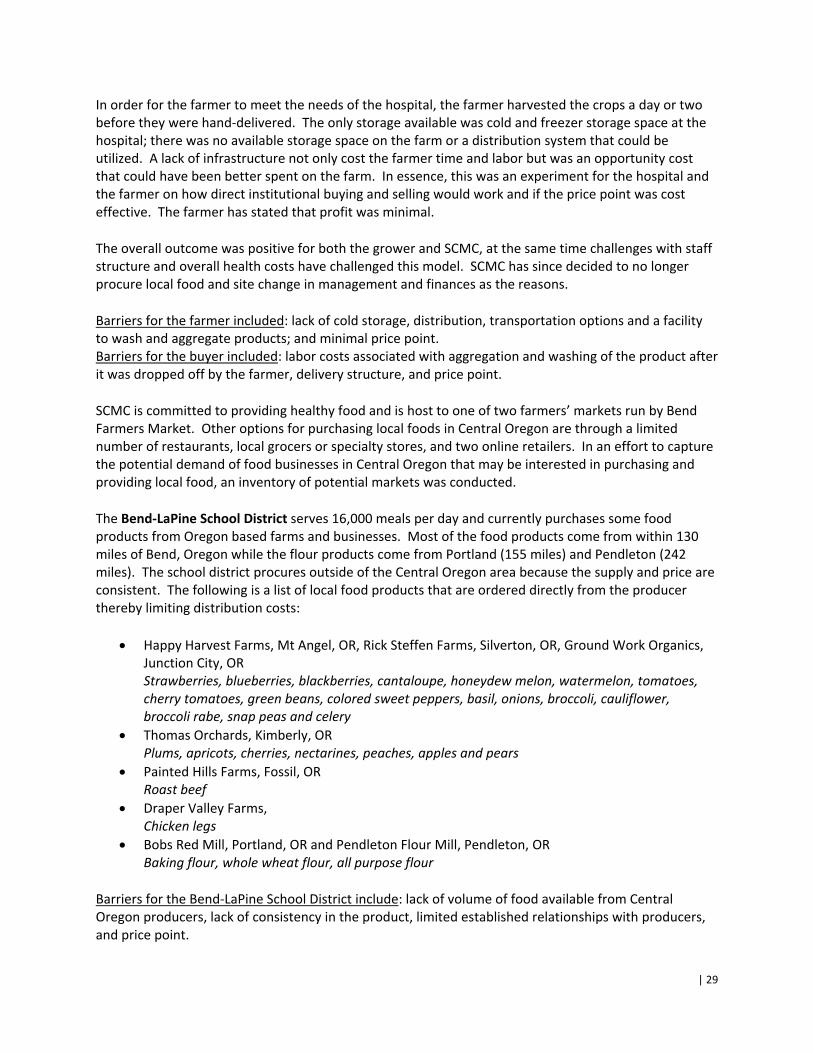
| 29
In order for the farmer to meet the needs of the hospital, the farmer harvested the crops a day or two before they were hand‐delivered. The only storage available was cold and freezer storage space at the hospital; there was no available storage space on the farm or a distribution system that could be utilized. A lack of infrastructure not only cost the farmer time and labor but was an opportunity cost that could have been better spent on the farm. In essence, this was an experiment for the hospital and the farmer on how direct institutional buying and selling would work and if the price point was cost effective. The farmer has stated that profit was minimal.
The overall outcome was positive for both the grower and SCMC, at the same time challenges with staff structure and overall health costs have challenged this model. SCMC has since decided to no longer procure local food and site change in management and finances as the reasons.
Barriers for the farmer included: lack of cold storage, distribution, transportation options and a facility to wash and aggregate products; and minimal price point. Barriers for the buyer included: labor costs associated with aggregation and washing of the product after it was dropped off by the farmer, delivery structure, and price point.
SCMC is committed to providing healthy food and is host to one of two farmers’ markets run by Bend Farmers Market. Other options for purchasing local foods in Central Oregon are through a limited number of restaurants, local grocers or specialty stores, and two online retailers. In an effort to capture the potential demand of food businesses in Central Oregon that may be interested in purchasing and providing local food, an inventory of potential markets was conducted.
The Bend‐LaPine School District serves 16,000 meals per day and currently purchases some food products from Oregon based farms and businesses. Most of the food products come from within 130 miles of Bend, Oregon while the flour products come from Portland (155 miles) and Pendleton (242 miles). The school district procures outside of the Central Oregon area because the supply and price are consistent. The following is a list of local food products that are ordered directly from the producer thereby limiting distribution costs:
Happy Harvest Farms, Mt Angel, OR, Rick Steffen Farms, Silverton, OR, Ground Work Organics, Junction City, OR Strawberries, blueberries, blackberries, cantaloupe, honeydew melon, watermelon, tomatoes, cherry tomatoes, green beans, colored sweet peppers, basil, onions, broccoli, cauliflower, broccoli rabe, snap peas and celery
Thomas Orchards, Kimberly, OR Plums, apricots, cherries, nectarines, peaches, apples and pears
Painted Hills Farms, Fossil, OR Roast beef
Draper Valley Farms, Chicken legs
Bobs Red Mill, Portland, OR and Pendleton Flour Mill, Pendleton, OR Baking flour, whole wheat flour, all purpose flour
Barriers for the Bend‐LaPine School District include: lack of volume of food available from Central Oregon producers, lack of consistency in the product, limited established relationships with producers, and price point.

| 30
Food Businesses
In January 2012, a Local Food Procurement survey was conducted with businesses throughout Central Oregon (Appendix C). The purpose of this survey was to gain a better understanding of the capacity of the region to support a local food hub, particularly in terms of food demand from local farmers, ranchers and food producers. A total of 22 businesses responded. These respondents were asked for their average weekly volume (in sales) of food products. Answers varied from $1,000 to $20,000, the average was $3,244.
Distribution Questions When asked which distributor they use, the majority stated “other”, which included local farmers, Agricultural Connections, a local butcher, Cash and Carry, direct from other retailers, Ocean Beauty, and state and local food banks. Second was Sysco, which is a national chain, and third was Duck Delivery (local distributor) and Provvista (Pacific Northwest specialty foods distributor). Respondents were asked what types of foods they bought outside of normal distribution channels. Answers included: fresh fish, lamb, hamburger, cheese, vinegars, oils, hot sauces, milk and eggs.
Buying Local Foods Questions What is local? This is a common question for many people, both consumers and producers. Respondents were given the following options to choose from: Central Oregon, Oregon, and Pacific Northwest. Almost half of the respondents (43%) stated that Oregon was considered local, while 38% stated Central Oregon, and 19% stated the Pacific Northwest. Two respondents said Deschutes County and another said that it changes as they find suppliers. Of the total that answered the question, 85% said they sell products marketed as “local”.
Of the total respondents, two stated that they do not buy local products. When asked how much more they would be willing to pay to buy local, both stated no more than 5%. When asked how much more they think the customer would be willing to pay, both responded 2‐5. They stated that the most important factor affecting whether or not they would carry local products were reliability and quality. Availability and cost were second most important with having a local supplier, demand from customer, and relationship with farmer being of lesser importance.
The largest barriers for businesses currently purchasing local food were irregular supply and price followed by volume, convenience and distribution. Food safety, lack of demand and quality were not considered to be major barriers. Of those that chose “other” their reasons were climate, “I don’t buy I
| 31
grow”, and marketing/changing customer patterns.
Of those respondents that answered yes to “marketing locally produced food”, every respondent stated that buying locally contributes to the local economy with “fresher”, “better taste” and “higher quality” among the top four answers.
In an effort to understand their purchasing methods, we asked how often respondents buy local food products. Nearly 53% buy products weekly, 29% buying seasonally, and 12% buying daily. The majority (77%) buy directly from the producers, 60% buy seasonally at the farmers markets, 30% through a distributor, and 17% at a supermarket. When asked their preferred method for buying local products most prefer to go direct through the producer with on‐line or paper as the next best options.
Respondents were asked “what percentage of overall food purchases are local products”. Of those that answered over 20% of their purchases were local, milk; dairy; and meat were the highest products bought. Vegetables accounted for most of the 5‐20% local products, and fruit and specialty prepared goods were less than 5%.
Lastly, we asked what form (as‐is; washed; washed and packaged; and washed, packaged and cut) businesses wanted the food product to be in when it was delivered. The majority (53%) said as‐is was fine, while 30% preferred it to be washed, 12% washed and packaged, and 6% preferred washed, packaged and cut.
Outreach and Education Questions
To better understand the needs of food businesses, questions were asked about outreach and education opportunities. The majority of participants agreed that a distribution network, educational programs for producers, and a producer directory were important initiatives to support the local food movement.
When asked what would help their business to make more local food purchases, the majority (63%) said that a virtual directory would be helpful. Identifying local food items at businesses was the second most important (58%), with a printed directory and restaurants identifying local food menu items as the third most important. Of lesser importance was a regional marketing campaign. Of those that answered “other”, respondents stated that more products and better price points would be helpful, as well as a central distribution center. Another respondent stated that a marketing campaign would be the most helpful because it targets a specific audience, the consumer.
The statement “buying local supports local farmers and growers” was unanimously agreed upon as a virtue of buying local products. Supporting the local economy and less environmental impact were of secondary importance, with better quality and fresher were third. Eighty seven percent of respondents stated that having access to a contact list of producers would be helpful as well as having one point of contact (47%) to ask questions and meeting producers (40%). One respondent stated:
“Local food brings communities closer in touch emotionally and physically with their surrounding landscape and the people who inhabit it. The engagement of this connection, I believe, is vital to the stimulation and long‐term sustainability of the local food movement.”

| 32
The last question asked was, “do you have any advice for networking to promote local?” The following answers were provided:
“Farmers need to be able to produce enough supply on a regular basis at a competitive price to meet our needs.”
“The local farming capabilities currently are not large enough to support the per capita restaurant scene in central Oregon, but it is great for small businesses and at home cooking if the price can be competitive with outsourced products that are of the same quality. Local needs to be at least all of Oregon, not just 3 counties to be competitive.”
“Items grown or created on Westside of mountains that are labeled "local"....that concept or advertising method needs to change.”
“I want to know what is available Central Oregon local, within a hundred miles, within the whole state, and within the Pacific Northwest. My biggest issue right now is with sourcing things like vinegar, soy sauce etc. I don’t expect them to be central Oregon local, but I would like to find producers that are at least in this part of the country. So I guess, layers of local availability.”
Barriers and Opportunities to Buying Locally
In the spring of 2008, a Food and Farm Business workshop was provided in coordination with the Oregon Environmental Council, Oregon State University Extension Service and Central Oregon Intergovernmental Council. The goal of this workshop was to share successes and challenges to buying regional and local food. A survey was distributed to participating agricultural producers and consumers. The majority of the food business participants surveyed were from institutions, restaurants, and farmer’s markets, while the majority of food consumers were from a grocery store and farmers’ market. When asked what the most important aspect of a seller/buyer relationship was, the majority felt it was shared values and trust. Results from the food business survey found:
Common barriers to buying locally: Suggestions to alleviate these barriers: Availability Website Cost Increase community participation Volume Increase health avocation Lack of connection to produce Engage city/county leaders in the discussion Distribution Provide more information and education Consistency
The majority of agricultural producers were producing meat, vegetables, community supported agriculture shares, and herbs. Most of these goods were marketed direct to the consumer but also through farmer’s markets, grocery stores, online and through CSA shares. Results from the producer survey found:
Preferred markets: Main barriers to entry into markets: Institutions Distribution Restaurants Cost

| 33
Retail No personal connection Cooperative Lack of time Farmers’ markets
Suggestions to alleviate the barriers to entry into markets included: commitment from buyers, grants and loans, a food cooperative, education, collaboration and distribution options. Most producers promote their products using the term “local” and would be interested in selling more products at the farmers’ markets and through a cooperative. When asked what the most important aspect of a seller/buyer relationship is, the majority stated trust and consistency.
In an effort to align supply and demand, producers and consumers were asked how much they produce and procure of local goods (see below)
Goods produced locally Goods demanded locally % of locally purchased goods Beef/chicken/lamb/pork/goat Turkey/chicken/pork School district: 1% Eggs Produce Hospital: 10% Produce/Fruit Gluten free Resort: 10‐15% Grains Seasonally grown Grocer: 10% Herbs/Flowers Berries/Fruit Other: gelato and oil seed Other: beverages and nuts
When asked what other topics are of concern in regards to future workshop, the following were suggested:
Cooperatives for local food Value added food products Education and information Value chain and logistics management
Networking Public policies Marketing Labor Local/regional distribution system Low‐income access
Packaging
Conclusion
Our study found that Oregon’s agricultural economy is heavily based and formed around commercial crop production. The majority (80%) of the agricultural production leaves the state; half of this total leaves the country in the form of beef, oysters and wheat. Current infrastructure supports the exportation of these products and funnels food through main highway and river arterials. On the other hand, small farm operations generate less than 2% of the total agricultural sales in Oregon but own 13% of the total land; perhaps suggesting that there is ample land to build the local food capacity and markets.
In Central Oregon, Jefferson County grows the most commercial crops, with Deschutes County transitioning to smaller, more diverse farms; ranching communities are spread throughout the region but primarily reside in Crook County. These ranches support the majority of the processing and manufacturing jobs associated with agricultural production, and account for 4.1% of the state’s manufacturing total. The processing sector is expected to increase in the next 10 years. While there are a few distribution and warehouse outfits, they are mainly large operations, which carry limited to no

| 34
local produce (most likely because of economies of scale and vertical integration). While these are considered barriers to market entry for small producers, direct “niche” markets play a role and serve to increase local food transactions between producers and consumers.
Aside from commercial crop census data (which does not account for specialty crop production) the estimation of local food supply is limited to informal surveys. Studies found that the majority of available products include meat, eggs and vegetables, which are mainly sold directly to the consumer through on‐farm sales or direct to restaurants. Though consumer demand steadily grows, supply falls short thereby limiting availability and serving to increase frustration among retail stores in regards to consistency, quality and volume of locally produced products. In a food system with limited growing seasons, shortfalls in supply will hinder a healthy intersection of supply and demand.
Infrastructure was identified as “lacking” in the region. To support this healthy intersection of supply and demand, the following systems could provide for a more integrated food system: aggregation area for post‐harvest products to increase volume and consistency as well as price points; small services such as wash basins for post‐harvest cleaning and a commercial kitchen for small processing such as cutting of carrots or value‐added production; increased cold and freezer storage space for product waiting to be distributed or picked‐up; improved distribution options through a wider geographic range; and transportation of local goods out of the region to increase markets and sales.
The main barriers to buying local goods for retailers are irregular supply or availability, price, and volume The suggested methods to alleviate these issues are a collective website for wholesale pricing, increased community participation, and increased health avocation. Agricultural producers and consumers both agree that increased networking opportunities could facilitate a better exchange of information. In general, food businesses feel that educational programs for producers about how to market their products would assist with building a robust supply chain as well as a distribution network to connect buyers with sellers.
Studies show that consumers value fresh, local and high quality foods and are willing to pay. The amount of money spent by residents in Central Oregon on farm direct sales varies from $3.85 to $13.72 suggesting that prices, and perhaps quantities of goods, vary from county to county. Nationally, households are likely to spend 6% of their disposable income on said products, but this is likely to decrease with increased access to processed food. In a society based on instant gratification, education is a key component for consumers to understand how to buy and cook seasonal food, and how to purchase food through alternative access points such as farmers markets or road‐side stands.
In Central Oregon, a demand for local food exists and can be expanded upon through proper marketing and education techniques. Support for a balanced supply and demand will most likely need to be formed through local relationships built upon shared values and trust. Land use or food procurement policies could aid in this support and simultaneously involve multiple stakeholders in the development of an integrated food system.

| 35
Food Hub
A centrally located facility with a business management structure facilitating the aggregation, storage, processing, distribution, and/or marketing of locally/regionally produced food products (USDA Agriculture Marketing Service working definition)
Purpose: to increase small and mid-sized producers’ access to market channels
Core components:
Aggregation Distribution Active Coordination Permanent Facility
Other components:
Wholesale/retail space Social service assistance Community kitchens Community meetings
Benefits:
Expanded markets Job creation Increased access to local
food
Section 3: Food Hub
According to the USDA Agriculture Marketing Service, the working definition of a food hub is: a centrally located facility with a business management structure facilitating the aggregation, storage, processing, distribution, and/or marketing of locally/regionally produced food products.
The USDA suggests that the core functions of a food hub are aggregation and wholesale distribution, active coordination, and a permanent facility. This function creates efficiencies on a larger scale allowing the distribution of consistent and reliable food products. The aggregation and wholesale distribution specifically provide a drop‐off point for multiple producers to have their products distributed in various forms to retailers. The coordination and management of a food hub is essential to a functioning food system. It provides a business management system that small to midsized producers may lack while providing access to wholesale markets. A coordinator or manager would oversee the balance of supply and demand for products, such as actual processing of goods, as well as coordinating planting schedules and product varieties with production to meet the demand. Key to all of this is the permanent placement of a facility that meets the current and projected needs of the community while serving as the terminus for food products and including value‐added features such as a commercial kitchen, wholesale or retail outlet, community meeting space, and/or social service assistance.
Development of Food Hubs
In our existing food system, the typical supply chain (Figure 3.1) is linear; it starts with the producer and ends at the consumer, with many processes and infrastructure in between. Although the supply chain is based upon an economy of scale where each sector can efficiently provide a specific service, the traditional supply chain lacks a feedback loop from the consumer to the producer. Without this feedback loop, producers respond to market signals from buyers and brokers while consumers react to marketing campaigns from retailers, thus limiting the balance in the food chain. According to Ken Meter, a well‐known food system analyst, between the years 1950‐2006, food processors and buyers earned three times the revenue than that of producers selling commodity products. Although farm sales and productivity doubled during this time frame, farmers earned 19% of the retail value of the food sold in 2006 as compared to 41% in 1950. 25
25 Meter, K. (2011). Breaking our chains. Journal of Agriculture, Food Systems, and Community Development, 1(4), 23–25.

| 36
While this is the current system, it leaves producers in the dark in terms of predicting futures for productivity and revenue. The supply chain itself omits several critical features, or market externalities, of the food system, such environmental impacts of food and packaging waste, consumer preferences, labor, and the impact of fuel prices. Instead, this model tracks the cash flow; while this may be considered “efficient” in economic terms, producers are at the whim of the system. According to the well known Agricultural Economist, John Ikerd, sustainable food chains must focus on the triple bottom line: ecological, social and economic. In reponse to the “broken” food chain, national trends show that farmers are going back to the older system of direct sales to consumers. Conceptually, this system is more circular where producers are provided a premium price on goods and consumers provide feedback on their preferences (see Figure 2.1). Distributors and processors are still a part of the system and provide feedback to and from producers to the end user. These expanded market opportunities have allowed producers to enter a niche markets such as restaurants and farmers’ markets. The benefit is that producers receive a premium on their product; the barrier is marketing their products. Enter Food Hubs. A hub is a working system that integrates these processes in a sustainable model. Food hubs have been recognized as possible solutions to these issues. “Proponents argue that food hubs offer a mechanism through which smaller farmers can access larger retail, institutional, and commercial food service markets that were not previously possible. They offer opportunities to create alternatives to commodity agriculture that strengthen local economic development through agriculture”. 26 In response, the USDA developed the Regional Food Hub Collaboration. This collaboration is a partnership between USDA, Wallace Center at Winrock International, National Good Food Network, National Association of Produce Market Managers, and Project for Public Spaces, which collects and analyzes the latest developments and research and activity related to food hubs. Additionally, an initiative called Know Your Farmer, Know Your Food (KYF2) was created with a specific task force comprised of representatives from every agency, which meets every two weeks to discuss: 1) how to eliminate organizational “silos” between existing USDA programs to support KYF2 mission through enhanced collaboration, and 2) how to align existing departmental activities/resources and “break down structural barriers” that inhibit local food system development. This coordinated effort demonstrates the need for a shift in the food system to support our producers and provide healthy food for consumers.
26 Food Hubs: Central Puget Sound Food System Assessment. Regional Food Policy Council and University of Washington. June 2011.
Figure 3.1 Food System Supply Chain 11

| 37
Both the USDA and the National Good Food Network (NGFN) estimate that there are just over 100 food hubs across the United States. The total numbers vary according to the definition of a food hub. The USDA defines a food hub as a centrally located facility with a business management structure facilitating the aggregation, storage, processing, distribution, and/or marketing of locally/regionally produced food products while the NGFN defines a food hub as a business or organization that actively manages the aggregation, distribution, and marketing of source‐identified food products primarily from local and regional producers to strengthen their ability to satisfy wholesale, retail, and institutional demand. According to the USDA, there are five food hubs in the Pacific Northwest (OR‐2 and WA‐3); according to the NGFN, there are six in the Pacific Northwest (OR‐2; WA‐3; and ID‐1). The two located in Oregon include Organically Grown in Eugene and Country Natural Beef in Vale. A few food hubs that are closely related to the needs of Central Oregon in terms of population, geography, growing climate, and processing and storage needs include: Idaho Bounty, Intervale Food Hub and Mad River Food Hub.
Idaho – Idaho’s Bounty (www.idahosbounty.org) is a cooperative serving as a virtual food hub. The target audience is a rural and urban population (Boise, Stanley, Ketchum, Hailey, Buhl and Twin Falls). The pick‐up and deliver goods from farmers to retailers within a 445 mile loop. Vermont – Intervale Food Hub (www.intervalefoodhub.com) is a multi‐farm Community Supported Agriculture (CSA) program in Vermont, which also facilitates farm connections to wholesale buyers including retailers, restaurants and institutions in the Burlington metro area (see case studies) Vermont – Mad River Food Hub (wwwmadriverfoodhub.com) is a fully equipped licensed vegetable and meat processing facility. Although they do not pick‐up and drop off local food, they provide a 4,000 sq. foot space for meat, vegetable and herb processing rooms, a smoke room, industrial size freezer/cooler and dry storage. This business serves the rural area of Waitsfield, Vermont.
Opportunities & Benefits
According to the USDA, the benefits of a food hub are plentiful and include expanded market opportunities for agricultural producers as well as value‐added products; job creation, especially in rural communities; increased access to healthy local food; and farm services and education.27 A study conducted at the University of Vermont on the Intervale Food Hub showed that aggregation of resources, such as materials, storage, distribution and even capital and expertise, can decrease agricultural producer overhead costs and increase profitability allowing farmers to “scale up” by
27 USDA Agriculture Marketing Service
Figure 1.2 National Good Food Network Map of Food Hubs in the US

| 38
combining products28. Furthermore, collaboration helps to reduce barriers to direct purchasing of products while preserving farm identity and traceability.
For a farmer looking to enter the market and increase farm profitability, a hub could provide a space to aggregate products with other farmers, provide cold storage, or a place to cut and clean vegetables before distributing them to restaurants. For a distributor, a food hub would provide one place to pick‐up goods to be delivered to multiple markets. For a food business owner, working with one point of contact about product deliveries, quantity and available would increase efficiencies and provide direct feedback to the producers. Other benefits include:
Economic Stimulus: Food hubs promote economic development opportunities for agricultural and value‐added producers and food businesses by increasing access to new retail and wholesale markets and providing infrastructure needs. Improved efficiencies among farmers create a competitive advantage. Food hubs also provide and sustain employment opportunities within management, operations, sales, facilities, production, warehousing and distribution. 29
Decreased Food Miles & Environmental Impact: Food miles refer to the distance food travels from the farm to plate. Transportation accounts for 14% of the energy used within the food system30 (30% is in home refrigeration/preparation, 20% in agricultural production and the rest is processing, packaging, restaurant and retail). Studies estimate that food in general travels over 1300 miles, and fresh produce over 1500 miles before it is consumed. With de‐centralization of the food industry model, fresh products can travel less than 100 miles and have increased freshness by the time they reach the consumer. Decreasing the total distance a product travels will have a large, positive, impact on the environment. 31
Policy: The food system is not complete without input from policymakers. An integrated food system will rely on organizations to assist with understanding policies and education to provide information to those affected or affecting barriers and solutions to land use policies. Involvement by local city and county governments can assist by investing in the future of the food system through policy decisions. Furthermore, government can invest in financial and regulatory means as support.
Improved Health: According to the USDA, more than two‐thirds of food hubs in the United States focus on increasing access to affordable healthy foods. Through support from the Women, Infants and Children (WIC) program, Supplemental Nutrition Assistance Program (SNAP) and Senior Vouchers, options for paying for foods will increase access. Food hubs can provide a consumer outlet as well as access point for local food banks.
Value & Supply Chain: Another valuable asset to a food hub is that it is part of the “value chain” versus the “supply chain”. In a value chain, raw products are the input and value is added through
28 Schmidt, M., Kolodinsky, J., DeSisto, T., and Conte, F. Increasing farm income and local food access: A case study of a collaborative aggregation, marketing and distribution strategy that links farmers to markets. Journal of Agriculture, Food Systems, and Community Development. Spring‐Summer 2011. 29 Regional Food Policy Council: Puget Sound. Food Hubs: Central Puget Sound Food Assessment. University of Washington. 2011 30 Heller and Keoleian. Life Cycle‐Based Sustainability Indicators for Assessment of the U.S.Food System. 2000. 31 Holly Hill. Food Miles: Background and Marketing. National Sustainable Agriculture Information Service. 2008.

| 39
a series of processes with the final product being the value of all the independent processes. The differences are as follows:
Supply Chain Value Chain ‐ Transaction or cash‐flow based ‐ Relationship or collaboration based ‐ Short term time frame ‐ Long term time frame ‐ Commodity (suppliers are interchangeable) ‐ Highly differentiated (source identified) products ‐ Communication only with next step of chain ‐ Communication/transparency throughout the chain ‐ “Each person for themselves” attitude ‐ “We are in this together” attitude
A value chain provides communication and transparency between sellers and buyers whereby the buyer can coordinate and project the next season’s needs based on sales figures. Projected crop demands and target prices allow producer to pre‐order crop volumes. This also allows for producers to identify niche products to grow and collectively order. Planting schedules and business planning can be solidified and ensure a more consistent supply of products. 32
Ownership Structure
Food hub ownership models are highly variable and often dependant on the initial investment from the community. For example, a strong producer cooperative may drive the type of ownership whereas if a community lacks a significant cohesion from producers or consumers, a non‐profit or a public entity may begin the process and determine the type of ownership including: non‐profit, producer/entrepreneur, public, wholesale/retail, cooperative, and virtual (see pg. 46). Because the success of a food hub is dependent on financial stability and buy‐in from the community, the foundations for ownership models should be based on existing infrastructure and businesses in the community. Based on the research presented thus far in this study, below is an overview of the ownership models currently under consideration as well as critical considerations associated with each of the models.
Private Corporation A for‐profit venture’s primary function is to generate profit for its owners and shareholders. There are several business entity choices for a for‐profit:
Sole Proprietorship: Business owned and operated by one individual
Partnerships: An association of two or more people who co‐own and are personally liable for the company obligations. Limited Liability Companies (LLC) are partnership in which partners are personally shielded from company obligations
Corporation: Consist of shareholders who finance and own the business, and who elect a board of director to govern the business. S‐Corporations and Close Corporations are two common examples.
B‐Corporations: B‐Corps are a new type of corporation, which uses the power of business to solve social and environmental problems. B Corporations' performance standards enable consumers to support businesses that align with their values, investors to drive capital to higher impact investments, and governments and multinational corporations to implement sustainable procurement policies.
32 Food Hubs: Viable Regional Distribution Solutions. Presented at the Sustainable Agriculture & Food Systems Forum, June 22, 2011.

| 40
Private corporations can more easily attract investors to fund the high start‐up costs. Business owners and stakeholders may also pursue business strategies that generate more profits for all stakeholders – owners, staff and producers.
Considerations: For‐profit companies are ineligible for most grants, which generally help to fund start‐up costs, and subject to high corporate tax rates.
Public‐Private Entity Public entities are often interested in sustainable development of the economy and job creation. Intertwining this with the agriculture sector could provide start‐up costs for infrastructure and economic development (including land, building and equipment) through public ownership and oversight and management through a private company.
Considerations: A local public entity must be invested in the local food system and the positive impacts of the food system on economic development. This type of relationship may be more likely to withstand price fluctuations and less than optimal profitability. However, public funding is often at the whim of the federal government budget and fiscal politics.
Entrepreneur/Consumer Cooperative Cooperatives can be producer or consumer driven but are based on exclusive ownership by the members. The profits are distributed to the members based on the amount of usage. Hybrid cooperatives exist in which membership may include non‐users. Cooperatives elect a board of directors and make major decisions through democratic voting. Funding structures can include 1) direct contribution through membership fees or stock purchases, 2) agreements to withhold a portion of net earnings, and 3) assessments based on the units of products purchased or sold.
Considerations: One of the advantages of a cooperative is that is driven by the members, which can be agricultural producers. This model provides support from other members and more oversight with the project. Members create buy‐in and a critical mass, but this may also limit the decision making processes such as marketing, operations and financial decisions. Funding is a bit more difficult as cooperatives are not as easily able to generate capital to invest in infrastructure and are not typically eligible for federal and/or state grants. The collaborative process may be helpful or a hindrance, depending on the dynamics of the participants.

| 41
Table 3.1 Overview of Business Models: Benefits and Risks
Model Type Explanation Benefits Risks Examples
Non-Profit
Hubs that are created and maintained by non-profit organizations to facilitate farmer to consumer transactions.
More likely to attain grant funding More likely to focus on community development
aspects of the food system (e.g. needs of low-income or agricultural producers
May not have the business or technical background necessary to create a viable operation
Once seed funding has exhausted it may be difficult to stay viable
May not have seed funding
Intervale Center Food Hub (VT), Appalachian Sustainable Development (VA)
Producer / Entrepreneur
Primary impetus is from farmers or others working in the food system. Focus is on providing distribution and processing outlets for producers.
More like to have adequate business/technical background
More likely to have solid knowledge of local food system
Like to feel a high level of “investment” in the success of the hub because of personal commitment
May not have necessary seed funding Okanogan Producers Marketing Association
Public
Potentially more stable if a steady flow of funding is secured
Coordination with other relevant government agencies may lessen “red tape”
Local government has a vested interest in stimulating the local food economy
With shrinking budgets, securing support/funding may be difficult
May not have relationships with various stakeholders (farmers, distributors, processors etc.)
Many “State Farmers Markets” in the Southeast and Midwest
Wholesale/ Retail
The main revenue source for the hub is retail shopping.
More likely to have business savvy and existing connection to consumers and producers
May have existing infrastructure
Governance structure can vary dramatically (e.g. administration)
Cooperative Cooperative food hubs are generally organized by a producers or consumers.
Reflects existing consumer demand Often a way to connect consumers and producers
with limited use of a “middle-man”
May have limited infrastructure May not have necessary business/agriculture background
necessary to initiate operate a business Will need to identify who will be responsible for coordination May not have relationships with stakeholders
Oklahoma Food Coop
Virtual
Food hubs where local individuals and businesses can exchange services and goods directly through an online service.
No (or minimal) new infrastructure costs Large amounts of information available online Can connect producers and buyers in real time and
in a way that can be tracked
Non-transparent governance with limited connection with various stakeholders
Food Hub (OR)
USDA, and Context Matters: Visioning a food hub in Yolo and Solano Counties. University of California, Davis. June 2011

| 42
Business Risks
The foundation of a food hub should focus on financial stability and buy‐in from the community. The largest barrier and greatest risk for food buyers is to engage with producers to meet the needs for consistent quantity and products to meet demand and the price point for local producers and consumers. This is an inherent challenge with local food products and could be mitigated through aggregation and economies of scale. In a food hub feasibility study conducted for Southern Wisconsin, the following strategies were suggested: 33
Emphasize a strong relationship with growers. Open communication will help to create trusting relationships with buyers about consistencies in the products. This is important for the first few years of the operation.
Build a base of business with the highest end customers. Even though this may not be the most ideal situation, larger volume will allow for less price fluctuations. High end customers include restaurants, resorts, and specialty grocers. Institutions could fit into this category because they would draw a large volume of product, but they are more sensitive to price fluctuations.
Make it a win for growers even if unprofitable at first. Though this is not the most logical or smart business move, a food hub will not work unless there is a supply of local food. Decreasing the barrier to entry for producers is necessary to get buy‐in even if it cuts into gross profit margins.
Establish a wide network of growers in order to meet the demands of the community. Having a core group of dedicated growers that participate in crop planning is essential, while cultivating relationships with a broader range of producers will help to fill in the missing gaps based on unplanned events that affect supply (such as drought). Flexible relationships with a core group will help to build a strong foundation as the business expands.
Collaborate with other intermediaries and partners to strengthen the market. Although there may be competitors in the local food market, having an understanding of the available markets and programs will help to determine niche marketing areas and establish cooperative relationships. Intermediaries could also become customers, or vice versa, and provide a means of filling gaps in the food system.
Secure a management team with experience in marketing and sales. In order to market the products a manager will need to have expertise in marketing as well as sales of specialty/niche products. Producers will need assistance with marketing their products and understanding the importance of having a set price for a certain product. Again, this is about establishing a trust relationship. Other aspects of the food hub, such as distribution and transportation logistics may be outsourced until the operating model is secured.
Make it easy for customers to do business with the food hub. Most food business customers don’t have time to fiddle with price fluctuations and seasonality of foods. Even though there is a recognized advantage of producing local foods, the process needs to be simple. Having one contact person to provide a current list of products and to order from is essential.
33 2011. Southern Wisconsin Food Hub Feasibility Study. FamilyFarmed.org, Dane County UW Extension, UW Extension and WI DATCP

| 43
Services Provided
Core Services
The type of core services offered at a food hub depends on the chosen model. A packing house, or a full service food hub, defined as a facility that handles raw produce immediately after harvest and prepares it for delivery to customers, includes all the major components of a food hub (aggregation, processing, washing, grading and sorting), storage, re‐packaging, sales, marketing and distribution. Another option could include an aggregation facility, which can include aggregating, storage, sales and marketing with distribution included or outsourced. Distribution and transportation of food products are core services but may or may not be included in the operating model depending on whether or not they are outsourced.
Core services require a limited management or operating team. Key positions include:
General Manager oversees the operation and financial functions of the company. The Manager will actively buy or sell food products and would be involved with every process at the food hub. Bookkeeping can either be included or outsources but needs to be a consideration with overhead costs.
Salesperson/Buyer interacts with the products, meets with buyers, and negotiates transactions to meet sales targets. This position could be split into buying, sales and customer service at a future point.
Warehouse Manager oversees receiving, inspections, packaging, order processing, shipping and logistics. This person is responsible for what happens on the floor of the food hub and is responsible for food safety and quality and warehouse management.
Ancillary services
The term “food hub” implies a fully integrated system, however, services such as processing (including value added), distribution, transportation and marketing are not essential to the food hub model but provide support and potentially income. Ancillary services could include:
Processing facilities can include a variety of services including co‐packing (assembly and packaging), which could include washing and cutting, packaging, or value added processing which includes using a commercial kitchen.
Commercial kitchens could be used for producers to add value to their products but could also be used to generate a funding stream when used by non‐agriculturalists. For example, a fully equipped kitchen could be used by a backer for pastries or catering. These kitchens could also be used to facilitate cooking, canning or preservation classes.
Marketing of aggregated products or private labels
Waste programs can assist with the waste cycle and may include composting or grey water management.

| 44
Technical Assistance such as marketing services, merchandising (individual packaging) and educational programs could assist producers. Financial and legal support could be provided through workshop or courses. A mentor program could also be created to help new or beginning producers.
Regulator Certifications could include food handling are certifications such as Good Agricultural Practices (GAP) and Good Handling Practices (GHP). GAP includes agricultural or operational procedures that minimize contamination of food products on the farm or in a packing house. GHP includes post‐harvest handling of food products such as a food safety plan for safety procedures, food product transportation practices and worker health and hygiene. Additional regulatory certification could include Hazard Analysis Critical Control Point, organic certification, proper handling and storage of dairy, poultry and livestock.
Other services could include: event space, culinary education, recipe development, and business development
Facility and Location
The location of the facility depends on: the proximity to supply, the size of the facility, the services offered and the clientele (for both supply and demand).
Supply: To minimize transportation time and expenses, the food hub should be located near major transportation routes and as close to the customer base or supply. Depending on the system, if a strong customer base exists with existing infrastructure, this may justify placing the hub nearer to the customer and further from the supply. The facility will need access to a water supply and ample room for delivery trucks.
Size: The size of the facility should be scaled to the type of services offered with the ability to expand if the opportunity arises. An approximate guideline is 5 square feet per acre, so a 15,000 square foot facility could handle the yield of 3,000 acres.34
Services: The chosen services should reflect both the need of the community but also be reasonable given the amount of start‐up costs.
Clientele: Should pull from a strong base of producers, especially those that have expressed the need for a food hub. Consumers should include existing food businesses and high end clients or clients interested in moving large volumes of food.
Finance and Revenue Options
Grants and loans are the most likely funding sources for starting, maintaining and/or renovating a food hub facility. The most difficult aspect of funding a food hub is the capital start‐up costs. Working capital can be covered through grants for the first few years but will not be sustainable in the long‐term.
A revenue model is a method of generating income through a number of different profit centers and is dependent on the services provided by the facility. Profit centers could include: aggregation and packaging, markets and sales, and distribution; however, some of these center could also be provided by
34 FamilyFarmed.org Ready to Grow: A Plan for Increasing Illinois Fruit and Vegetable Production. Action Plan and Feasibility Study for the Illinois Department of Agriculture, Oak Park: FamilyFarmed.org, 2010, 30.

| 45
third parties. The aggregation and packaging of goods is a service provided that could include a flat fee or a profit margin from the producer. The marketing and sales service could be based on commission or direct purchase. With a commission, the food hub facilitates the sale of the items but does not purchase them from the producer; commissions range from 5‐20%. Direct purchases mean that the hub buys the product and turns around and sells the product to a customer thereby generating a profit margin that ranges from 18%‐20% or greater. The distribution services both pick‐up and delivers the goods from the farm to the customer, whether that is the hub or direct to a customer. Delivery fees are either passed off to the farmer or can be passed off to the customer (see Appendix D for a list of funding options). 33
Typology of a Food Hub
In an effort to gauge the scale of food hubs throughout the United States, the USDA Regional Food Hub Collaboration published a survey in early 2011. The survey was sent to 72 food hubs and 32 public markets, 45 were completed and returned. The goal of the study was to identify existing food hubs, and spur a “national conversation” on how to develop viable local and regional food systems and stimulate new economic opportunities. The study found the following commonalities:
General Organization Operations
• Majority are located in the Eastern US
• Operating an average of 5 years, with a range of 1-37 years
• Start up costs: in-kind donations, membership fees, and foundation funding
• 60% received government funding to begin operations
• Current funding sources: service fees, membership, and foundation funding
• Primarily established by entrepreneurs
• 64% are non-profit/public collaborations
• Average annual gross sales: $3.7 million (median $700,000)
• For those grossing <$3M, average is $871,000 (median $580,000)
• 40% have 1-5 full-time employees
• 29% have zero employees
• Food: fresh produce, eggs and meat
• Buyers: restaurants, grocers and co-ops
• Services: distribution , aggregation and wholesale
• Community Services: education, distribution and employment
• Producer Services: marketing, transportation and market development
• 50% have recycling • 45% have composting
According to the USDA, the archetypical Food Hub would be: operating for five years with strong producer engagement and participation in both the establishment and operations of the food hub services/activities; a socially driven business enterprise with a strong emphasis on “good prices” for producers and “good food” for consumers; employsix full‐time or part‐time staff and uses volunteers regularly; and work with 40 regular food suppliers, many of whom are small and mid‐sized farmers and ranchers.
Conclusion
According to the USDA, the archetypical food hub has been operating for five years with a strong producer engagement and participation in both the establishment and operations of the food hub services/activities. It is a socially driven enterprise with an emphasis on fair prices and good food and built upon a value chain model (which is relationship based with a long‐term time frame, highly differentiated products and clear communication and transparency). Unlike the typical supply chain, a value chain provides a feedback loop between producers and buyers instead of responding to market
| 46
demands. The benefits are plentiful and include expanded market opportunities; job creation; increased access to healthy food; and service and educational opportunities.
Food hub ownership models are highly variable and often dependant on the initial investment from the community. Financial stability should focus on risk reduction while meeting the capacity and price point needs for sellers and buyers. Inherent issues could be mitigated through a collaborative approach, which focuses on economies of scale and meeting the specific service needs of the community. Initial research shows that a public‐private partnership model, which could be a good fit for Central Oregon, will provide a collaborative approach while reducing risk for all parties involved in the process.
A main consideration with a public‐private partnership is establishing funding streams that are not dependant on a one‐time infusion of cash through applicable grant program. Potential funding sources and identified needs in Central Oregon include aggregation, small processing, storage, and access to a commercial kitchen. Each of these services could provide potential revenue and employment opportunities. Building upon existing models for these services will be key to the development of a program. Section 4 will focus on relevant case studies.
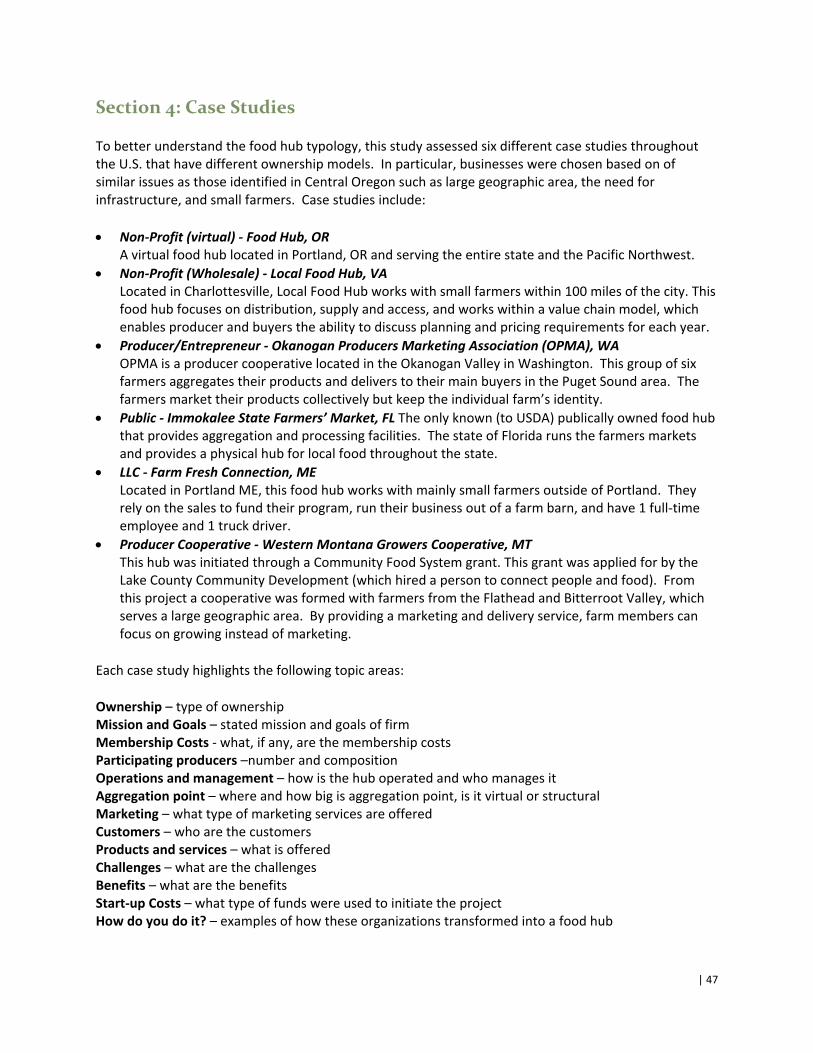
| 47
Section 4: Case Studies
To better understand the food hub typology, this study assessed six different case studies throughout the U.S. that have different ownership models. In particular, businesses were chosen based on of similar issues as those identified in Central Oregon such as large geographic area, the need for infrastructure, and small farmers. Case studies include:
Non‐Profit (virtual) ‐ Food Hub, OR A virtual food hub located in Portland, OR and serving the entire state and the Pacific Northwest.
Non‐Profit (Wholesale) ‐ Local Food Hub, VA Located in Charlottesville, Local Food Hub works with small farmers within 100 miles of the city. This food hub focuses on distribution, supply and access, and works within a value chain model, which enables producer and buyers the ability to discuss planning and pricing requirements for each year.
Producer/Entrepreneur ‐ Okanogan Producers Marketing Association (OPMA), WA OPMA is a producer cooperative located in the Okanogan Valley in Washington. This group of six farmers aggregates their products and delivers to their main buyers in the Puget Sound area. The farmers market their products collectively but keep the individual farm’s identity.
Public ‐ Immokalee State Farmers’ Market, FL The only known (to USDA) publically owned food hub that provides aggregation and processing facilities. The state of Florida runs the farmers markets and provides a physical hub for local food throughout the state.
LLC ‐ Farm Fresh Connection, ME Located in Portland ME, this food hub works with mainly small farmers outside of Portland. They rely on the sales to fund their program, run their business out of a farm barn, and have 1 full‐time employee and 1 truck driver.
Producer Cooperative ‐ Western Montana Growers Cooperative, MT This hub was initiated through a Community Food System grant. This grant was applied for by the Lake County Community Development (which hired a person to connect people and food). From this project a cooperative was formed with farmers from the Flathead and Bitterroot Valley, which serves a large geographic area. By providing a marketing and delivery service, farm members can focus on growing instead of marketing.
Each case study highlights the following topic areas:
Ownership – type of ownership Mission and Goals – stated mission and goals of firm Membership Costs ‐ what, if any, are the membership costs Participating producers –number and composition Operations and management – how is the hub operated and who manages it Aggregation point – where and how big is aggregation point, is it virtual or structural Marketing – what type of marketing services are offered Customers – who are the customers Products and services – what is offered Challenges – what are the challenges Benefits – what are the benefits Start‐up Costs – what type of funds were used to initiate the project How do you do it? – examples of how these organizations transformed into a food hub

| 48
FoodHub, Portland OR
Name FoodHub Location Based in Portland, Oregon; covers six states: OR, WA, ID, MT, AK, CA Ownership Entity Non-profit, Ecotrust Mission and Goals
FoodHub is a dynamic marketplace and online directory that makes it easy and efficient for wholesale food buyers and local sellers to find each other, connect and do business. Large or small, organic or conventional, direct or distributed – FoodHub’s transparent marketplace makes it easy for wholesale food buyers to find local producers that meet their sourcing criteria.
Membership Costs
Free; upgrade memberships available to sellers and industry suppliers
Participating Producers
Thousands of organic and conventional sellers: farmers, ranchers, fisherman, dairies, brewers, distilleries, wineries, processors, manufacturers, broker and distributors.
Operations and Management
FoodHub is a virtual marketplace and is operated solely online. Sellers and wholesale buyers connect online and either self-distribute or use their established distributors. Distributers and industry suppliers may also join FoodHub and can provide or coordinate transportation. Once a seller and buyer connect, they independently coordinate the transaction.
Aggregation Point
Virtual. Foodhub offers an online match platform where members create profiles. The online service provides an easy to use, searchable directory.
Marketing There is no label associated with FoodHub. Members maintain their own brand by direct selling to wholesale buyers or distributors.
Customers Buyers, sellers, distributors and associates* (no individuals). “Associates” refers to all the companies and organizations vital to building a regional food economy, but not buying or selling food directly – NGOs, certifiers, media, industry suppliers, trade associations, etc.
Products and Services
Baked goods, beverages, condiments, dairy, fruit, grain & beans, herbs & spices, meat, nuts & seeds, poultry, seafood, specialty, vegetables and eggs.
Challenges Primary activity (and success!) by a minority of total membership; no clear reporting on number, quality or economic value of connections made via the site/community; profile completion/maintenance; overall membership growth.
Benefits FoodHub is a network of professional food buyers, local food producers, wholesale distributors, and a robust community of associates that includes food and agriculture industry suppliers, farmers’ markets, media and trade associations. For chefs, restaurateurs and food service directors, FoodHub means fast foraging – find regionally-produced products quickly and easily, get background on producers and make contact with the click of a button. For farmers, ranchers, fishermen, distributors and dairies, FoodHub promotes products to professional food buyers interested in sourcing from within the region. For associates, FoodHub provides a platform for engaging with the local food community of practice and an easy way to connect with producers and other potential partners.
Start-up Costs Almost $2M total in hard costs and staff time over almost four years; funded by a broad spectrum of partners How do you do it?
Join free at www.food-hub.org; fill out your profile and start posting to the FoodHub Marketplace.

| 49
Local Food Hub, Charlottesville, VA
Name Local Food Hub Location Charlottesville, Virginia Ownership Entity Non-profit Mission and Goals
Local Food Hub is a nonprofit organization working to strengthen and secure the future of a healthy regional food supply by providing small farmers with concrete services that support their economic vitality and promote stewardship of the land.
Membership Costs
Free to producers. A partnership agreement is necessary and submission of a water test for food safety policies.
Participating Producers
70+ small family farms within 100 miles of Charlottesville. Most are less than 100 acres, family-owned, sustainable
Operations and Management
8 full-time and two part-time employees operate Local Food Hub
Aggregation Point
3,800 square foot warehouse
Marketing Food is always clearly labeled with the farm of origin, so partner producers’ name, brand, and image remains strong and focused. Local Food Hub provides a variety of marketing and sales services, including web profiles and photographs, point of sale materials, and media exposure for our farmers. Each farm receives an annual farm visit, write up, and photo session.
Customers 150+ businesses, public schools, hospitals, institutions, restaurants and markets. This does not include individuals
Products and Services
Fruits, vegetables, eggs, meat, and value-added products; pre-season production planning for farmers, purchase planning for buyers; centralized marketing, sales, and distribution of locally grown produce and products; and educational opportunities for partner producers including workshops, networking, and on-farm consulting
Challenges Demand for local food outstrips supply. We need more farmers! Benefits Small, family farms now have access to large, consistent, wholesale markets; aggregation, distribution, and
marketing services saves farmers time and money; farmers that participate with Local Food Hub typically receive 80-90% of the purchase price of their food (as compared to the USDA-reported average of 15.8%); increased economic opportunity for small and mid-sized farms; increased community access to local food at grocery stores, restaurants, hospitals, and public schools; increased access to healthy food in low-income neighborhoods; rural and urban economic development; retaining and creating agricultural jobs; protection of farmland; development of new farmers; increased use of sustainable growing practices due to educational resources and consulting; and better food safety through traceability and GAP certification
Start-up costs and funding
July 2009, $300,000. Funding from county economic development, local foundations, individual donations, and in-kind contributions
How do you do it?
Distribution: Local food warehouse where local food produce is purchased and aggregated from more than 70 small family farms within 100 miles of Charlottesville. This is distributed to more than 150 locations in our region, including public schools, hospitals, institutions, restaurants and markets. Supply: By saving farmers time and money they are enabled to focus on farming and expanding production. Educational programs, including workshops, farm apprenticeships, and high-school internships are designed to inspire and train the next generation of farmers, producers and local food advocates. Access: Local Food Hub believes everyone deserves equal access to healthy food grown in the community. By creating “one number to call” for local food, they enable public schools, hospitals and retailers to easily purchase local food in large quantities, and build partnerships to get fresh, delicious food into neighborhoods that need it.

| 50
Farm Fresh Connection, Portland ME
Name Farm Fresh Connection Location Portland, Maine Ownership Entity LLC Mission and Goals
Farm Fresh Connection (FFC) was created to diversify markets accessible to Maine Farmers; to focus on building a local food system; to provide access to food grown by our neighbors; and to feed Maine citizens fresh, nutritious, healthy food. Farm Fresh Connection builds relationships among Maine farmers, students, food buyers in health and educational institutions and local communities.
Membership Costs
None
Participating Producers
Works with over 60 producers that farm 3 - 1,000 acres. Farm Fresh buys mostly from these “mid-size” producers and sells to over 150 establishments
Operations and Management
FFC drives within a 60 mile radius of the warehouse, but the bulk of our deliveries are centered in Portland, Maine. They own their own truck and employ one driver. Business is done Monday through Saturday. Occasionally they will hire an outside company to bring produce to us from way up in Northern Maine.
Aggregation Point
32x48 barn which is 1/3 farm store, and 2/3 storage with a loading dock off the back. They also own 3 chest freezers, a homemade walk-in cooler 14x20, and 2 pallet jacks
Marketing FFC markets to local institutions. Customers retail, restaurants, schools, CSA's, farmstands, distribution and processing operations. Products and Services
Vegetables, fruit, foraged goodies, cheese, meats, eggs, honey, maple syrup, dry beans, flour and grains
Challenges Gaining the confidence of producers and institutions that projections can be met; adequate volume can be achieved only if confidence in FFC performance is adequate. Building an appropriately efficient assembling and distribution system represents a third major challenge. Achieving distribution efficiency with relatively low volumes is a challenge that FFC shares with most similar projects. A major FFC challenge is to match the price points of institutions with those of local producers. While this can be quite easily accomplished with a few specialty products, matching enough supplies to provide volumes necessary to achieve self-sufficiency is challenging.
Benefits It is anticipated that mid-sized farms that can capture some economies of scale will provide most of the supply to institutions while restaurant accounts that use smaller volumes will likely be the better option for smaller volume producers.
Start-up Costs MESAS adopted the program and provided necessary administrative support through its association with the University of Maine. Common Good Ventures (CGV), a local venture philanthropic organization that provides business coaching assistance to nonprofit entities through partnership arrangements, accepted FFC as a partner. Third, FFC secured the services of a full time operations director who was committed to the project. The project was launched with a $30,000 initial commitment from CGV followed by a USDA Value Added Development grant of $108,000. The warehouse was initally operated in Portland, and relied on pallet space in other companies’ trucks. Now, they own a warehouse facility, refrigeration, and purchase a larger box truck that holds pallets. Currently, they do not have any membership fees, all revenues comes from sales.
How do you do it?
FFC was conceived by a dairy farmer who believed that local institutions could offer more marketing opportunities for farmers to develop/diversify into higher value production options. A business plan indicated that, after a start-up period, there was adequate food purchased by four institutions in central Maine with preference for local foods to pay for a brokering function with margins that would be reasonable for the institutions and for local farmers and producers. MESAS is the overarching non-profit with a mission to promote sustainable agriculture in Maine. FFC benefits critically from the partnership arrangement with CGV, which provides strategic and business consulting services on a regular basis. Initially capitalized by CVG and a larger government grant, FFC is moving toward self-sufficiency from operating funds.
Okanogan Producers Marketing Association, Okanogan, WA
Name Okanogan Producers Marketing Association Location Okanogan, Washington

| 51
Ownership Entity Producer owned and operated Mission and Goals
OPMA works together to share resources, equipment, knowledge, expertise, marketing and sales. OPMA farms grow and market Washington State Department of Agriculture Certified Organic as well as Integrated Pest Management and Transitional fruits and garden vegetables.
Membership Costs
None
Participating Producers
6 farms
Operations and Management
Hired a producer from within the cooperative of farmers, to run OPMA. Farmers offer their goods collectively by bundling nearly 100 crops together and having one point of contact person for the group. They share resources, equipment, expertise, marketing and sales
Aggregation Point
One facility, one truck
Marketing One label with each farm listed. Customers Consumers across Washington to Puget Sound urban area Products and Services
Fruits and Vegetables
Challenges Concentrated on niche products that urban consumers want and can’t get locally. They are isolated in the Okanogan Valley far from markets. Because of this, they travel long distances to large population centers.
Benefits One of the biggest advantages of direct marketing is that the farmer gets to participate in setting the prices for the crops they grow. Without the packing sheds and distributors working as middlemen, the farmers get to negotiate with each vendor they work with. They can demand an amount that reflects the amount of labor and inputs that go into each crop and accounts for unforeseen weather and crop problems. Crop prices are negotiated every winter with the farmers, and together they decide on the wholesale prices for each crop. Sometimes the prices change mid-season depending on crop failure or success. Since the Co-op is buying produce directly from the farmers, we can ensure that a fair price is paid for each crop offered in our stores.
Start-up Costs 2006. Funds were provided by Washington State Small Farm and Direct Marketing money and the Blooming Prairie Foundation.
How do you do it?
Work together as price makers instead of price takers. In 2005 the group formed a cooperative. With support from the NW Cooperative Development Center, the group formed their by-laws. The group decided that the first farmers that were growing a particular product would get priority for selling the good. All the farms are on one invoice for the retailers. They rented a facility and began aggregating their products. Each retailer was given a colored dot and these were places on the product boxes to be shipped out. The product was transported by the farmers. In the first year they saved 2 family farms.

| 52
Western Montana Growers Cooperative, Arlee, MT
Name Coop Western Montana Growers Cooperative Location Arlee, Montana Ownership Entity Grower Cooperative Mission and Goals The Western Montana Growers Cooperative (WMGC) is a coalition of growers in the Flathead, Jocko,
Mission and Bitterroot Valleys whose goal is to provide the market in our region with fresh, quality products from our farms.
Membership Costs $100 Annual Participating Producers
Over 30
Operations and Management
Five employees take care of day to day management, sales, marketing, bookkeeping, warehousing, and distribution with oversight from a Board of Directors consisting of 7 farmer/owners.
Aggregation Point Three remote “drop points” at located at volunteer farms with a central hub in Arlee. Marketing Farmers maintain ownership and the identity of their product throughout the process but a Cooperative
label is used to identify the product, farm, date, weight, etc. The WMGC website and weekly mailing lists highlight the farms and farmers as well as their products. WMGC also develops point of purchase material for products. Sales are mostly done via traditional phone transactions, but customers also have the option to use our online order system.
Customers Retail stores including small health food stores and large chain-type stores, restaurants, institutions such as Universities and public schools, buying clubs, and individuals.
Products and Services
To our customers WMGC offers a “full plate” of products all produced in MT including fresh fruits and vegetables, eggs, dairy, beef, lamb, chicken, grains and pulse crops, flowers, and processed products. Customers are able to access products from over 30 farms with a single transaction. We also offer a multi-farm CSA service to individuals. To our owner/members we offer a comprehensive marketing a distribution service that allows producers to concentrate on producing instead of dealing with the wholesale marketplace.
Challenges Raising capital for infrastructure improvements. Distributing food in a state such as Montana with spread out and relatively small population centers. Increasing competition from other producers. Maintaining quality standards from products sourced at many different farms.
Benefits Unique service in Montana. Widespread support from Food Academics. Experience from operating into our tenth year. Support from our members who realize the value of the services the Coop provides.
Start-up costs 2002. Through a Community Food Systems grant, Lake County Community Development (LCCD) started working to find ways to get locally produced food to "local" people. The grant paid for one person's salary to take the lead on the project. A small group of farmers became involved and it was determined that a cooperatively owned marketing and delivery service, WMGC, would be a good tool.
How do you do it? WMGC grew out of this process and is entirely independent of LCCD. The co-operative was incorporated in early 2003 and started to sell member produce between Polson and Missoula that summer. In 2008, WMGC started providing the same products in a weekly delivery box to individual customers. We continue that service of Community Supported Agriculture (CSA) throughout Western Montana bringing our food directly to local members. By providing a marketing and delivery service, WMGC allows the farmer members to concentrate on producing great local food while making it more accessible to buyers. Our customers have access to all of our farms with one sales transaction and one delivery. Our farmers bring their goods to a central warehouse in Arlee at the end of the sales day. The truck is loaded and deliveries are made the next day – twice a week in the summer and once a week in the winter – ensuring that the produce is fresh and the service convenient for our customers.
Immokalee State Farmers’ Market, Florida
Name Immokalee State Farmers’ Markets

| 53
Location Florida Ownership Entity State Mission and Goals The mission of the State Farmers' Markets program is to assist in the marketing of farm products by
providing information, leadership and modern facilities necessary to move farm products from the farm to the consumer, thereby assuring the consumer a better quality product at a reasonable price and a fair return to the producer by providing a convenient, dependable place through which producers and buyers may carry on the process of marketing. The State Farmers' Market program is authorized by Chapter 570.07 (18), Florida Statutes, "to acquire suitable sites and erect thereon necessary marketing facilities and properly equip, maintain, and operate same for the handling of all staple field crops, meats, fruits and vegetables, poultry and dairy products, and all farm and home products and for selling and loading livestock and other activities determined to be beneficial to the production or sale of agricultural products and to let or lease space therein and thereon; employ such managers and other help as may be necessary to operate the plants and the costs of operation and maintenance."
Membership Costs Non-profit/retailer $0; producer/broker $50; licensed seafood producer pre-paid; shipper/packer/repacker/processor (0 - $1 million packages) $50; and foliage shipper/packer/repacker ($0 - $1 million in sales) $50
Participating Producers
As a participant you will benefit from this multimedia advertising campaign. By placing FAPC logos on your products and packaging, consumers can easily identify and purchase Florida-grown products. As a member, you will: 1) have access to the logos to use on products, packaging and promotional items; 2) be listed on the website; 3) receive graphic assistance as requested; 4( tie-in to supermarket commodity promotions when retailers promote Florida agricultural products in newspaper and store circular advertisements; 5) have the opportunity to participate in industry trade events at a reduced cost; 6) receive commodity-specific and generic promotional point-of-purchase and customized signage with your business name; and 6) receive "Fresh from Florida," the FAPC promotional magazine.
Operations and Management
The Florida Department of Agriculture and Consumer Services operate a system of 13 State Farmers' Markets. These markets specialize in fresh Florida produce. More than 25 million units of fresh fruits and vegetables are annually sold through the markets.
Aggregation Point Facilities for rent at the Immokalee State Farmers’ Market: Warehouse, cooler, office, truck parking Marketing The Florida Agricultural Promotional Campaign (FAPC) is an identification and promotional program
designed to boost the image of Florida agriculture and increase sales by helping consumers easily identify Florida agricultural products. The multimedia campaign also helps increase public awareness of the importance of Florida agriculture, which has an overall economic impact estimated at more than $100 billion annually.
Customers Florida consumers Products and Services
State run farmers’ market; facilities available for rent at Immokalee State Farmers’ Market.
Challenges Not available Benefits Not available Start-up costs Not available How do you do it? Not available

| 54
Overview of Case Studies
Although each case study has a different ownership model, they all seek to provide greater access to markets for producers and their products. Their mission and goals are similar, to create a dynamic marketplace, strengthen the future of a healthy food supply, create and increase direct market accessibility and to assist farms. These shared values are not the only similarities for these case studies (see Table 4.2 for the Case Study Overview).
Table 4.1 General Case Study Findings
Topic Area Findings
Social and Community Giving
Many of these hubs are incorporating the triple bottom line into their business model, and asking the question, how can they make a profit while being conscious of social and ecological integrity? The common goal of improving food security is a holistic approach to providing access to healthy and sustainable food products. Many of these organizations provide community outreach and educational opportunities for people to learn about their business such as farm tours for school classes and accept Supplemental Nutrition Assistance Program (food stamps).
Participating Members
The case studies that were chosen were primarily small farmer focused. Every one of these hubs has individual farms participating whether or not their product is jointly labeled or individually labeled. Most of the farms are family-owned. Many of the members do not pay a fee but rather the costs are covered through a fee for service, in other words, passed off to the consumer.
Customer, Products and Marketing
In every example, fresh produce is distributed to direct market outlets such as grocers and restaurants; the majority of the hubs also include institutions. In every example, farmers maintain their product identity but in some cases label the products collectively.
Operations
All of these hubs operate within a value chain where information is relayed between the seller and the buyer. Except for the case of the virtual FoodHub, where all the transactions take place online, the food hubs work directly with the buyers and sellers. Infrastructure is the key piece that allows products to be aggregated and distributed. This inevitably saves time for the farmer and allows the buyer to deal with one distributor or point of contact.
Infrastructure Although infrastructure needs vary, each hub requires basic services including a warehouse to allow for aggregation and packaging. Additional features include freezer, walk-in cooler, truck, and office space.
Start-up Costs
Every hub required initial start-up costs outside of any finances that they could provide themselves. Funding opportunities accessed included: USDA Rural Business Opportunity Grant; USDA Rural Business Enterprise Grant; USDA Community Food System grant; County economic development monies; foundations; donations and in-kind; State Department of Agriculture grants; and/or financial partnership with a non-profit
General Challenges
Challenges vary depending on the facility and the needs of the producers. As with most start-up businesses the greatest challenge is finding funding for operations and infrastructure. Other challenges include: greater demand than supply; gaining the confidence of buyers that the projections can be met; building efficient assembly and distribution systems; long distance travel from rural areas to urban markets; raising capital for infrastructure improvements; and maintaining quality standards given different products.
General Benefits
Despite the continual search for operational and infrastructure funding, these hubs are able to find and maintain markets, match supply with demand, provide aggregation and distribution and overcome logistical obstacles. Other benefits include: ability to network with sellers and buyers; matching price points for food businesses; promotion of products; access to large, consistent wholesale marketing; farmers receive a fair price for their product; job creation; farmland protection; development of new farmers; education resources and consulting; better food safety and GAP certification; economies of scale for farmers; decreased middle man costs; and support from members.

| 55
Table 4.2 Six Case Studies Overview
Name/Location Operations Challenges Benefits Overview
Food Hub, Portland OR - Non-profit
Virtual marketplace is operated solely on-line for the Pacific Northwest
Buyer and seller have to connect to each other virtually
Rural producers are at a disadvantage due to infrastructure limitations, mainly distribution and transportation
Network of professional buyers, producers and distributors
Promotion of products by seller for buyer Instant information about product
availability and location
A dynamic marketplace providing Pacific Northwest growers and buyers access to fresh local food. Primarily supports markets with existing infrastructure. Initially supported by USDA RBOG grant.
Local Food Hub, Charlottesville, VA – Non-profit
Full and part-time employees operate the 3,800 square foot warehouse
Demand exceeds supply Need more farmers
Access to wholesale markets, aggregation, distribution and marketing services for producers
Increase community access to local food by food businesses and institutions
Increased access to food by low-income
Dedicated to working to connect farmers, food, and the community, they work with over 70 farms (mainly working on less than 100 acres) located within 100 miles of Charlottesville,VA. Start-up funding provided through grants, donations and in-kind work.
Okanogan Producers Marketing Asc., WA – Producer /Entrepreneur
Producer-run cooperative with one facility and one truck
Concentration on niche products Isolated from main market centers – travel is
extensive
Farmers are price makers, not price takers
No middleman Crop prices are negotiated every winter
among farmers Ensure fair prices for crops
Cooperative group of producers working together to collectively market their goods and increase efficiencies and economies of scale. Primary marketplaces are urban centers. Start-up provided by WA State Small Farm and Direct Marketing and a foundation grant.
Immokalee State Farmers’ Market, FL - Public
FL Dept. of Ag and Consumer Services operates a system of farmers’ markets
Not available (there is limited information on public food hubs)
Not available
The State of Florida Dept. of Agriculture is partnering with land grant universities to provide a comprehensive platform to foster producer/buyer relationships.
Farm Fresh Connection, ME - LLC
Established warehouse distribution with institutions and food businesses
Gaining confidence and trust of producers and institutions that volume can be met
Efficiencies of aggregation and distribution Determining price point
Quality products provided year-round, 5-days a week
Providing economic development opportunities for farmers
Easy access to availability list on website
Conceived by a dairy farmer, FFC now has over 50 members and serves multiple institutions. Initially partnering with a non-profit, FFC is moving toward self-sufficiency from operating funds.
Western MT Growers Co-op, MT - Producer Cooperative
Full time employees mange food hub with oversight from Board of Directors
Raising capital for infrastructure improvements Travel distance Increasing competition from competitors Quality standards from different farms
Unique service in Montana Wide-spread support from University Member support
The WMGC allows farmers to concentrate on producing food by aggregating products in a warehouse and distributing throughout the region. Initial funding through a Community Food Systems grant.

| 56
Conclusion
Each of the six case studies was built upon the needs and priorities of the respective community and the anticipated outcomes. Overall, food hubs provide economic and social attributes that benefit communities. Food hub members are provided services and increased employment opportunities that are otherwise limited or unavailable. Access increases food security for the region and decreases dependency on imported foods. Research shows that a main challenge with initiating a food hub is the financial component, but also the reliance on community investment and commitment. Reoccurring challenges were: demand exceeding supply, and buyer confidence that the volume and quality standards can meet their expectations. Opportunities were plentiful and include a network of professionals in the food system, collective marketing and promotion of local food products, and fair prices.
Although each case study was unique, each one provides greater access to markets for producers and their products. The mission and goals are similar: to create a dynamic marketplace, strengthen the future of a healthy food supply, and assist farmers. Our findings suggest that a 2,500 ft2 facility located in the city of Redmond or Bend would serve 500 farm acres. Minimum services should include: aggregation and minimal processing (including washing and packaging), storage (cold and freezer), distribution, and marketing with at least one full‐time employee with online management of wholesale services. To cover the costs of the project, membership costs and/or fee for services should be considered as well as grant or loans to assist with start‐up costs. The hub should build upon existing food businesses and the marketing program Central Oregon Buy Fresh Local. The most likely ownership model would be a public/private partnership with shared values and risk.
As with many food hubs, the potential challenges include defining roles, goals and outcomes for each stakeholder. Once these are established, priority services should be established with the goal of meeting secondary service needs in the future. A supply and demand equilibrium will be dependent on efficiencies in the program, especially with distribution and aggregation, and establishing connections with institutions and sizeable businesses to procure local food at a high volume.
| 57
Section 5: Next Steps and Strategies
Based on an analysis of existing data sets, census statistics, publications, reports and feedback, several implementation strategies have been identified. These strategies are meant to serve as a method to overcome the identified barriers and obstacles to a sustainable food system in Central Oregon and the implementation of a food hub. The strategies also acknowledge and support existing programs and projects and seek to advance new strategies to strengthen the food system. The listed strategies could be achievable within the next five years, and in combination with the financing options, the outcome could be a successful food hub for the region. Our estimate of five years is based on our experience working with existing collaborators and our knowledge of the current and future food system.
Central Oregon stands to benefit from a robust local food marketplace. Agricultural producers have demonstrated sufficient production capacity but also stated the need for improved access to local markets, enough to justify the development of a small scale food hub facility. Access to more markets means better food systems and services. Food businesses have stated the desire to purchase local food but recognize and react to the limitation to get the volume and type of product they desire due to lack of regional food system infrastructure.
The evidence presented in this study demonstrated that a food hub facility developed and located in Central Oregon would be viable under certain conditions that include:
CENTRAL OREGON BENEFITS: Combined public and private support of a facility will provide social and economic benefits (beyond direct producer/consumer interactions) as a means to strengthen the local food economy. This would include: affordable access to healthy foods through existing programs; expansion of micro‐enterprise opportunities; job creation and expansion in the food processing, manufacturing, distribution and value added sectors; import substitution; and preservation of the agricultural lifestyle.
AGRICULTURAL SECTOR: Capitalizing on farms and ranches ranging from $25,000‐$250,000 in annual sales could provide the volume of product (supply) necessary to meet demand. Knowing that meat supply is sufficient for the region, vegetable and fruit production could improve while value‐added production could provide additional off‐season income for producers. Agricultural producers would benefit if services were provided including a commercial kitchen to wash and package goods and for value‐added products, cold and freezer storage and distribution and transportation options.
HEALTHY FOOD ACCESS: Strengthening the flow of excess product to the regional food bank is integral to increasing access to fresh and local food for low income central Oregonians. To reach this goal, regular distribution of product should integrate a combination of delivery to and pick up by the food bank at a designated location with adequate storage.
CONSUMER DEMAND: Facilitating the formation of strategic partnerships between and among retail and institutional buyers will both encourage consumers to buy local products but also increase overall demand for the region.
STRUCTURE: With public resource limitations, duplication of existing efforts is not a viable option. The development of a food hub facility must build upon existing efforts. Public‐private partnership mechanisms will maximize efficiency, pool resources, and leverage existing relationships. Risk is

| 58
minimized through an incremental approach. To this end, a pilot project should be developed to assess the viability of a food hub facility in practice. While not centrally located within the Central Oregon region, the city of Bend is currently the optimal location for a food hub facility due to proximity to a sizeable consumer population and established direct markets and newly established local food distribution system. Additionally, the food hub model will work to connect with distributors export goods from the region.
FUNDING: Federal, state and local public funding must be secured to support start‐up capital and operational costs. Anticipated grant dollars should be jointly applied for between private businesses and non‐profits and local public leaders.
POLICIES: City and county policies can be a barrier to entry into markets for producers both at a financial and transactional level. Assistance in understanding land use policies and how to appropriately meet the set standards could provide a much needed service for agricultural producers. Local food procurement standards set at the city level by local officials could encourage retail businesses and consumer to support a local economy.
Strategic Overview
There are many opportunities to build a sustainable regional food system in Central Oregon. The following strategies provide a step‐by‐step framework to develop a regional food hub. Under each strategy are bulleted points to specify actions that could assist with the process or framework for an Action Plan. The development of such a plan will help to realize the proposed strategies.
Strategy 1. Develop a Regional Policy Committee and Supportive Framework
A food hub facility addresses three critical needs for Central Oregon: 1) improved infrastructure, 2) access for buyers and sellers to markets, and 3) increased development of a regional food system, which incorporates healthy food access. A collaborative approach to implementing a food hub has been contemplated throughout this feasibility study. A broad‐based regional entity will be identified to provide convening and collaborative development functions, while developing a broader policy framework for implementation. The entity will provide a venue for interested public and private stakeholders to engage in the development process. Responsibilities include:
Identifying lead implementer and implementation team
Convening public and private stakeholders in a public setting
Develop siting criteria for a facility
Developing priority food hub functions and model
Identifying funding sources
Educating the public, conducting outreach on the food hub concept
Encourage advocacy work that protects active use on farmland
Strategy 2. Develop a Leadership Role, Enable Community Buy‐In
Strong, consistent leadership and communication is necessary to successfully implement a collaborative project. While a regional entity will serve as the policy committee for the food hub project, a single organization or individual must be empowered to ensure that partners and stakeholders are working

| 59
actively to implement the food hub facility. The regional policy committee will identify a lead implementer; responsibilities include:
Resource development, contracting, and managing the pilot project development phase(s)
Identify and develop an implementation team composed of agricultural producers; processing, manufacturing and distribution entities; retail/institutional consumers; community stakeholders; and the Central Oregon Food Policy Council
Ensure sufficient administrative and legal capacity to manage the project
Report to implementation team on status of implementation, challenges, need for resources, etc.
Strategy 3. Secure Financial Resources
Resources must be secured to offset costs of developing a pilot project. Although a lead organization will provide oversight and management, the costs associated with staff time and any ancillary start‐up costs will need to be funded by outside funding such as private or governmental funding (Appendix D). Revenue models may also be developed to incentivize users and minimize direct and indirect overhead costs at the facility. The lead implementer and key stakeholders will implement the following actions:
Partner with federal and state agencies to develop a funding plan for pilot project
Identify private angel investors or private foundations
Develop funding applications and manage grant awards on behalf of the policy committee and implementation team
Research and develop funding mechanisms at facility to offset associated costs
Strategy 4 Implement a Pilot Project
The development of a food hub will be implemented incrementally to ensure that project outcomes and deliverables are met. A pilot project will be developed to ensure that the project is realistic and feasible and is supported by the community.
Understand the needs of small to mid‐size farmers and level of interest for a food hub, and the current supply and potential for expansion
Explore the current processing options in the community and who they serve; how do farmers and ranchers access these services; what are the regulatory issues and what is the timing required for processing of goods
Identify cold/freezer storage space
Determine what challenges distributors face that could be overcome by a food hub (such as infrastructure, seasonality, price, or demand); and understand the current successes where companies have sourced local produce and how this could be increased or strengthened
Identify the target consumer audience and associated price points
Develop an operating model
Strategy 5: Support the Development of a Balanced Supply and Demand
A balanced supply and demand will decrease the region’s dependency on imported food products and will provide economic development opportunities for regional agricultural producers. Agricultural

| 60
producers in Central Oregon struggle to meet the increasing demand for local food products and regional buyers lack trust that producers can provide consistent quality products. Factors contributing to a limited intersection of supply and demand include a limited growing season, and lack of infrastructure for limited facilities including processing and aggregation. The continual assistance with market development will expand opportunities for both producers and buyers.
Support the development and expansion of agricultural production through season extenders and provide infrastructure for aggregation, processing and distribution
Develop direct markets
Support appropriate land use policies and ordinances that decrease barriers for producers
Further develop valid and accurate food supply and demand data
Provide support to improve and assist with food safety certifications such as Good Agricultural Practices with relevant local organizations such as the Oregon State University Extension Service
Strategy 6. Improve Healthy Food Access and Review Policies
Providing equitable access to healthy food and integrating this access into a food hub model from the beginning will help to establish a protocol for utilizing and distributing food. Ensuring that relationships between the food bank, food pantries and the food hub are cohesive is critical to providing fresh, perishable foods. Similarly, reviewing opportunities and barriers to land use policies facing agricultural producers is key to the development of a robust and working system.
Consider mechanisms to assure affordable food access is part of the food hub
Develop relationships with stakeholders that are willing to evaluate and advocate for land use and procurement policies that positively affect farming
Expand and improve upon existing educational opportunities, value‐added production and commercial/demo kitchen use
Strategy 7. Assess Impacts and Analyze the Implementation Process
Ongoing review and assessment of the pilot project is essential for establishing baseline information and assessing the short and long term impact of the project. Recording the implementation process and the steps will be essential for to evaluate the processes and provide a replicable case study.
Collect baseline data (supply and demand)
Produce timely reports for the oversight committee
Develop and implement evaluation processes
Produce an annual report
Appendix A: Agriculture Employment Statistics
Table A.1 Occupational Information for Agriculture Related Employment
Occupations in Oregon (2008) Number Employed % of State Total
10-Year Growth Projection (%)
Production: Food Processing Oregon Central Oregon
Central Oregon
Oregon Central Oregon
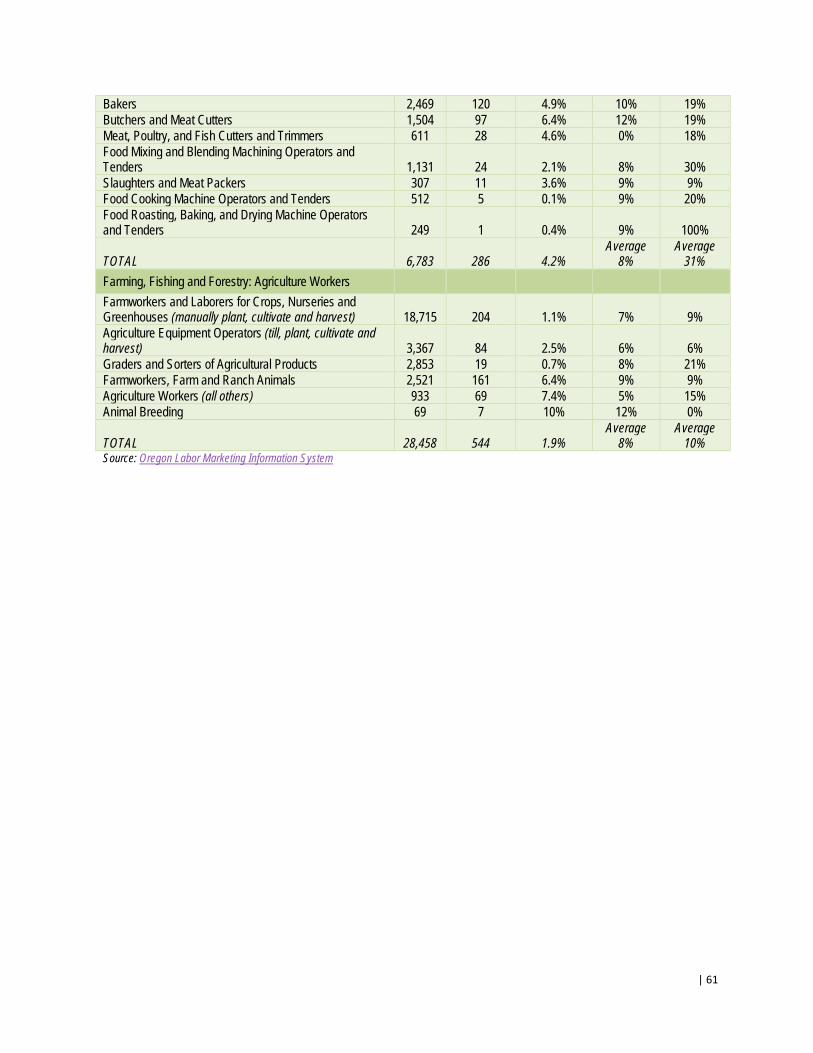
| 61
Bakers 2,469 120 4.9% 10% 19% Butchers and Meat Cutters 1,504 97 6.4% 12% 19% Meat, Poultry, and Fish Cutters and Trimmers 611 28 4.6% 0% 18% Food Mixing and Blending Machining Operators and Tenders 1,131 24 2.1% 8% 30% Slaughters and Meat Packers 307 11 3.6% 9% 9% Food Cooking Machine Operators and Tenders 512 5 0.1% 9% 20% Food Roasting, Baking, and Drying Machine Operators and Tenders 249 1 0.4% 9% 100%
TOTAL 6,783 286 4.2% Average
8% Average
31%
Farming, Fishing and Forestry: Agriculture Workers
Farmworkers and Laborers for Crops, Nurseries and Greenhouses (manually plant, cultivate and harvest) 18,715 204 1.1% 7% 9% Agriculture Equipment Operators (till, plant, cultivate and harvest) 3,367 84 2.5% 6% 6% Graders and Sorters of Agricultural Products 2,853 19 0.7% 8% 21% Farmworkers, Farm and Ranch Animals 2,521 161 6.4% 9% 9% Agriculture Workers (all others) 933 69 7.4% 5% 15% Animal Breeding 69 7 10% 12% 0%
TOTAL 28,458 544 1.9% Average
8% Average
10% Source: Oregon Labor Marketing Information System

| 62
Table A.2 Occupation by Food Product and Agricultural Support Services Dairy and Egg Crook Deschutes Jefferson % of state Oregon
Fluid Milk Producer 1 4 1 2% 269Fluid Milk Distributor ‐ 1 ‐ 6% 18Dairy Products Plant 1 3 ‐ 10% 40Contract Milk Hauler ‐ 2 ‐ 1% 203Vat Pasteurizer Dairy Operator ‐ 1 ‐ 2% 61HTST Pasteurizer Operator ‐ 1 ‐ 1% 162Wholesale Manufacturer Frozen Dessert ‐ 3 ‐ 17% 18Egg Handler Permit 2 5 1 5% 158TOTAL 4 20 2 2.8% (avg) 929 Meat Confined Animal Feeding Operations 5 4 5 3% 529Custom Stationary Slaughter ‐ ‐ 1 8% 13Custom Mobile Slaughter 1 1 ‐ 4% 52Non‐slaughtering Processor 2 5 1 6% 140Poultry and Rabbit Slaughter 1 1 ‐ 14% 14Custom Meat Processor 3 4 ‐ 8% 84Refrigerated Locker Plant ‐ 1 ‐ 9% 11Meat Seller 2 10 2 3% 594Pre‐packaged Meat Seller 11 26 6 6% 767
TOTAL 25 52 15 4.1% (avg) 2204 Food and Baked Goods Food Processing Establishment 1 47 5 5% 1066Food Warehouse ‐ 8 ‐ 2% 446Domestic Kitchen Food Processor 3 13 2 5% 339Domestic Kitchen Type Bakery ‐ 9 1 4% 255Bakery 6 37 4 6% 727TOTAL 10 114 12 4.8% (avg) 2833
Agricultural Support Services Crook Deschutes Jefferson % of state Oregon
Retail Seed Dealers 2 14 7 3% 782Commercial Feed 2 2 3 2% 405Central Oregon Livestock Auction ‐ ‐ 1 11% 9Conveyance for Transport (deceased animals) ‐ 2 ‐ 18% 11Brand Inspectors 2 1 1 NA NATOTAL 6 19 12 3.1% 1207

| 63
Appendix B: Agricultural Producer Survey
1. How many acres are you farming/ranching? 1‐9 acres 1 10‐49 1 50‐179 4 180‐499 1 500+ 2 2. In what Count(ies) do you farm Crook 40% Deschutes 30% Jefferson 30% Other Wasco 3. What markets do you currently use to sell your products?
Market Percent
Road-side Stand 9% CSA - Community Supported Agriculture 27% Direct to institutions 27% Website/online sales 27% Direct to grocer 36% Direct to other food retailer (bakery, food-cart, etc.) 36% Direct to restaurant 73% Farmers markets 64% On farm sales 73% Direct to consumer 82%
4. Of these markets, what is/are the percent of sales for each?
10% 20% 30% 40% 50% 60% 70% 80% 90% 100% Farmers markets 2 1 1 1 2 - - - - - Road side stand 1 - - - - - - - - - CSA - - 1 1 - 1 - - - - Direct to consumer 4 1 - 1 - - 1 - - 1 Direct to restaurant 4 - 1 - - - - - 1 - Direct to grocer 3 - - - - - - - - - Direct to other food businesses 3 - 2 - - - - - - - Direct to institutions 1 - 1 - - - - - - - Website/online sales 1 - 1 - - - - - - - On farm sales 3 2 - - - - - - - 1
5. What do you sell? Meat 9 Eggs 5 Vegetables 4 Fruits/berries 1

| 64
Grain 1 Dairy 1 Non‐food items 3 6. Of these items, what percent do you sell?
10% 20% 30% 40% 50% 60% 70% 80% 90% 100%
Vegetables - - - 1 2 1 - - - - Meat - 1 - 1 1 1 1 - - 4 Fruits/berries - - - - - - - - - - Eggs 2 - 2 - - 1 - - - - Grain 1 - - - - - - - - - Dairy - - - - - - - - - 1 Other - - 1 - - - - - - -
7. Do you have any of the following? Irrigation rights 9 Season extenders 4 Agri‐tourism 4 Other (Nat’l Historic District) 1 8. How much food (in # of families) do you produce per acre? 0‐1 families 1 2‐10 2 1‐25 2 Over 25 2 9. What is your gross farm income? < $2,500 1 $2,501‐$4,999 ‐ $5,000‐$9,999 1 $10,000‐$24,999 3 $25,000‐$49,999 1 >$50,000 1

| 65
Appendix C: Local Food Procurement Survey
Food Procurement
1. From what company do you currently purchase your food products (please list all)?
Sysco 27.3% Duck Delivery 18.2% Provvista 18.2% FSA 9.1% 24 Carrot 4.5% Unified Western Grocers 4.5% Other: Glory Bee, Cash & Carry, local farmers, Costco, local businesses, Happy Harvest Farm, Aloha Produce, Agricultural Connections, Redmond Smokehouse, NeighborImpact and Ocean Beauty
59.1%
2. Do you have an exclusive contract with any of the(se) suppliers?
No 93.8% Yes 6.3%
3. If yes, which ones are exclusive?
Duck Delivery (1 respondent), Sysco (1 respondent) and other (2 respondents)
4. What is the weekly volume (in sales) that you purchase in these food products?
$100‐$20,000
5. What type of fresh and frozen food products, if any, do you typically purchase outside the contract?
Fresh fruits and vegetables, local meat, local flour, fresh fish, lamb, hamburger, cheese, vinegars, oils, hot sauces, milk and eggs.
6. Which of the following are barriers to purchasing local food?
Quality 7% Lack of demand 7% Food safety 7% Other 21% Distribution 36% Convenience 43% Volume 43% Price 71% Irregular supply 79%
Other: Our climate and marketing and changing customer patters

| 66
Buying Local Food
7. What do you consider local?
Central Oregon 38.1% Oregon 42.9% Pacific NW 19.0% Other (please specify): Deschutes County and changes with suppliers
8. Do you currently promote anything as “local?”
Yes 80%, No 15%
9. Do you purchase (what you consider to be) locally grown/produced foods?
Yes 90%, No 10%
IF the answer is YES to purchasing locally (if no see below)
10. Why do you purchase locally grown/produced foods?
Better taste 72.2% Contribute to local economy 100.0% Costs less 11.1% Customer demand 38.9% Food safety issues 33.3% Fresher food 88.9% Higher quality 72.2% Marketing, "good for business" 50.0%
11. How often do you purchase locally grown/produced foods?
Daily 11.8% Weekly 52.9% Bi‐monthly 0.0% Monthly 5.9% Quarterly 0.0% Seasonally 29.4%

| 67
12. Of the following, what percentage of overall purchases are local food products (defined as the tri‐county region)?
<5% 5‐10% 11‐15% 16‐20% >20%
Milk & Dairy 1 0 1 0 10 Meat 3 0 2 2 6 Fruit 9 1 1 0 0 Vegetable 4 5 0 2 2 Specialty/prepared goods – such as: sauces/salsa; breads; or baked goods
4 2 0 0 2
Other: whole wheat flour 1 0 1 0 1
13. What purchasing system do you prefer to use (choose all that apply)?
Direct from the farmer/producer 82.4% Fax 0.0% Paper 11.8% Web 35.3% Other: phone call, representative
14. Who do you purchase local food products (choose all that apply)?
Delivered through a distributor 29.4% Direct from the farmer/producer 76.5% Seasonally through the farmers market 58.8% Supermarket 17.6% Other: Eberhards
15. If items are delivered raw, do you have a specific form that products needs to be in?
Ok to deliver direct from farm (as is) 52.9% Need products to be washed 29.4% Need products to be washed and packaged 11.8% Need products to be washed, packaged and cut 5.9%
IF the answer is NO to purchasing locally
16. Do you have any interest in purchasing local?
Yes 50%, Somewhat 50%, No 0%

| 68
17. How much more are you willing to pay for local?
<5% 100.0% 5% 0.0% 10% 0.0% >10% 0.0%
18. Please rank the following factors that affect whether or not you would carry locally/regionally‐produced products?
Very
Important Kind of
Important Neutral
Not important
A local supplier 1 0 1 0 Reliability in quantity 1 1 0 0 Reliability in availability 1 1 0 0 Reliability in quality 2 0 0 0 Demand from consumer 1 0 1 0 Cost 1 1 0 0 Relationship with farmer/producer
0 2 0 0
19. If you were to purchase local food, what purchasing system would you prefer to use?
Delivered through a distributor 50.0% Direct delivery from farmer 50.0% Farmers market 50.0% Fax 0.0% Supermarket 50.0% Web 0.0%
20. If you were able to procure locally grown/produced foods, what products would you like?
Berries, garlic and peppers
21. If items are delivered raw, do you have a specific form that products needs to be in?
Ok to deliver direct from farm (as is) 50.0% Need products to be washed 50.0% Need products to be washed and packaged 0.0% Need products to be washed, packaged and cut 0.0%

| 69
22. If a customer normally pays $10 for a food item, what percent more do you think they would pay for local food products?
1% 0.0% 2‐5% 100.0% 6‐10% 0.0% 11‐15% 0.0% >15% 0.0%
Outreach and Education
23. Would you consider supporting or are you already supporting any of the following initiatives to help you access and sell more local foods?
Distribution network 88.2% Education program for farmers/growers 76.5% Local/regional “local foods” marketing campaign 64.7% Publication of a farmer/grower directory 70.6%
24. Which of the following would help you purchase more locally/regionally grown and produced foods?
Regional “local foods” marketing campaign 31.6% Local Food Directory (printed) 47.4% Local Food Directory (virtual) 63.2% Restaurants that identify "local food" menu items 47.4% Stores that identify "local food" items 57.9% Other: central distribution site in Bend, more products/better price point, and a local food campaign
25. Which of the following statements about locally/regionally grown and produced foods is/are true for you?
Buying local supports local farmers and growers 100.0% Buying local supports the local economy 85.0% Local food is fresher 80.0% Local food has better quality 80.0% Local food has less of an environmental impact 85.0% Other: Local food brings communities closer in touch emotionally and physically with their surrounding landscape and the people who inhabit it. The engagement of this connection, I believe, is vital to the stimulation and long‐term sustainability of the local food movement.

| 70
26. What further information would you like about locally grown food?
Contact list of local farmers/producers 86.7% Meeting with farmers/producers 40.0% One person to contact about all my questions 46.7% Other: I think a directory that includes producers and links to documents that list specific products they have available to sell and the prices along with their availability would be really cool to have access to online. I struggle in making time to reach out to the people anymore, and I will always connect with him/her before officially creating a vendor‐buyer relationship, but it would be handy to get access to their product list and pricing first to see if I want to make the next step in contacting them.
27. Do you have any advice for networking to promote local?
1. Limit all barriers to local food production & distribution (regulation & fees). 2. For restaurants something that is in line with current purveyor practices (like Provvista or
Eberhards). If buying is similar to the way we buy our other products you will have the most success.
3. Local producers have to be able to sell for fair market RETAIL value due to their typically small volumes of production in order to be supported to continue producing. A lot of producers are mom and pop producers that have 2nd jobs to supplement their endeavors to produce locally
4. Farmers need to be able to produce enough supply on a regular basis at a competitive price to meet our needs.
5. The local farming capabilities currently are not large enough to support the per capita restaurant scene in central Oregon, but it is great for small businesses and at home cooking if the price can be competitive with outsourced products that are of the same quality. Local needs to be at least all of Oregon, not just 3 counties to be competitive.
6. Items grown or created on Westside of mountains that are labeled "local"....that concept or advertising method needs to change.
7. Use the grant money you get to promote the farmers that supply local food‐ not one individual farm‐ spread the proceeds around justly.
8. The contact list of local farmers/producers might include information from those folks about what is available now, in what quantities and price and what is coming up to help in planning ahead of menus and to keep everyone in tune with the seasonality of local produce.
9. Create one place to go to get all of the grocers needs met, will seem less overwhelming to them and take less time = increased perception for ease of use...
10. I want to know what is available Central Oregon local, within a hundred miles, within the whole state, and within the Pacific Northwest. My biggest issue right now is with sourcing things like vinegar, soy sauce etc. I don’t expect them to be central Oregon local, but I would like to find producers that are at least in this part of the country. So I guess layers of local availability.
11. How do you get people to care about their health and the health of the local economy? You have to combat the brainwashing we have received over the last 50 years.
12. I think there are a lot of health professionals in the area who would love to have suggestions for their clients to get access to healthy, local, organic food. If there's any way to get information out to these professionals, their word of mouth buy‐in to their clients could be a huge win‐win. I think that there are many, many people in the Central Oregon region who are open to alternative ways of buying "righteous" food, but they need a little leverage/boost in getting them started... getting them aware and then started in the swing of buying this type of product.

| 71
It must be convenient. It must be affordable. It must make an impact on their and their family member's lives that deems it worthwhile. I think that working with schools and finding administrators/teachers who are willing to share information about local food access points to their network of parents would be a huge success if a campaign were organized such that if they try it out for the first time they will get a free "x" or a "x" percent discount. I think making it a BIG deal early enough so that people talk about it and get on the bandwagon of it and then BOOM! They all try it out and then everyone gets to feel like they are making a choice that stimulates their "community" so to speak within a particular school, business, etc. People like to "belong" and making them feel like they "belong" not only to something that their school/organization is doing, but beyond that to a "movement" could be very compelling. All of us entrepreneurs don't have enough time or other resources to make these giant efforts happen. Help with making them happen could be tremendously effective for all the local producers and for the distributors of local goods like AC and Central OR Locavore. Hope that helps!!!!!

| 72
Appendix D: Financing Options
Federal Government Funding Options
Planning
Construction
Land
Equipment
Marketing
Working
Capital
Training
USDA, Rural Development
Community Facilities Grant X X X
B&I Guaranteed Loan Program X X X X
Rural Business Enterprise Grant X X X X X X
Rural Business Opportunity Grant X X
Value-Added Producer Grant X X X
Intermediary Relending Program X X X X X
Rural Micro entrepreneur Assistance Program X X X X X X
Rural Economic Development Loan & Grant Program X X X
Rural Energy for America Program Grants/Renewable Energy Systems/Energy Efficiency Improvement Program
X X X
USDA, National Institute of Food and Agriculture
Sustainable Agriculture Research Education X
Community Food Projects Competitive Grant X
Beginning Farmers & Rancher Development Program X X
Agriculture & Food Research Initiative – Global Food Security X
USDA, Risk Management Agency
Risk Management Education and Outreach Partnership Cooperative Agreements Program
X
USDA, Agricultural Marketing Service
Farmers Market Promotion Program X X X X
Specialty Crop Block Grant Program X X X
Federal-State Marketing Improvement Program X X X
USDA, Farm Service Agency
Farm Storage Facility Loan Program X X X
USDA, Natural Resource Conservation Service
Environmental Quality Incentives Program X X X X
Conservation Innovation Grants X X X
US Department of Commerce
Public Works and Economic Development Program X X
Economic Adjustment Assistance Program X X X X X X
US Department of Health and Human Services
Communities Putting Prevention to Work X
Community Transformation Grants X X
Community Economic Development Grants X X X X X X

| 73
Federal Government Funding Options (cont.)
Planning
Construction
Land
Equipment
Marketing
Working C
apital
Training
US Department of Housing and Urban Development
Sustainable Community Regional Planning Grant X X X
Community Challenge Grant X X X
Community Development Block Grant Program X X X X X
Rural Housing and Economic Development Program X X X X X
US Department of Treasury
Community Development Financial Institutions Program X X X X X X X
New Market Tax Credit (apply to Comm. Dev. Entity) X
National Good Food Network, Regional Food Hub Resource Guide, 2012.
US Department of Agriculture (grants and loans)
Rural Business Enterprise Grant (RBEG) supports the development of physical infrastructure and facilities, including food processing, marketing, and distribution business ventures for locally‐grown agricultural products. It is administered by the Rural Business Cooperative Service, and can support everything from planning, plant upgrades, equipment purchases, and technical assistance. Grants range from $10,000 up to $500,000, although smaller projects are given higher priority. Rural public entities, Indian tribes, and rural non‐profit organizations are eligible to apply. “Rural” in this case is defined as any area other than a city or town that has a population of greater than 50,000 and the urbanized area contiguous and adjacent to such a city or town according to the latest decennial census. Information and grants are disbursed on the state level. www.rurdev.usda.gov/rbs/busp/rbeg.htm
Rural Business Opportunity Grant (RBOG) supports training and technical assistance for business development (to include support for food processing, marketing and distribution business development of locally‐grown agricultural products). It emphasizes strategic technical assistance, training, and planning activities that promote “best practices” in sustainable economic development for rural communities with exceptional needs. www.rurdev.usda.gov/rbs/coops/rbog.htm
Value‐Added Producer Grant (VAPG) supports the production of value‐added agricultural products from commodities. Up to $100,000 can be awarded for planning, and up to $300,000 for working capital. Eligible entities are independent producers, farmer and rancher cooperatives, agricultural producer groups, and majority‐controlled producer‐based ventures. www.rurdev.usda.gov/rbs/coops/vadg.htm
Business and Industry Guaranteed Loan Program (B&I) helps provide loans for businesses and cooperative ventures where a loan will keep a business from closing, prevent the loss of employment, or provided expanded job opportunities. Private lenders are provided loan guarantees by USDA to ensure better terms. Any legal entity (including individuals) is eligible to apply, but restricted to rural cities with populations less than 50,000, with priority given to populations of less than 25,000. Loans may be used to prevent businesses from closing, or to provide expanded job opportunities; convert, enlarge, repair, modernize or otherwise develop a rural business; purchase and develop land, easements, rights‐of‐way,

| 74
buildings, or facilities; purchase equipment, leasehold improvements, machinery, supplies, or inventory. Applications must be filed with Rural Development State Offices. www.rurdev.usda.gov/rbs/busp/b&i_gar.htm
Community Facilities Program provides loans and grants for the construction, acquisition, or renovation of community facilities or for the purchase of equipment for community projects. www.rurdev.usda.gov/HCF_CF.html
Rural Economic Development Loan and Grant Program (REDLG) promotes rural economic development and job creation projects in rural areas. www.rurdev.usda.gov/ga/tredleg.htm
Natural Resource Conservation Service ‐ Environmental Quality Incentives Program provides financial and technical assistance to help plan and implement conservation practices that address natural resource concerns. The 2008 Farm Bill began offering high tunnels, or hoop houses, to help extend the growing season for fresh market vegetable producers. http://www.nrcs.usda.gov/programs/eqip/index.html#intro
Natural Resource Conservation Service ‐ The Conservation Innovation Grant seeks to stimulate the development and adoption of innovative conservation approaches and technologies, particularly as they relate to agriculture. “Promotion of Sustainable Agriculture,” “Nutrient and Pest Management,” and “Program Outreach and Conservation Technology Transfer to Targeted Groups” are just a few of the goals of this program. http://www.nrcs.usda.gov/technical/cig/index.html
Risk Management Agency ‐ Risk Management Education is a comprehensive educational program to assist producers and agribusinesses to understand their increased risk exposure and responsibility in the current economic environment. http://www.rma.usda.gov/aboutrma/who/aboutrme.html
Agricultural Marketing Service
Farmers Market Promotion Program (FMPP) is a grant program designed to facilitate and promote farmers markets and other direct‐to‐consumer market channels for agricultural products. Grants are awarded on a competitive basis. The maximum amount awarded for a proposal cannot exceed $100,000. Approximately $10 million is allocated for Fiscal Years 2011 and 2012. Entities eligible to apply include agricultural cooperatives, producer networks, producer associations, local governments, nonprofit corporations, public benefit corporations, economic development corporations, regional farmer’s market authorities, and Tribal governments. “Growing Farmers,” “Professional Development,” and “Expanding Local and Rural Economies” are just a few of the goals of the program. The emphasis of this program is on direct‐to‐consumer marketing, which includes multi‐farm CSAs and online buying clubs. www.ams.usda.gov/FMPP
Federal‐State Marketing Improvement Program (FSMIP) provides matching funds to states to research and innovate new marketing opportunities for food and agricultural products. www.ams.usda.gov/FSMIP

| 75
National Institute of Food and Agriculture
Community Food Projects Competitive Grant Program (CFP) is designed to increase food security in low‐income communities by developing linkages between two or more sectors of the food system, supporting the development of entrepreneurial projects, and encouraging long‐term planning for communities. Grants of $10,000 to $300,000 (lasting 1‐3 years) are competitively awarded to eligible nonprofit entities that need a one‐time infusion of federal assistance to establish and carry out multipurpose community food projects. Approximately 18 percent of submitted proposals have received awards. http://www.csrees.usda.gov/hungerfoodsecurity.cfm
Sustainable Agriculture Research and Education (SARE) awards competitive grants to advance sustainable innovations that support the whole of American agriculture, with a special emphasis on outreach and dissemination of project results. Four regional offices administer SARE funds, which support research on topics including on‐farm renewable energy, pest and weed management, sustainable communities, agro‐forestry, marketing, and more. www.sare.org
The Organic Research and Extension Initiative supports the ability of producers and processors who have already adopted organic standards to grow and market high quality organic agricultural products. http://www.csrees.usda.gov/funding/rfas/OREI.html
Farm Service Agency
Farm Storage Facility Loan Program can finance the construction of on‐site storage, cooling, and minimal processing facilities for eligible commodities. The 2008 Farm Bill expanded those eligible commodities to include vegetable and fruit (including nut) producers. http://www.fsa.usda.gov/FSA/webapp?area=home&subject=prsu&topic=flp‐fp
Foundation, Non‐profit and Loan Programs
504 Small Business Association Loan Program The SBA 504 loan program is a fixed asset financing program for new or growing small businesses. A 504 financing package is a partnership loan with your bank and a Certified Development Company, also known as a CDC. CDC's are licensed and regulated by the U.S. Small Business Administration (SBA). SBA 504 loans can be use for the purchase of an existing building or the purchase of land and construction of a new building. Other eligible uses included equipment, furnishings, and most closing costs. Working capital items, such as inventory, are not eligible under the 504 program.
Accion is an innovator in financial access, developing many of the best practices and emerging standards in the industry. Accion provides a full range of management services, investments and governance support to help financial institutions to build institutional capacity, provide diversified high‐quality financial services, become financial sustainable and reach meaningful scale.
Ben and Jerry’s Foundation National Grassroots Grant Program has a broad interest in social justice, environmental protection and sustainable food systems protection, and sustainable food systems. They provide up to $15,000 for a 1‐year period for non‐profits.

| 76
Cedar Tree Foundation Sustainable Agriculture, Environmental Education, and Environmental Health programs focuses on environmental justice, and conservation, with a particular interest in urban agriculture.
Claneil provides Community Grants and Special Project Fund that focus on hunger and nutrition, food system, health and human services, education and the environment.
Craft 3 (formerly Enterprise Cascadia) is a certified non‐profit Community Development Financial Institution (CDFI) serving urban and rural communities of Oregon and Washington. Enterprise strengthens family, ecological and economic resilience through consulting, financial and business assistance to entrepreneurs, non‐profits and others that deliver economic, social and/or environmental benefits to local communities and the larger region. www.sbpac.com
GRACE Communications Foundation focuses on the development of sustainable, community –based food production and regional food distribution networks, public awareness, and policy work.
Kresge Community Development, Environment, and Health programs focus on replicable, innovative models and exemplary financial vehicles for equitable reinvestment; place‐based initiatives to develop innovative approaches to preparing for an uncertain climatic future; and reducing health disparities among children and adults in the US. Government entities are eligible
Meyer Memorial Trust Program Related Investments are low cost loans, loan guarantees and equity investments to support a charitable project or activity. Because PRIs are paid back, the funds are recycled to further MMT's charitable purpose. http://mmt.org/program/pri
Organic Valley’s Farmers Advocating for Organics fund is dedicated to furthering organic education, farming or product research, and advocacy.
Surdna Foundation focuses on reducing greenhouse gases, creating green businesses that are pathways out of poverty for underserved communities; and creating jobs and job training in sustainable businesses.
W.K. Kellogg Foundation Healthy Kids Program works to improve food systems by engaging local leaders in communities and schools to deliver healthier foods to all children and achieve related policy changes; transform food deserts into food oases by increasing engagement of local communities in all aspects of food production and delivery, including related research and policy changes.
Whole Foods Market, Local Producer Loan Program provides up to $10 million in low‐interest loans to independent local farmers and food artisans. http://www.wholefoodsmarket.com/values/local‐producer‐loan‐program.php
Wholesome Wave Foundation uses a combination of grassroots food systems experience and elite business strategy training, the HFCI business team will begin by helping 15 food hub enterprises become investment‐ready.
Social Media Funding Kickstarter and Indie Go Go

| 77
Appendix E: Further Analysis
Priority Objective Strategy Consumer Demand Develop valid and accurate local food
consumption data Establish a methodology for collecting statistically valid data on how much local food is consumed
Production Develop valid and accurate local food supply data
Conduct an analysis of existing farmers and ranchers that are using direct markets to sell locally produced food; what, how much, when and where
Improve producer’s ability to access retail markets that require GAP or other forms of food safety certification
Provide funding or off-set costs for GAP and other food safety certifications to help producers increase their business
Increase access to cold storage and freezer space
Analyze existing cold storage and freezer space and how to utilize and increase access
Increase the number of farmers participating in technical assistance and business planning services
Provide farm management workshops/conference using skilled facilitators; provide one-on-one assistance for additional skills building; developed templates for diversification strategies including transition to organic, energy efficiency strategies, and value-added products; and provide technical assistance with business planning for farmers and ranchers interested in scaling up production, developing a value-added product, or increasing CSA options (vegetable and meat)
Direct Markets/Retail Distribution
Increase the availability of local food products in retail and wholesale market outlets
Conduct an analysis of existing farmers, ranchers, and retail businesses that are interested in being a part of a regional food hub – what are they currently producing and buying; how much, where, and when.
Maximize opportunities for local producer to access existing institutional markets
Encourage the leadership of institutions to adopt a goal and/or policy directive to source as much locally produced food as budgets will allow, and to increase these budgets over time. This should include a tracking system to analyze the progress over time.
Increase food storage and aggregation opportunities
Create an inventory of all food storage facilities and support the aggregation of food using existing distributors
Increase producer access to market demand information
Encourage the formation of strategic partnerships between producers and retailers interested in local food. This should include a tracking system to analyze the progress over time.
Processing Increase access to processing facilities
Increase access to custom and/or mobile slaughter
Increase the number of trained mobile and custom slaughter operations
Waste Management Build the infrastructure to divert organic wastes to compost or soil building
Encourage the construction of a composting facility with on-farm composting
Marketing Increase the marketing of local foods through a regional media and promotional campaign
Develop and provide materials regarding the importance of buying local. Build upon existing models such as USDA Know Your Farm, or FoodRoutes Buy Fresh Buy Local

| 78
Leadership, Coordination, Education and Food Access
Increase the quantity of fresh local food to food shelves and charitable meals sites
Establish gleaning sites and excess food pick-ups throughout the region and contacts at regional food banks and similar organizations.
Encourage on-going support from the community for the food system
Conduct periodical evaluations or analyses of the progress of food security and the development of the food hub in relations to the stated strategies; convene an annual meeting with committee; provide at least every other year, a conference to the food system in general
Financing Increase the amount of philanthropic funds and program-related investments in food enterprises and non-profit supporters
Work with local organizations, such as Central Oregon Intergovernmental Council, to increase funding from regional and national foundations, governmental grants and lending programs; and proactively identify and build relationships with foundations.
Economic Development
Increase employment opportunities in the local food sector
Identify, expand and develop the number of coordinator positions to serve as matchmakers between buyers and sellers to increase local food consumption for all types of retail outlets.
Improve access to qualified farm labor Improve the system for hiring farm workers/guest workers Policy Encourage the creation of local zoning
regulations to protect the right to farm and encourage the protection of active use on farmland
Review and update zoning ordinances to ensure, to the greatest extent possible, that farm land are conserved for exclusive farm activities; develop tools such as those developed by the Central Oregon Food Policy Council to guide improvements to planning and zoning ordinances that support the future development of the food system

| 79
Conducted and Prepared by:
Central Oregon Intergovernmental Council Katrina Van Dis, Program Administrator [email protected] | 541.504.3307
Funded by:
Copyright © Central Oregon Intergovernmental Council, 2012.