Central neurochemical ultradian variability in depression - downloads
9
Disease Markers 22 (2006) 65–72 65 IOS Press Central neurochemical ultradian variability in depression Ronald M. Salomon a,∗ , Benjamin W. Johnson b and Dennis E. Schmidt a a Department of Psychiatry, Vanderbilt University School of Medicine, Nashville, TN, USA b Department of Anesthesiology, Vanderbilt University School of Medicine, Nashville, TN, USA Abstract. Depression is characterized by blunted behavior and neuroendocrine function that generally improve with antidepressant treatment. This study examined intrinsic variability in brain neurotransmitter function, since it may be a source of blunted behavior and neuroendocrine function in depression and a marker for the illness, and has not previously been analyzed using wavelet decomposition. To measure variability in monoamine metabolites, lumbar cerebrospinal fluid (CSF) was collected in serial samples in depressed patients before and after treatment. We hypothesized that changes in variability would be observed after treatment. Mechanisms that control such variability may be critical to the pathophysiology of depression. Method: Time series data was obtained from serial ten-min sampling over a 24-hr period (N = 144) from thirteen depressed patients, with a repeat collection after 5 weeks of antidepressant (sertraline or bupropion) treatment. Concentrations of tryptophan (TRP), the monoamine metabolites 5-HIAA (metabolite of serotonin) and HVA (metabolite of dopamine), and the HVA:5HIAA ratio were transformed to examine power in slowly (160 min/cycle) to rapidly (20 min/cycle) occurring events. Power, the sum of the squares of the coefficients in each d (detail) wavelet, reflects variability within a limited frequency bandwidth for that wavelet. Pre-treatment to post-treatment comparisons were conducted withrepeated measures ANOVA. Results: Antidepressant treatment was associated with increased power in the d2 waveletfrom the HVA (p =0.03) and the HVA:5-HIAA ratio (p =0.03) series. The d1 and d3 wavelets showed increased power following antidepressant treatment for the ratio series (d1, p =0.01; d3, p =0.05). Significant changes in power were not observed for the 5-HIAA data series. Power differences among analytes suggest that the findings are specific to each system. Conclusion: The wavelet transform analysis shows changes in neurochemical signal variability following antidepressant treatment. Patterns or degrees of variability may be as important as, or possibly more important than, the mean levels of monoamine transmitters. Studies of variability observed in healthy individuals and a larger depressed sample will be needed to verify a relationship with mood and treatment response. Neurochemical measures of time-variability may be a pivotal marker in depression. 1. Introduction Normal variations in mood over minutes to hours are an integral part of emotional stability. Brain neuro- chemical activity that underlies these variations must also vary within similar boundaries, but intrinsic vari- ability in brain neurochemistry is rarely studied. We hypothesized that variability (power in wavelet trans- forms) would change with treatment. To test this, ex- tended collections of cerebrospinal fluid (CSF) with ∗ Corresponding author: VAVPsychiatry-2200, 1500 21st Avenue S., Nashville, TN 37212, USA. Tel.: +1 615 322 0387; Fax: +1 615 343 7868; E-mail: [email protected]. high frequency sampling of the serotonin precursor, tryptophan (TRP), and the serotonin and dopamine metabolites (5-HIAA and HVA, respectively) were ex- plored for changes in their variability and interactions over time before and after treatment for depression. Tryptophan (TRP) is an essential amino acid, derived solely from dietary protein, and passes the blood brain barrier via active transport throughout the neuraxis so that its levels in CSF will be influenced by dietary in- take of TRP, hepatic homeostatic controls, and compe- tition with other large neutral amino acids at the blood- brain barrier. Serotonin is only one of many products of TRP metabolism, and is metabolized to 5-HIAA. Dopamine derives from tyrosine or phenylalanine, both of which are usually plentiful, and is metabolized to ISSN 0278-0240/06/$17.00 © 2006 – IOS Press and the authors. All rights reserved
Transcript of Central neurochemical ultradian variability in depression - downloads

Disease Markers 22 (2006) 65–72 65IOS Press
Central neurochemical ultradian variability indepression
Ronald M. Salomona,∗, Benjamin W. Johnsonb and Dennis E. SchmidtaaDepartment of Psychiatry, Vanderbilt University School of Medicine, Nashville, TN, USAbDepartment of Anesthesiology, Vanderbilt University School of Medicine, Nashville, TN, USA
Abstract. Depression is characterized by blunted behavior and neuroendocrine function that generally improve with antidepressanttreatment. This study examined intrinsic variability in brain neurotransmitter function, since it may be a source of bluntedbehavior and neuroendocrine function in depression and a marker for the illness, and has not previously been analyzed usingwavelet decomposition. To measure variability in monoamine metabolites, lumbar cerebrospinal fluid (CSF) was collected inserial samples in depressed patients before and after treatment. We hypothesized that changes in variability would be observedafter treatment. Mechanisms that control such variability may be critical to the pathophysiology of depression. Method: Timeseries data was obtained from serial ten-min sampling over a 24-hr period (N = 144) from thirteen depressed patients, with arepeat collection after 5 weeks of antidepressant (sertraline or bupropion) treatment. Concentrations of tryptophan (TRP), themonoamine metabolites 5-HIAA (metabolite of serotonin) and HVA (metabolite of dopamine), and the HVA:5HIAA ratio weretransformed to examine power in slowly (160 min/cycle) to rapidly (20 min/cycle) occurring events. Power, the sum of thesquares of the coefficients in each d (detail) wavelet, reflects variability within a limited frequency bandwidth for that wavelet.Pre-treatment to post-treatment comparisons were conducted with repeated measures ANOVA. Results: Antidepressant treatmentwas associated with increased power in the d2 wavelet from the HVA (p = 0.03) and the HVA:5-HIAA ratio (p = 0.03) series.The d1 and d3 wavelets showed increased power following antidepressant treatment for the ratio series (d1, p = 0.01; d3,p = 0.05). Significant changes in power were not observed for the 5-HIAA data series. Power differences among analytessuggest that the findings are specific to each system. Conclusion: The wavelet transform analysis shows changes in neurochemicalsignal variability following antidepressant treatment. Patterns or degrees of variability may be as important as, or possiblymore important than, the mean levels of monoamine transmitters. Studies of variability observed in healthy individuals and alarger depressed sample will be needed to verify a relationship with mood and treatment response. Neurochemical measures oftime-variability may be a pivotal marker in depression.
1. Introduction
Normal variations in mood over minutes to hours arean integral part of emotional stability. Brain neuro-chemical activity that underlies these variations mustalso vary within similar boundaries, but intrinsic vari-ability in brain neurochemistry is rarely studied. Wehypothesized that variability (power in wavelet trans-forms) would change with treatment. To test this, ex-tended collections of cerebrospinal fluid (CSF) with
∗Corresponding author: VAV Psychiatry-2200, 1500 21st AvenueS., Nashville, TN 37212, USA. Tel.: +1 615 322 0387; Fax: +1 615343 7868; E-mail: [email protected].
high frequency sampling of the serotonin precursor,tryptophan (TRP), and the serotonin and dopaminemetabolites (5-HIAA and HVA, respectively) were ex-plored for changes in their variability and interactionsover time before and after treatment for depression.
Tryptophan(TRP) is an essential amino acid, derivedsolely from dietary protein, and passes the blood brainbarrier via active transport throughout the neuraxis sothat its levels in CSF will be influenced by dietary in-take of TRP, hepatic homeostatic controls, and compe-tition with other large neutral amino acids at the blood-brain barrier. Serotonin is only one of many productsof TRP metabolism, and is metabolized to 5-HIAA.Dopamine derives from tyrosine or phenylalanine, bothof which are usually plentiful, and is metabolized to
ISSN 0278-0240/06/$17.00 © 2006 – IOS Press and the authors. All rights reserved

66 R.M. Salomon et al. / Central neurochemical ultradian variability in depression
HVA. Metabolic turnover of the neurotransmitters isinfluenced by firing rates, synaptic release, reuptake ac-tivity, and exposure to catabolic enzymes. The ratio ofHVA:5-HIAA, a previously published measure reflect-ing relative turnovers of the two neurotransmitters, wasalso determined [9,15]. Data suggest that the ratio maypredict treatment outcome with greater fidelity than theestimates from either measure alone [15]. The presentexamination of the HVA:5-HIAA ratio in time series re-flects, in a first approximation, the interactions and in-dependence of serotonin and dopamine turnover. Flat-ter curves reflect greater correlation and dependence ofthese neurochemical systems, while greater variabilityreflects increasing independence of the two systems.
One way to determine whether variability in a neuro-chemical signal is a meaningful quantity is to monitorchanges with treatment, to see if a consistent pattern isobserved. Suitable data were available from an earlierstudy in which effects of TRP depletion were examinedduring the 25th through 48th hours of a CSF collec-tion [18]. The first 24 hours of data had been collectedwhile subjects maintained a balanced monoamine diet.A second, identical collection followed 5 weeks of an-tidepressant treatment. Changes in CSF HVA and 5-HIAA levels, and the HVA:5-HIAA ratio during antide-pressant treatment were examined within subjects inorder to maximize the likelihood of detecting treatmenteffects on the variability of these measures.
The wavelet transform filters by frequency and loca-tion in the signal, giving a set of coefficients that quan-tify local variability power. Distinct features of wavelettransforms allow more sensitive detection of variabilityas irregular, not-quite-periodic events than can be ob-tained with other mathematical methods. Cosinor anal-ysis estimates the degree of fit of a solitary waveformover the entire set (circadian, in most applications), andFourier transforms detect a wide range of finely de-termined frequencies, but with poor temporal resolu-tion and a strong vulnerability to phase shifts betweenevents. Since ultradian variability in the brain is notnecessarily locked into strict rhythms, phase shifts orcomplex cycling may mask quasi-periodic functions ifanalyses only use routine cosinor fits or Fourier spec-tral analyses. Wavelet transforms of serial neurochem-ical measures require a sampling frequency and dura-tion relevant to neurobiological events in question, andhighly reproducible neurochemical assays with limited,known noise characteristics. Similar wavelet trans-forms of neurophysiologic recordings following phar-macologic challenges have shown modulation of neu-ral activity following ligand exposure in rodent cortexor globus pallidus [1,17].
Variability measures may lead to a better under-standing of the pathophysiology of depression. Neuro-chemical variability characteristics in depression maybe controlled, for example, by clock genes or by link-ages between cell-cycle timing mechanisms and mes-sage transducers (e.g. groups of receptors). Alteredcell timing mechanisms would be expected to simulta-neously influence multiple neurochemical systems andtheir degree of interaction.
To summarize, levels of the monoamine metabolitesHVA and 5-HIAA in serial samples of lumbar cere-brospinal fluid (CSF) taken every 10 min for 24 hrs wereanalyzed with wavelet transforms to determine vari-ability power or energy. Treatment-associated changesin these measures were assessed in a within-subjectsdesign.
2. Methods and materials
Patients: CSF collection protocols were approved bythe Vanderbilt Institutional Review Board. Each sub-ject showed appropriate volition, motivation, and cog-nitive capacity, and discussed risks individually withthe principal investigator at length before giving fullyinformed consent, signing the comprehensive consentdocument, and submitting to a thorough medical andpsychiatric screening. Major depressive episodes werediagnosed using the Scheduled Clinical Interview forDSM-IV Axis I disorders (SCID-P) [10]. Severe per-sonality disorders were excluded by SCID-II inter-view [11]. Diagnoses were confirmed in a lengthy clin-ical interview by a boarded psychiatrist (RMS). TheHamilton Rating Scale for Depression (HRSD) fromthe Yale Depression Inventory [14] was used to quan-tify depression severity. Patients were free of all psy-chotropic medications and substance abuse for two andsix months respectively and were free of all other med-ications, including over-the-counter analgesics, for atleast one month. Lifetime history of serious substancedependence was also cause for exclusion. Potentiallysuicidal patients were also excluded to avoid unethicaldelays in treatment, because of invasive study risks, andbecause of possibly inappropriate motivation for partic-ipation. Fifteen depressed patients (10 female, 5 male,ages 25 to 60 years, mean 37.7 years), met all abovecriteria and DSM-IV [3] criteria for Major DepressiveEpisode (Major Depressive Disorder or Bipolar Dis-order, Depressed) and were admitted to the VanderbiltGeneral Clinical Research Center (GCRC). Data from13 patients were analyzable. Data from one male was

R.M. Salomon et al. / Central neurochemical ultradian variability in depression 67
excluded because of a catheter occlusion. One femalewas excluded because she was maintained on lithiumcontinuously and her data were extreme outliers, to bereported elsewhere.
Procedure: Details of the catheter placement andCSF collection procedure have been published else-where [18]. Briefly, a 72-hour pre-study caffeine-freeand monoamine-balanced diet was continued duringthe collection period. During CSF collections, foodwas offered only at 6:30 a.m. and 9:30 a.m., with nosnacks in between for a 21-hour fast. Hydration withintravenous 5% dextrose was continuous. Patients re-mained supine overnight prior to and during CSF col-lections. Daytime napping was discouraged. Lightswere out from 10:30 p.m. to 6:00 a.m. Tympanictemperature was determined every 2 hrs.
Catheter placement began at 7:00 a.m. A 20g epidu-ral catheter at L4-5 connected to a peristaltic pumpcollected 1 ml samples every 10 min (0.1 ml/min) for24 hrs beginning at 8:00 a.m. Samples were chilledto 5◦C. during collection, moved to dry ice storagewithin 30 min, and stored at −70◦C. HPLC anal-ysis with electrochemical detection [20] determinedconcentrations of the amino acid precursor of sero-tonin (tryptophan, TRP), the serotonin metabolite (5-hydroxyindoleacetic acid, 5-HIAA), and the dopaminemetabolite (homovanillic acid, HVA).
The procedure was repeated after five weeks of treat-ment. Moderate to severe headaches occurred after halfof the procedures, which were otherwise well tolerated.All headaches resolved, with blood patches performedfor nine of the 30 studies. No serious adverse events orlong-term sequellae resulted from this study.
Antidepressant treatment: Eight weeks of sertralinetreatment (100 mg daily at 10:00 a.m.) or bupropiontreatment (300 mg daily at 10:00 a.m.) began with half-doses during week one. Five patients were studied un-der a sertraline-only protocol, the following ten patientswere assigned to drug in random fashion. Data wascollected in conjunction with another study for whichthe random assignment to treatment was a critical fea-ture and fortuitously provided evidence of changes invariability power irrespective of antidepressant mech-anism of action, but limited the sample size for eachtreatment.
Analysis: Time series data were examined fortreatment-associated changes in means, variance, andwavelet coefficient power. Results were comparedto Fourier-derived spectral analysis findings recentlypublished elsewhere [19]. The present analysis usingwavelet properties was conceived and executed afterstudy completion and analysis with Fourier methods.
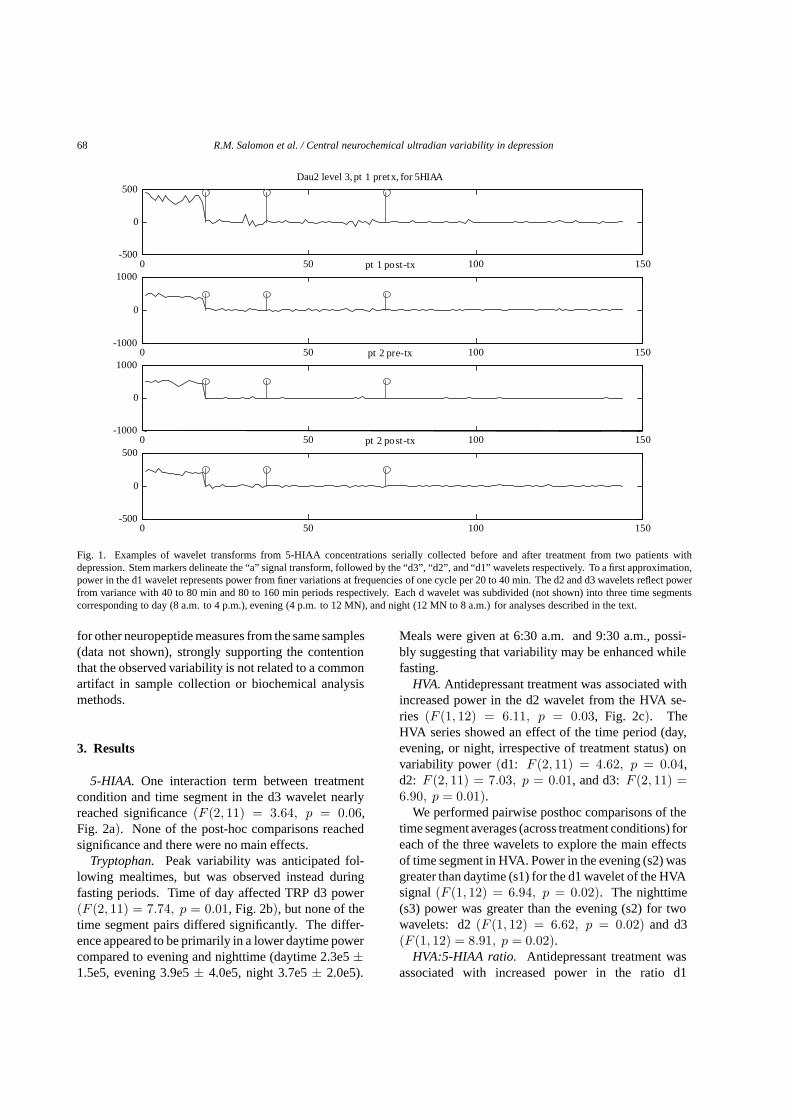
Wavelet transforms (Fig. 1) characterize abruptchanges in signals, localizing power in bandwidths ofevent proximities, conserving orthogonal and powerproperties relevant to statistical analyses, and back-transforming faithfully. Transform parts, called “a”,and “d”, are calculated in an iterative process. Eachiteration, m, smoothes the signal with a local waveletconvolution (similar to a low-pass filter) and halves thesignal length. This new “a” becomes shorter with eachlevel of the transform. At the same time, a “dm” waveletis appended, maintaining the original signal length, andrepresenting local abrupt discontinuities (changes) inthe signal (level one) or previous “a”. The local convo-lution of 4 sequential points with the wavelets to form“dm” demonstrates progressively coarser variability inthe original signal. Energy (sum of squares) in d1 ismostly from fine variability (events every 20 to 40 min),d2 reflects mid-frequency variability (40 to 80 min be-tween events), and d3 reflects slower variability (about80 to 160 min event intervals).
Raw signals (13 paired collections of N = 144 pointseach, all beginning at 8 am and spanning 24 hours)were transformed to level 3 using the Daubechies 2wavelet transform [8] using a custom-written programfor MATLAB (The Mathworks, Inc., Natick, MA). Re-sulting d1, d2, and d3 wavelets were segmented to rep-resent daytime (s1, 8 a.m. to 4 p.m.), evening (s2,4 p.m. to 12 midnight), and nighttime (s3: 12 midnightto 8 a.m.) time periods. The power (sum of squares ofthe d coefficients in the time segment) was calculatedfor each of these nine time segments (wavelet × ‘timeof day’).
Main effects and interactions of time segment andtreatment condition were analyzed using repeated mea-sures analysis of variance (ANOVA) tests. Time seg-ment (morning/afternoon/evening) and treatment con-dition (pre-treatment/post-treatment)were both within-subjects factors in this doubly repeated model. Allstatistics are two-tailed with α = 0.05, and meansare reported as mean ± standard deviation. Signifi-cant findings were followed by post-hoc analyses, forwhich alpha was adjusted for multiple comparisons(e.g. 0.025 for main effect of segment). Analyses wereperformed using the SAS statistical package (version8.1 SAS Institute Inc., Cary, NC).
Quality assurance procedure: A comparison of re-sults among the four (5-HIAA, TRP, HVA, and ratio)time series was performed to exclude artifacts due toshared signal properties. Wavelet profiles (Fig. 1) andthe power values from them differed among the fourchemical time-series traces studied by HPLC and also
68 R.M. Salomon et al. / Central neurochemical ultradian variability in depression
0 50 100 150-500
0
500Dau2 level 3, pt 1 pretx, for 5HIAA
0 50 100 150-1000
0
1000pt 1 post-tx
0 50 100 150-1000
0
1000pt 2 pre-tx
0 50 100 150-500
0
500pt 2 post-tx
Fig. 1. Examples of wavelet transforms from 5-HIAA concentrations serially collected before and after treatment from two patients withdepression. Stem markers delineate the “a” signal transform, followed by the “d3”, “d2”, and “d1” wavelets respectively. To a first approximation,power in the d1 wavelet represents power from finer variations at frequencies of one cycle per 20 to 40 min. The d2 and d3 wavelets reflect powerfrom variance with 40 to 80 min and 80 to 160 min periods respectively. Each d wavelet was subdivided (not shown) into three time segmentscorresponding to day (8 a.m. to 4 p.m.), evening (4 p.m. to 12 MN), and night (12 MN to 8 a.m.) for analyses described in the text.
for other neuropeptide measures from the same samples(data not shown), strongly supporting the contentionthat the observed variability is not related to a commonartifact in sample collection or biochemical analysismethods.
3. Results
5-HIAA. One interaction term between treatmentcondition and time segment in the d3 wavelet nearlyreached significance (F (2, 11) = 3.64, p = 0.06,Fig. 2a). None of the post-hoc comparisons reachedsignificance and there were no main effects.
Tryptophan. Peak variability was anticipated fol-lowing mealtimes, but was observed instead duringfasting periods. Time of day affected TRP d3 power(F (2, 11) = 7.74, p = 0.01, Fig. 2b), but none of thetime segment pairs differed significantly. The differ-ence appeared to be primarily in a lower daytime powercompared to evening and nighttime (daytime 2.3e5 ±1.5e5, evening 3.9e5 ± 4.0e5, night 3.7e5 ± 2.0e5).
Meals were given at 6:30 a.m. and 9:30 a.m., possi-bly suggesting that variability may be enhanced whilefasting.
HVA. Antidepressant treatment was associated withincreased power in the d2 wavelet from the HVA se-ries (F (1, 12) = 6.11, p = 0.03, Fig. 2c). TheHVA series showed an effect of the time period (day,evening, or night, irrespective of treatment status) onvariability power (d1: F (2, 11) = 4.62, p = 0.04,d2: F (2, 11) = 7.03, p = 0.01, and d3: F (2, 11) =6.90, p = 0.01).
We performed pairwise posthoc comparisons of thetime segment averages (across treatment conditions) foreach of the three wavelets to explore the main effectsof time segment in HVA. Power in the evening (s2) wasgreater than daytime (s1) for the d1 wavelet of the HVAsignal (F (1, 12) = 6.94, p = 0.02). The nighttime(s3) power was greater than the evening (s2) for twowavelets: d2 (F (1, 12) = 6.62, p = 0.02) and d3(F (1, 12) = 8.91, p = 0.02).
HVA:5-HIAA ratio. Antidepressant treatment wasassociated with increased power in the ratio d1

R.M. Salomon et al. / Central neurochemical ultradian variability in depression 69
Ratio n=13, 95% CI
Wavelet Segment
TRP n=13 95%CI
Wavelet Segment
Pow
er
HVA n = 13 95% CI5-HIAA n = 13, 95%CI
Pow
er
a
b
c
d
Fig. 2. Mean time segment power from Daubechies 2 wavelet transforms of (a) 5-HIAA series, (b) TRP series, (c) HVA series, and (d)5-HIAA:HVA ratio series from depressed patients before and after antidepressant treatment. Significant differences discussed in text. (n = 13,mean 95% confidence interval).
(F (1, 12) = 9.12, p = 0.01, Fig. 2d), d2 (F (1, 12) =5.70, p = 0.03), and d3 (F (1, 12) = 4.72, p = 0.05)wavelet series. These effects were observed evenlyacross most subjects (Fig. 3). This finding stronglysupports the hypothesis that treatment would be associ-ated with changes in variability in monoamine systeminteractions.
4. Discussion
Mechanisms that regulate CNS neurochemical vari-ability may be involved in the pathophysiology of de-pression. We report here that variability in neurochem-ical signals changed significantly after treatment withantidepressant medications for five weeks, with most
remarkable increases in the variability of the ratio ofserotonin to dopamine metabolites. This may implythat healthy moods are associated with a degree of in-dependence and autonomy of monoaminergic systemsthat is diminished in depression. Variability was deter-mined by as power in the wavelet transforms of sero-tonin and dopamine metabolite levels in q10 min, se-rial CSF samples collected for 24 hours. The findingsuggests that variability carries information that is notincluded in measures of mean activity or levels, andthat may be relevant to depression pathophysiologyandtreatment. The ‘stuckness’ of neurochemical activitymay be a predictor of the ‘stuckness’ of moods.
Greatest treatment-associated change in variabilitywas observed in the signal generated from the ratio ofHVA:5-HIAA, where a consistent and sizeable increasein power was observed across wavelets and through

70 R.M. Salomon et al. / Central neurochemical ultradian variability in depression
Ratio d3s3 Power by Patient
Patient Number
0 2 4 6 8 10 12 14
Pow
er
0
1
2
3
4
Pre-tx d3s3Post-tx-d3s3
Fig. 3. Power in d3 nighttime (s3) segments by patient before and after treatment. (paired t(12) = −2.463, p = 0.03).
each of the daytime segments. This appears to indi-cate increased independence of these monoaminergicsystems, and was strongest for high frequency events(20–40 min intervals) in the evening (4 p.m. to mid-night) and nighttime (midnight to 8 a.m.) segments.The synchrony of these systems prior to treatment mayrepresent a baseline deficit in independence, or it maybe that the increased independence after treatment rep-resents a treatment effect unrelated to antidepressantmechanisms of action. Healthy control data is beingcollected in the same manner in order to begin to ad-dress this question. However, it is notable that both an-tidepressants, one with serotonergic and the other withcatecholaminergic activity, were associated with sim-ilar enhancements of independence of the transmitterturnover signals.
Individually, variability power in the signal from theserotonin metabolite, 5-HIAA, trended towards a de-cline after treatment. A larger sample size might re-veal that treatment suppresses variability in the night-time turnover of central serotonin, or alternatively, thatserotonin turnover variability is enhanced in depres-sion. This is consistent with observations of REM sup-pression during antidepressant treatment, putatively re-lated to decreased variability at night. Direct correla-tions with REM suppression are needed to validate thissupposition.
At the same time, variability of TRP (the serotoninprecursor) levels in CSF was weakest in the daytime
(compared to evening and nighttime), with no signifi-cant change related to treatment. This may suggest thatthe TRP supply from the bloodstream is more stablearound mealtimes, and also indicates that variability inTRP, the serotonin precursor, was not directly relatedto variability in the metabolite of serotonin.
The variability of the dopamine metabolite, HVA,increased significantly in power in the mid-frequency(40–80 min/cycle) after treatment. Most of thistreatment-associated increase was observed at night inthis mid-frequency bandwidth, contrasting with the de-cline in 5-HIAA at slower frequencies that also ap-peared at night.
These wavelet transform analyses support the hy-pothesis that variability in neurochemical activitychanges with treatment, as was previously suggestedusing Fourier transforms ([19], under review). Differ-ences in the findings are of interest. Fourier analy-ses detect only strictly rhythmic patterns that must belocked in phase over the analyzed time segment, whilethe wavelet transform is more sensitive to local singu-lar, closely linked, or irregularly occurring events. Bothanalyses suggest that post-treatment enhancement invariability in the HVA:5-HIAA ratio may be a responsemarker.
These studies remain preliminary and will requirereplication. Between-subjects variables (age, gender,diagnosis and subtype, baseline mood severity, treat-
R.M. Salomon et al. / Central neurochemical ultradian variability in depression 71
ment used, treatment response) were not included inthis preliminary analysis due to the small number ofsubjects (n = 13). In part, the use of two treat-ments and the diversity of diagnostic subtypes deliber-ately allowed detection of a putatively universal featureof depression, diminished variability in neurochemi-cal systems. Also, a study of prolonged CSF collec-tion with absolutely strict diagnostic inclusion criterionwould be impossible to complete because of recruit-ment challenges. Replication and extension studies willneed to show subgroup differences and shared features,and identify features that predict treatment preferences,treatment resistance, and high mortality.
A diminished neurochemical variability model re-ported here fits existing data on the neurobiologyof depression, and may explain the pathophysiologyand psychopathology of depression subtypes. Ultra-dian components of variability are important since,in healthy individuals, subtle but appreciable moodchanges frequently occur over the course of minutes tohours. For example, consider the range of moods thatmost people experience while watching sports eventsor theater presentations. Contrasts between depressionand health may lie in the diminished recruitment andutilization of healthy fluctuations in mental processing.
Brief comment on dynamic neurochemical models ofdepression
The present dynamic neurochemical analyses con-trast with metrics that treat behavior, brain physiology,and transmitter neurochemistry as static conditions, ob-served over time but expressed as a mean with a pop-ulation variance. Dynamic measures of motor [5] andsocial activity [21], and also of plasma tryptophan lev-els [7] have shown diminished variability in depres-sion. Rhythms in actigraphy are also blunted in child-hood and adolescent depression [4]. Activity phasesrelative to time of day and duration of wakefulness areindependent, but non-additive factors controlling sub-jective reports of mood in healthy subjects [6]. Neu-roendocrine responses also show ultradian variability,but altered central monoamine variability has not beenshown previously.
In melancholia, more frequent and more lethal sui-cide attempts [13], represent diminished variability inthought processes and central neurochemistry. Melan-cholia is more consistently associated with disruptedanterior cingulate cortical function than other depres-sion subtypes [16] and with a defective intracellularlinkage through second messenger systems coupled tothe serotonin-2a receptor [2] that would be expected tofunctionally disrupt cellular variability.
5. Conclusions
Neurochemical variability changes during antide-pressant treatment, possibly reflecting a mood-deter-mining process. Alternatively, this finding may be anartifact of treatment, not associated with mood patho-physiology, but other findings in behavioral or periph-eral monoaminergic markers are consistent with an in-terpretation that the present findings represent truly al-tered dynamics of central monoaminergic function indepression. Most notably, the HVA:5HIAA ratio vari-ability increased significantly, suggesting an increasein independence between the two monoamine systemswith treatment.
Variability was determined over time intervals rele-vant to mood behaviors. At a minimum, these anal-yses suggest that further study is warranted to ascer-tain whether variability in neurobiological activity indepression can be used as a general marker in depres-sion. The main limitations in this study were the smallnumber of subjects and the absence of healthy controlcomparison data, which are in turn related to the inva-siveness of the procedure. Although invasive methodsmay be justified by the severe morbidity and mortalitycaused by depression, general application of the lessonsfrom these studies will require the development of lessinvasive methods of detection of central neurochemicalrhythms.
In the interim, further clarification of variability char-acteristics in neurochemical measures from CSF willbe needed to design imaging or other methods to de-tect neurochemical variability using less invasive mea-surement methods. Monoaminergic systems displayultradian variability (and other systems are likely to, aswell), but most of the currently available brain imagingmethods measure regionally global activity that is notspecific to single neurochemical systems. Detectionand descriptions of spontaneous variability character-istics in brain functions may allow an identification ofhomogeneous populations with similar disturbances ofneurochemical variability, and then permit investiga-tions into genetic regulators of spontaneous variability.
Acknowledgements
The authors are grateful to Douglas Hardin, Ph.D.,Associate Professor of Mathematics, Vanderbilt Uni-versity, and to Elizabeth Stringer and Reuben Fan forguidance and assistance with mathematical analyses.Statistical assistance from Jennifer Urbano Blackford,

72 R.M. Salomon et al. / Central neurochemical ultradian variability in depression
Ph.D., Vanderbilt Kennedy Center for Research on Hu-man Development (NICHD Grant P30 HD15052) isgratefully acknowledged. This work was funded bygrants to RMS (K23 MH01828, the Stanley Founda-tion, NARSAD, and an investigator-initiated grant fromPfizer, Inc.) and to the Vanderbilt General ClinicalResearch Center (M01 RR00095).
References
[1] M. Akay, Y.M. Akay, P. Cheng and H.H. Szeto, Investigatingthe effects of opioid drugs on electrocortical activity usingwavelet transform, Biol Cybern 72 (1995), 431–437.
[2] D. Akin, D.H. Manier, E. Sanders-Bush and R.C. Shelton, De-creased Serotonin 5-HT(2A) Receptor-Stimulated Phospho-inositide Signaling in Fibroblasts from Melancholic DepressedPatients, Neuropsychopharmacology 29 (2004), 2081–2087.
[3] American Psychiatric Association, Diagnostic and StatisticalManual of Mental Disorders, (Fourth ed.), Washington, DC,APA, 1994.
[4] R. Armitage, R. Hoffmann, G. Emslie, J. Rintelman, J. Mooreand K. Lewis, Rest-activity cycles in childhood and adolescentdepression, J Am Acad Child Adolesc Psychiatry 43 (2004),761–769.
[5] O. Benoit, S. Royant-Parola, A.A. Borbely, I. Tobler and D.Widlocher, Circadian aspects of motor activity in depressedpatients, Acta Psychiatr Belg 85 (1985), 582–592.
[6] D.B. Boivin, C.A. Czeisler, D.J. Dijk, J.F. Duffy, S. Folkard,D.S. Minors, P. Totterdell and J.M. Waterhouse, Complex in-teraction of the sleep-wake cycle and circadian phase modu-lates mood in healthy subjects, Arch Gen Psychiatry 54 (1997),145–152.
[7] M. Candito, D. Pringuey, A. Iordache, E. Souetre, P. Cham-bon and G. Darcourt, Circadian variation in total plasma tryp-tophan. Antidepressant treatment: drugs and phase advance,Life Sci 50 (1992), PL71–74.
[8] I. Daubechies, Ten Lectures on Wavelets, SIAM, Philadelphia,PA, 1990.
[9] G. Engstrom, C. Alling, K. Blennow, G. Regnell and L.Traskman-Bendz, Reduced cerebrospinal HVA concentrationsand HVA:5-HIAA ratios in suicide attempters. Monoaminemetabolites in 120 suicide attempters and 47 controls, EurNeuropsychopharmacol 9 (1999), 399–405.
[10] M.B. First, R.L. Spitzer, M. Gibbon and J.B.W. Williams,Structured Clinical Interview for DSM-IV Axis I Disorders(SCID-I/P), (Version 2.0), Biometrics Research Department,
New York State Psychiatric Institute, 722 West 168th Street,NY 10032, 1996.
[11] M.B. First, R.L. Spitzer, M. Gibbon, J.B.W. Williams andL. Benjamin, Structured Clinical Interview for DSM-IV AxisII Personality Disorders (SCID-II), (Version 2.0), BiometricsResearch Department, New York State Psychiatric Institute,722 West 168th Street, NY 10032, 1996.
[12] K.N. Fountoulakis, A. Iacovides, P. Grammaticos, G. St.Kaprinis and P. Bech, Thyroid function in clinical subtypesof major depression: an exploratory study, BMC Psychiatry 4(2004), 6.
[13] M.F. Grunebaum, H.C. Galfalvy, M.A. Oquendo, A.K. Burkeand J.J. Mann, Melancholia and the probability and lethalityof suicide attempts, Br J Psychiatry 184 (2004), 534–535.
[14] C. Mazure, J.C. Nelson and L.H. Price, Reliability and Valid-ity of the Symptoms of Major Depressive Illness, Arch GenPsychiatry 43 (1986), 451–456.
[15] E.D. Risby, J.K. Hsiao, T. Sunderland, H. Agren, M.V. Rudor-fer and W.Z. Potter, The effects of antidepressants on the cere-brospinal fluid homovanillic acid:5-hydroxyindoleacetic acidratio, Clin Pharmacol Ther 42 (1987), 547–554.
[16] M.A. Rogers, M.A. Bellgrove, E. Chiu, C. Mileshkin andJ.L. Bradshaw, Response selection deficits in melancholic butnot nonmelancholic unipolar major depression, J Clin ExpNeuropsychol 26 (2004), 169–179.
[17] D.N. Ruskin, D.A. Bergstrom, D. Baek, L.E. Freeman and J.R.Walters, Cocaine or selective block of dopamine transportersinfluences multisecond oscillations in firing rate in the globuspallidus, Neuropsychopharmacology 25 (2001), 28–40.
[18] R.M. Salomon, J.S. Kennedy, B.W. Johnson Jr., D.E. Schmidt,J. Kwentus, H.E. Gwirtsman and M.H. Ebert, Association ofa critical CSF tryptophan threshold level with depressive re-lapse, Neuropsychopharmacology 28 (2003), 956–960. Epub2003 Mar 19.
[19] R.M. Salomon, J.S. Kennedy, B.W. Johnson Jr., J.U. Black-ford, D.E. Schmidt, J. Kwentus, H.E. Gwirtsman, J.F. Goudaand R.G. Shiavi, Treatment enhances ultradian rhythms ofCSF monoamine metabolites in patients with major depres-sive episodes, Neuropsychopharmacology, Epub 2005, aheadof print April 27.
[20] D.E. Schmidt, M.L. Roznoski and M.H. Ebert, Qualitative andquantitative HPLC analysis of monoamine neurotransmittersand metabolites in CSF and brain tissue using reductive elec-trochemical detection, Biomedical Chromotography 4 (1990),215.
[21] M.P. Szuba, A. Yager, B.H. Guze, E.M. Allen and L.R. BaxterJr., Disruption of social circadian rhythms in major depression:a preliminary report, Psychiatry Res 42 (1992), 221–230.

Submit your manuscripts athttp://www.hindawi.com
Stem CellsInternational
Hindawi Publishing Corporationhttp://www.hindawi.com Volume 2014
Hindawi Publishing Corporationhttp://www.hindawi.com Volume 2014
MEDIATORSINFLAMMATION
of
Hindawi Publishing Corporationhttp://www.hindawi.com Volume 2014
Behavioural Neurology
EndocrinologyInternational Journal of
Hindawi Publishing Corporationhttp://www.hindawi.com Volume 2014
Hindawi Publishing Corporationhttp://www.hindawi.com Volume 2014
Disease Markers
Hindawi Publishing Corporationhttp://www.hindawi.com Volume 2014
BioMed Research International
OncologyJournal of
Hindawi Publishing Corporationhttp://www.hindawi.com Volume 2014
Hindawi Publishing Corporationhttp://www.hindawi.com Volume 2014
Oxidative Medicine and Cellular Longevity
Hindawi Publishing Corporationhttp://www.hindawi.com Volume 2014
PPAR Research
The Scientific World JournalHindawi Publishing Corporation http://www.hindawi.com Volume 2014
Immunology ResearchHindawi Publishing Corporationhttp://www.hindawi.com Volume 2014
Journal of
ObesityJournal of
Hindawi Publishing Corporationhttp://www.hindawi.com Volume 2014
Hindawi Publishing Corporationhttp://www.hindawi.com Volume 2014
Computational and Mathematical Methods in Medicine
OphthalmologyJournal of
Hindawi Publishing Corporationhttp://www.hindawi.com Volume 2014
Diabetes ResearchJournal of
Hindawi Publishing Corporationhttp://www.hindawi.com Volume 2014
Hindawi Publishing Corporationhttp://www.hindawi.com Volume 2014
Research and TreatmentAIDS
Hindawi Publishing Corporationhttp://www.hindawi.com Volume 2014
Gastroenterology Research and Practice
Hindawi Publishing Corporationhttp://www.hindawi.com Volume 2014
Parkinson’s Disease
Evidence-Based Complementary and Alternative Medicine
Volume 2014Hindawi Publishing Corporationhttp://www.hindawi.com