Central Minnesota Sustainable Development Plan the Process for the... · The Central Minnesota...
36
!"##$%& ()* +,-.*// 0-, 1-,* $%2-,1"($-% 2-, ()* 3.*%",$-/ "%4 0567 /** 8889,*/$:$*%(,*&$-%9-,& " ### The Central Minnesota Sustainable Development Plan creating a Resilient Region Central Minnesota Sustainable Development Plan MAPPING THE PROCESS Zach Tagar, University of Minnesota Outline: 1. Problem description Geographic Information Systems (GIS) was used for two discrete purposes in the project: presentation and analysis. For the former, a series of maps was created to visualize aspects of sustainability planning, especially when several scenarios were compared. For the latter, various geographic data was obtained and analysis performed to derive results on key sustainability issues identified. 2. Investigation a. Modeling process (Scenarios, Working Groups; 22 Key Issues; model – variables, change/scenario, relationships, weighting) b. Testing model: challenges (generalization and simplification, discarding complex maps (expert group, preparing for public presentation, realizing it is too complex, deriving 9 key issues spread across working groups (with help of experts, Kathy, core consultant group). c. Key issues described: (software, data, calculations, output) Identification of key issues and Development of Four Scenarios The project was formed to address sustainability planning around four working groups composed of experts and community members which were created to guide the modeling process as it relates to land use, housing, economic development and transportation. In early stages, these groups consolidated a list of 27 key issues to be addressed (appendix A, “Region Five Sustainability Project Key Issues Overview”) 1 . The issues identified covered a very wide aspect of planning domains with a significant degree of interrelation, for example infrastructure, employment, public transit and affordable housing. 1 Key Issues 3
Transcript of Central Minnesota Sustainable Development Plan the Process for the... · The Central Minnesota...

!"##$%&'()*'+,-.*//! 0-,'1-,*'$%2-,1"($-%'
2-,'()*'3.*%",$-/'"%4'0567' /**'8889,*/$:$*%(,*&$-%9-,&'
"!
!
!
! ! ! ! ! ! ! ! ! ! ! ! ! ###!
The Central Minnesota
Sustainable Development Plan
creating a
Resilient Region
Central Minnesota Sustainable
Development Plan MAPPING THE PROCESS
Zach Tagar, University of Minnesota
Outline:
1. Problem description
Geographic Information Systems (GIS) was used for two discrete purposes in the project:
presentation and analysis. For the former, a series of maps was created to visualize aspects of
sustainability planning, especially when several scenarios were compared. For the latter, various
geographic data was obtained and analysis performed to derive results on key sustainability
issues identified.
2. Investigation
a. Modeling process (Scenarios, Working Groups; 22 Key Issues; model – variables,
change/scenario, relationships, weighting)
b. Testing model: challenges (generalization and simplification, discarding complex maps
(expert group, preparing for public presentation, realizing it is too complex, deriving 9
key issues spread across working groups (with help of experts, Kathy, core consultant
group).
c. Key issues described: (software, data, calculations, output)
Identification of key issues and Development of Four Scenarios
The project was formed to address sustainability planning around four working groups composed of
experts and community members which were created to guide the modeling process as it relates to land
use, housing, economic development and transportation. In early stages, these groups consolidated a list
of 27 key issues to be addressed (appendix A, “Region Five Sustainability Project Key Issues
Overview”)1. The issues identified covered a very wide aspect of planning domains with a significant
degree of interrelation, for example infrastructure, employment, public transit and affordable housing.
!!!!!!!!!!!!!!!!!!!!!!!!!!!!!! !!!!!!!!!!!!!!!!!!!!!!!!!!!!!1
Key Issues 3
!
!

!"##$%&'()*'+,-.*//! 0-,'1-,*'$%2-,1"($-%'
2-,'()*'3.*%",$-/'"%4'0567' /**'8889,*/$:$*%(,*&$-%9-,&'
$!
!
!
! ! ! ! ! ! ! ! ! ! ! ! ! ###!
The Central Minnesota
Sustainable Development Plan
creating a
Resilient Region
With the object of envisioning the region in 2035, a scenario approach was adopted. Four scenarios were
developed, with a narrative description characterizing each: abundance, bootstrap, current trends and
doomsday (conveniently referred to as A, B, C and D) (appendix B). Scenario planning is a technique
used by businesses, communities, and the military which focuses on using today’s decisions to reach a
desired, plausible future. By adopting this planning strategy community members were able to choose
their preferred future, incorporating land use, economic, demographic, natural resource, transportation,
and housing aspects. The envisioning process, to be driven by community members, was to be done
through presenting all key issues under each of the scenarios so that community members may opt for
the best fitting planning scenario.
After creating a profile of the region based on current trends, the work groups/consortium described the
following four scenarios:
The abundance scenario is characterized by a healthy natural environment, diverse cost- and energy-
efficient transportation options, increased government revenue without increasing taxes, and well-funded
education. The region benefits from a strong, diversified economy, employment opportunities, excellent
medical care, and many affordable housing options.
The bootstrap scenario envisions a strong, self-reliant, and efficient region. The economy focuses on
producing and keeping resources—food, energy, etc.—in the region, and governments are forced to
collaborate due to decreased funding. The health care system is competitive, the transportation system is
effective and efficient, and neighborhoods are mixed-use and multigenerational. The region lives within its
means but still meets the needs of its residents and manages to grow sustainably.
The third scenario is current trends and focuses on what happens if the region continues on the path it is
on. The economy is slightly more diversified, with a growing health care sector to accommodate the
growing number of retirees. The transportation system is maintained but does not expand, and water
quality continues to deteriorate because land use regulations have not changed. Schools are forced to
consolidate and energy costs are inconsistent, but on the rise.
The final scenario, doomsday, is reminiscent of the Great Depression of the 1930s. An extreme dustbowl-
like climate has settled over Minnesota, drying up the region’s lakes and wetlands. Government
resources are virtually non-existent and population has plummeted. Fuel is rationed and people must rely
on their survival skills.
An initial attempt to model all key issues under the four scenarios, including the interrelations between the
issues, took place early in the year. A meeting of experts was called, in which the project aimed to
develop model parameters such as appropriate variables for each key issue, a change factor per variable
for each of the scenarios, identification of other issues that impact the variable, and determination of their
impact weight (see figure 1).

!"##$%&'()*'+,-.*//! 0-,'1-,*'$%2-,1"($-%'
2-,'()*'3.*%",$-/'"%4'0567' /**'8889,*/$:$*%(,*&$-%9-,&'
%!
!
!
! ! ! ! ! ! ! ! ! ! ! ! ! ###!
The Central Minnesota
Sustainable Development Plan
creating a
Resilient Region
!
!
!
!
!
!
!
!
!
!
!
!
!
!
;1#".('8*$&)(! <*$&)(*4'=":>*!
! &! '! (! )!
?@9A! BCD9E! FEB9F! GE@9B! EADH9B!
!
!
*+,-./!!"!0!12345/!42.23/6/.7!89.!6:/!;/<!+77-/!98!2,+=,!494-526+9=$!
!!!!!!!!!!!!!!!!!!!!!!!!!!!!!! !!!!!!!!!!!!!!!!!!!!!!!!!!!!!2 In this example, the variable of “impaired waters (area)” is determined for the key issue of healthy lakes
(land use working group). The current extent of impaired water in the region is 910.3 sq. Km, which
informs the change factor of “1” for scenario C (current trends) (assuming no change for this scenario).
Change factors are determined for the other scenarios: 0.5 for A (abundance), 0.8 for B (bootstrap) and
1.2 for D (doomsday).2 This variable is considered internal, i.e. dependent on regional policy choices, with
a long timeframe. Subsequently, an impacting variable is determined: percentage of properties served by
sewer. (This variable, too, has its own change factor per scenario). It is assigned the impact weight of
negative 0.2 reflecting the expected improvement in water impairment with increased wastewater
treatment.
The final, weighted value of the variable is calculated as:
([Current Value] * [Scenario Change Factor]) + ([Current Value] * [Scenario Change Factor]) * [Scenario
Change Factor for Impacting Variable] * [Impact Weight]
!

!"##$%&'()*'+,-.*//! 0-,'1-,*'$%2-,1"($-%'
2-,'()*'3.*%",$-/'"%4'0567' /**'8889,*/$:$*%(,*&$-%9-,&'
>!
!
!
! ! ! ! ! ! ! ! ! ! ! ! ! ###!
The Central Minnesota
Sustainable Development Plan
creating a
Resilient Region
The outcome of the experts meeting made clear, however, that this modeling approach is overly
complicated. The group was unable to provide effective input on most of the variables, and discussions
led to an increased level of complexity and detail rather than the desired generalizations. The concern
was not only that the groups would be unable to provide the parameters needed for the envisioned
model, but also that the resulting complexity would burden the community consultation process and
deprive the project of its main tenet.
In consultation with the core team of experts, core group of consultants and project director, a limited set
of key issues was selected to be addressed. It includes the following:
1. Population and aging
2. Housing – affordability
3. Health care
4. Education
5. Natural resources (water and public space)
6. Economy – livable wage / Poverty rate
7. Land use – growth patterns
8. Transportation - mobility
9. Broadband
With this more manageable list of key issues, the project proceeded to prepare planning scenarios for the
community consultation process. A variable was defined for each key issue (for example, the variable of
“percent of the population over 65” describes the key issue of aging population). Further, for every key
issue, a change factor was derived in consultation with the core team of consultants for each scenario.
Each of the (final) key issues was illustrated conveying expected changes per scenario for the community
consultation process. Participants were required to select the 2035 reality they choose to plan for by
voting for a scenario for each key issue.
Scenarios per key issues were created and illustrated using GIS software (Esri ArcMAP suite) as well as
Microsoft Excel. While some key issues required simple calculations and graphic representations of
alternative scenario outcomes, others required more extensive geographic analysis. Initially, maps were
produced showing variations by county or lower units of analysis such as census blocks. For
simplification purposes, however, most of the maps that were shared with the public presented the entire
five-county region as a single unit for quantitative data, showing variation across scenarios but not within
the region.
Process and data sources for each key issue are outlined below, including:
• Variable used to describe changes in key issue
• Data and data source
• Mapping methodology
• Change factor per scenario
• Results
!"##$%&'()*'+,-.*//! 0-,'1-,*'$%2-,1"($-%'
2-,'()*'3.*%",$-/'"%4'0567' /**'8889,*/$:$*%(,*&$-%9-,&'
?!
!
!
! ! ! ! ! ! ! ! ! ! ! ! ! ###!
The Central Minnesota
Sustainable Development Plan
creating a
Resilient Region
Below is a description of the mapping process for each key issue.
1. Population and aging
Variable: Percentage of the population over 65.
Mapping methodology: A time enabled map was created using ArcMAP 10, showing the variable using
color gradation in 5-year intervals per scenario. The extent of the aging process predicted (generally) in
the US is effectively presented in a time series map, though that requires computer presentation. Only the
2035 map was presented to the community, in comparison with the 2010 data.
Data sources: A table produced by the Minnesota State Demographic Center, titled
"ProjectionsAgeGender2005-2035".3 This is a population projection based on data prior to the 2010
census, so the 2010 population figures diverge somewhat from most accurate data available. This was
not corrected however because the entire projection was based on that data and a more recent projection
is not available at the time of writing.
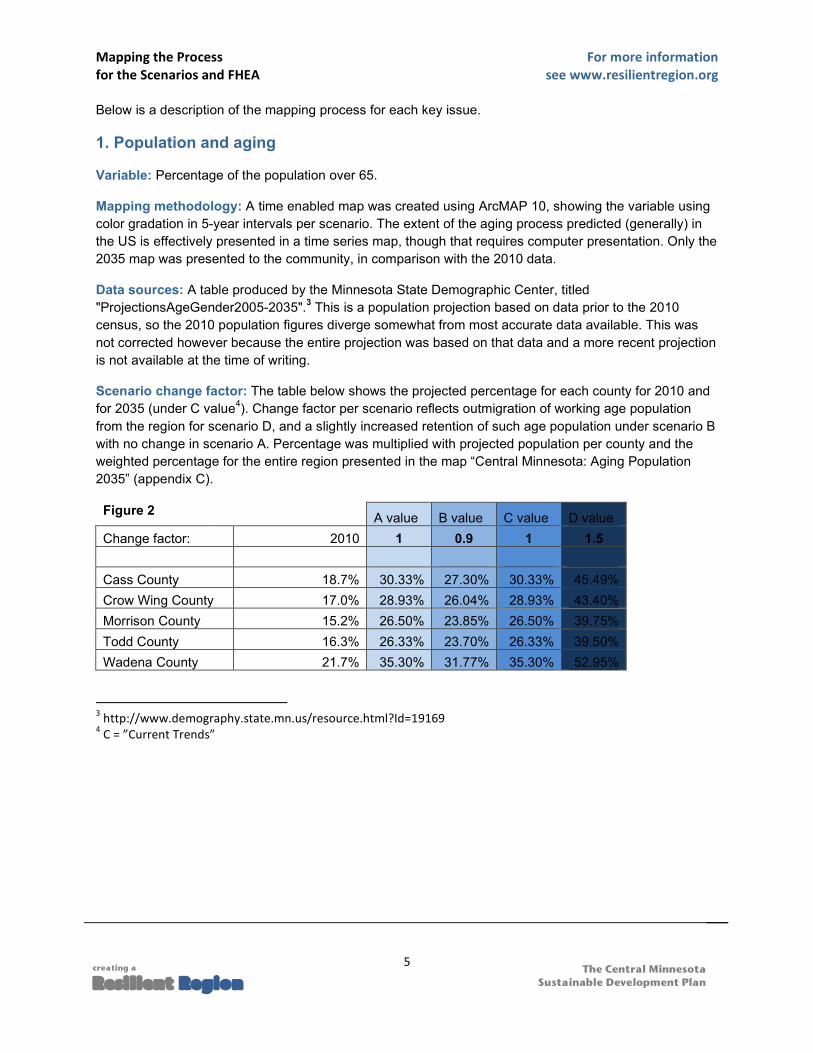
Scenario change factor: The table below shows the projected percentage for each county for 2010 and
for 2035 (under C value4). Change factor per scenario reflects outmigration of working age population
from the region for scenario D, and a slightly increased retention of such age population under scenario B
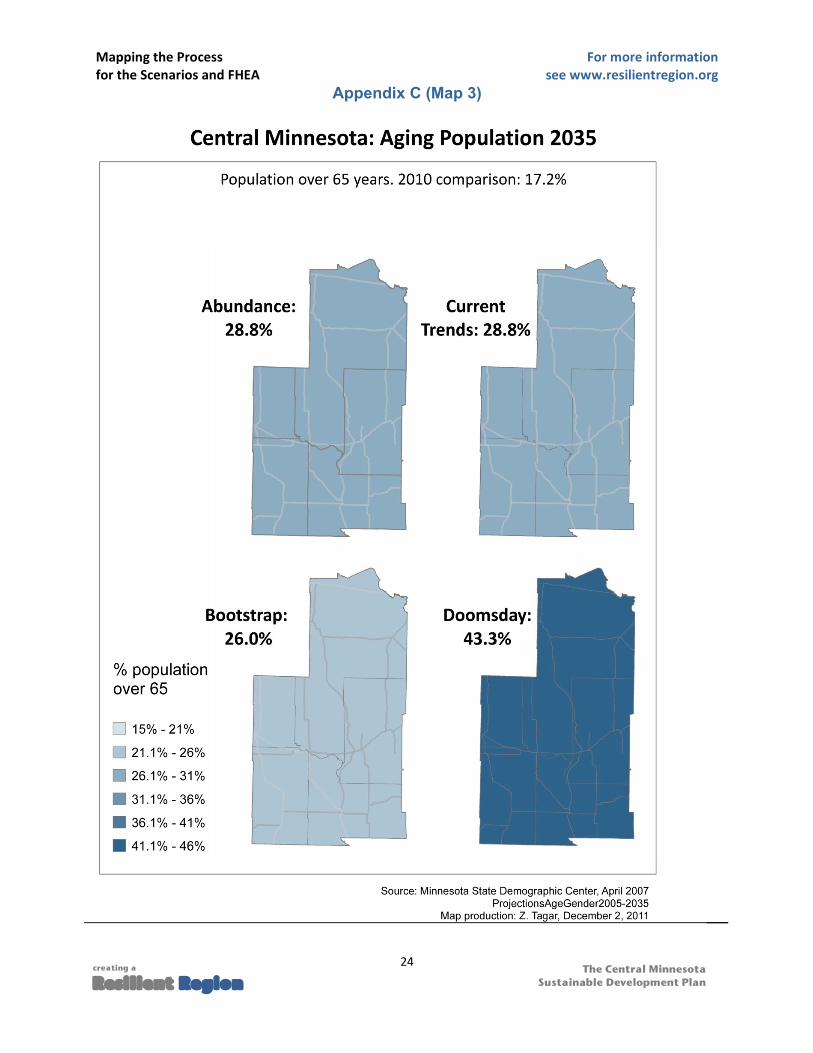
with no change in scenario A. Percentage was multiplied with projected population per county and the
weighted percentage for the entire region presented in the map “Central Minnesota: Aging Population
2035” (appendix C).!!
Figure 2 ! A value B value C value D value
Change factor: 2010 1 0.9 1 1.5
Cass County 18.7% 30.33% 27.30% 30.33% 45.49%
Crow Wing County 17.0% 28.93% 26.04% 28.93% 43.40%
Morrison County 15.2% 26.50% 23.85% 26.50% 39.75%
Todd County 16.3% 26.33% 23.70% 26.33% 39.50%
Wadena County 21.7% 35.30% 31.77% 35.30% 52.95%
!!!!!!!!!!!!!!!!!!!!!!!!!!!!!! !!!!!!!!!!!!!!!!!!!!!!!!!!!!!%!:6640@@AAABC/39,.24:<B7626/B3=B-7@./79-.D/B:635EFCG"H"IH!>!(!G!J(-../=6!K./=C7J!
!
!
!
!
!
!
!
!
!
!
!
!
!

!"##$%&'()*'+,-.*//! 0-,'1-,*'$%2-,1"($-%'
2-,'()*'3.*%",$-/'"%4'0567' /**'8889,*/$:$*%(,*&$-%9-,&'
I!
!
!
! ! ! ! ! ! ! ! ! ! ! ! ! ###!
The Central Minnesota
Sustainable Development Plan
creating a
Resilient Region
2. Housing (affordability)
The project’s work on housing affordability was extensive. As a base, the extent of regional need for
affordable housing was mapped with the variable of “percentage of lower-income households spending
30% or more of income on Housing”. In subsequent analysis and modeling, additional variables were
used including commute time, employment, population and existing housing. These are detailed in the
affordability modeling description.
A. Need for affordable housing Variable: Percentage of Lower-Income Households Spending 30% or More of Income on Housing
Mapping methodology: The 2011 Affordable Housing Need map represents the data in the table
based using a graduate color scheme whereby darker colors stand for higher need (i.e. a greater
percentage of the population spending 30% or more of income on housing). Note that areal units are
census tracts and not counties, unlike most other datasets used for the project. This created some
challenges for analysis when combined with other variables, see discussion on housing affordability
modeling.
Data sources: That data, which was available at a census tract unit, represents the “Percentage of
Lower-Income Households Spending 30% or More of Income on Housing”.5 The option of including
commute cost in the base data on housing affordability was considered, but rejected as that variable
was included in other ways in the affordability modeling process.
Scenario change factor: The table below shows the projected percentage of lower-income
households spending 30% or more of income on Housing for each county for 2011 and for 2035
under each scenario (a mean value was derived for census tracts in each county). Current trends
scenario retained 2011 values, the abundance scenario saw the need declined in half, bootstrap
scenario saw need declined to 70 percent, whereby doomsday scenario saw the need for affordable
housing double. !
!
!
!
!
!
!!!!!!!!!!!!!!!!!!!!!!!!!!!!!! !!!!!!!!!!!!!!!!!!!!!!!!!!!!!?!)2620!62L5/!+=!8+5/!3:82#M"MHHH#NOP9-7+=,)262Q!266.+L-6/0!R(S1K'&TTJB!!!
! !
!
!
!
Figure 3 ' A value B value C value D value
Change factor: 2011 0.5 0.7 1 2
Cass County 43.9% 21.96% 30.75% 43.92% 87.85%
Crow Wing County 50.2% 25.09% 35.13% 50.19% 100.00%
Morrison County 48.7% 24.37% 34.12% 48.75% 97.50%
Todd County 47.0% 23.51% 32.92% 47.03% 94.05%
Wadena County 45.5% 22.75% 31.85% 45.50% 91.01%

!"##$%&'()*'+,-.*//! 0-,'1-,*'$%2-,1"($-%'
2-,'()*'3.*%",$-/'"%4'0567' /**'8889,*/$:$*%(,*&$-%9-,&'
U!
!
!
! ! ! ! ! ! ! ! ! ! ! ! ! ###!
The Central Minnesota
Sustainable Development Plan
creating a
Resilient Region
!
B. Location-allocation model
A model process was derived using ArcGIS Model Builder to assist decision makers in determining
where to prioritize development of affordable housing units in the region. The model takes data on
need for affordable housing, commute times, employment, population and available affordable
housing units, along with data on the number of affordable housing units desired for the region.
Bringing together the variables of need and of jobs, it ranks each of the communities in the region that
has a population higher than 500, multiplies its rank by the population size and provides the number
of housing units desired for that community.
Some useful features of this model are its determination of employment opportunities for each
community, based on the number of jobs within a 20-minute commute, and its flexibility in allowing
the user to decide the importance of each variable in relation to the other by specifying “weights” for
both need and jobs variables. This provides different results that depend on policy preferences.
A detailed description of the model is presented in appendix D.
3. Health Care
Variable: Number of Licensed Physicians and Nurse Practitioners (primary care practitioners) per 1,000
people.
Mapping methodology: Two maps were produced for the health care component of the project. The first,
a graduated color choropleth map, represents the level of health care services available to residents of
the region according to a calculation of the number of primary care physicians per 1,000 people, and the
second depicts existing hospitals and clinics in the region.
I"("'/->,.*/J Data on the number of those was obtained by personal communication with Angie Sechler,
research analyst at the Minnesota Office of Rural Health & Primary Care, in October 2011.
Scenario change factor: The table below shows the projected number of primary care practitioners per
1,000 people for each county, per scenario. It also shows the total number for the whole region.
Assumptions for scenario change were as follows: an increase of 20 percent from current trends for the
abundance scenario, an increase of 10 percent for the bootstrap scenario, and a 50 percent decline for
the doomsday scenario.!!
!
Figure 4 A value B value C value D value
Change factor: 1.2 1.1 1 0.5
Cass County 1.05 0.96 0.88 0.44
Crow Wing County 3.26 2.99 2.72 1.36
Morrison County 1.01 0.93 0.84 0.42
Todd County 1.16 1.06 0.96 0.48
Wadena County 1.47 1.35 1.23 0.61
Total average: 1.94 1.78 1.62 0.81
F=D5-C+=,!O-.7/!V.2D6+6+9=/.7Q!A/+,:6/C!89.!494-526+9=B!!!

!"##$%&'()*'+,-.*//! 0-,'1-,*'$%2-,1"($-%'
2-,'()*'3.*%",$-/'"%4'0567' /**'8889,*/$:$*%(,*&$-%9-,&'
W!
!
!
! ! ! ! ! ! ! ! ! ! ! ! ! ###!
The Central Minnesota
Sustainable Development Plan
creating a
Resilient Region
4. Education Variable: Percentage persons 25 years and over with bachelor's degree or higher 2005-2009
Data: U.S. Census Bureau-American Community Survey, 2005-09
Mapping methodology: A graduated color choropleth map representing the percentage of persons 25
years and over with bachelor's degree or higher for the time period available. Change factors per scenario
were applied, resulting in four maps for comparison. !
Figure 5 ' A value B value C value D value
Change factor: 2005-09 2 1.2 1 0.5
Cass County 21.3 42.6 25.6 21.3 10.7
Crow Wing County 21.9 43.8 26.3 21.9 11.0
Morrison County 14.1 28.2 16.9 14.1 7.1
Todd County 12.0 24 14.4 12 6
Wadena County 15.1 30.2 18.1 15.1 7.6
Comments: "Current trends" projections are not expected to be different than today.
5. Natural resources (water) Variable: Lake Clarity. Initially, the variable of Impaired Waters was considered, but it proved less useful
for representation of lake health for several reasons. First, only about 40% of lakes in Minnesota are
tested for impairment. Second, impairment is often due to factors that cannot be substantially altered in
the timeframe of this projection, for example mercury concentrations in lakes, and is thus a less useful
parameter for scenario projection. Further, it is difficult to define gradation in the extent of impairment.
Another variable that was considered invasive species, but it was considered not sufficiently
representative of lake health.
The availability of time series data on lake clarity across Minnesota, which is based on
satellite imagery classification, provided very large coverage with data on most lakes in
the region. Lake clarity is an intuitive representation of lake health, and the data further
allows for trend analysis which was useful for the purpose of scenario development.
Data source: Data was provided by Prof. Marvin Bauer from the University of
Minnesota, and is the result of a long term study by the University’s Remote Sensing
and Geospatial Analysis Laboratory. It includes a dataset that covers the entire region
from 1975 through 2008, using late summer Landsat images. 6
Mapping methodology: Five maps were produced – one for current state (based on 2005/2008 data),
and one for each scenario. All lakes were represented with a color scheme ranging from red through light
to dark blue for lake clarity in meters. !
!!!!!!!!!!!!!!!!!!!!!!!!!!!!!! !!!!!!!!!!!!!!!!!!!!!!!!!!!!!I!'2D;,.9-=C!+=89.326+9=!2=C!C9D-3/=626+9=!89.!T2=C726!39=+69.+=,!98!52;/!A26/.!D52.+6<!D2=!L/!2DD/77/C!26!
AAABA26/.B-3=B/C-Q!2=C!+7!C/7D.+L/C!+=!X&!$MY</2.!T2=C726!Z26/.!(52.+6<!(/=7-7!98!N+==/7962[7!"MQMMM!T2;/7BJ !

!"##$%&'()*'+,-.*//! 0-,'1-,*'$%2-,1"($-%'
2-,'()*'3.*%",$-/'"%4'0567' /**'8889,*/$:$*%(,*&$-%9-,&'
H!
!
!
! ! ! ! ! ! ! ! ! ! ! ! ! ###!
The Central Minnesota
Sustainable Development Plan
creating a
Resilient Region
Analysis:
Current trends calculation:
a. 19857 values are subtracted from 2008 values
b. Result is divided by 23 to obtain annual change
c. 2035 values are projected as the sum of : 2008 value + (annual change * 278)
d. (For lakes that have no 2008 value, a corresponding analysis was performed based on 2005
values. Lakes that had neither, or had no 1985 value were omitted).
e. Lakes that resulted in a negative value (suggesting unrealistic projection, scoring badly on
clarity) were manually changed to 0.1.
f. Similarly, some very high clarity values also suggest unrealistic projection. Given the
maximum clarity value of 8 meters in 2005-8, all higher values were manually set to 7.9.
Scenario change factor:
Change factor of lake clarity per scenario is somewhat complex. Current trends was derived according to
the calculation above. Scenario D shows substantial improvement in lake clarity given spread of
population centers and low levels of polluting activity overall. Scenario A has a change factor of 1.1,
reflecting greater investment in pollution prevention infrastructure, and scenario B is divided: lakes
located close to population centers, or ones designated as “general development” or “Recreational!
development” by the MN DNR, fare worse (0.7), but all other lakes fare better (1.3). Determination of
proximity to population centers is a 5-mile buffer around centers with population greater than 1,000.
In addition, based on a determination by the project’s core group, results were modified so that:
a. In scenario B, 60% of the lakes that show declining values were set to no change from today’s
values; and
b. In scenario A, 75% of the lakes that show declining values were set to no change from today’s
values.
In each case, projected values for lakes with the least projected decline relative to current values were
manually set to current values. The following table shows results as change trend in lake clarity for all
lakes in the region:
!!
Figure 6 A value B value C value D value
Decline 132 306 665 368
Increase 736 492 591 895
No change 395 465 7 0
!
!!!!!!!!!!!!!!!!!!!!!!!!!!!!!! !!!!!!!!!!!!!!!!!!!!!!!!!!!!!U!&DD9.C+=,!69!C262!4.9\+C/.7Q!"HU?!\25-/7!2./!5/77!./5+2L5/!6:2=!6:97/!98!"HW?B!!W!$M%?Y$MMWG$U!
!
!
!

!"##$%&'()*'+,-.*//! 0-,'1-,*'$%2-,1"($-%'
2-,'()*'3.*%",$-/'"%4'0567' /**'8889,*/$:$*%(,*&$-%9-,&'
"M!
!
!
! ! ! ! ! ! ! ! ! ! ! ! ! ###!
The Central Minnesota
Sustainable Development Plan
creating a
Resilient Region
6. Economy – livable wage
Variable: Poverty percent, all ages
Data source: U.S. Census Bureau, Small Area Estimates Branch; 2009 Poverty and Median Income
Estimates – Counties
Mapping methodology: A graduated color choropleth map representing poverty percentage for the time
period available. Change factors per scenario were applied, resulting in four maps for comparison.
Figure 7 ' A value B value C value D value
Change factor: 2009 0.5 0.9 1 2
Cass County 14.0% 7.00% 12.60% 14.00% 28.00%
Crow Wing County 14.3% 7.15% 12.87% 14.30% 28.60%
Morrison County 13.7% 6.85% 12.33% 13.70% 27.40%
Todd County 14.7% 7.35% 13.23% 14.70% 29.40%
Wadena County 16.0% 8.00% 14.40% 16.00% 32.00%
!
Comment: "Current trends" projections are not expected to be different than today.
7. Land use – growth patterns
An initial attempt was made to derive an accurate map of current distribution of population based on
counties’ parcel data. Unfortunately, not all counties had such data in GIS format and an alternative way
was sought. Current distribution of population was mapped using 2010 census figures, using a dot
density map per census block whereby each dot stands for 10 persons. However, creating a scenario
representation of divergent growth patterns required particular creativity. This work aimed to provide the
audience with a sense of what things might look like in each scenario, rather than data derived
calculations.
Data source: The current extent of large population centers was manually digitized based on Bing aerial
image. Polygons were created for population centers larger than 1,000. MN DoT roads layer was also
used.
Mapping methodology: Manually created and edited polygons for centers of population to represent
growth patterns for each of the scenarios.

!"##$%&'()*'+,-.*//! 0-,'1-,*'$%2-,1"($-%'
2-,'()*'3.*%",$-/'"%4'0567' /**'8889,*/$:$*%(,*&$-%9-,&'
""!
!
!
! ! ! ! ! ! ! ! ! ! ! ! ! ###!
The Central Minnesota
Sustainable Development Plan
creating a
Resilient Region
Scenario change factors:
Abundance: Growth concentrates around lakes, in particular ones classified for “general
development” by the MN DNR. Points were digitized around such lakes representing
development. In addition, large and small communities were buffered to represent growth
compared with today’s extent of development.
Bootstrap: Growth concentrates in large centers of population at the expense of smaller ones.
Population centers larger than 1,000 were left in-tact, whereas communities with a population of
500-1,000 were symbolized with a point and smaller communities were not symbolized at all. The
road network was highlighted to represent strong interdependence and trade.
Current trends: Growth continues along the line of current development. Population centers over
1,000 were buffered by 250 meters; communities with population between 500-1,000 are
represented with a point, which was buffered by 1,000 meters while communities with population
of 100-500 were buffered by 500 meters and ones with population under 100 were buffered by
300 meters.
Doomsday: This scenario is characterized by a declining roads network and dispersion of
population from large communities to many isolated settlements. Small communities that are
dispersed throughout the area, especially in agricultural areas, were represented by points that
were digitized manually in the region.
8. Transportation - mobility
Variable: Extent and significance of roads and public transit.
Data: MN DoT, 2002 (roads network); MN DoT, Office of Transit, 2011 (existing transit)
Mapping methodology: Manipulated graphic representation of existing roads network was used to
indicate the relative importance of different transportation alternatives. Segments of roads and transit
routes were manually deleted or digitized to represent future scenarios.
Scenario change factors:
Abundance: All roads are maintained, with new transit routes available.
Bootstrap: Highways are highlighted at the expense of county roads representing the relative
importance of trade routes and strapped financing for local infrastructure. Transit routes are
expanded however.
Current trends: Several county roads are decommissioned, transit routes remain limited.
Doomsday: Many county roads are decommissioned but the network of local roads is more
dominant than that of state and federal highways representing relative little mobility. No transit
routes are available.

!"##$%&'()*'+,-.*//! 0-,'1-,*'$%2-,1"($-%'
2-,'()*'3.*%",$-/'"%4'0567' /**'8889,*/$:$*%(,*&$-%9-,&'
"$!
!
!
! ! ! ! ! ! ! ! ! ! ! ! ! ###!
The Central Minnesota
Sustainable Development Plan
creating a
Resilient Region
9. Broadband
Variable: Percentage of households served, number of unserved households and investment gap per
county
Data source: National Telecommunications and Information Administration (NTIA), 2011.
Mapping methodology: A graduated color choropleth map representing the percentage of households
served by broadband per county, and textual reference to other variables
Scenario change: This key issue was not discussed in terms of scenario change for 2035, given the
uncertainty about the relevance of broadband technology in this time frame.
Appendices:
Appendix A: Region Five Sustainability Project Key Issues Overview
Appendix B: Narrative Scenarios
Appendix C: Central Minnesota: Aging Population 2035 (includes the following maps)
Central Minnesota: Aging Population 2005 – 2035 (full region)
Central Minnesota: Aging Population 2035 (Scenario comparisons with county variations)
Central Minnesota: Aging Population 2035 (Scenario comparisons without county
variations)
Appendix D: Affordable Housing Location – Allocation Model for Central Minnesota
Appendix E: Data Catalog
Other thematic maps
Credits

!"##$%&'()*'+,-.*//! 0-,'1-,*'$%2-,1"($-%'
2-,'()*'3.*%",$-/'"%4'0567' /**'8889,*/$:$*%(,*&$-%9-,&'
"%!
!
!
! ! ! ! ! ! ! ! ! ! ! ! ! ###!
The Central Minnesota
Sustainable Development Plan
creating a
Resilient Region
Appendix A
Region Five Sustainability Project Key Issues Overview
The following are the Key Issues that the workgroups will be forming recommendations around. As these
Key Issues are addressed we will need to keep in mind that our basic goal is to balance the need for both
the protection of the environment and for increasing economic vitality. The impact of the following facts
and trends on the region need to be considered as well;
• An aging population; the age of our population impacts every area that we will be planning for.
It will affect the housing, transportation, land use and the workforce we will have and need for
the future.
• Energy costs and sources; the costs of transportation and fuel for both residences and businesses
has a great impact on rural areas due to the decentralized nature of our region. At this point we
import almost all of our energy, could that change utilizing more local sources?
• Health issues that affect the population; The availability of a healthy workforce and the lower
costs and higher productivity that it provides along with the accessibility and sustainability of
healthcare services for our residents will be important to our future success.
• Education; The importance of a well educated future workforce cannot be overstated. Both in
terms of wages earned and having the kind of workforce that can attract and retain businesses.
• Population demographics; As our future workforce shrinks and ages it is important that every
citizen possible has the skills necessary to be a productive and valued member of society rather
than being dependent on society. Ethnic diversity will continue to grow and expand from existing
clusters that are now mostly associated with areas with food processing jobs and will be an
important source of future workforce growth.
• Geographic differences; While our five counties have much in common we need to realize that
not every recommendation we make will have a direct affect on every county. One example of
differences is that Cass and Crow Wing County have a stronger tourism and forest products
oriented economy and Morrison, Todd and Wadena Counties have a more agricultural oriented
economy.
• Tighter Resources: Both public and private institutions are squeezed and trying to do more with
less. Solutions will need to take into account new ways to get things done that are not dependent
on increased spending from traditional sources.
Transportation
1. Public Transit (types and availability, costs)
How can regional public transit be an alternative to cars for commuters, for both the young and
elderly? What opportunities are there for transit partnerships? Where does it make sense to focus
on public transit? In what ways might the private sector be involved in this as the need grows?
2. Highways (quality, maintenance, improvements)
How can our highway system and corridors serve the regions’ mobility, land use, and economic
development needs in a safe manner while linking the other pieces of transportation system.
!"##$%&'()*'+,-.*//! 0-,'1-,*'$%2-,1"($-%'
2-,'()*'3.*%",$-/'"%4'0567' /**'8889,*/$:$*%(,*&$-%9-,&'
">!
!
!
! ! ! ! ! ! ! ! ! ! ! ! ! ###!
The Central Minnesota
Sustainable Development Plan
creating a
Resilient Region
3. Alternative Transportation (telecommuting, alternative energy, broadband)
Increasing broadband access throughout the region would increase the opportunity for
telecommute and provide an economic benefit for businesses. How do we best plan for
alternative transportation technologies, including alternative fueled vehicles, which are closer or
further from reality so they serve our regions needs to provide efficiency, safety, cost savings, and
economic development?
4. Walking and Biking (trails sidewalks, bike lanes)
Adopting and implementing complete streets to promote walking, biking, trail use as a
transportation option while increasing health and wellness. Developing bike lanes and routes on
existing roads where appropriate would encourage biking. Can the Region build/invest in a walk
able/bike able system that promotes and addresses health needs while acting as an economic
development driver all while enhancing our regional transportation system?
Economic Development
1. Work Force
This key issue has many different facets, including understanding the demographic and skill
makeup of people in the region’s major employment sectors. It is also important that skill sets of
high growth industries be evaluated to determine what incumbent workforce sectors may be more
easily transitioned into higher growth industries and away from the “legacy” industries that are in
decline. Other key components of this issue include: how to keep young workers in the region,
how to attract & retain talent, and how to best utilize an older workforce.
2. Technological Advances (Energy and more)
Not all of the jobs that were lost in the past ten years were to developing countries with lax
regulatory oversight and low wages, many jobs were lost to advancements in technology and
related productivity gains. Furthermore, as the region has many companies that are working
within energy related fields, developing breakthrough technology in energy production will be
critical for advancing the industry cluster and the region.
3. Infrastructure
Availability of suitable infrastructure is critical for communities and businesses alike. While
dependence on certain types of infrastructure vary greatly from industry to industry, availability
of transportation systems is vital for movement of goods and workforce. In many parts of the
region, traditional infrastructure is nearly the end of its useful life with many towns facing the
financial burden of replacing sewer & water lines and/or having to replace wastewater treatment
facilities. In addition to traditional infrastructure needs and as the global economy continues to
grow, one piece of infrastructure is emerging that will be critical for businesses to remain
competitive in the future: availability of broadband access.

!"##$%&'()*'+,-.*//! 0-,'1-,*'$%2-,1"($-%'
2-,'()*'3.*%",$-/'"%4'0567' /**'8889,*/$:$*%(,*&$-%9-,&'
"?!
!
!
! ! ! ! ! ! ! ! ! ! ! ! ! ###!
The Central Minnesota
Sustainable Development Plan
creating a
Resilient Region
4. Natural and Social Environments
Natural and Social Environments is an all encompassing issue as it relates to the region’s past,
current and future economic growth patterns and opportunities. The region is uniquely positioned
in the state as such that three different biomes encroach on the five county area: the south and
west portion of the region is primarily utilized for agricultural purposes, whereas the most of Cass
and Crow Wing counties rely on the heavily wooded areas and abundant lakes as economic
drivers for the tourism industry. While many of these areas are not well suited for bulk
agribusiness new opportunities such as the local Foods movement and energy crops that can be
raised on marginal land may bring new opportunities. The unique arts and culture environment in
our communities is also a potential economic driver, and like the forest types varies by county
and sometimes by community, and is also subject to ongoing change in ethnic diversity. How the
region chooses to preserve its land and cultural traditions and utilize those assets in the future will
have a direct impact on its economic vitality
5. Financing
This issue involves the availability of capital to new and expanding businesses in the region. In
today’s credit market, accessing capital can be a big challenge for businesses, especially for
entrepreneurs and companies in research & development stages. Alternative financing
mechanisms should be created to fill this void, such as microenterprise loan funds or local venture
capital financing.
Housing
1. Affordable Housing
This key issue includes rental and single-family housing, the needed physical development of
affordable rental housing and the need for single-family housing that is affordable due to price
and/or financing, along with mechanisms to bring those goals about. Building design and green
technology need to play a role in affordable housing. Also, homeless emergency shelters are
thought of when discussing affordable housing. There is a need for a homeless emergency shelter
to cover Region 5. Senior housing, with an aging population, needs to be offered as well as built
to be affordable.
2. Rehabilitation
Rehabilitation of housing focuses on the current housing stock. Seniors with a fixed income may
find it to be very costly to rehabilitate their home when it is needed. A Continuum of Care model
should be followed when referring to seniors and their housing. There is also a fairly large
housing stock of foreclosed homes, which should go through rehabilitation and be sold to
homebuyers at an affordable price with affordable financing. Green technology as to housing
methods needs to play a role in this key issue.

!"##$%&'()*'+,-.*//! 0-,'1-,*'$%2-,1"($-%'
2-,'()*'3.*%",$-/'"%4'0567' /**'8889,*/$:$*%(,*&$-%9-,&'
"I!
!
!
! ! ! ! ! ! ! ! ! ! ! ! ! ###!
The Central Minnesota
Sustainable Development Plan
creating a
Resilient Region
3. Employment
This key issue is mainly in regards to the financial aspects of housing. First of all, livable-wage
employment needs to be available and secondly, the location of the employment is a large factor.
Affordable housing will need to be produced near employment centers. A household should not
have to drive an hour each way to and from their job.
4. Infrastructure
The key issue of infrastructure deals with a variety of issues. It includes the critical role of
central sewer and water systems in the development of housing, the availability of broadband
internet connectivity in housing and economic development and the importance of road
connectors to market and service centers within Greater Minnesota. In addition, it deals with the
issue of responsive and available public transportation systems, such as on-demand systems, like
dial-a-ride, in smaller towns and rural areas.
5. Building Standards
The key issue of building standards is a broad one covering issues that are associated with general
government controls as well as technical guidelines. As with other issues, building standards
entails recognition of green criteria, including green building standards and the Minnesota Green
Criteria Overlay. Education of the community, especially architects and contractors in the
attributes and best practices of green construction techniques, is a sub-issue of this key issue. The
issue also seeks to acknowledge the importance of local agriculture, the preservation of small
farms and community-supported agriculture (CSA) as it concerns policies such as zoning,
agriculture-appropriate real estate taxation and development.
Land-Use
1. Land-use plans based on a balance of environmental and economic needs in the long term
We need to promote a regional land-use plan that promotes contraction rather than sprawl, and
addresses and respects the potential long-term financial burdens placed on local taxpayers (for
maintenance and replacement of infrastructure), as well as addresses and respects the potential
long-term impacts of a development on the environment. The region needs to define the term,
“sustainable land-use” and then adopt a method for measuring if it is attained or not.
2. An effective land-use decision process that works better than the current system
The current Euclidian model of zoning, which doesn’t allow for much flexibility, doesn’t work.
We need a process that incentivizes sustainable development and standardizes terms and
definitions throughout the region. Performance-based zoning, or outcome-based zoning, or form-
based zoning might promote sustainability better than Euclidian zoning.

!"##$%&'()*'+,-.*//! 0-,'1-,*'$%2-,1"($-%'
2-,'()*'3.*%",$-/'"%4'0567' /**'8889,*/$:$*%(,*&$-%9-,&'
"U!
!
!
! ! ! ! ! ! ! ! ! ! ! ! ! ###!
The Central Minnesota
Sustainable Development Plan
creating a
Resilient Region
3. Scale up good processes/practices that are already working elsewhere
There are a number of land-use sustainability practices that are already working in the region and
elsewhere. We need to aggressively promote these throughout the entire region. They include
Green Step Cities, Conservation Design, the Micropolitan Planning Project, Low Impact
Development (LID), Minimal Impact Development Standards (MIDS), Smart Growth Principles,
Active Living by Design, DNR revised shoreland ordinances, conservation easements, Design
Review Teams (DRTs), etc.
4. Land-use policies that create affordable, intergenerational, active living housing
opportunities
We need “life-cycle housing” that is close to natural areas and promotes walkability, and health
and wellness – not just for our growing ranks of seniors, but for every generation living and
working in the region.
5. Protect our water (surface and subsurface) and provide better public access to public
waters
Clean water defines our region and it is the economic driver (tourism and high lakeshore property
values). Healthy lakes equal a healthy economy. Therefore, we need to promote and implement
a regional land-use plan that, above all, protects water quality. In this region, there are few public
beaches that allow non-lakeshore owners to access public waters, and this is viewed as unfair.
6. Protect our region’s agricultural heritage and support smaller-scale efforts like CSAs
(Community Supported Agriculture)
We need a land-use plan that keeps our prime farmlands in production, rather than chopping them
up (fragmenting) and turning them into subdivisions. We need to promote local agriculture for
affordable local food production. CSAs and local farmers markets offer solutions to the problem
that here in Minnesota; we currently import two-thirds of the food we eat. With fuel costs rising,
food costs will rise, too. Those costs will be more manageable if we are able to produce food
locally.

!"##$%&'()*'+,-.*//! 0-,'1-,*'$%2-,1"($-%'
2-,'()*'3.*%",$-/'"%4'0567' /**'8889,*/$:$*%(,*&$-%9-,&'
"W!
!
!
! ! ! ! ! ! ! ! ! ! ! ! ! ###!
The Central Minnesota
Sustainable Development Plan
creating a
Resilient Region
Appendix B
Central Minnesota Sustainable Development Plan
DRAFT Scenario Narratives
Workgroup Meeting - August 23, 2011
SCENARIO A: Abundance
The discovery of a cheap and abundant energy source in 2015 led to a strong national recovery
and the reestablishment of the United States as the dominant world economy. In 2035 politicians
exercise reason and base legislation on the results of intelligent, respectful debate. Due to the
strong economy, government has seen significant increases in revenue and is able to meet not
only the needs, but many of the desires, of their citizens while keeping taxes from increasing.
Central Minnesota residents enjoy a high quality of life and are keenly aware that their actions,
and to a great degree their economy, directly relate to their natural surroundings. They have
taken firm action and made significant investments in improving the natural environment.
Because of those actions and investments, the region has healthy natural systems that provide
abundant clean air and water, and support opportunities for growth of a green economy.
Transportation options are diverse, cost-effective, non-polluting, and easily accessible to all.
Options include roads, buses, bike trails, walking and rail. Transportation infrastructure is well
maintained and supports the movement of people and products throughout the region. Everyone
has broadband connections and the whole region has wireless access at low cost.
Education is valued so it is well-funded, flexible, lifelong and affordable. The education system
trains a strong workforce in the skills they need to be competitive in a productive economy
where innovation and entrepreneurship are prized. There is full employment for all people that
fits their abilities and pays a living wage for full-time work. The region’s diverse economy
provides for local needs and exports to the nation and the world. The economy is open to new
ideas and new immigrant populations that strengthen the region’s global impact.
Because of cheap and abundant energy sources, housing is affordable and operation costs are
low. The housing market is strong due to healthy in-migration and the recognized high quality of
life. Diverse housing options exist so that as people’s needs change due to age, lifestyle or family
situation they can remain in the community.
Healthy, locally produced foods meet the needs of the region and beyond. Food production does
not degrade the natural environment and provides a living wage and positive return on
investment for growers.
People of all ages and classes are attracted and retained by the high quality of life, local arts and
culture, excellent medical care, and opportunities to contribute to the broader community and
live in an area with great natural beauty.

!"##$%&'()*'+,-.*//! 0-,'1-,*'$%2-,1"($-%'
2-,'()*'3.*%",$-/'"%4'0567' /**'8889,*/$:$*%(,*&$-%9-,&'
"H!
!
!
! ! ! ! ! ! ! ! ! ! ! ! ! ###!
The Central Minnesota
Sustainable Development Plan
creating a
Resilient Region
SCENARIO B: Bootstrap to a Stronger Region
After the safety net of state support was withdrawn in the early 2010s, Central Minnesota struck
out on a path of self-reliance to build a strong, efficient region that uses external relationships to
strengthen the region. In 2035 we think first about investing in efficiency to keep more resources
here. We then think about what we can export in order to bring dollars in to the region. We use
what we have first, before looking outside the region.
Counties, cities, townships, schools, and other institutions collaborate for economic efficiency
due to decreased funding for public education and governmental entities. Schools are a
combination of on-line, charter, home school and traditional education programs. The Regional
Sheriff patrols roads and the Central Minnesota Fire Department responds from outposts evenly
spread through the region. Joint purchasing and sharing staff is the norm for government. There
are now only three counties in the region and several smaller towns have un-incorporated.
Businesses strive to employ community residents in well-paying jobs that create products that
other countries want – modular housing, solar panels, etc. We do not rely on California for our
produce, we grow it here. Local farmers grow food for us first and commodity crops for export
second. Manufacturers use the web to market their products globally. We connect globally for
local gain. Electronic and virtual communication is universal and used to support new types of
jobs that in the past were bound to a certain geographic place, but can now be in our region.
Workers live near jobs. Houses, businesses, and cars are energy efficient so dollars not spent on
energy can be spent on other goods and services produced locally. Energy is produced locally
(solar, wind) and distributed locally. We are not dependent on power lines bringing in energy.
Residents and businesses boast how they spend most of their dollars locally instead of buying
goods and services from outside the region.
Our region works diligently and cooperatively to create a transportation system that efficiently
gives people access to jobs, takes our exports to markets, and brings in tourists to spend their
dollars here. While the road infrastructure may not mimic 2010 standards, preservation of major
corridors is the priority focus. Some roads have been abandoned and some that were paved are
now gravel.
Our natural resources are assets we maintain and improve for local benefit. Clean water means
we don’t spend money on cleaning up our drinking water. Access to parks and open space keep
us healthy and happy. Natural resources keep the tourist dollars coming into the region.
Social and civic institutions support our local strength. People have strong connections to friends
and neighbors in the region developed through schools, churches, arts organizations, coffee
shops, etc. People love to live here because of the beauty of the built and natural environments.
There are many political parties represented in elected office. The polarized, uncollaborative
two-party system no longer exists. Party affiliations are not listed on election ballots. Our
education system works to strengthen social ties and train people for jobs here in the region. Our
competitive health care system keeps us healthy in place and attracts retirees to the area. The
population grows sustainably because people have good jobs, good community, and good
services. People grow in place. Life is good here.

!"##$%&'()*'+,-.*//! 0-,'1-,*'$%2-,1"($-%'
2-,'()*'3.*%",$-/'"%4'0567' /**'8889,*/$:$*%(,*&$-%9-,&'
$M!
!
!
! ! ! ! ! ! ! ! ! ! ! ! ! ###!
The Central Minnesota
Sustainable Development Plan
creating a
Resilient Region
SCENARIO C: Current Trends
After the recession of the 2010s, the national economy moderately revived, and in 2035 the
economy is no longer as completely dependent on consumption of imported goods and housing
construction for growth. In our region we now have a more diverse economy that still includes
tourism and forestry, but also includes a more significant industrial sector specializing in “green”
industries that export products out of the region and country. Health care jobs have also
increased because of the number of “baby boomer” retirees that settled in the region attracted
because of the region’s beautiful natural resources. “Hidden companies” are growing, including
data storage and other high-tech businesses, although lending and capitalization can still be a
challenge. Commodity agriculture continues with some niche local food production.
Housing values stabilized after the recession, but never returned to the inflated values of the
2000s. Because values moderated, counties and cities still struggle to provide services with
decreased revenues from property taxes. Public services have been reduced or are delivered
jointly by counties and cities. Transportation systems are maintained, not expanded. Some local
roads have been abandoned because of limited transportation money and some roads went back
to gravel. Expectations for what services government will provide have decreased. Because of
the challenge of doing more with less, political gridlock still rears its head regularly.
The upside of lower housing values has been that first time buyers are able to purchase homes
which brings younger people back in to the area – people who vacationed here want to live here,
adults with children who want to live in rural community settle here, also young people who
grew up here and went away now move back (we call them “boomerangs.”) It is sometimes hard
to find good jobs, but there are some expanded opportunities due to good broadband connections
in cities and the growing trend of working in virtual offices. Minority communities have
expanded because of the attractions of a small town and rural lifestyle and agricultural and health
care job opportunities.
Schools continue to consolidate in fewer locations in larger towns because of limited public
funding. Because of increased travel distances to schools, rural students turn increasingly to
homeschooling and on-line schools. The combined effect of lowered governmental services,
schools closing, and jobs locating in larger towns causes small towns to decline and larger
centers to thrive.
Water continues to be increasingly impaired because land use regulations really haven’t changed
and enforcement has declined because of decreased local government staffing. We are happy to
have development so we are not placing more regulatory burdens on the development. Invasive
species in our lakes and rivers, and in our forests are still increasing. Resorts have declined in
general and small family-owned resorts are practically gone.
Energy and fuel prices fluctuate, but have risen significantly over time. We are still mostly
dependent on fossil fuel for heating, electricity and transportation. Alternative energy sources
have increased, but slowly and incrementally.
!"##$%&'()*'+,-.*//! 0-,'1-,*'$%2-,1"($-%'
2-,'()*'3.*%",$-/'"%4'0567' /**'8889,*/$:$*%(,*&$-%9-,&'
$"!
!
!
! ! ! ! ! ! ! ! ! ! ! ! ! ###!
The Central Minnesota
Sustainable Development Plan
creating a
Resilient Region
SCENARIO D: Doomsday/Collapse
“On its simplest level, the Great Depression was an economic crisis. Between 1929 and 1933, the
average family in the United States saw its income drop by more than one third. The national
jobless rate, which stood at about 3% in October of 1929, reached at least 25% less than four
years later. The numbers in Minnesota were comparable, although residents in some parts of the
state—the Iron Range, for example, where the unemployment rate hit 70%—suffered more than
others. Children did not always understand the larger economic forces that were swirling around
them, but they could tell something was wrong. Their fathers came home with news of pay cuts and
layoffs. Their mothers struggled to make a few days’ food last an entire week.
Illnesses went untreated. Clothes wore out and were seldom replaced. Many kids scavenged for
food. Others took low-paying jobs to help their families survive. Even those whose families
weathered the crisis reasonably well felt less secure than they ever had before. All around them
they saw evidence of an economy in shambles, and the adults they depended on were helpless to do
anything about it.”The Depression. Retrieved 6/14/11 http://stories.mnhs.org/stories/mgg/depression.do?eraID=2
The Greater Depression of 2014-2024 has left Central Minnesota of 2035 in a state very like the
Great Depression of the 1930s. Population has plummeted. There is a predominance of ailing
seniors who remain. They are without resources and are a major drain on neighbors and the faith
community because government support was disbanded in the year 2015 and their adult children
do not live in the region. Those who remain pine for the good old days.
The area is no longer viewed as a single region. There is significant isolation between local areas
with some open hostility as scarce public resources are fought over. Some communities have
done relatively well and there is more division between the haves and have-nots. Communities
that are doing well attract people fleeing the large metropolitan areas who are looking for decent
shelter and food.
Weather swings are more severe with more draughts and massive food shortages. Dust bowl
days return to southern Minnesota and will move northward as climate change means lakes and
wetland dry up and forests burn. Air quality is checked each day instead of the rain forecast.
Fisheries are depleted because people ignored regulations and over-fished the streams to feed
their families. Invasive species made lakes sterile. Wildlife is diminished because of
overharvesting for food. Forests have been cut down for heating fuel.
People live in multi-generational housing for survival. Houses are smaller and focused on an
interior room to conserve heat. Many houses are in small compounds surrounded by walls to
keep others out. Life expectancy has decreased significantly because of food shortages, poor
sanitation, and disease.
People have re-learned survival skills - the ability to plant, care for, harvest, and preserve food
they grow from seeds. Fuel is rationed and few people own automobiles. There is little publically
maintained infrastructure. The internet and other technologies are gone because they were too
complex to maintain and recreate. People with jobs are generally employed by companies run by
foreign governments. The ruling class, such as it is, is mainly old-money families trying to
protect their wealth.

!"##$%&'()*'+,-.*//! 0-,'1-,*'$%2-,1"($-%'
2-,'()*'3.*%",$-/'"%4'0567' /**'8889,*/$:$*%(,*&$-%9-,&'
$$!
!
!
! ! ! ! ! ! ! ! ! ! ! ! ! ###!
The Central Minnesota
Sustainable Development Plan
creating a
Resilient Region
Appendix C (Map 1)

!"##$%&'()*'+,-.*//! 0-,'1-,*'$%2-,1"($-%'
2-,'()*'3.*%",$-/'"%4'0567' /**'8889,*/$:$*%(,*&$-%9-,&'
$%!
!
!
! ! ! ! ! ! ! ! ! ! ! ! ! ###!
The Central Minnesota
Sustainable Development Plan
creating a
Resilient Region
Appendix C (Map 2)
!
!"##$%&'()*'+,-.*//! 0-,'1-,*'$%2-,1"($-%'
2-,'()*'3.*%",$-/'"%4'0567' /**'8889,*/$:$*%(,*&$-%9-,&'
$>!
!
!
! ! ! ! ! ! ! ! ! ! ! ! ! ###!
The Central Minnesota
Sustainable Development Plan
creating a
Resilient Region
Appendix C (Map 3)
!

!"##$%&'()*'+,-.*//! 0-,'1-,*'$%2-,1"($-%'
2-,'()*'3.*%",$-/'"%4'0567' /**'8889,*/$:$*%(,*&$-%9-,&'
$?!
!
!
! ! ! ! ! ! ! ! ! ! ! ! ! ###!
The Central Minnesota
Sustainable Development Plan
creating a
Resilient Region
!
Appendix D
722-,4"K:*'5->/$%&'L-."($-%?7::-."($-%'!-4*:'2-,'M*%(,":'!$%%*/-("'
]2D:!K2,2.!
&4.+5!$M"$!
;%(,-4>.($-%'
K:/!)/42.63/=6!98!P9-7+=,!2=C!^.L2=!)/\/5943/=6!_P^)`!7/6!,9257!89.!2889.C2L5/!:9-7+=,!+=!
a/,+9=!?0!98!6:/!/b+76+=,!:9-7+=,!-=+67!_"MMQM$"`Q!2!D/.62+=!4/.D/=62,/!=//C7!69!L/!2\2+52L5/!89.!
./=6!26!%McQ!?Mc!2=C!WMc!98!2./2!3/C+2=!+=D93/!_&NF`!./74/D6+\/5<B!Z:+5/!6:/7/!,9257!/27+5<!
6.2=7526/!+=69!=-3L/.!98!:9-7+=,!-=+67Q!6:/!C+76.+L-6+9=!98!6:/7/!-=+67!6:.9-,:9-6!6:/!./,+9=!+7!
=96!C/8+=/C!L<!P^)B!K:26!C/D+7+9=!+7!5/86!69!59D25!2,/=D+/7Q!+=D5-C+=,!=9=Y4.98+6!9.,2=+d26+9=7B!
Z:+5/!6:/7/!9.,2=+d26+9=7!:2\/!2345/!;=9A5/C,/!98!59D25!D9=C+6+9=7Q!6:/<!/b4./77/C!2!=//C!89.!
C/D+7+9=!7-449.6!+=!C/6/.3+=+=,!./79-.D/!2559D26+9=!89.!2889.C2L5/!:9-7+=,!L/6A//=!
D933-=+6+/7!+=!6:/!./,+9=B!F6!+7!6:+7!=//C!6:26!6:/!39C/5!7//;7!69!2=7A/.B!!
'
+,-N*.('-KN*.($O*'
K:/!4.9e/D6!2+37!69!D./26/!2!39C/5!89.!+6/.26+\/!-7/Q!A:+D:!4.9\+C/7!6:/!=-3L/.!98!2889.C2L5/!
:9-7+=,!-=+67!=//C/C!+=!/2D:!98!6:/!3-=+D+425+6+/7!/b23+=/CB!K:/!39C/5!+7!69!L/!L27/C!9=!
42.23/6/.7!98!=//CQ!e9L7Q!D933-6/!2=C!494-526+9=Q!2=C!4.9\+C/!A/+,:6+=,!8-=D6+9=25+6<!,+\/=!
495+D<!4./8/./=D/!98!C/D+7+9=!32;/.7B!&!39C/5!244.92D:!+7!+C/255<!7-+6/C!89.!7-D:!2!4.9L5/3Q!27!
+6!2559A7!6:/!-7/.7!69!/b4/.+3/=6!A+6:!C+88/./=6!A/+,:6+=,!946+9=7B!!!
!
I"("'/->,.*/'
K:/!2=25<7+7!./5+/7!9=!6:/!89559A+=,!C262!79-.D/70!!
• V94-526/C!452D/7!+=!N+==/7962!_N+==/7962!)/42.63/=6!98!O26-.25!a/79-.D/7`!
• V94-526+9=!8+,-./7!_(/=7-7!$M"M`!
• K.2=749.626+9=!=/6A9.;!_N+==/7962!)/42.63/=6!98!K.2=749.626+9=`!
• (/=7-7!6.2D67!_(/=7-7!$M"M`!
• N-=+D+425!L9-=C2.+/7!_N+==/7962!)/42.63/=6!98!O26-.25!a/79-.D/7`!
• K2L5/0!X4/.D/=62,/!98!59A!+=D93/!:9-7+=,!-=+67!42<+=,!%Mc!9.!39./!98!6:/+.!+=D93/!9=!
:9-7+=,J!_L<!D/=7-7!6.2D6`!_N+==/7962!P9-7+=,`!
• K2L5/0!X=-3L/.!98!A2,/!/2.=/.7!+=!$M"MJ!_L<!N+=9.!(+\+5!)+\+7+9=`!_N+==/7962!
)/42.63/=6!98!f3459<3/=6!2=C!fD9=93+D!)/\/5943/=6`!
• K2L5/0!X/b+76+=,!./=625!2889.C2L5/!:9-7+=,!-=+67!26!%McQ!?Mc!2=C!WMc!98!2./2!3/C+2=!
+=D93/J!_^1!)/42.63/=6!98!P9-7+=,!2=C!^.L2=!)/\/5943/=6`!

!"##$%&'()*'+,-.*//! 0-,'1-,*'$%2-,1"($-%'
2-,'()*'3.*%",$-/'"%4'0567' /**'8889,*/$:$*%(,*&$-%9-,&'
$I!
!
!
! ! ! ! ! ! ! ! ! ! ! ! ! ###!
The Central Minnesota
Sustainable Development Plan
creating a
Resilient Region
!
!N24!$0!N-=+D+425+6+/7!A+6:!494-526+9=!,./26/.!6:2=!?MMB!1<3L95!7+d/!+7!4.949.6+9=25!69!
494-526+9=!7+d/B!
!

!"##$%&'()*'+,-.*//! 0-,'1-,*'$%2-,1"($-%'
2-,'()*'3.*%",$-/'"%4'0567' /**'8889,*/$:$*%(,*&$-%9-,&'
$U!
!
!
! ! ! ! ! ! ! ! ! ! ! ! ! ###!
The Central Minnesota
Sustainable Development Plan
creating a
Resilient Region
!
!N24!%0!(/=7-7!6.2D67!./4./7/=626+9=!98!2889.C2L5/!:9-7+=,!=//C7B!
!
'
'

!"##$%&'()*'+,-.*//! 0-,'1-,*'$%2-,1"($-%'
2-,'()*'3.*%",$-/'"%4'0567' /**'8889,*/$:$*%(,*&$-%9-,&'
$W!
!
!
! ! ! ! ! ! ! ! ! ! ! ! ! ###!
The Central Minnesota
Sustainable Development Plan
creating a
Resilient Region
'
!*()-4/''
'
&B!T9,+D25!8.23/A9.;!
'
"B f2D:!D933-=+6<!+7!.2=;/C!9=!6:/!L27+7!98!=//C!2=C!e9L7B!_=//C!2=C!e9L7!2./!4.9\+C/C!9=!
MY"!7D25/`B!
$B O//C!2=C!g9L7!\2.+2L5/7!2./!A/+,:6/C!2DD9.C+=,!69!-7/.!4./8/./=D/Q!7-D:!6:260!P"%Q'R'S'
T%**4U'V'T<'%**4UW'X'STN-K/U'V'T<'N-K/U'W!
%B a2=;!+7!3-56+45+/C!L<!494-526+9=B!
>B K:/!=-3L/.!98!X69625!-=+67!=//C/CJ!+7!C+\+C/C!239=,!255!D933-=+6+/7Q!C+./D65<!
4.949.6+9=26/!69!6:/!4.9C-D6!98!6:/+.!.2=;!2=C!494-526+9=B!
?B K:/!=-3L/.!98!/b+76+=,!-=+67!+=!/2D:!D933-=+6<!+7!7-L6.2D6/C!8.93!6:/!./7-56B!!
'
'B!)262!4./42.26+9=!
"B 1+6/!7/5/D6+9=!
^=C/.!6:/!277-346+9=!6:26!2889.C2L5/!:9-7+=,!+=\/763/=6!3-76!62;/!452D/!A:/./!
7-88+D+/=6!+=8.276.-D6-./!/b+767Q!/74/D+255<!A26/.!2=C!A276/A26/.Q!6:/!39C/5!./76.+D6/C!+67!
/b23+=26+9=!69!D933-=+6+/7!A+6:!2!494-526+9=!98!?MM!9.!39./B!Z+6:+=!./,+9=!?Q!6:/./!
/b+76!$H!7-D:!D933-=+6+/7!6:26!2=7A/.!6:26!D.+6/.+9=B!N24!>!7:9A7!6:/7/!D933-=+6+/7!
9=!6:/!L2D;,.9-=C!98!,/=/.25!494-526+9=!C+74/.7+9=!+=!6:/!./,+9=!_2!C96YC/=7+6<!324!
A+6:!/2D:!C96!./4./7/=6+=,!6/=!4/945/`B!!
!

!"##$%&'()*'+,-.*//! 0-,'1-,*'$%2-,1"($-%'
2-,'()*'3.*%",$-/'"%4'0567' /**'8889,*/$:$*%(,*&$-%9-,&'
$H!
!
!
! ! ! ! ! ! ! ! ! ! ! ! ! ###!
The Central Minnesota
Sustainable Development Plan
creating a
Resilient Region
!
!N24!>0!7/5/D6/C!3-=+D+425+6+/7!9=!6:/!L2D;,.9-=C!98!9\/.255!494-526+9=!C+76.+L-6+9=!_f2D:!
L.9A=!C96!./4./7/=67!"M!!4/945/`B!
!
!
!
!

!"##$%&'()*'+,-.*//! 0-,'1-,*'$%2-,1"($-%'
2-,'()*'3.*%",$-/'"%4'0567' /**'8889,*/$:$*%(,*&$-%9-,&'
%M!
!
!
! ! ! ! ! ! ! ! ! ! ! ! ! ###!
The Central Minnesota
Sustainable Development Plan
creating a
Resilient Region
!
!
$B &.DhF1!O/6A9.;!&=25<76!i!D./26+=,!D933-6/!495<,9=7!2=C!2,,./,26+=,!e9L7!=-3L/.70!
&!;/<!D9=7+C/.26+9=!+=!C/6/.3+=+=,!2889.C2L5/!:9-7+=,!59D26+9=!+7!6:/!e9L!32.;/6!+=!6:/!
2./2B!P9A/\/.Q!6:/!=-3L/.!98!e9L7!59D26/C!+=!2!,+\/=!3-=+D+425+6<!+7!=96!2!7-88+D+/=6!
\2.+2L5/Q!7+=D/!32=<!A9.;/.7!D933-6/!69!A9.;!452D/7!9-67+C/!6:/+.!3-=+D+425+6<B!K9!
2=7A/.!6:26Q!2!$M!3+=-6/!D933-6/!495<,9=!A27!D./26/C!89.!/2D:!98!6:/!$H!
D933-=+6+/7Q!L27/C!9=!494-526/C!452D/7!49+=6!C262!2=C!9=!6:/!.92C!=/6A9.;Q!-7+=,!
&.DhF1!"M!O/6A9.;!&=25<76B!!
!
*9.!/2D:!D933-=+6<Q!6:/!$M!3+=-6/!D933-6/!495<,9=!A27!+=6/.7/D6/C!A+6:!6:/!495<,9=!
52</.!98!=-3L/.!98!e9L7!4/.!N+=9.!(+\+5!)+\+7+9=!_N()`B!K:/!=-3L/.!98!e9L7!+=!/2D:!98!
6:/!N()!495<,9=7!6:26!+=6/.7/D6!6:/!$M!3+=-6/!D933-6/!495<,9=!A27!7-33/C!69!
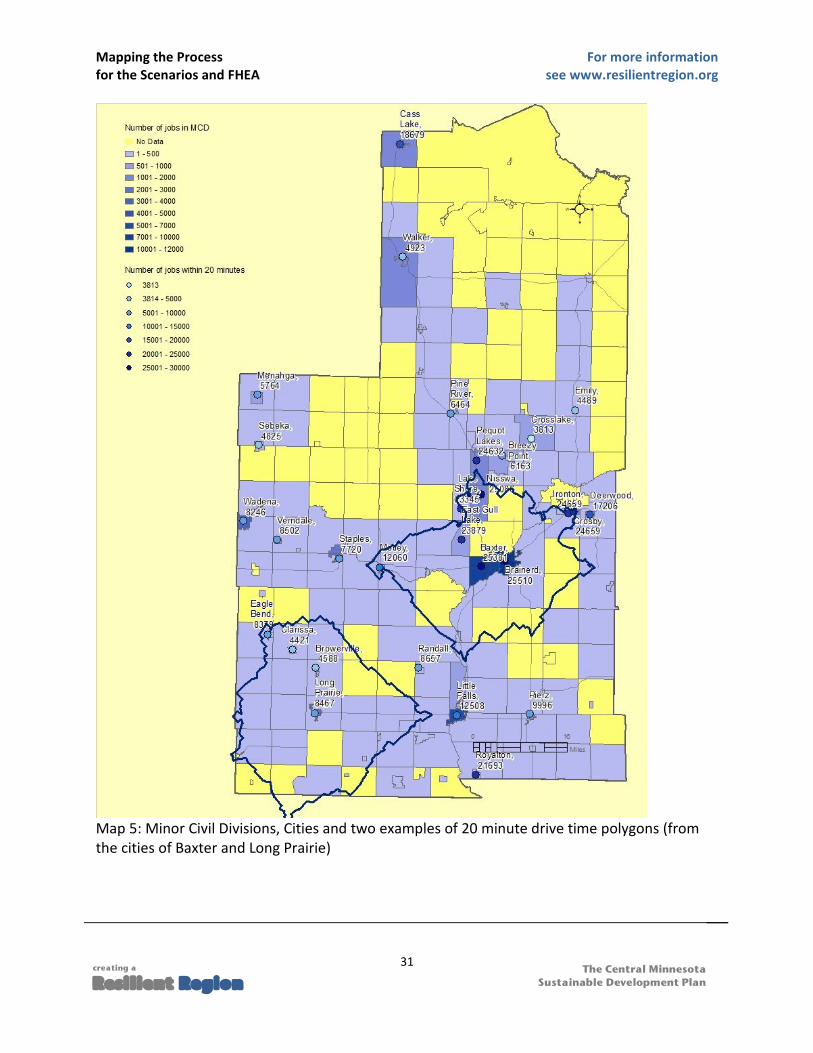
4.9\+C/!6:/!69625!=-3L/.!98!e9L7!A+6:+=!2!$M!3+=-6/!D933-6/!4/.!D933-=+6<B!N24!?!
7:9A7!6:/!N()!495<,9=7!_+=!,.2C-26/C!D959.!./4./7/=6+=,!=-3L/.!98!e9L7`!2=C!6A9!
/b2345/7!98!$MY3+=-6/!D933-6/!495<,9=7Q!89.!6:/!D933-=+6+/7!98!'2b6/.!2=C!T9=,!
V.2+.+/B!K:/!324!2579!7:9A7!/2D:!98!6:/!$H!D933-=+6+/7!27!2!C96!A+6:!,.2C-26/C!D959.!
./4./7/=6+=,!6:/!=-3L/.!98!e9L7!A+6:+=!2!$M!3+=-6/!D933-6/B!!
!"##$%&'()*'+,-.*//! 0-,'1-,*'$%2-,1"($-%'
2-,'()*'3.*%",$-/'"%4'0567' /**'8889,*/$:$*%(,*&$-%9-,&'
%"!
!
!
! ! ! ! ! ! ! ! ! ! ! ! ! ###!
The Central Minnesota
Sustainable Development Plan
creating a
Resilient Region
!
!N24!?0!N+=9.!(+\+5!)+\+7+9=7Q!(+6+/7!2=C!6A9!/b2345/7!98!$M!3+=-6/!C.+\/!6+3/!495<,9=7!_8.93!
6:/!D+6+/7!98!'2b6/.!2=C!T9=,!V.2+.+/`!
!
!
!
!
!"##$%&'()*'+,-.*//! 0-,'1-,*'$%2-,1"($-%'
2-,'()*'3.*%",$-/'"%4'0567' /**'8889,*/$:$*%(,*&$-%9-,&'
%$!
!
!
! ! ! ! ! ! ! ! ! ! ! ! ! ###!
The Central Minnesota
Sustainable Development Plan
creating a
Resilient Region
!
!
%B a276/.+d+=,!495<,9=!C262!
)262!9=!e9L7!2=C!9=!494-526+9=!26!6:+7!762,/!+7!,+\/=!4/.!D933-=+6<!27!49+=6!C262B!
P9A/\/.Q!C262!9=!=//C!+7!4.9\+C/C!L<!D/=7-7!6.2D6!_7//!324!%`B!K:/!C+88/./=6!C262!6<4/7!
4./7/=6!2!4.9L5/3!89.!7426+25!2=25<7+7!6:26!./j-+./7!2!D93L+=26+9=!98!6:/7/!C2627/67B!
V9+=6!C262!A27!/27+5<!266.+L-6/C!69!495<,9=7!762=C+=,!89.!3-=+D+425!L9-=C2.+/7!6:.9-,:!
2!62L5/!e9+=Q!L-6!6:/./!./32+=/C!2!3+7326D:!L/6A//=!3-=+D+425!L9-=C2.<!495<,9=7!2=C!
D/=7-7!6.2D6!495<,9=7B!K:/!39C/5!2=7A/.7!6:+7!3+7326D:!L<!.276/.+d+=,!L96:!C2627/67!
2=C!-7+=,!324!25,/L.2!89.!4+b/5YL<Y4+b/5!2=25<7+7B!K9!6:+7!/=CQ!6:/!D/=7-7!6.2D6!495<,9=!
52</.!98!6:/!=//C!C262!_+B/B!4/.D/=62,/!98!59A!+=D93/!:9-7+=,!-=+67!74/=C+=,!%Mc!9.!
39./!98!+=D93/!9=!:9-7+=,`!A27!D5+44/C!-7+=,!6:/!3-=+D+425!L9-=C2.+/7!27!D5+4!8/26-./B!
V95<,9=!52</.7!98!X=//CJQ!Xe9L7J!2=C!X494-526+9=J!=9A!:2\/!6:/!723/!7426+25!/b6/=6Q!
2=C!6:/<!A/./!.276/.+d/C!-7+=,!&.DhF1!XV95<,9=!69!.276/.J!6995Q!A+6:!2!%M!3/6/.!D/55!7+d/B!!
!
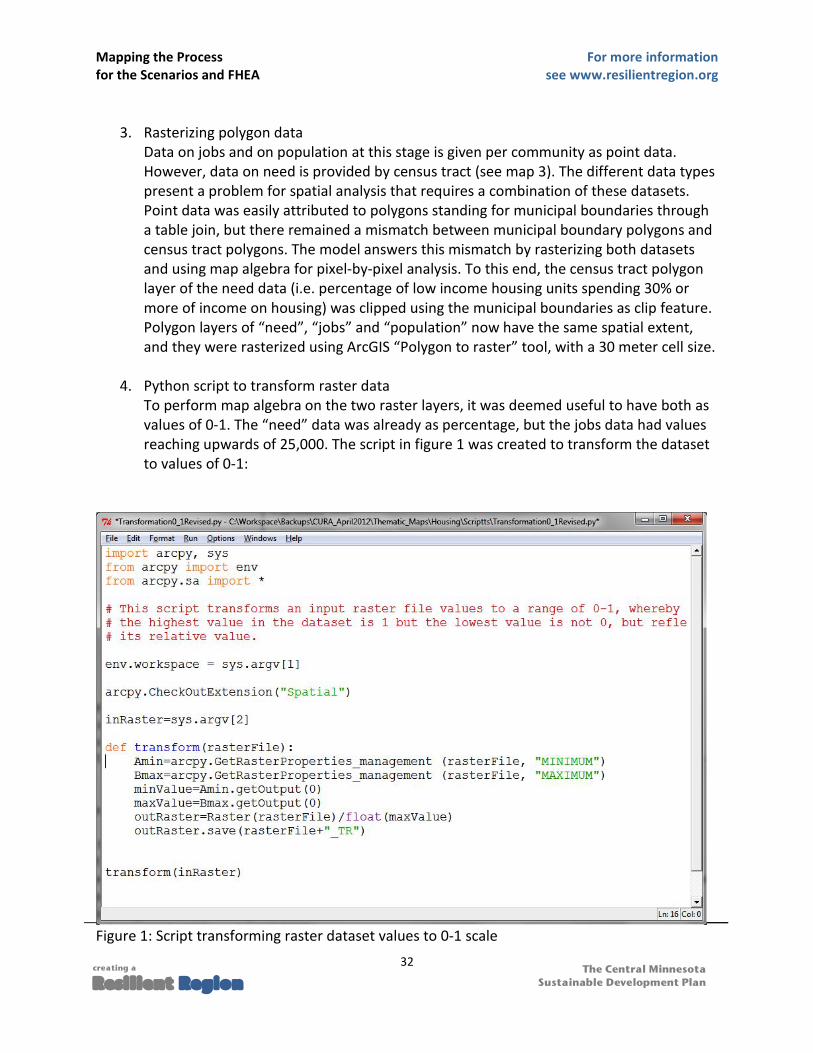
>B V<6:9=!7D.+46!69!6.2=789.3!.276/.!C262!
K9!4/.89.3!324!25,/L.2!9=!6:/!6A9!.276/.!52</.7Q!+6!A27!C//3/C!-7/8-5!69!:2\/!L96:!27!
\25-/7!98!MY"B!K:/!X=//CJ!C262!A27!25./2C<!27!4/.D/=62,/Q!L-6!6:/!e9L7!C262!:2C!\25-/7!
./2D:+=,!-4A2.C7!98!$?QMMMB!K:/!7D.+46!+=!8+,-./!"!A27!D./26/C!69!6.2=789.3!6:/!C2627/6!
69!\25-/7!98!MY"0!!
!
!
!*+,-./!"0!1D.+46!6.2=789.3+=,!.276/.!C2627/6!\25-/7!69!MY"!7D25/!

!"##$%&'()*'+,-.*//! 0-,'1-,*'$%2-,1"($-%'
2-,'()*'3.*%",$-/'"%4'0567' /**'8889,*/$:$*%(,*&$-%9-,&'
%%!
!
!
! ! ! ! ! ! ! ! ! ! ! ! ! ###!
The Central Minnesota
Sustainable Development Plan
creating a
Resilient Region
!!
(B!&.DhF1!"M!N9C/5!'-+5C/.!2=C!42.23/6/.7!
"B N9C/5!42.23/6/.7!
6:/!39C/5!:27!6:/!89559A+=,!-7/.!+=4-6!42.23/6/.70!2!A/+,:6!42.23/6/.!89.!6:/!O//C!
\2.+2L5/k!2!A/+,:6!42.23/6/.!89.!6:/!e9L7!\2.+2L5/k!4/.D/=62,/!\25-/7!89.!6:/!:9-7+=,!
769D;!=//C/C!+=!/2D:!98!6:/!2889.C2L+5+6<!L.2D;/67!_%McQ!?Mc!2=C!WMc!98!6:/!2./2!
3/C+2=!+=D93/`!_6:/7/!42.23/6/.7!C/82-56!69!6:/!\25-/7!4.9\+C/C!L<!P^)!L-6!D2=!L/!
D:2=,/C`k!=-3L/.!98!69625!:9-7+=,!769D;!+=!6:/!./,+9=!_2579!C/82-56+=,!69!6:/!P^)!
4.9\+C/C!=-3L/.`k!2=C!6:/!=23/!98!6:/!fbD/5!9-64-6!8+5/B!!!
!
!*+,-./!$0!-7/.!+=6/.82D/!98!39C/5!6995!
! !
$B h/94.9D/77+=,!94/.26+9=7!
K:/!39C/5!.-=7!6:.9-,:!2!7/.+/7!98!,/94.9D/77+=,!2=C!324!25,/L.2!94/.26+9=70!!
!
2B N24!25,/L.2!"0!A/+,:6!98!e9L7!\2.+2L5/!+7!3-56+45+/C!L<!e9L!\25-/!_MY"`!
LB N24!25,/L.2!$0!A/+,:6!98!=//C!\2.+2L5/!+7!3-56+45+/C!L<!e9L!\25-/!_MY"`!
DB N24!25,/L.2!%0!./7-56+=,!\25-/7!98!e9L7!2=C!=//C!2./!2CC/C!69!4.9\+C/!2!.2=;!4/.!
4+b/5!
CB a2=;!+7!3-56+45+/C!L<!494-526+9=!
/B a276/.!69!495<,9=!i!C/.+\+=,!495<,9=7!+=7+C/!6:/!3-=+D+425!L9-=C2.+/7!A+6:!6:/!
8+=25!.2=;+=,!\25-/7!
8B 1426+25!e9+=0!8+=25!.2=;+=,!\25-/!+7!266.+L-6/C!69!/2D:!3-=+D+425+6<Q!-7+=,!6:/!
3-=+D+425!L9-=C2.<!495<,9=B!'/D2-7/!6:/./!D2=!L/!C+88/./=6!\25-/7!+=7+C/!/2D:!
L9-=C2.<!495<,9=Q!3/.,/!.-5/!X3/2=J!A27!277+,=/C!69!6:/!.2=;+=,!\25-/!
_7:9A+=,!27!haF)(S)f!+=!6:/!./7-56+=,!62L5/`B!
,B K:/!./7-56!+7!2!495<,9=!7:24/8+5/!A+6:!2!8+/5C!98!.2=;!\25-/7!89.!/2D:!D+6<!495<,9=B!
K:/!=/b6!76/4!+7!69!6.2=789.3!6:26!69!2!\25-/!6:26!D2=!L/!-7/C!69!C/.+\/!6:/!
=-3L/.!98!-=+67!4/.!D+6<!8.93!6:/!69625!=-3L/.!98!-=+67!=//C/CB!l25-/!
Xa2=;#7:2./J!A+55!L/!2!85926!89.!/2D:!D+6<Q!A:/./L<!6:/!7-3!98!255!\25-/7!A+55!
/j-25!"0!!!
!

!"##$%&'()*'+,-.*//! 0-,'1-,*'$%2-,1"($-%'
2-,'()*'3.*%",$-/'"%4'0567' /**'8889,*/$:$*%(,*&$-%9-,&'
%>!
!
!
! ! ! ! ! ! ! ! ! ! ! ! ! ###!
The Central Minnesota
Sustainable Development Plan
creating a
Resilient Region
!
!
+B Xh/6!8+/5C!\25-/J!4.9\+C/7!6:/!7-3!98!255!haF)(S)f!_.2=;`!\25-/7!
_1-3h.+C`!
++B X*+/5C!D25D-5269.J!A+6:!/b4./77+9=0!mhaF)(S)fn!@!m1-3h.+Cn!./7-567!+=!6:/!
,*:"($O*'/)",*'-2'*".)',"%Q'2,-1'()*'(-(":'-2'"::'.$($*/B!
:B K:+7!a2=;#7:2./!!\25-/!A27!e9+=/C!69!2!49+=6!7:24/8+5/!98!6:/!723/!D+6+/7!_-7+=,!
D+6<!=23/!27!;/<`!!
!
;%(*,1*4$"(*',*/>:(0!2!49+=6!7:24/8+5/!A+6:!$H!8/26-./7B!K:/!D+6<!8/26-./7!:2\/!2!
85926!8+/5C!.2=;+=,!/2D:!2DD9.C+=,!69!e9L7Q!=//C!2=C!494-526+9=Q!L27/C!9=!2!
D25D-526+9=!6:26!+=D9.49.26/7!A/+,:67!89.!6:/!e9L7!2=C!=//C!\2.+2L5/B!K:/!7-3!98!
255!\25-/7!+=!6:26!8+/5C!+7!"B!!!
!
+B X*+/5C!D25D-5269.J0!*9.!/2D:!2889.C2L+5+6<!L.2D;/6Q!6:/!=-3L/.!98!69625!:9-7+=,!
-=+67!=//C/C!+=!6:/!./,+9=!+7!3-56+45+/C!L<!6:/!Xa2=;#7:2./J!\25-/B!*.93!6:/!
./7-56Q!6:/!=-3L/.!98!/b+76+=,!-=+67!+7!7-L6.2D6/CB!!
!
!
%B S-64-6!_fKT!6995`!!
&!7426+25!fKT!699!A27!D9=76.-D6/C!69!/b49.6!6:/!7:24/8+5/!62L5/!+=69!2=!fbD/5!
74./2C7://6Q!A:+D:!D2=!L/!/27+5<!-7/C!L<!=9=!hF1!4.2D6+6+9=/.7B!!
!
!*+,-./!%0!2!,.24:+D25!./4./7/=626+9=!98!6:/!39C/5!
!
!
!
!
!

!"##$%&'()*'+,-.*//! 0-,'1-,*'$%2-,1"($-%'
2-,'()*'3.*%",$-/'"%4'0567' /**'8889,*/$:$*%(,*&$-%9-,&'
%?!
!
!
! ! ! ! ! ! ! ! ! ! ! ! ! ###!
The Central Minnesota
Sustainable Development Plan
creating a
Resilient Region
!
P*/>:(/'
K:/!./7-56!98!6:/!4.9e/D6!+7!2!6995!6:26!D2=!L/!-7/C!89.!452==+=,!2889.C2L5/!:9-7+=,!C/\/5943/=6!
+=!6:/!./,+9=B!F=!82D6Q!6:/!39C/5!A27!25./2C<!4./7/=6/C!69!2!,.9-4!98!452==+=,!4.2D6+6+9=/.7!A:9!
A9.;!9=!:9-7+=,!+=!6:/!./,+9=Q!2=C!69!P^)!988+D+257B!K:/!82D6!6:26!6:/!39C/5!9-64-6!4.9\+C/7!2!
74./2C7://6!A+6:!2D6-25!=-3L/.7!98!-=+67!69!L/!C/\/594/C!A27!,./265<!A/5D93/C!L<!6:/!
4.2D6+6+9=/.7Q!A:9!=96/C!6:26!6:/!6995!A+55!L/!4-6!69!-7/!L<!C/D+7+9=!32;/.7!+=!6:/!./,+9=B!!!
!
!*+,-./!>0!a/7-56!98!6:/!39C/50!2=!fbD/5!74./2C7://6B!(95-3=7!PQ!F!2=C!g!5+76!6:/!=-3L/.!98!-=+67!
69!L/!C/\/594/C!26!/2D:!2889.C2L+5+6<!L.2D;/6B!
'
'
'
'
'

!"##$%&'()*'+,-.*//! 0-,'1-,*'$%2-,1"($-%'
2-,'()*'3.*%",$-/'"%4'0567' /**'8889,*/$:$*%(,*&$-%9-,&'
%I!
!
!
! ! ! ! ! ! ! ! ! ! ! ! ! ###!
The Central Minnesota
Sustainable Development Plan
creating a
Resilient Region
'
L$1$("($-%/Y'.)"::*%&*/'"%4'#,-K:*1/'
"B T+3+626+9=7!
1/\/.25!277-346+9=7!A/./!32C/!+=!6:/!D./26+9=!98!6:/!39C/5B!Z:+5/!e-76+8+/CQ!793/!
:+,:5+,:6!6:/!5+3+6/C!2DD-.2D<!98!6:/!39C/5B!*9.!/b2345/Q!6:/!39C/5!./5+/7!9=!2=!2=25<7+7!
C/.+\+=,!6:/!=-3L/.!98!e9L7!6:26!/b+76!A+6:+=!2!$M!3+=-6/!D933-6/!8.93!2!,+\/=!D+6<!_7//!
324!?`B!Z:+5/!&.DhF1!=/6A9.;!&=25<76!2559A7!89.!6:/!D./26+9=!98!C.+\/!6+3/!495<,9=7!_7//!
/b2345/7!9=!6:/!324`Q!C262!9=!e9L7!+7!9=5<!2\2+52L5/!27!N+=9.!(+\+5!)+\+7+9=!_N()`!495<,9=7B!
K:/!=-3L/.!98!e9L7!A+6:+=!$M!3+=-6/7!8.93!6:/!D+6<!A27!C/.+\/C!L<!+=6/.7/D6+=,!C.+\/6+3/!
495<,9=7!A+6:!N()!495<,9=7Q!2=C!2,,./,26+=,!e9L7!8+,-./7!8.93!255!N()!495<,9=7B!K:+7!
./7-56/C!+=!+=D5-C+=,!255!e9L7!/\/=!8.93!N()[7!6:26!2./!9=5<!42.6+255<!A+6:+=!6:/!C.+\/6+3/!
495<,9=B!F=!6:/!2L7/=D/!98!2!49+=6!C2627/6!9=!e9L7Q!:9A/\/.Q!6:+7!5+3+626+9=!A27!D9=7+C/./C!
69!L/!6:/!L/76!2\2+52L5/!946+9=B!!
K:/!C262!C/7D.+L+=,!o=//C[!89.!2889.C2L5/!:9-7+=,!+7!8.93!2!NO!P9-7+=,!C2627/6!98!6:/!
89559A+=,!\2.+2L5/0!X4/.D/=62,/!98!59A!+=D93/!:9-7/:95C7!6:26!74/=C!%Mc!9.!39./!98!6:/+.!
+=D93/!9=!:9-7+=,JB!K:+7!A27!62;/=!27!2!,99C!+=C+D269.!9=!6:/!5/\/5!98!=//CQ!L-6!+6!+7!
4.9L2L5<!=96!6:/!9=5<!4977+L5/!9=/B!!
!
!