Central Leprosy Division - National Leprosy Eradication … report 31st March 2013-14.pdf · 1...
28
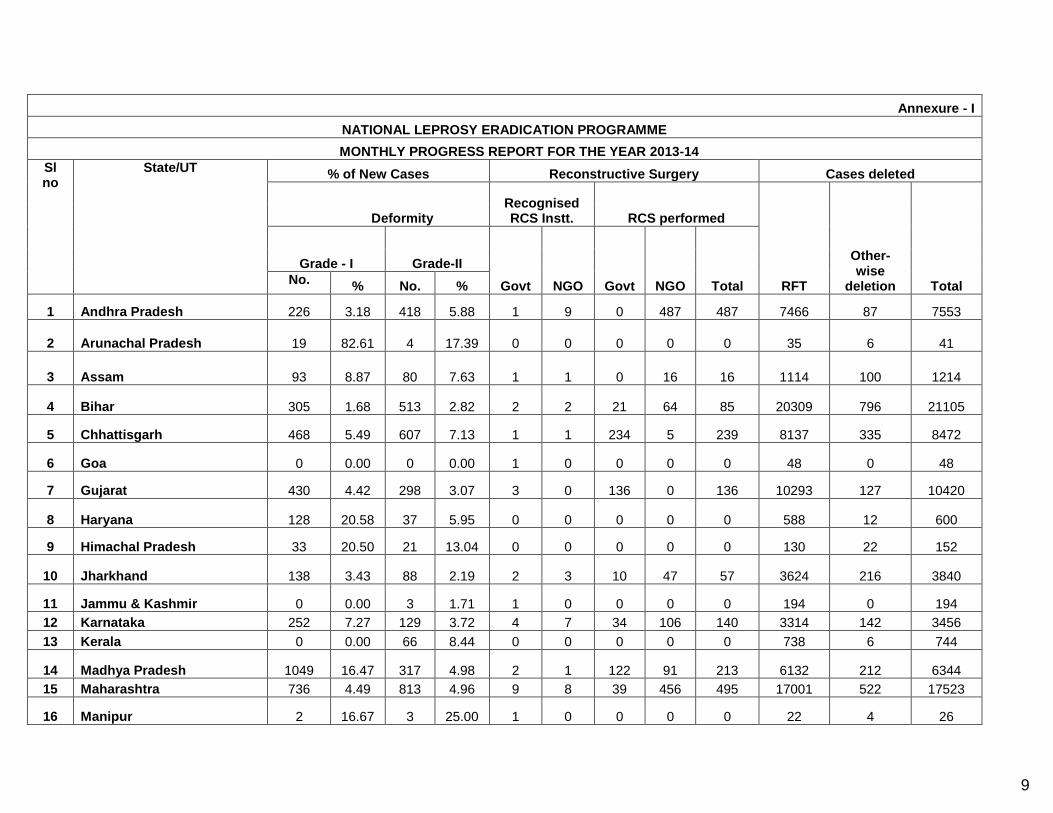
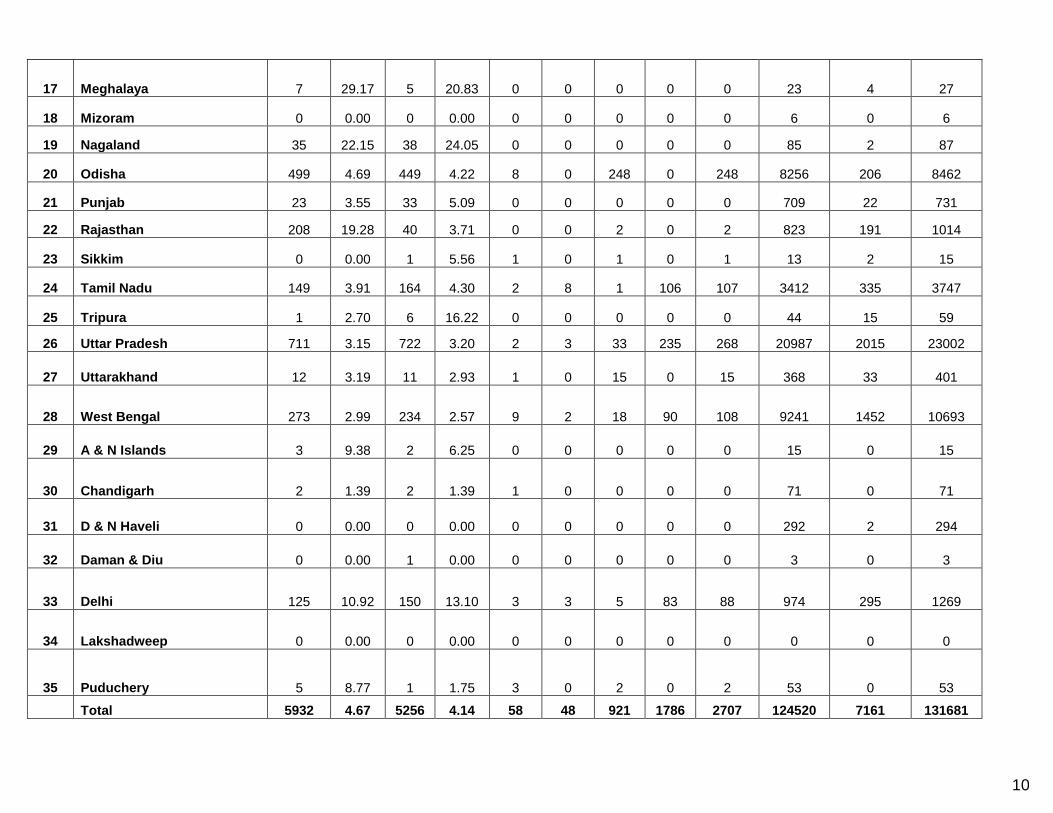
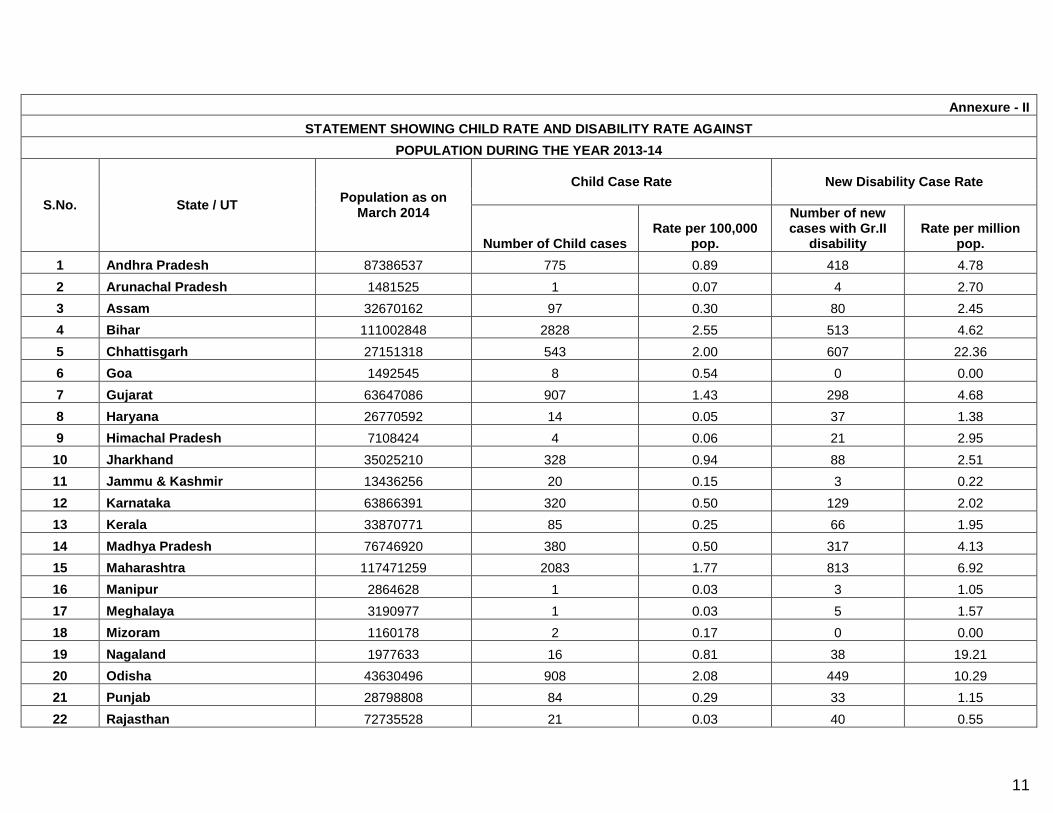
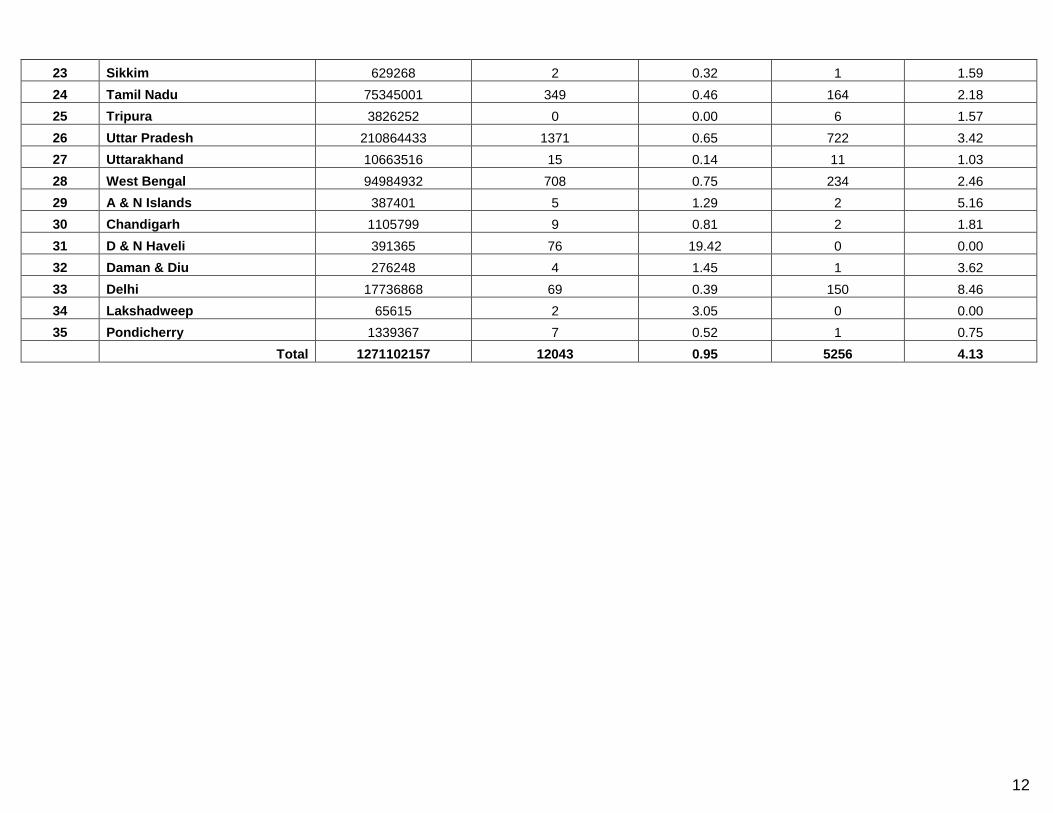
1 Central Leprosy Division Directorate General of Health Services Nirman Bhawan, New Delhi – 110011 NLEP – Progress Report for the year 2013-14 EPIDEMIOLOGICAL STATUS Status in the Country The year 2013-14 started with 0.92 lakh leprosy cases on record as on 1st April 2013, with PR 0.73/10,000. Till then 33 States/ UTs had attained the level of leprosy elimination. 528 districts (81.4%) out of total 649 districts also achieved elimination by March 2013. A total of 209 high endemic districts were identified for special actions during 2012-13. After thorough analysis 1792 blocks & 150 urban areas were identified for special activity. During the year 2013-14 also, Special activities with house to house survey was the main strategy alongwith IEC and capacity building of the workers and volunteers. These activities were carried out in the high endemic blocks of low endemic districts alongwith the left out blocks of high endemic districts in the previous year ( 2012-13). Based on the reports received from all the States and UTs for the year of 2013-14 (Annexure –I), current leprosy situation in the country is as below: 1. A total of 1.27 lakh new cases were detected during the year 2013-14, which gives Annual New Case Detection Rate (ANCDR) of 9.98 per 100,000 population. This shows decrease in ANCDR by 7.4% from 2012-13 (10.78). 2. A total of 0.86 lakh cases are on record as on 1st April 2014, giving a Prevalence rate (PR) of 0.68 per 10,000 population. This shows decrease in PR by 12.8% from 2012-13 (0.78). 3. Detailed information on new leprosy cases detected during 2013-14 indicates the proportion of MB (51.48%), Female (36.91%), Child (9.49%), Grade II Deformity (4.14%), ST cases (17.88%) and SC cases (18.03%). 4. A total of 5256 Gr. II disability detected amongst the New Leprosy Cases during 2013-14, indicating the Gr. II Disability Rate of 4.13 / million population (Annexure-II). 5. A total of 12043 child cases were recorded, indicating the Child Case rate of 0.95/100,000 population (Annexure-II). This shows reduction in child case rate from the year 2012-13 (1.07) by 11.21% 6. Trend of leprosy Prevalence (PR) and Annual New Case Detection (ANCDR) are indicated in the graph below:
Transcript of Central Leprosy Division - National Leprosy Eradication … report 31st March 2013-14.pdf · 1...
1
Central Leprosy Division
Directorate General of Health Services
Nirman Bhawan, New Delhi – 110011
NLEP – Progress Report for the year 2013-14
EPIDEMIOLOGICAL STATUS
Status in the Country
The year 2013-14 started with 0.92 lakh leprosy cases on record as on 1st April 2013, with PR
0.73/10,000. Till then 33 States/ UTs had attained the level of leprosy elimination. 528 districts (81.4%) out
of total 649 districts also achieved elimination by March 2013.
A total of 209 high endemic districts were identified for special actions during 2012-13. After thorough
analysis 1792 blocks & 150 urban areas were identified for special activity. During the year 2013-14 also,
Special activities with house to house survey was the main strategy alongwith IEC and capacity building of
the workers and volunteers. These activities were carried out in the high endemic blocks of low endemic
districts alongwith the left out blocks of high endemic districts in the previous year ( 2012-13).
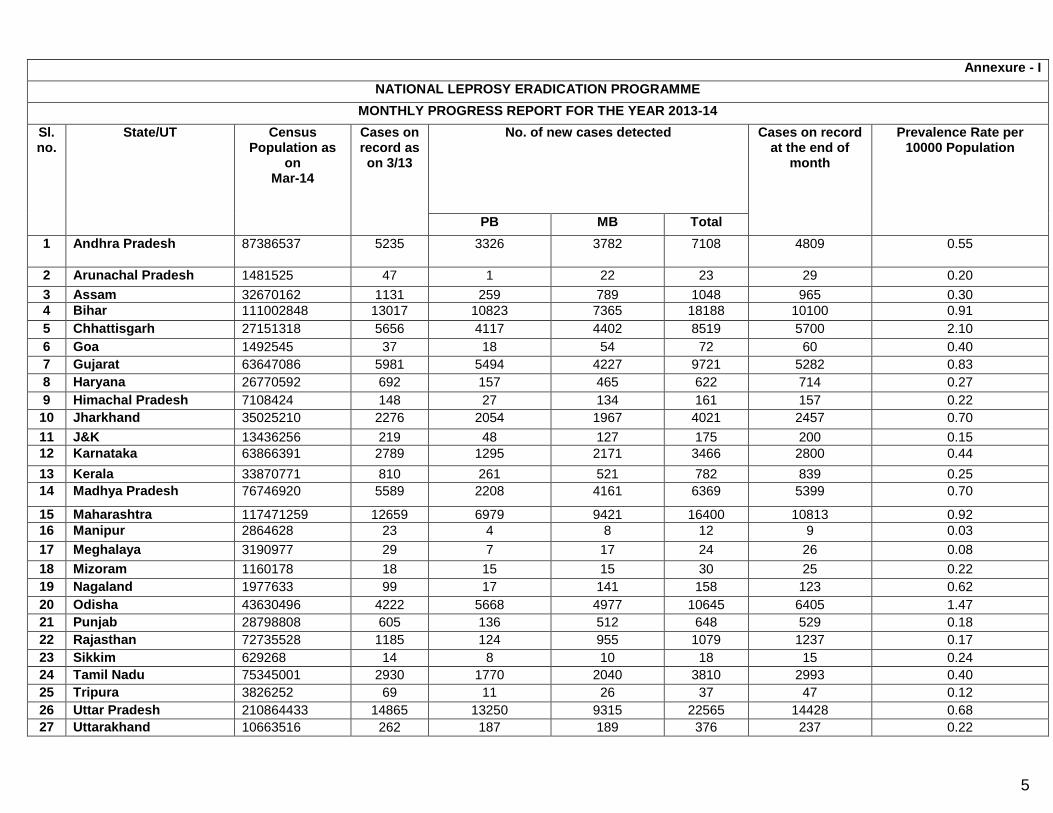
Based on the reports received from all the States and UTs for the year of 2013-14 (Annexure –I),
current leprosy situation in the country is as below:
1. A total of 1.27 lakh new cases were detected during the year 2013-14, which gives Annual New
Case Detection Rate (ANCDR) of 9.98 per 100,000 population. This shows decrease in ANCDR by
7.4% from 2012-13 (10.78).
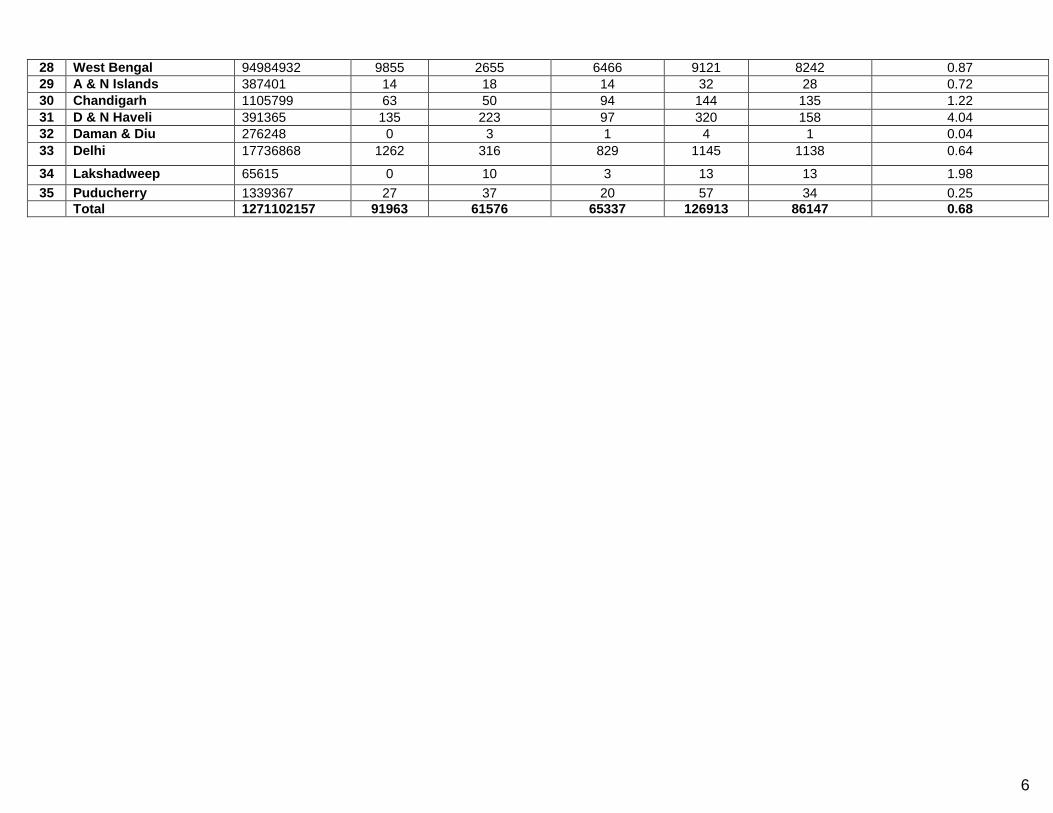
2. A total of 0.86 lakh cases are on record as on 1st April 2014, giving a Prevalence rate (PR) of 0.68
per 10,000 population. This shows decrease in PR by 12.8% from 2012-13 (0.78).
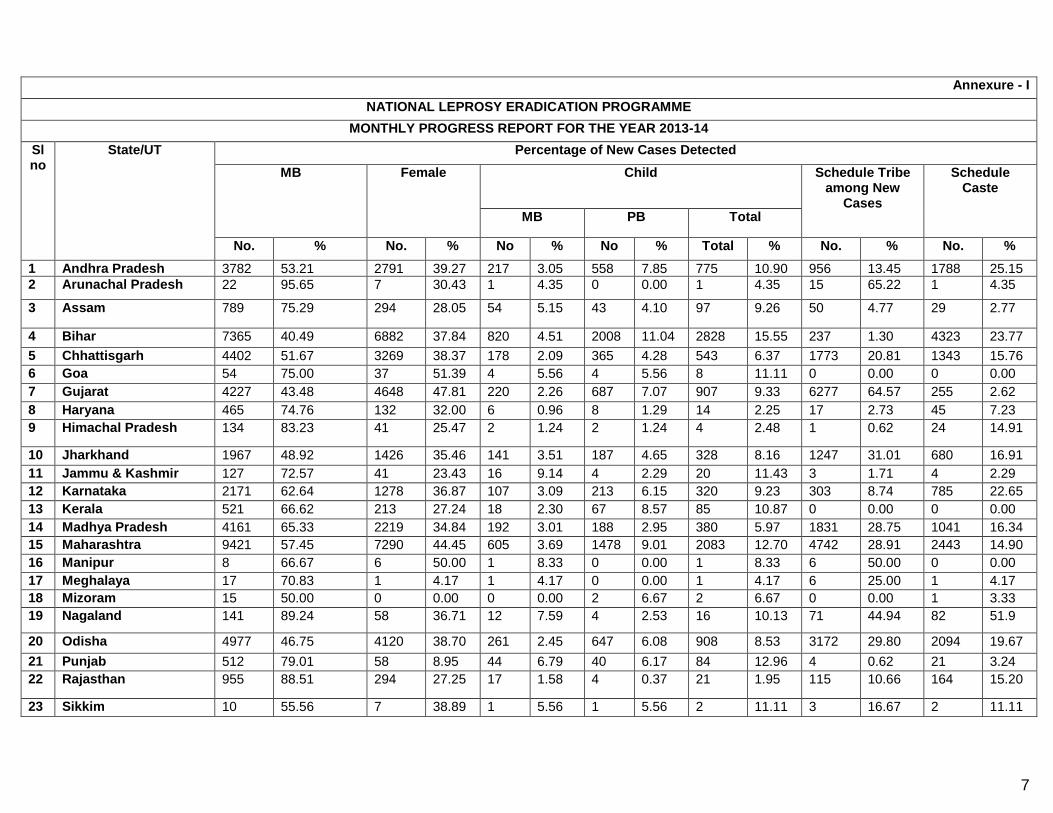
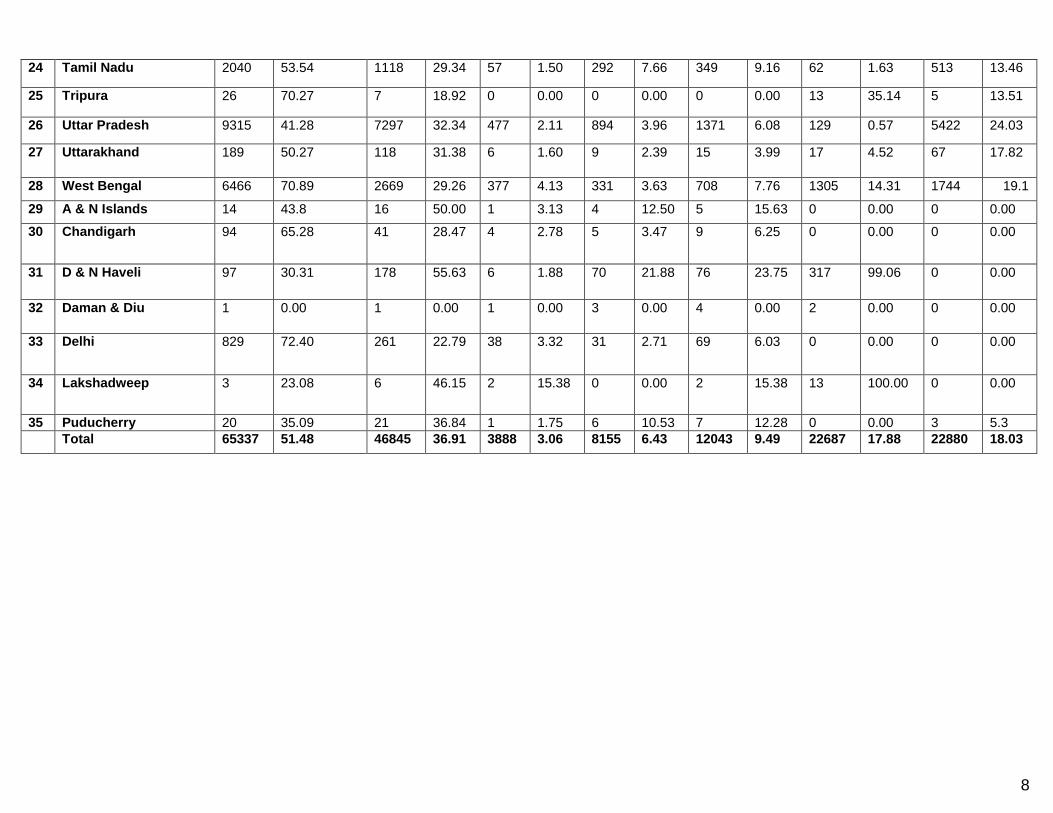
3. Detailed information on new leprosy cases detected during 2013-14 indicates the proportion of MB
(51.48%), Female (36.91%), Child (9.49%), Grade II Deformity (4.14%), ST cases (17.88%) and
SC cases (18.03%).
4. A total of 5256 Gr. II disability detected amongst the New Leprosy Cases during 2013-14,
indicating the Gr. II Disability Rate of 4.13 / million population (Annexure-II).
5. A total of 12043 child cases were recorded, indicating the Child Case rate of 0.95/100,000
population (Annexure-II). This shows reduction in child case rate from the year 2012-13 (1.07) by
11.21%
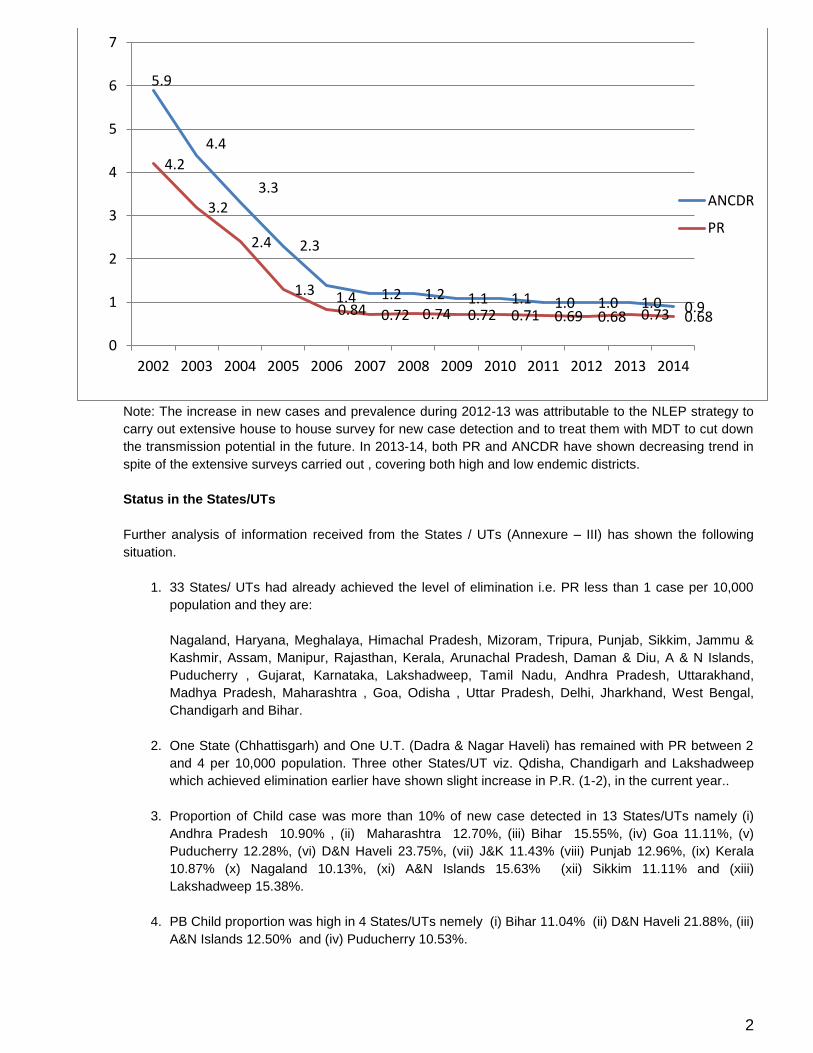
6. Trend of leprosy Prevalence (PR) and Annual New Case Detection (ANCDR) are indicated in the
graph below:
2
Note: The increase in new cases and prevalence during 2012-13 was attributable to the NLEP strategy to
carry out extensive house to house survey for new case detection and to treat them with MDT to cut down
the transmission potential in the future. In 2013-14, both PR and ANCDR have shown decreasing trend in
spite of the extensive surveys carried out , covering both high and low endemic districts.
Status in the States/UTs
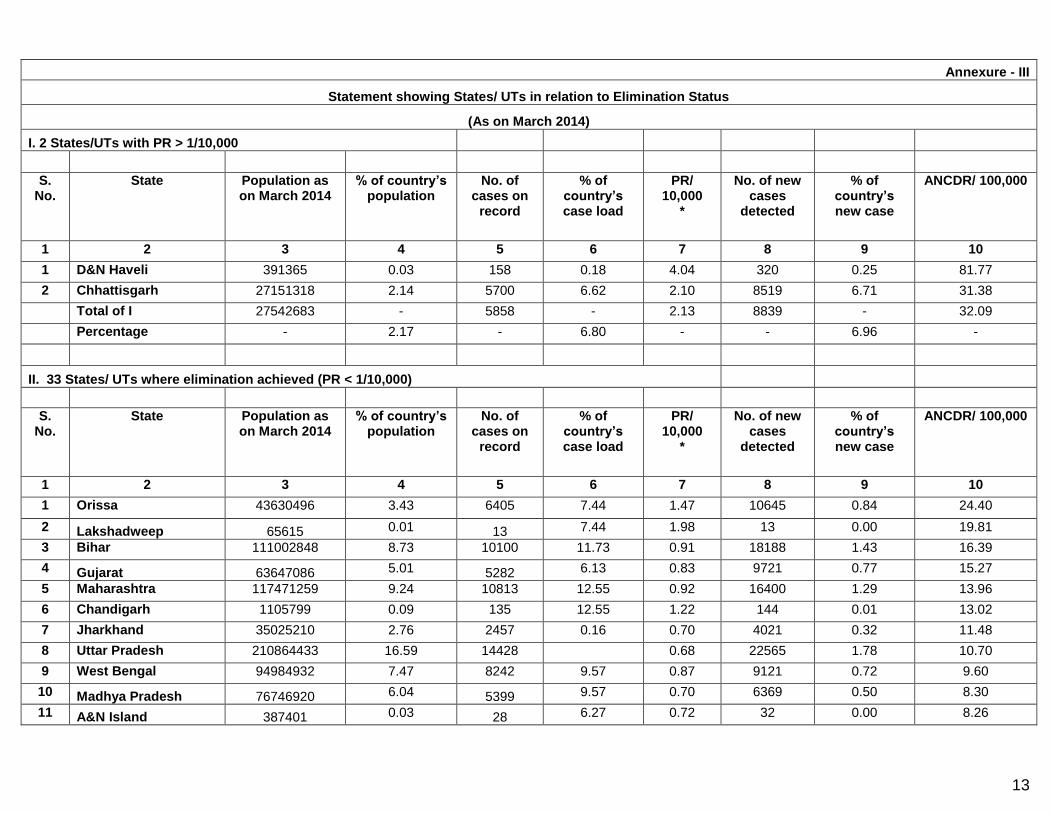
Further analysis of information received from the States / UTs (Annexure – III) has shown the following
situation.
1. 33 States/ UTs had already achieved the level of elimination i.e. PR less than 1 case per 10,000
population and they are:
Nagaland, Haryana, Meghalaya, Himachal Pradesh, Mizoram, Tripura, Punjab, Sikkim, Jammu &
Kashmir, Assam, Manipur, Rajasthan, Kerala, Arunachal Pradesh, Daman & Diu, A & N Islands,
Puducherry , Gujarat, Karnataka, Lakshadweep, Tamil Nadu, Andhra Pradesh, Uttarakhand,
Madhya Pradesh, Maharashtra , Goa, Odisha , Uttar Pradesh, Delhi, Jharkhand, West Bengal,
Chandigarh and Bihar.
2. One State (Chhattisgarh) and One U.T. (Dadra & Nagar Haveli) has remained with PR between 2
and 4 per 10,000 population. Three other States/UT viz. Qdisha, Chandigarh and Lakshadweep
which achieved elimination earlier have shown slight increase in P.R. (1-2), in the current year..
3. Proportion of Child case was more than 10% of new case detected in 13 States/UTs namely (i)
Andhra Pradesh 10.90% , (ii) Maharashtra 12.70%, (iii) Bihar 15.55%, (iv) Goa 11.11%, (v)
Puducherry 12.28%, (vi) D&N Haveli 23.75%, (vii) J&K 11.43% (viii) Punjab 12.96%, (ix) Kerala
10.87% (x) Nagaland 10.13%, (xi) A&N Islands 15.63% (xii) Sikkim 11.11% and (xiii)
Lakshadweep 15.38%.
4. PB Child proportion was high in 4 States/UTs nemely (i) Bihar 11.04% (ii) D&N Haveli 21.88%, (iii)
A&N Islands 12.50% and (iv) Puducherry 10.53%.
5.9
4.4
3.3
2.3
1.4 1.2 1.2 1.1 1.1 1.0 1.0 1.0 0.9
4.2
3.2
2.4
1.3 0.84 0.72 0.74 0.72 0.71 0.69 0.68 0.73 0.68
0
1
2
3
4
5
6
7
2002 2003 2004 2005 2006 2007 2008 2009 2010 2011 2012 2013 2014
ANCDR
PR
3
Status in the Districts
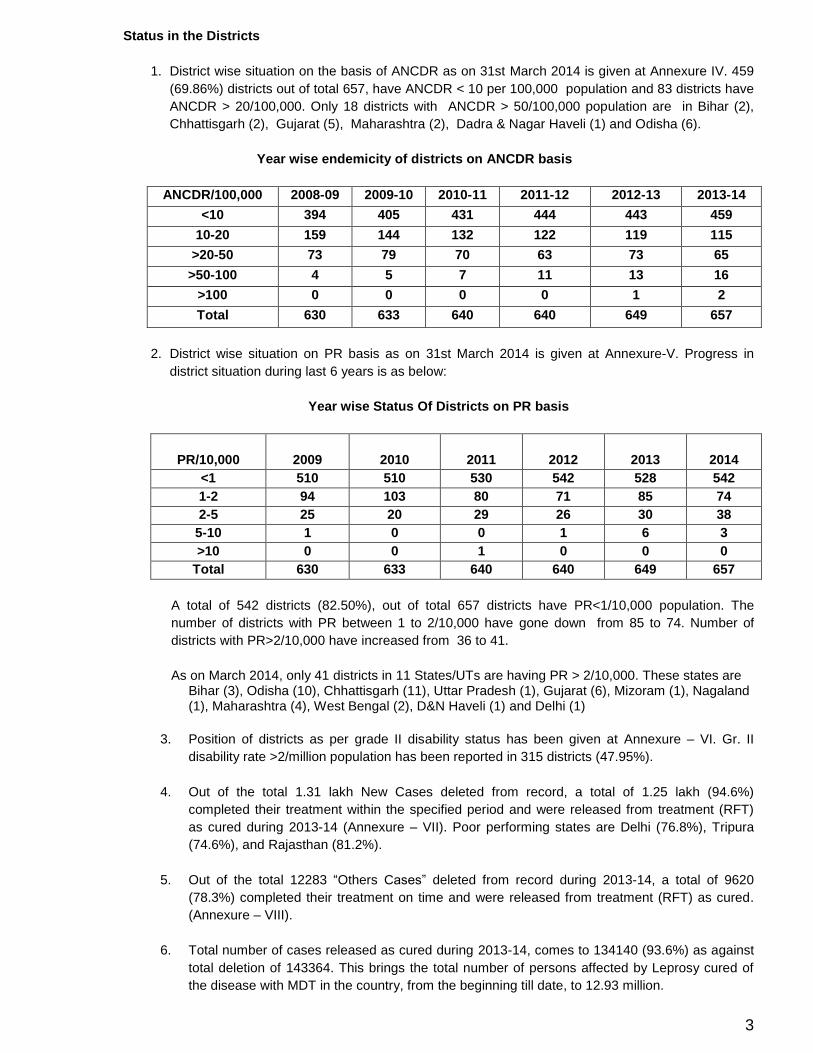
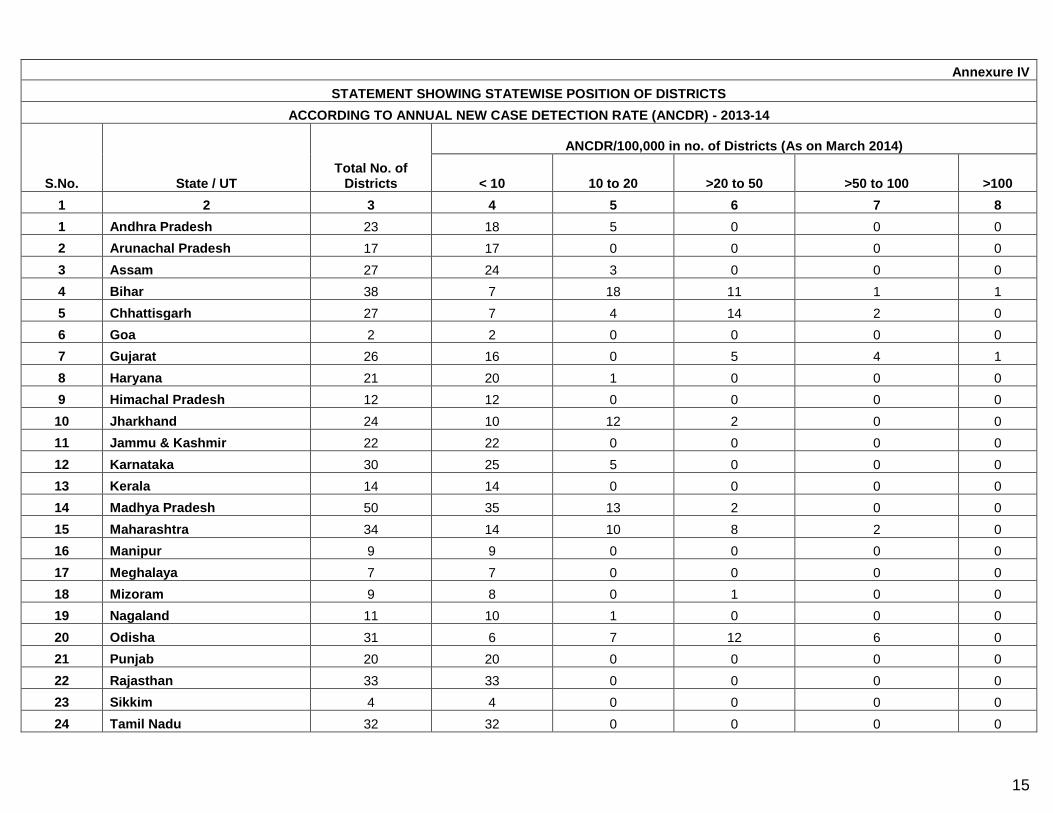
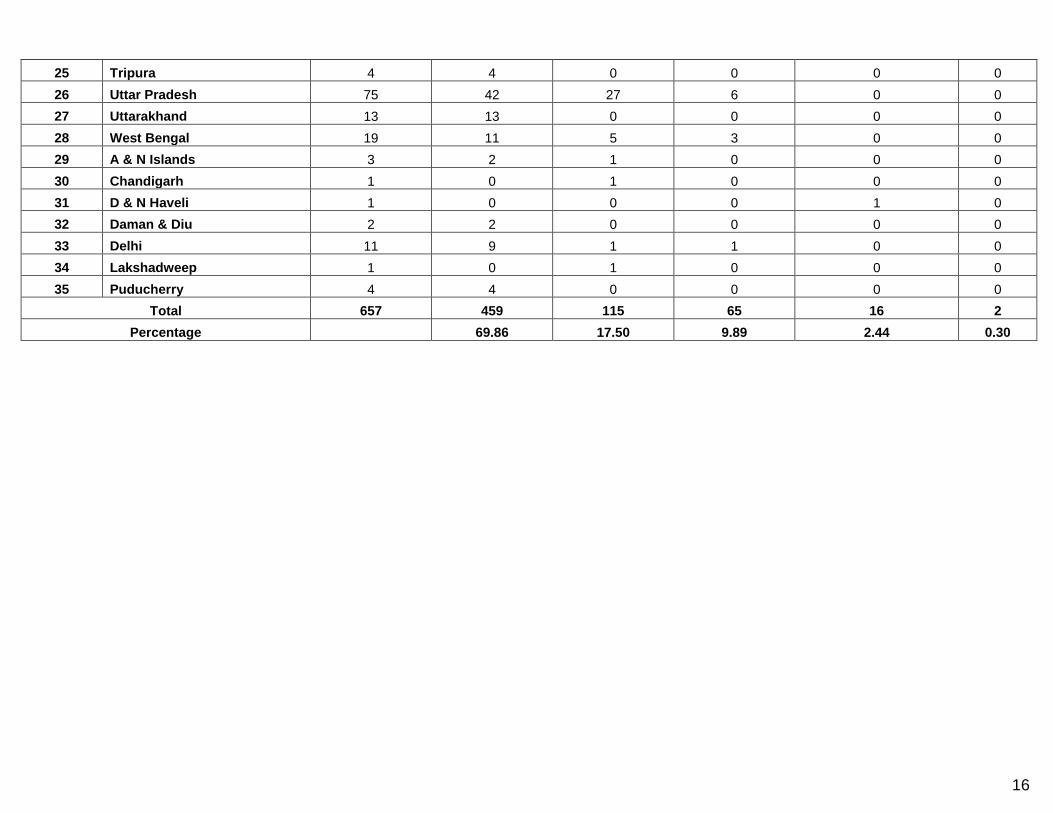
1. District wise situation on the basis of ANCDR as on 31st March 2014 is given at Annexure IV. 459
(69.86%) districts out of total 657, have ANCDR < 10 per 100,000 population and 83 districts have
ANCDR > 20/100,000. Only 18 districts with ANCDR > 50/100,000 population are in Bihar (2),
Chhattisgarh (2), Gujarat (5), Maharashtra (2), Dadra & Nagar Haveli (1) and Odisha (6).
Year wise endemicity of districts on ANCDR basis
ANCDR/100,000 2008-09 2009-10 2010-11 2011-12 2012-13 2013-14
<10 394 405 431 444 443 459
10-20 159 144 132 122 119 115
>20-50 73 79 70 63 73 65
>50-100 4 5 7 11 13 16
>100 0 0 0 0 1 2
Total 630 633 640 640 649 657
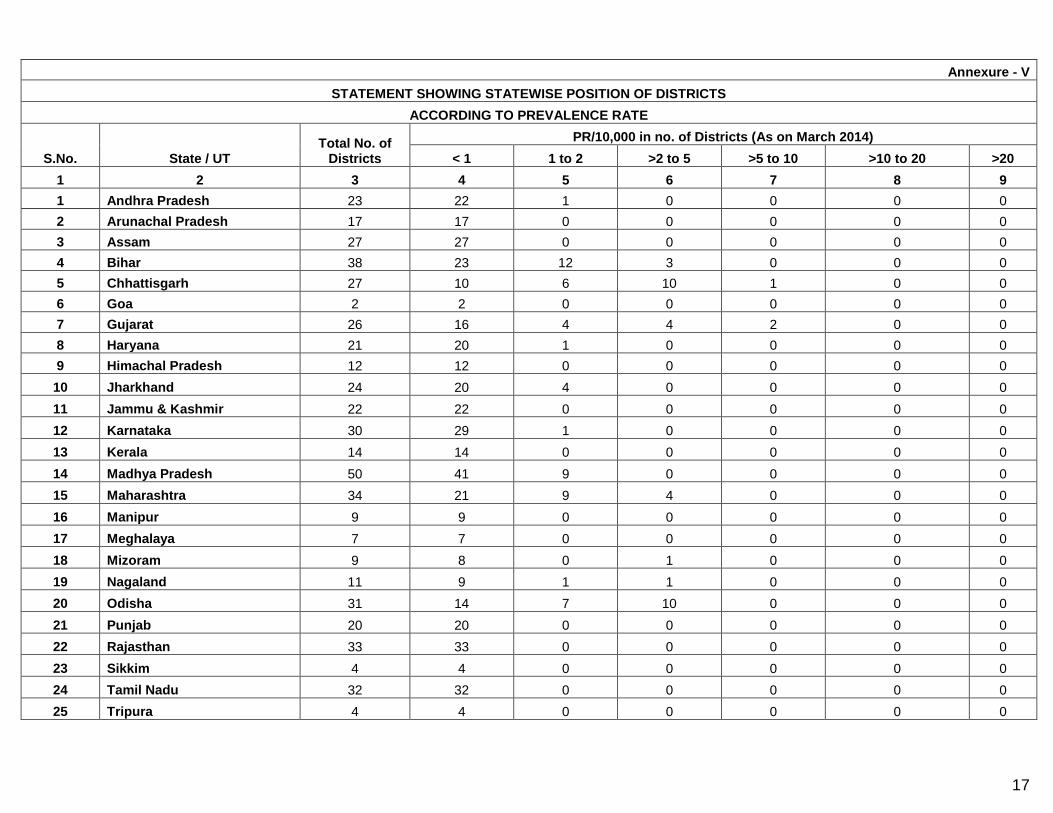
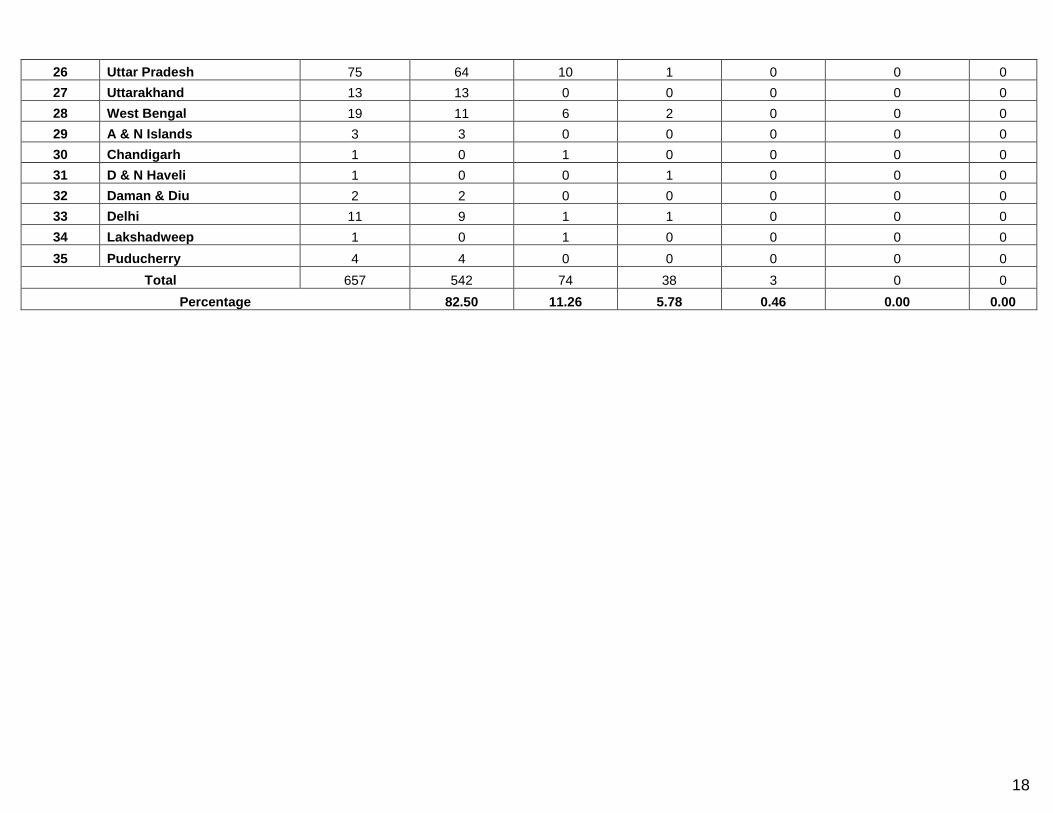
2. District wise situation on PR basis as on 31st March 2014 is given at Annexure-V. Progress in
district situation during last 6 years is as below:
Year wise Status Of Districts on PR basis
PR/10,000 2009 2010
2011
2012
2013
2014
<1 510 510 530 542 528 542
1-2 94 103 80 71 85 74
2-5 25 20 29 26 30 38
5-10 1 0 0 1 6 3
>10 0 0 1 0 0 0
Total 630 633 640 640 649 657
A total of 542 districts (82.50%), out of total 657 districts have PR<1/10,000 population. The
number of districts with PR between 1 to 2/10,000 have gone down from 85 to 74. Number of
districts with PR>2/10,000 have increased from 36 to 41.
As on March 2014, only 41 districts in 11 States/UTs are having PR > 2/10,000. These states are Bihar (3), Odisha (10), Chhattisgarh (11), Uttar Pradesh (1), Gujarat (6), Mizoram (1), Nagaland (1), Maharashtra (4), West Bengal (2), D&N Haveli (1) and Delhi (1)
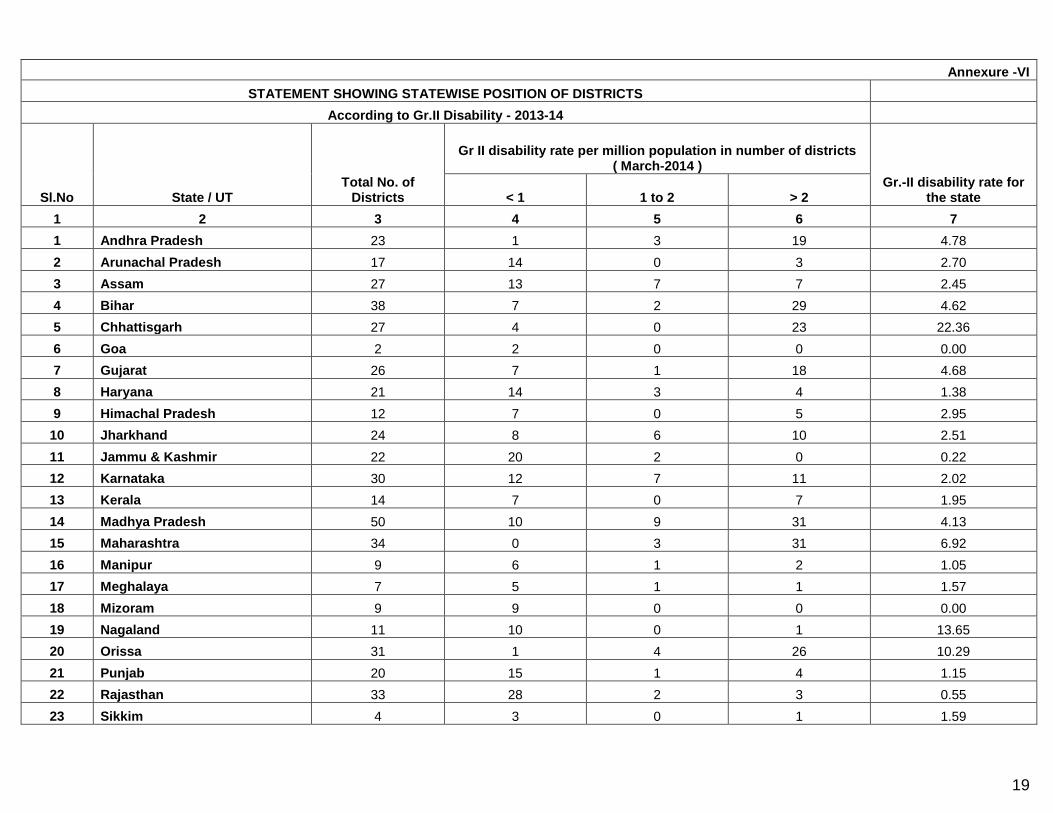
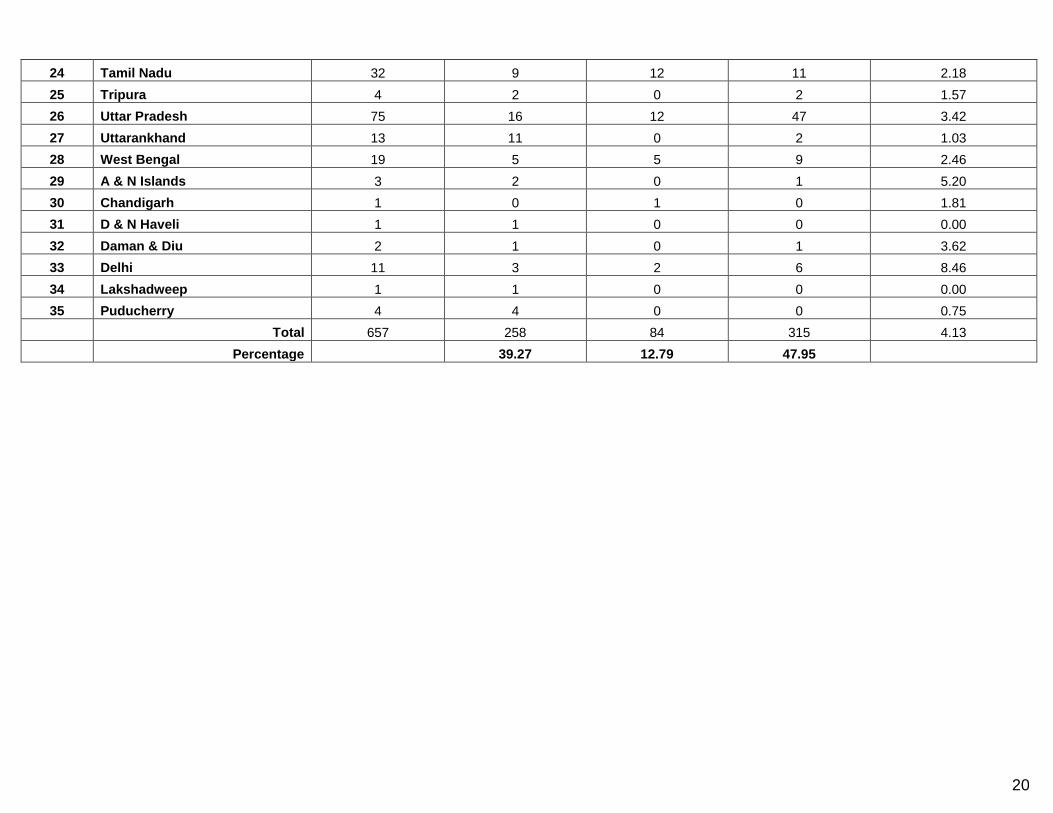
3. Position of districts as per grade II disability status has been given at Annexure – VI. Gr. II
disability rate >2/million population has been reported in 315 districts (47.95%).
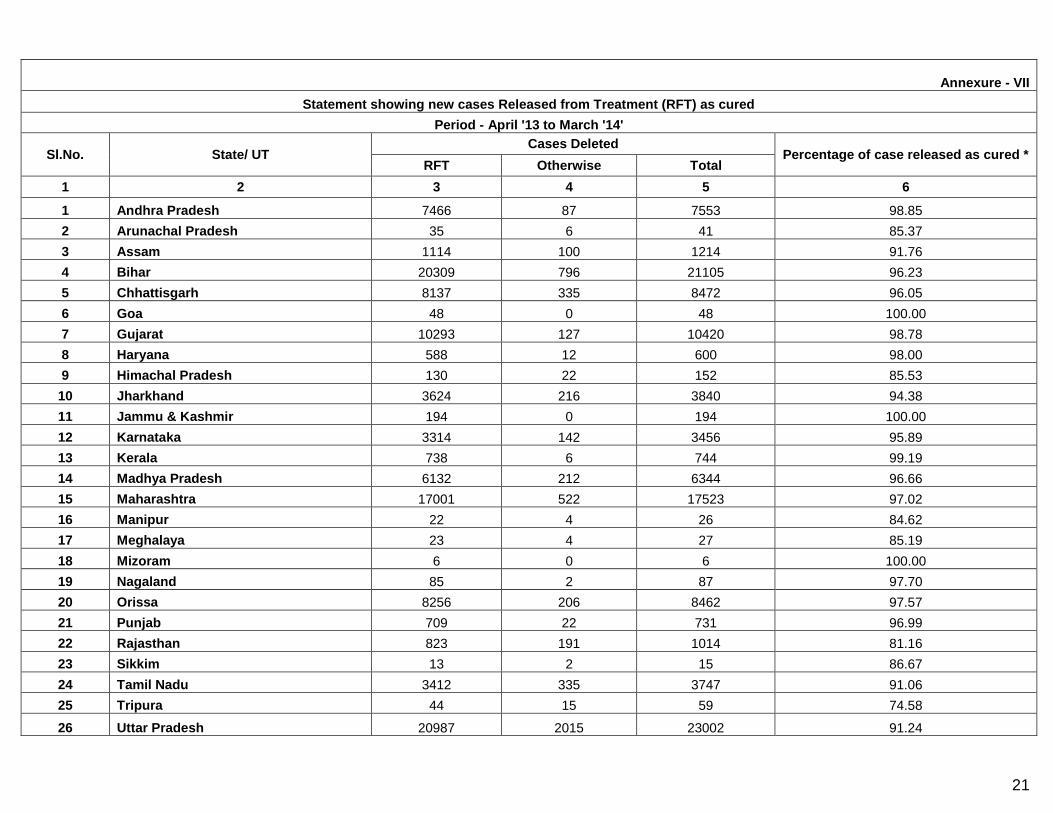
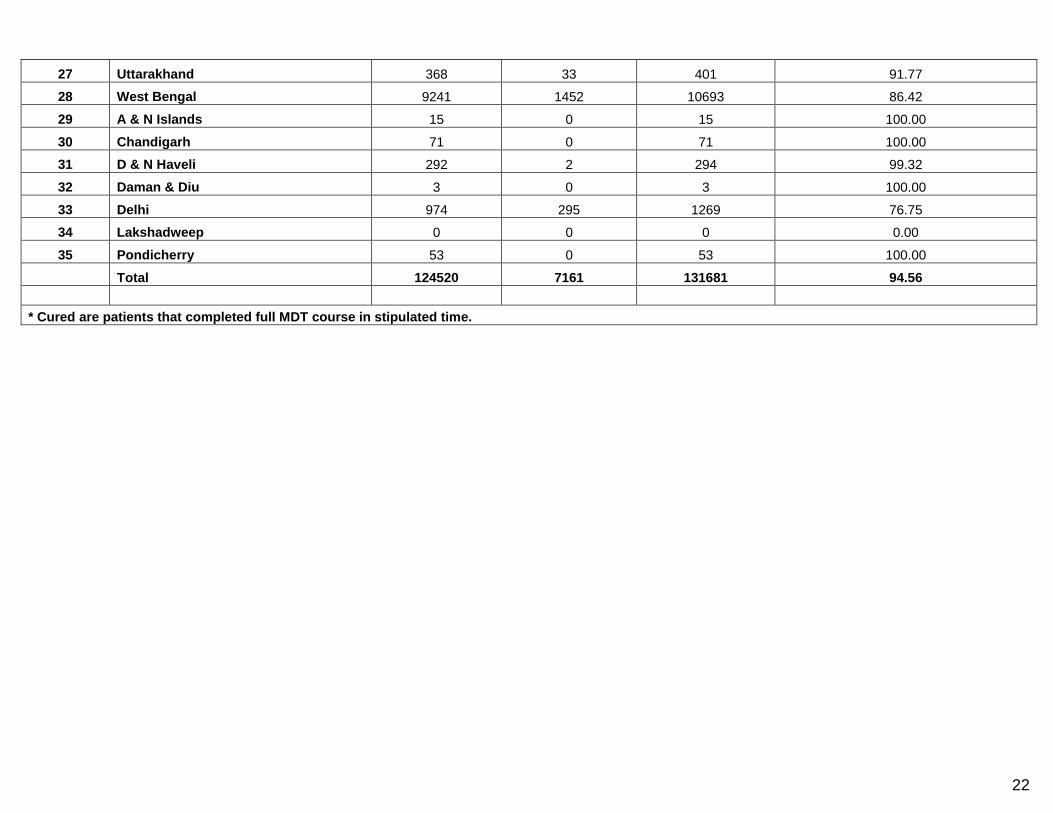
4. Out of the total 1.31 lakh New Cases deleted from record, a total of 1.25 lakh (94.6%)
completed their treatment within the specified period and were released from treatment (RFT)
as cured during 2013-14 (Annexure – VII). Poor performing states are Delhi (76.8%), Tripura
(74.6%), and Rajasthan (81.2%).
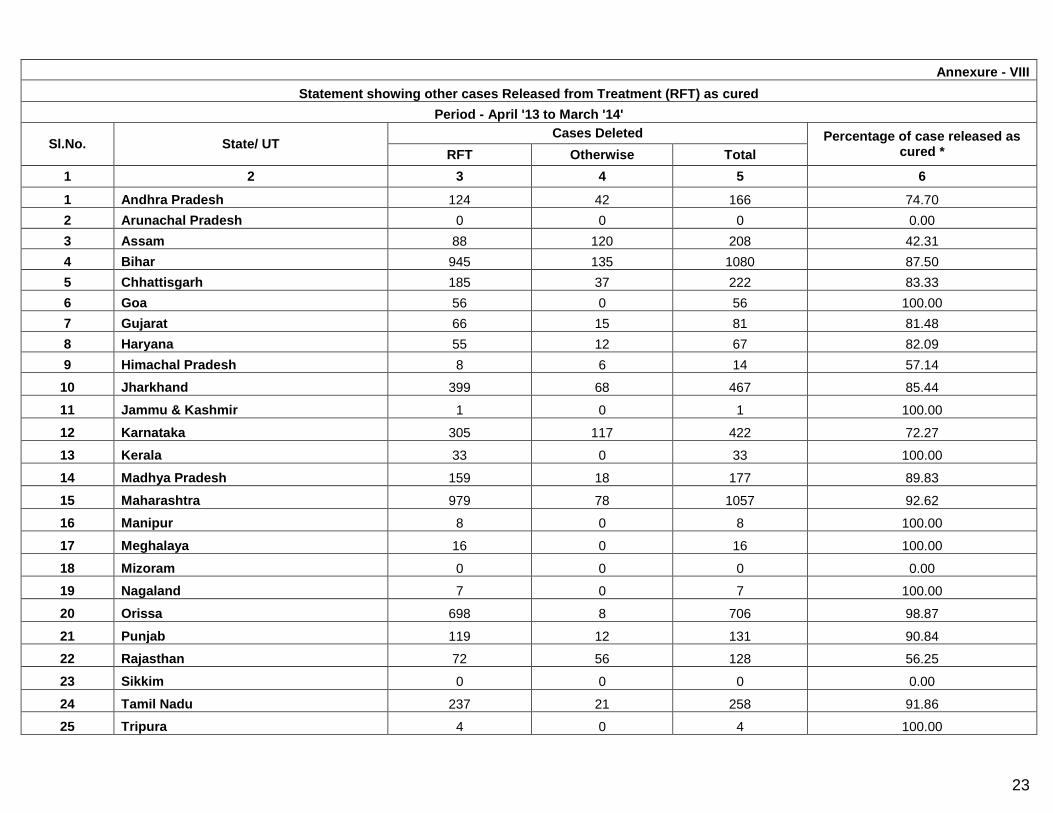
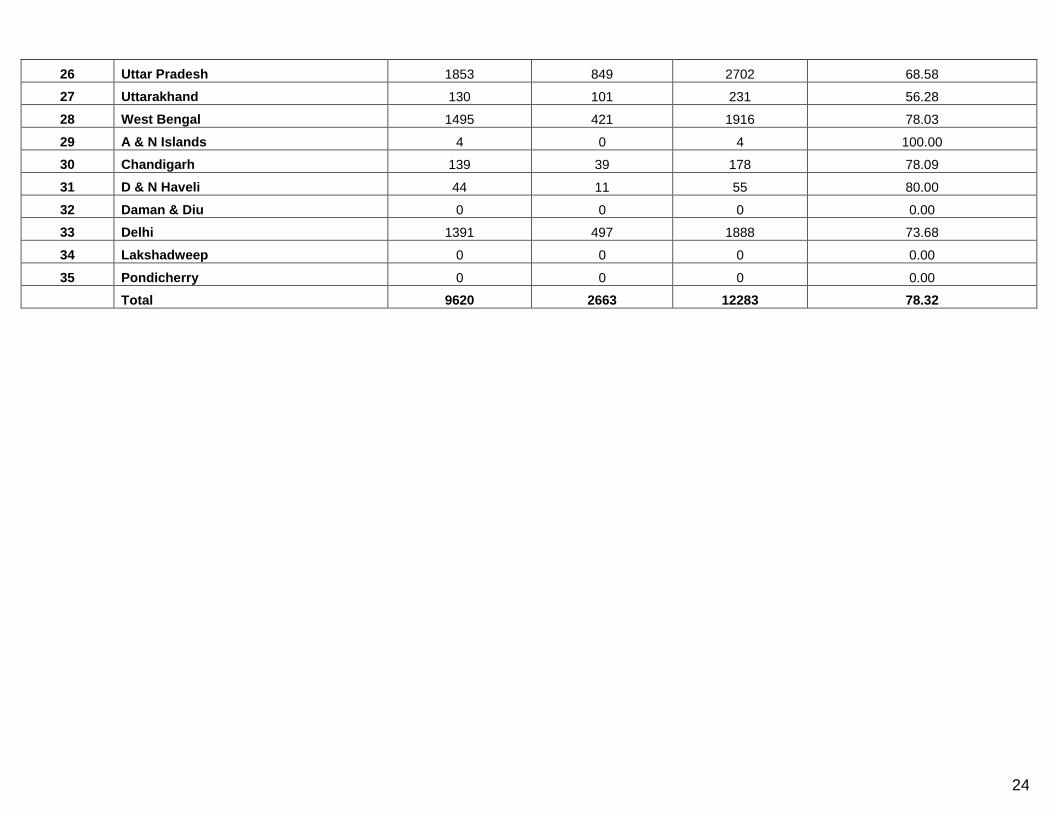
5. Out of the total 12283 “Others Cases” deleted from record during 2013-14, a total of 9620
(78.3%) completed their treatment on time and were released from treatment (RFT) as cured.
(Annexure – VIII).
6. Total number of cases released as cured during 2013-14, comes to 134140 (93.6%) as against
total deletion of 143364. This brings the total number of persons affected by Leprosy cured of
the disease with MDT in the country, from the beginning till date, to 12.93 million.
4
7. Blocks with ANCDR < 10 /100,000 population are 4242 (66.37%) , out of total 6391 blocks
reported.
8. Urban areas with ANCDR < 10/1000, 000 population are 461 (84.59%), out of 545 urban areas
reported.
Other Programme aspects
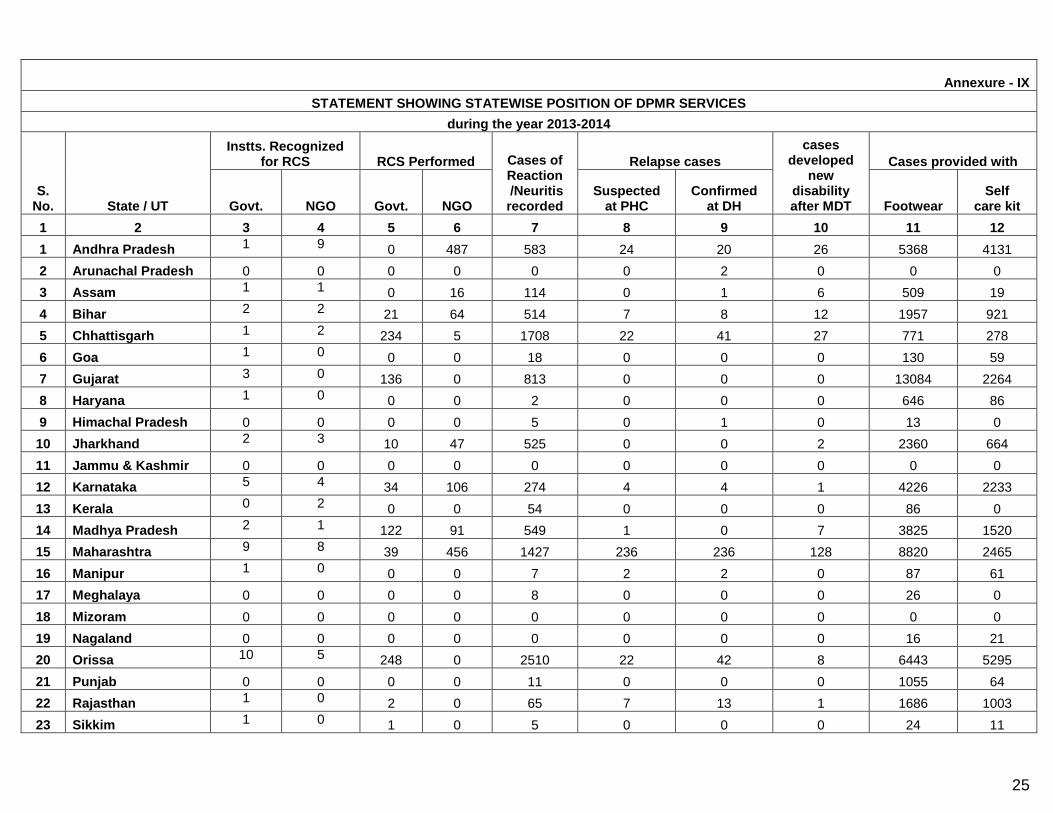
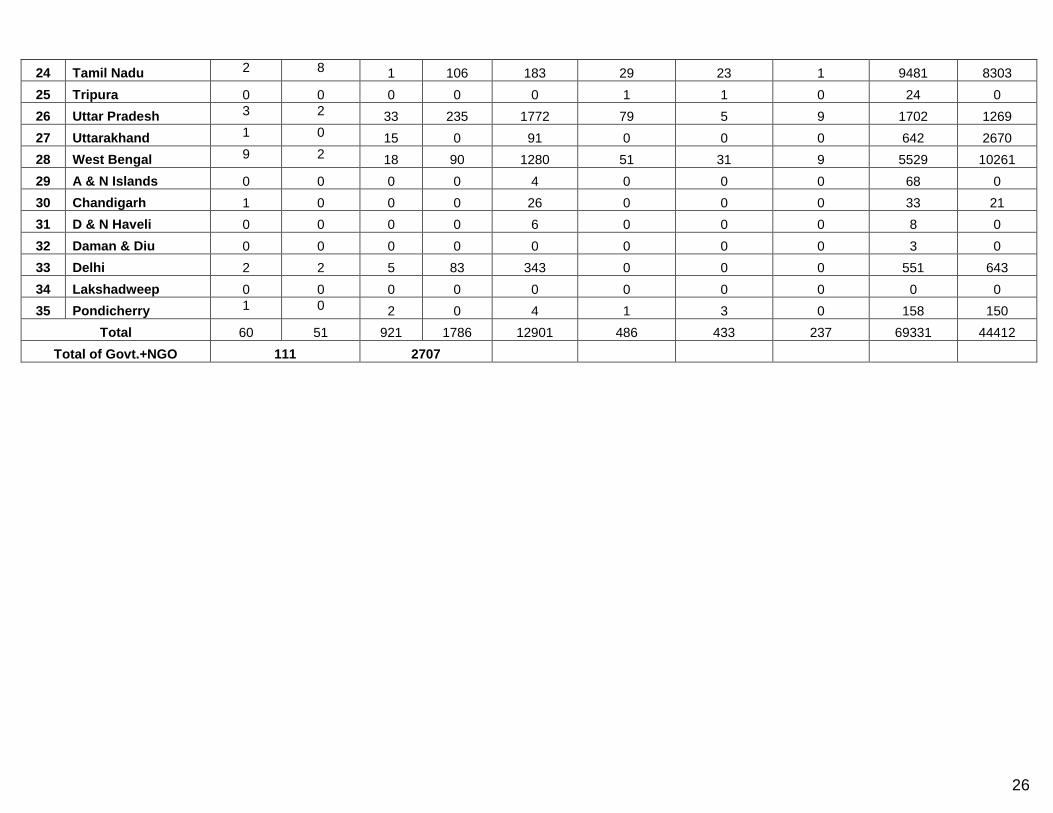
A. DPMR Services
Information pertaining to the Disability Prevention and Medical Rehabilitation (DPMR) as received from
the States/UTs is given at Annexure – IX.
1. Total 111 (Govt.- 60 and NGO- 51) Institutions have been recognized for conducting Reconstructive Surgery to correct the disability in Leprosy Affected Persons.
2. During the year 2013-14 a total of 2707 RCS (Govt. – 921 and NGO – 1786) were conducted. 3. A total of 12901 Reaction/Neuritis episodes were recorded and treated at PHCs and in Secondary
level Institutions. 4. At the PHC level 486 Relapse Cases were suspected and referred to the District Hospitals. A total
of 433 Relapse were confirmed and treated at District Hospital. 5. MCR footwear were provided to 69331 Leprosy Affected Persons. 6. Self Care Kits were provided to 44412 Leprosy Affected Persons.
B. ASHA Involvement
ASHAs under the NRHM were involved in Leprosy programme for last 6 years. However during 2013-
14, their participation has substantially improved.
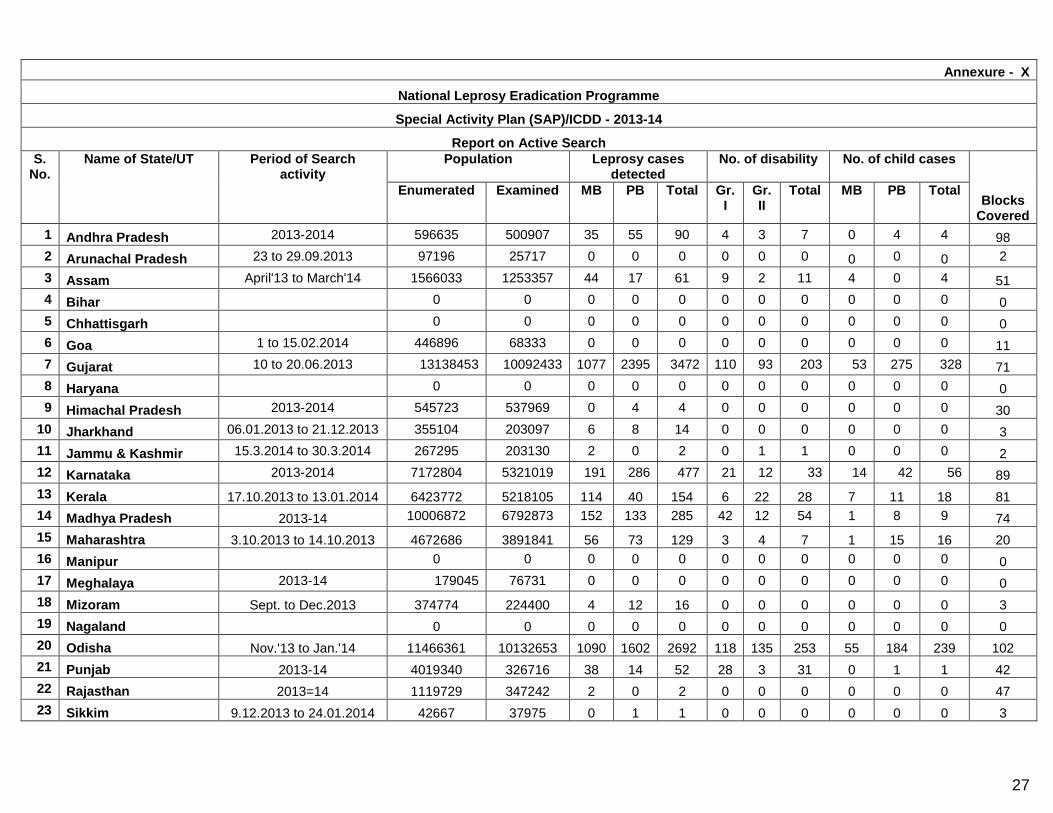
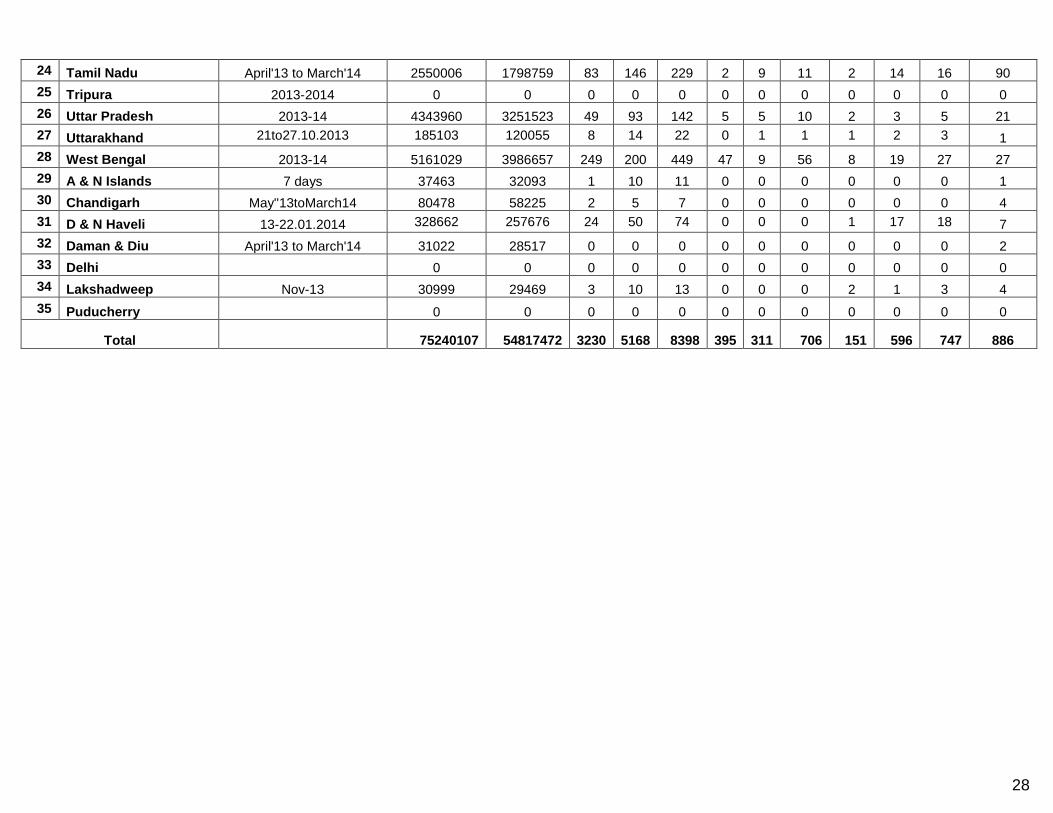
C. Active case detection
Search activities for early detection of New Leprosy cases were carried out during the year 2013-14
as below.
(i) Intensive Case Detection Drive ( ICDD ) was carried out in all the high endemic blocks of low
endemic districts, along with special action plan activities in the remaining blocks of High endemic
districts,that were left out during 2012-13.. A total of 8398 New Leprosy cases were detected
during these search. State/UT wise details are at Annexure IX.
(ii) Active search through house to house visit were also carried out in low endemic areas during the
Anti leprosy fortnight from 30th January to 13th February 2014. A total of 3215 New Leprosy
cases were detected during these search. State/UT wise details are at Annexure X .
Thus, a total of 11613 New cases were detected through active search in the year 2013-14. Amongst
these cases MB 4846 (41.7%), Child 1093 (9.4%), Gr I disability 651 (5.6%) and Gr. II disability 443 (
3.8%) were detected.
5
Annexure - I
NATIONAL LEPROSY ERADICATION PROGRAMME
MONTHLY PROGRESS REPORT FOR THE YEAR 2013-14
Sl. no.
State/UT Census Population as
on Mar-14
Cases on record as on 3/13
No. of new cases detected Cases on record at the end of
month
Prevalence Rate per 10000 Population
PB MB Total
1 Andhra Pradesh 87386537 5235 3326 3782 7108 4809 0.55
2 Arunachal Pradesh 1481525 47 1 22 23 29 0.20
3 Assam 32670162 1131 259 789 1048 965 0.30
4 Bihar 111002848 13017 10823 7365 18188 10100 0.91
5 Chhattisgarh 27151318 5656 4117 4402 8519 5700 2.10
6 Goa 1492545 37 18 54 72 60 0.40
7 Gujarat 63647086 5981 5494 4227 9721 5282 0.83
8 Haryana 26770592 692 157 465 622 714 0.27
9 Himachal Pradesh 7108424 148 27 134 161 157 0.22
10 Jharkhand 35025210 2276 2054 1967 4021 2457 0.70
11 J&K 13436256 219 48 127 175 200 0.15
12 Karnataka 63866391 2789 1295 2171 3466 2800 0.44
13 Kerala 33870771 810 261 521 782 839 0.25
14 Madhya Pradesh 76746920 5589 2208 4161 6369 5399 0.70
15 Maharashtra 117471259 12659 6979 9421 16400 10813 0.92
16 Manipur 2864628 23 4 8 12 9 0.03
17 Meghalaya 3190977 29 7 17 24 26 0.08
18 Mizoram 1160178 18 15 15 30 25 0.22
19 Nagaland 1977633 99 17 141 158 123 0.62
20 Odisha 43630496 4222 5668 4977 10645 6405 1.47
21 Punjab 28798808 605 136 512 648 529 0.18
22 Rajasthan 72735528 1185 124 955 1079 1237 0.17
23 Sikkim 629268 14 8 10 18 15 0.24
24 Tamil Nadu 75345001 2930 1770 2040 3810 2993 0.40
25 Tripura 3826252 69 11 26 37 47 0.12
26 Uttar Pradesh 210864433 14865 13250 9315 22565 14428 0.68
27 Uttarakhand 10663516 262 187 189 376 237 0.22
6
28 West Bengal 94984932 9855 2655 6466 9121 8242 0.87
29 A & N Islands 387401 14 18 14 32 28 0.72
30 Chandigarh 1105799 63 50 94 144 135 1.22
31 D & N Haveli 391365 135 223 97 320 158 4.04
32 Daman & Diu 276248 0 3 1 4 1 0.04
33 Delhi 17736868 1262 316 829 1145 1138 0.64
34 Lakshadweep 65615 0 10 3 13 13 1.98
35 Puducherry 1339367 27 37 20 57 34 0.25
Total 1271102157 91963 61576 65337 126913 86147 0.68
7
Annexure - I
NATIONAL LEPROSY ERADICATION PROGRAMME
MONTHLY PROGRESS REPORT FOR THE YEAR 2013-14
Sl no
State/UT Percentage of New Cases Detected
MB Female Child Schedule Tribe among New
Cases
Schedule Caste
MB PB Total
No. % No. % No % No % Total % No. % No. %
1 Andhra Pradesh 3782 53.21 2791 39.27 217 3.05 558 7.85 775 10.90 956 13.45 1788 25.15
2 Arunachal Pradesh 22 95.65 7 30.43 1 4.35 0 0.00 1 4.35 15 65.22 1 4.35
3 Assam 789 75.29 294 28.05 54 5.15 43 4.10 97 9.26 50 4.77 29 2.77
4 Bihar 7365 40.49 6882 37.84 820 4.51 2008 11.04 2828 15.55 237 1.30 4323 23.77
5 Chhattisgarh 4402 51.67 3269 38.37 178 2.09 365 4.28 543 6.37 1773 20.81 1343 15.76
6 Goa 54 75.00 37 51.39 4 5.56 4 5.56 8 11.11 0 0.00 0 0.00
7 Gujarat 4227 43.48 4648 47.81 220 2.26 687 7.07 907 9.33 6277 64.57 255 2.62
8 Haryana 465 74.76 132 32.00 6 0.96 8 1.29 14 2.25 17 2.73 45 7.23
9 Himachal Pradesh 134 83.23 41 25.47 2 1.24 2 1.24 4 2.48 1 0.62 24 14.91
10 Jharkhand 1967 48.92 1426 35.46 141 3.51 187 4.65 328 8.16 1247 31.01 680 16.91
11 Jammu & Kashmir 127 72.57 41 23.43 16 9.14 4 2.29 20 11.43 3 1.71 4 2.29
12 Karnataka 2171 62.64 1278 36.87 107 3.09 213 6.15 320 9.23 303 8.74 785 22.65
13 Kerala 521 66.62 213 27.24 18 2.30 67 8.57 85 10.87 0 0.00 0 0.00
14 Madhya Pradesh 4161 65.33 2219 34.84 192 3.01 188 2.95 380 5.97 1831 28.75 1041 16.34
15 Maharashtra 9421 57.45 7290 44.45 605 3.69 1478 9.01 2083 12.70 4742 28.91 2443 14.90
16 Manipur 8 66.67 6 50.00 1 8.33 0 0.00 1 8.33 6 50.00 0 0.00
17 Meghalaya 17 70.83 1 4.17 1 4.17 0 0.00 1 4.17 6 25.00 1 4.17
18 Mizoram 15 50.00 0 0.00 0 0.00 2 6.67 2 6.67 0 0.00 1 3.33
19 Nagaland 141 89.24 58 36.71 12 7.59 4 2.53 16 10.13 71 44.94 82 51.9
20 Odisha 4977 46.75 4120 38.70 261 2.45 647 6.08 908 8.53 3172 29.80 2094 19.67
21 Punjab 512 79.01 58 8.95 44 6.79 40 6.17 84 12.96 4 0.62 21 3.24
22 Rajasthan 955 88.51 294 27.25 17 1.58 4 0.37 21 1.95 115 10.66 164 15.20
23 Sikkim 10 55.56 7 38.89 1 5.56 1 5.56 2 11.11 3 16.67 2 11.11
8
24 Tamil Nadu 2040 53.54 1118 29.34 57 1.50 292 7.66 349 9.16 62 1.63 513 13.46
25 Tripura 26 70.27 7 18.92 0 0.00 0 0.00 0 0.00 13 35.14 5 13.51
26 Uttar Pradesh 9315 41.28 7297 32.34 477 2.11 894 3.96 1371 6.08 129 0.57 5422 24.03
27 Uttarakhand 189 50.27 118 31.38 6 1.60 9 2.39 15 3.99 17 4.52 67 17.82
28 West Bengal 6466 70.89 2669 29.26 377 4.13 331 3.63 708 7.76 1305 14.31 1744 19.1
29 A & N Islands 14 43.8 16 50.00 1 3.13 4 12.50 5 15.63 0 0.00 0 0.00
30 Chandigarh 94 65.28 41 28.47 4 2.78 5 3.47 9 6.25 0 0.00 0 0.00
31 D & N Haveli 97 30.31 178 55.63 6 1.88 70 21.88 76 23.75 317 99.06 0 0.00
32 Daman & Diu 1 0.00 1 0.00 1 0.00 3 0.00 4 0.00 2 0.00 0 0.00
33 Delhi 829 72.40 261 22.79 38 3.32 31 2.71 69 6.03 0 0.00 0 0.00
34 Lakshadweep 3 23.08 6 46.15 2 15.38 0 0.00 2 15.38 13 100.00 0 0.00
35 Puducherry 20 35.09 21 36.84 1 1.75 6 10.53 7 12.28 0 0.00 3 5.3
Total 65337 51.48 46845 36.91 3888 3.06 8155 6.43 12043 9.49 22687 17.88 22880 18.03
9
Annexure - I
NATIONAL LEPROSY ERADICATION PROGRAMME
MONTHLY PROGRESS REPORT FOR THE YEAR 2013-14
Sl no
State/UT % of New Cases Reconstructive Surgery Cases deleted
Deformity Recognised RCS Instt. RCS performed
RFT
Other-wise
deletion Total
Grade - I Grade-II
Govt NGO Govt NGO Total No.
% No. %
1 Andhra Pradesh 226 3.18 418 5.88 1 9 0 487 487 7466 87 7553
2 Arunachal Pradesh 19 82.61 4 17.39 0 0 0 0 0 35 6 41
3 Assam 93 8.87 80 7.63 1 1 0 16 16 1114 100 1214
4 Bihar 305 1.68 513 2.82 2 2 21 64 85 20309 796 21105
5 Chhattisgarh 468 5.49 607 7.13 1 1 234 5 239 8137 335 8472
6 Goa 0 0.00 0 0.00 1 0 0 0 0 48 0 48
7 Gujarat 430 4.42 298 3.07 3 0 136 0 136 10293 127 10420
8 Haryana 128 20.58 37 5.95 0 0 0 0 0 588 12 600
9 Himachal Pradesh 33 20.50 21 13.04 0 0 0 0 0 130 22 152
10 Jharkhand 138 3.43 88 2.19 2 3 10 47 57 3624 216 3840
11 Jammu & Kashmir 0 0.00 3 1.71 1 0 0 0 0 194 0 194
12 Karnataka 252 7.27 129 3.72 4 7 34 106 140 3314 142 3456
13 Kerala 0 0.00 66 8.44 0 0 0 0 0 738 6 744
14 Madhya Pradesh 1049 16.47 317 4.98 2 1 122 91 213 6132 212 6344
15 Maharashtra 736 4.49 813 4.96 9 8 39 456 495 17001 522 17523
16 Manipur 2 16.67 3 25.00 1 0 0 0 0 22 4 26
10
17 Meghalaya 7 29.17 5 20.83 0 0 0 0 0 23 4 27
18 Mizoram 0 0.00 0 0.00 0 0 0 0 0 6 0 6
19 Nagaland 35 22.15 38 24.05 0 0 0 0 0 85 2 87
20 Odisha 499 4.69 449 4.22 8 0 248 0 248 8256 206 8462
21 Punjab 23 3.55 33 5.09 0 0 0 0 0 709 22 731
22 Rajasthan 208 19.28 40 3.71 0 0 2 0 2 823 191 1014
23 Sikkim 0 0.00 1 5.56 1 0 1 0 1 13 2 15
24 Tamil Nadu 149 3.91 164 4.30 2 8 1 106 107 3412 335 3747
25 Tripura 1 2.70 6 16.22 0 0 0 0 0 44 15 59
26 Uttar Pradesh 711 3.15 722 3.20 2 3 33 235 268 20987 2015 23002
27 Uttarakhand 12 3.19 11 2.93 1 0 15 0 15 368 33 401
28 West Bengal 273 2.99 234 2.57 9 2 18 90 108 9241 1452 10693
29 A & N Islands 3 9.38 2 6.25 0 0 0 0 0 15 0 15
30 Chandigarh 2 1.39 2 1.39 1 0 0 0 0 71 0 71
31 D & N Haveli 0 0.00 0 0.00 0 0 0 0 0 292 2 294
32 Daman & Diu 0 0.00 1 0.00 0 0 0 0 0 3 0 3
33 Delhi 125 10.92 150 13.10 3 3 5 83 88 974 295 1269
34 Lakshadweep 0 0.00 0 0.00 0 0 0 0 0 0 0 0
35 Puduchery 5 8.77 1 1.75 3 0 2 0 2 53 0 53
Total 5932 4.67 5256 4.14 58 48 921 1786 2707 124520 7161 131681
11
Annexure - II
STATEMENT SHOWING CHILD RATE AND DISABILITY RATE AGAINST
POPULATION DURING THE YEAR 2013-14
S.No. State / UT Population as on
March 2014
Child Case Rate New Disability Case Rate
Number of Child cases Rate per 100,000
pop.
Number of new cases with Gr.II
disability Rate per million
pop.
1 Andhra Pradesh 87386537 775 0.89 418 4.78
2 Arunachal Pradesh 1481525 1 0.07 4 2.70
3 Assam 32670162 97 0.30 80 2.45
4 Bihar 111002848 2828 2.55 513 4.62
5 Chhattisgarh 27151318 543 2.00 607 22.36
6 Goa 1492545 8 0.54 0 0.00
7 Gujarat 63647086 907 1.43 298 4.68
8 Haryana 26770592 14 0.05 37 1.38
9 Himachal Pradesh 7108424 4 0.06 21 2.95
10 Jharkhand 35025210 328 0.94 88 2.51
11 Jammu & Kashmir 13436256 20 0.15 3 0.22
12 Karnataka 63866391 320 0.50 129 2.02
13 Kerala 33870771 85 0.25 66 1.95
14 Madhya Pradesh 76746920 380 0.50 317 4.13
15 Maharashtra 117471259 2083 1.77 813 6.92
16 Manipur 2864628 1 0.03 3 1.05
17 Meghalaya 3190977 1 0.03 5 1.57
18 Mizoram 1160178 2 0.17 0 0.00
19 Nagaland 1977633 16 0.81 38 19.21
20 Odisha 43630496 908 2.08 449 10.29
21 Punjab 28798808 84 0.29 33 1.15
22 Rajasthan 72735528 21 0.03 40 0.55
12
23 Sikkim 629268 2 0.32 1 1.59
24 Tamil Nadu 75345001 349 0.46 164 2.18
25 Tripura 3826252 0 0.00 6 1.57
26 Uttar Pradesh 210864433 1371 0.65 722 3.42
27 Uttarakhand 10663516 15 0.14 11 1.03
28 West Bengal 94984932 708 0.75 234 2.46
29 A & N Islands 387401 5 1.29 2 5.16
30 Chandigarh 1105799 9 0.81 2 1.81
31 D & N Haveli 391365 76 19.42 0 0.00
32 Daman & Diu 276248 4 1.45 1 3.62
33 Delhi 17736868 69 0.39 150 8.46
34 Lakshadweep 65615 2 3.05 0 0.00
35 Pondicherry 1339367 7 0.52 1 0.75
Total 1271102157 12043 0.95 5256 4.13
13
Annexure - III
Statement showing States/ UTs in relation to Elimination Status
(As on March 2014)
I. 2 States/UTs with PR > 1/10,000
S. No.
State Population as on March 2014
% of country’s population
No. of cases on
record
% of country’s case load
PR/ 10,000
*
No. of new cases
detected
% of country’s new case
ANCDR/ 100,000
1 2 3 4 5 6 7 8 9 10
1 D&N Haveli 391365 0.03 158 0.18 4.04 320 0.25 81.77
2 Chhattisgarh 27151318 2.14 5700 6.62 2.10 8519 6.71 31.38
Total of I 27542683 - 5858 - 2.13 8839 - 32.09
Percentage - 2.17 - 6.80 - - 6.96 -
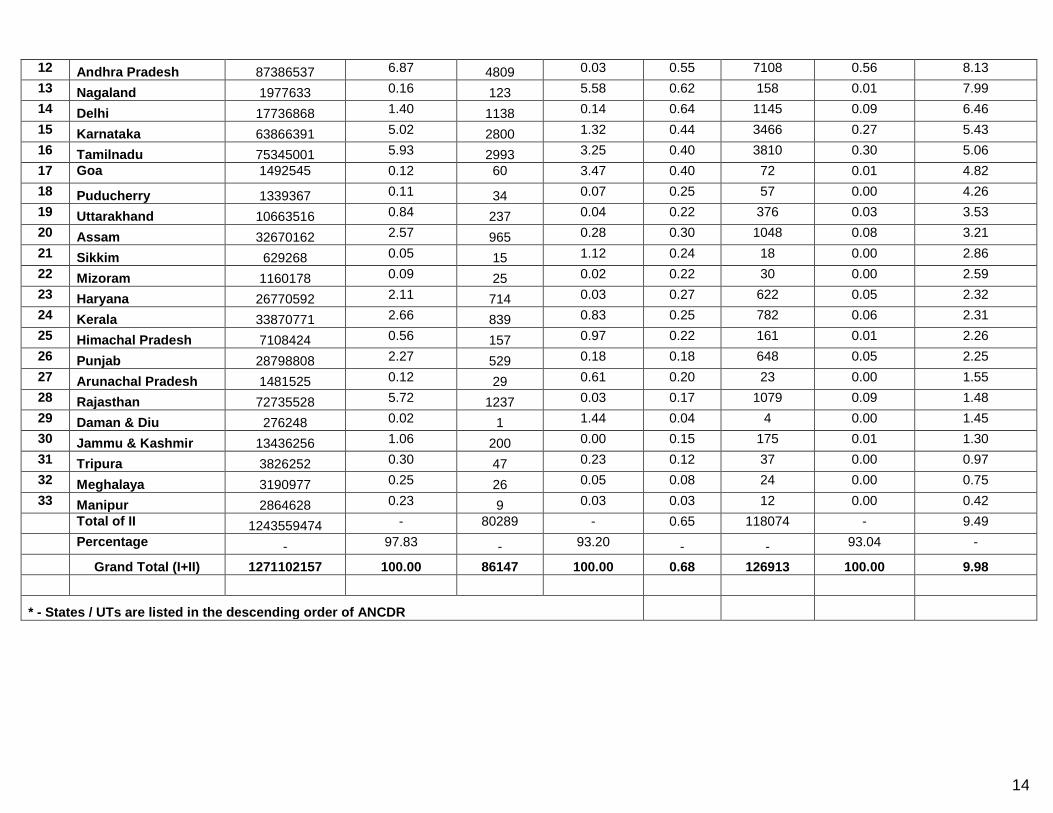
II. 33 States/ UTs where elimination achieved (PR < 1/10,000)
S. No.
State Population as on March 2014
% of country’s population
No. of cases on
record
% of country’s case load
PR/ 10,000
*
No. of new cases
detected
% of country’s new case
ANCDR/ 100,000
1 2 3 4 5 6 7 8 9 10
1 Orissa 43630496 3.43 6405 7.44 1.47 10645 0.84 24.40
2 Lakshadweep 65615 0.01 13 7.44 1.98 13 0.00 19.81
3 Bihar 111002848 8.73 10100 11.73 0.91 18188 1.43 16.39
4 Gujarat 63647086 5.01 5282 6.13 0.83 9721 0.77 15.27
5 Maharashtra 117471259 9.24 10813 12.55 0.92 16400 1.29 13.96
6 Chandigarh 1105799 0.09 135 12.55 1.22 144 0.01 13.02
7 Jharkhand 35025210 2.76 2457 0.16 0.70 4021 0.32 11.48
8 Uttar Pradesh 210864433 16.59 14428 0.68 22565 1.78 10.70
9 West Bengal 94984932 7.47 8242 9.57 0.87 9121 0.72 9.60
10 Madhya Pradesh 76746920 6.04 5399 9.57 0.70 6369 0.50 8.30
11 A&N Island 387401 0.03 28 6.27 0.72 32 0.00 8.26
14
12 Andhra Pradesh 87386537 6.87 4809 0.03 0.55 7108 0.56 8.13
13 Nagaland 1977633 0.16 123 5.58 0.62 158 0.01 7.99
14 Delhi 17736868 1.40 1138 0.14 0.64 1145 0.09 6.46
15 Karnataka 63866391 5.02 2800 1.32 0.44 3466 0.27 5.43
16 Tamilnadu 75345001 5.93 2993 3.25 0.40 3810 0.30 5.06
17 Goa 1492545 0.12 60 3.47 0.40 72 0.01 4.82
18 Puducherry 1339367 0.11 34 0.07 0.25 57 0.00 4.26
19 Uttarakhand 10663516 0.84 237 0.04 0.22 376 0.03 3.53
20 Assam 32670162 2.57 965 0.28 0.30 1048 0.08 3.21
21 Sikkim 629268 0.05 15 1.12 0.24 18 0.00 2.86
22 Mizoram 1160178 0.09 25 0.02 0.22 30 0.00 2.59
23 Haryana 26770592 2.11 714 0.03 0.27 622 0.05 2.32
24 Kerala 33870771 2.66 839 0.83 0.25 782 0.06 2.31
25 Himachal Pradesh 7108424 0.56 157 0.97 0.22 161 0.01 2.26
26 Punjab 28798808 2.27 529 0.18 0.18 648 0.05 2.25
27 Arunachal Pradesh 1481525 0.12 29 0.61 0.20 23 0.00 1.55
28 Rajasthan 72735528 5.72 1237 0.03 0.17 1079 0.09 1.48
29 Daman & Diu 276248 0.02 1 1.44 0.04 4 0.00 1.45
30 Jammu & Kashmir 13436256 1.06 200 0.00 0.15 175 0.01 1.30
31 Tripura 3826252 0.30 47 0.23 0.12 37 0.00 0.97
32 Meghalaya 3190977 0.25 26 0.05 0.08 24 0.00 0.75
33 Manipur 2864628 0.23 9 0.03 0.03 12 0.00 0.42
Total of II 1243559474 - 80289 - 0.65 118074 - 9.49
Percentage - 97.83 - 93.20 - - 93.04 -
Grand Total (I+II) 1271102157 100.00 86147 100.00 0.68 126913 100.00 9.98
* - States / UTs are listed in the descending order of ANCDR
15
Annexure IV
STATEMENT SHOWING STATEWISE POSITION OF DISTRICTS
ACCORDING TO ANNUAL NEW CASE DETECTION RATE (ANCDR) - 2013-14
S.No. State / UT Total No. of
Districts
ANCDR/100,000 in no. of Districts (As on March 2014)
< 10 10 to 20 >20 to 50 >50 to 100 >100
1 2 3 4 5 6 7 8
1 Andhra Pradesh 23 18 5 0 0 0
2 Arunachal Pradesh 17 17 0 0 0 0
3 Assam 27 24 3 0 0 0
4 Bihar 38 7 18 11 1 1
5 Chhattisgarh 27 7 4 14 2 0
6 Goa 2 2 0 0 0 0
7 Gujarat 26 16 0 5 4 1
8 Haryana 21 20 1 0 0 0
9 Himachal Pradesh 12 12 0 0 0 0
10 Jharkhand 24 10 12 2 0 0
11 Jammu & Kashmir 22 22 0 0 0 0
12 Karnataka 30 25 5 0 0 0
13 Kerala 14 14 0 0 0 0
14 Madhya Pradesh 50 35 13 2 0 0
15 Maharashtra 34 14 10 8 2 0
16 Manipur 9 9 0 0 0 0
17 Meghalaya 7 7 0 0 0 0
18 Mizoram 9 8 0 1 0 0
19 Nagaland 11 10 1 0 0 0
20 Odisha 31 6 7 12 6 0
21 Punjab 20 20 0 0 0 0
22 Rajasthan 33 33 0 0 0 0
23 Sikkim 4 4 0 0 0 0
24 Tamil Nadu 32 32 0 0 0 0
16
25 Tripura 4 4 0 0 0 0
26 Uttar Pradesh 75 42 27 6 0 0
27 Uttarakhand 13 13 0 0 0 0
28 West Bengal 19 11 5 3 0 0
29 A & N Islands 3 2 1 0 0 0
30 Chandigarh 1 0 1 0 0 0
31 D & N Haveli 1 0 0 0 1 0
32 Daman & Diu 2 2 0 0 0 0
33 Delhi 11 9 1 1 0 0
34 Lakshadweep 1 0 1 0 0 0
35 Puducherry 4 4 0 0 0 0
Total 657 459 115 65 16 2
Percentage 69.86 17.50 9.89 2.44 0.30
17
Annexure - V
STATEMENT SHOWING STATEWISE POSITION OF DISTRICTS
ACCORDING TO PREVALENCE RATE
S.No. State / UT Total No. of
Districts
PR/10,000 in no. of Districts (As on March 2014)
< 1 1 to 2 >2 to 5 >5 to 10 >10 to 20 >20
1 2 3 4 5 6 7 8 9
1 Andhra Pradesh 23 22 1 0 0 0 0
2 Arunachal Pradesh 17 17 0 0 0 0 0
3 Assam 27 27 0 0 0 0 0
4 Bihar 38 23 12 3 0 0 0
5 Chhattisgarh 27 10 6 10 1 0 0
6 Goa 2 2 0 0 0 0 0
7 Gujarat 26 16 4 4 2 0 0
8 Haryana 21 20 1 0 0 0 0
9 Himachal Pradesh 12 12 0 0 0 0 0
10 Jharkhand 24 20 4 0 0 0 0
11 Jammu & Kashmir 22 22 0 0 0 0 0
12 Karnataka 30 29 1 0 0 0 0
13 Kerala 14 14 0 0 0 0 0
14 Madhya Pradesh 50 41 9 0 0 0 0
15 Maharashtra 34 21 9 4 0 0 0
16 Manipur 9 9 0 0 0 0 0
17 Meghalaya 7 7 0 0 0 0 0
18 Mizoram 9 8 0 1 0 0 0
19 Nagaland 11 9 1 1 0 0 0
20 Odisha 31 14 7 10 0 0 0
21 Punjab 20 20 0 0 0 0 0
22 Rajasthan 33 33 0 0 0 0 0
23 Sikkim 4 4 0 0 0 0 0
24 Tamil Nadu 32 32 0 0 0 0 0
25 Tripura 4 4 0 0 0 0 0
18
26 Uttar Pradesh 75 64 10 1 0 0 0
27 Uttarakhand 13 13 0 0 0 0 0
28 West Bengal 19 11 6 2 0 0 0
29 A & N Islands 3 3 0 0 0 0 0
30 Chandigarh 1 0 1 0 0 0 0
31 D & N Haveli 1 0 0 1 0 0 0
32 Daman & Diu 2 2 0 0 0 0 0
33 Delhi 11 9 1 1 0 0 0
34 Lakshadweep 1 0 1 0 0 0 0
35 Puducherry 4 4 0 0 0 0 0
Total 657 542 74 38 3 0 0
Percentage 82.50 11.26 5.78 0.46 0.00 0.00
19
Annexure -VI
STATEMENT SHOWING STATEWISE POSITION OF DISTRICTS
According to Gr.II Disability - 2013-14
Sl.No State / UT Total No. of
Districts
Gr II disability rate per million population in number of districts ( March-2014 )
Gr.-II disability rate for the state < 1 1 to 2 > 2
1 2 3 4 5 6 7
1 Andhra Pradesh 23 1 3 19 4.78
2 Arunachal Pradesh 17 14 0 3 2.70
3 Assam 27 13 7 7 2.45
4 Bihar 38 7 2 29 4.62
5 Chhattisgarh 27 4 0 23 22.36
6 Goa 2 2 0 0 0.00
7 Gujarat 26 7 1 18 4.68
8 Haryana 21 14 3 4 1.38
9 Himachal Pradesh 12 7 0 5 2.95
10 Jharkhand 24 8 6 10 2.51
11 Jammu & Kashmir 22 20 2 0 0.22
12 Karnataka 30 12 7 11 2.02
13 Kerala 14 7 0 7 1.95
14 Madhya Pradesh 50 10 9 31 4.13
15 Maharashtra 34 0 3 31 6.92
16 Manipur 9 6 1 2 1.05
17 Meghalaya 7 5 1 1 1.57
18 Mizoram 9 9 0 0 0.00
19 Nagaland 11 10 0 1 13.65
20 Orissa 31 1 4 26 10.29
21 Punjab 20 15 1 4 1.15
22 Rajasthan 33 28 2 3 0.55
23 Sikkim 4 3 0 1 1.59
20
24 Tamil Nadu 32 9 12 11 2.18
25 Tripura 4 2 0 2 1.57
26 Uttar Pradesh 75 16 12 47 3.42
27 Uttarankhand 13 11 0 2 1.03
28 West Bengal 19 5 5 9 2.46
29 A & N Islands 3 2 0 1 5.20
30 Chandigarh 1 0 1 0 1.81
31 D & N Haveli 1 1 0 0 0.00
32 Daman & Diu 2 1 0 1 3.62
33 Delhi 11 3 2 6 8.46
34 Lakshadweep 1 1 0 0 0.00
35 Puducherry 4 4 0 0 0.75
Total 657 258 84 315 4.13
Percentage 39.27 12.79 47.95
21
Annexure - VII
Statement showing new cases Released from Treatment (RFT) as cured
Period - April '13 to March '14'
Sl.No. State/ UT Cases Deleted
Percentage of case released as cured * RFT Otherwise Total
1 2 3 4 5 6
1 Andhra Pradesh 7466 87 7553 98.85
2 Arunachal Pradesh 35 6 41 85.37
3 Assam 1114 100 1214 91.76
4 Bihar 20309 796 21105 96.23
5 Chhattisgarh 8137 335 8472 96.05
6 Goa 48 0 48 100.00
7 Gujarat 10293 127 10420 98.78
8 Haryana 588 12 600 98.00
9 Himachal Pradesh 130 22 152 85.53
10 Jharkhand 3624 216 3840 94.38
11 Jammu & Kashmir 194 0 194 100.00
12 Karnataka 3314 142 3456 95.89
13 Kerala 738 6 744 99.19
14 Madhya Pradesh 6132 212 6344 96.66
15 Maharashtra 17001 522 17523 97.02
16 Manipur 22 4 26 84.62
17 Meghalaya 23 4 27 85.19
18 Mizoram 6 0 6 100.00
19 Nagaland 85 2 87 97.70
20 Orissa 8256 206 8462 97.57
21 Punjab 709 22 731 96.99
22 Rajasthan 823 191 1014 81.16
23 Sikkim 13 2 15 86.67
24 Tamil Nadu 3412 335 3747 91.06
25 Tripura 44 15 59 74.58
26 Uttar Pradesh 20987 2015 23002 91.24
22
27 Uttarakhand 368 33 401 91.77
28 West Bengal 9241 1452 10693 86.42
29 A & N Islands 15 0 15 100.00
30 Chandigarh 71 0 71 100.00
31 D & N Haveli 292 2 294 99.32
32 Daman & Diu 3 0 3 100.00
33 Delhi 974 295 1269 76.75
34 Lakshadweep 0 0 0 0.00
35 Pondicherry 53 0 53 100.00
Total 124520 7161 131681 94.56
* Cured are patients that completed full MDT course in stipulated time.
23
Annexure - VIII
Statement showing other cases Released from Treatment (RFT) as cured
Period - April '13 to March '14'
Sl.No. State/ UT Cases Deleted Percentage of case released as
cured * RFT Otherwise Total
1 2 3 4 5 6
1 Andhra Pradesh 124 42 166 74.70
2 Arunachal Pradesh 0 0 0 0.00
3 Assam 88 120 208 42.31
4 Bihar 945 135 1080 87.50
5 Chhattisgarh 185 37 222 83.33
6 Goa 56 0 56 100.00
7 Gujarat 66 15 81 81.48
8 Haryana 55 12 67 82.09
9 Himachal Pradesh 8 6 14 57.14
10 Jharkhand 399 68 467 85.44
11 Jammu & Kashmir 1 0 1 100.00
12 Karnataka 305 117 422 72.27
13 Kerala 33 0 33 100.00
14 Madhya Pradesh 159 18 177 89.83
15 Maharashtra 979 78 1057 92.62
16 Manipur 8 0 8 100.00
17 Meghalaya 16 0 16 100.00
18 Mizoram 0 0 0 0.00
19 Nagaland 7 0 7 100.00
20 Orissa 698 8 706 98.87
21 Punjab 119 12 131 90.84
22 Rajasthan 72 56 128 56.25
23 Sikkim 0 0 0 0.00
24 Tamil Nadu 237 21 258 91.86
25 Tripura 4 0 4 100.00
24
26 Uttar Pradesh 1853 849 2702 68.58
27 Uttarakhand 130 101 231 56.28
28 West Bengal 1495 421 1916 78.03
29 A & N Islands 4 0 4 100.00
30 Chandigarh 139 39 178 78.09
31 D & N Haveli 44 11 55 80.00
32 Daman & Diu 0 0 0 0.00
33 Delhi 1391 497 1888 73.68
34 Lakshadweep 0 0 0 0.00
35 Pondicherry 0 0 0 0.00
Total 9620 2663 12283 78.32
25
Annexure - IX
STATEMENT SHOWING STATEWISE POSITION OF DPMR SERVICES
during the year 2013-2014
S. No. State / UT
Instts. Recognized for RCS RCS Performed Cases of
Reaction /Neuritis recorded
Relapse cases
cases developed
new disability after MDT
Cases provided with
Govt. NGO Govt. NGO Suspected
at PHC Confirmed
at DH Footwear Self
care kit
1 2 3 4 5 6 7 8 9 10 11 12
1 Andhra Pradesh 1 9 0 487 583 24 20 26 5368 4131
2 Arunachal Pradesh 0 0 0 0 0 0 2 0 0 0
3 Assam 1 1 0 16 114 0 1 6 509 19
4 Bihar 2 2 21 64 514 7 8 12 1957 921
5 Chhattisgarh 1 2 234 5 1708 22 41 27 771 278
6 Goa 1 0 0 0 18 0 0 0 130 59
7 Gujarat 3 0 136 0 813 0 0 0 13084 2264
8 Haryana 1 0 0 0 2 0 0 0 646 86
9 Himachal Pradesh 0 0 0 0 5 0 1 0 13 0
10 Jharkhand 2 3 10 47 525 0 0 2 2360 664
11 Jammu & Kashmir 0 0 0 0 0 0 0 0 0 0
12 Karnataka 5 4 34 106 274 4 4 1 4226 2233
13 Kerala 0 2 0 0 54 0 0 0 86 0
14 Madhya Pradesh 2 1 122 91 549 1 0 7 3825 1520
15 Maharashtra 9 8 39 456 1427 236 236 128 8820 2465
16 Manipur 1 0 0 0 7 2 2 0 87 61
17 Meghalaya 0 0 0 0 8 0 0 0 26 0
18 Mizoram 0 0 0 0 0 0 0 0 0 0
19 Nagaland 0 0 0 0 0 0 0 0 16 21
20 Orissa 10 5 248 0 2510 22 42 8 6443 5295
21 Punjab 0 0 0 0 11 0 0 0 1055 64
22 Rajasthan 1 0 2 0 65 7 13 1 1686 1003
23 Sikkim 1 0 1 0 5 0 0 0 24 11
26
24 Tamil Nadu 2 8 1 106 183 29 23 1 9481 8303
25 Tripura 0 0 0 0 0 1 1 0 24 0
26 Uttar Pradesh 3 2 33 235 1772 79 5 9 1702 1269
27 Uttarakhand 1 0 15 0 91 0 0 0 642 2670
28 West Bengal 9 2 18 90 1280 51 31 9 5529 10261
29 A & N Islands 0 0 0 0 4 0 0 0 68 0
30 Chandigarh 1 0 0 0 26 0 0 0 33 21
31 D & N Haveli 0 0 0 0 6 0 0 0 8 0
32 Daman & Diu 0 0 0 0 0 0 0 0 3 0
33 Delhi 2 2 5 83 343 0 0 0 551 643
34 Lakshadweep 0 0 0 0 0 0 0 0 0 0
35 Pondicherry 1 0 2 0 4 1 3 0 158 150
Total 60 51 921 1786 12901 486 433 237 69331 44412
Total of Govt.+NGO 111 2707
27
Annexure - X
National Leprosy Eradication Programme
Special Activity Plan (SAP)/ICDD - 2013-14
Report on Active Search
S. No.
Name of State/UT Period of Search activity
Population Leprosy cases detected
No. of disability No. of child cases
Blocks Covered
Enumerated Examined MB PB Total Gr. I
Gr. II
Total MB PB Total
1 Andhra Pradesh 2013-2014 596635 500907 35 55 90 4 3 7 0 4 4 98
2 Arunachal Pradesh 23 to 29.09.2013 97196 25717 0 0 0 0 0 0 0 0 0 2
3 Assam April'13 to March'14 1566033 1253357 44 17 61 9 2 11 4 0 4 51
4 Bihar 0 0 0 0 0 0 0 0 0 0 0 0
5 Chhattisgarh 0 0 0 0 0 0 0 0 0 0 0 0
6 Goa 1 to 15.02.2014 446896 68333 0 0 0 0 0 0 0 0 0 11
7 Gujarat 10 to 20.06.2013 13138453 10092433 1077 2395 3472 110 93 203 53 275 328 71
8 Haryana 0 0 0 0 0 0 0 0 0 0 0 0
9 Himachal Pradesh 2013-2014 545723 537969 0 4 4 0 0 0 0 0 0 30
10 Jharkhand 06.01.2013 to 21.12.2013 355104 203097 6 8 14 0 0 0 0 0 0 3
11 Jammu & Kashmir 15.3.2014 to 30.3.2014 267295 203130 2 0 2 0 1 1 0 0 0 2
12 Karnataka 2013-2014 7172804 5321019 191 286 477 21 12 33 14 42 56 89
13 Kerala 17.10.2013 to 13.01.2014 6423772 5218105 114 40 154 6 22 28 7 11 18 81
14 Madhya Pradesh 2013-14 10006872 6792873 152 133 285 42 12 54 1 8 9 74
15 Maharashtra 3.10.2013 to 14.10.2013 4672686 3891841 56 73 129 3 4 7 1 15 16 20
16 Manipur 0 0 0 0 0 0 0 0 0 0 0 0
17 Meghalaya 2013-14 179045 76731 0 0 0 0 0 0 0 0 0 0
18 Mizoram Sept. to Dec.2013 374774 224400 4 12 16 0 0 0 0 0 0 3
19 Nagaland 0 0 0 0 0 0 0 0 0 0 0 0
20 Odisha Nov.'13 to Jan.'14 11466361 10132653 1090 1602 2692 118 135 253 55 184 239 102
21 Punjab 2013-14 4019340 326716 38 14 52 28 3 31 0 1 1 42
22 Rajasthan 2013=14 1119729 347242 2 0 2 0 0 0 0 0 0 47
23 Sikkim 9.12.2013 to 24.01.2014 42667 37975 0 1 1 0 0 0 0 0 0 3
28
24 Tamil Nadu April'13 to March'14 2550006 1798759 83 146 229 2 9 11 2 14 16 90
25 Tripura 2013-2014 0 0 0 0 0 0 0 0 0 0 0 0
26 Uttar Pradesh 2013-14 4343960 3251523 49 93 142 5 5 10 2 3 5 21
27 Uttarakhand 21to27.10.2013 185103 120055 8 14 22 0 1 1 1 2 3 1
28 West Bengal 2013-14 5161029 3986657 249 200 449 47 9 56 8 19 27 27
29 A & N Islands 7 days 37463 32093 1 10 11 0 0 0 0 0 0 1
30 Chandigarh May''13toMarch14 80478 58225 2 5 7 0 0 0 0 0 0 4
31 D & N Haveli 13-22.01.2014 328662 257676 24 50 74 0 0 0 1 17 18 7
32 Daman & Diu April'13 to March'14 31022 28517 0 0 0 0 0 0 0 0 0 2
33 Delhi 0 0 0 0 0 0 0 0 0 0 0 0
34 Lakshadweep Nov-13 30999 29469 3 10 13 0 0 0 2 1 3 4
35 Puducherry 0 0 0 0 0 0 0 0 0 0 0 0
Total 75240107 54817472 3230 5168 8398 395 311 706 151 596 747 886