Central Ground Water Board Ministry of Water Resources...
46
कीय भ ू मि जल बोड जल संसाधन, नदी विकास और गंगा संरण मंालय भारत सरकार Central Ground Water Board Ministry of Water Resources, River Development and Ganga Rejuvenation Government of India AQUIFER MAPPING REPORT Phanda Block, Bhopal District, Madhya Pradesh उरी मय े, भोपाल North Central Region, Bhopal Draft Report
-
Upload
truongdieu -
Category
Documents
-
view
215 -
download
0
Transcript of Central Ground Water Board Ministry of Water Resources...

कें द्रीय भूमि जल बोर्ड जल संसाधन, नदी विकास और गंगा संरक्षण मंत्रालय
भारत सरकार
Central Ground Water Board Ministry of Water Resources, River Development and Ganga
Rejuvenation Government of India
AQUIFER MAPPING REPORT
Phanda Block, Bhopal District, Madhya Pradesh
उत्तरी मध्य क्षेत्र, भोपाल
North Central Region, Bhopal
Draft Report

1 | P a g e
Aquifer mapping & Management plan of Phanda block
Aquifer mapping & Management plan for Phanda block ,Bhopal District, MadhyaPradesh
Prepared & complied by
Devendra joshi scientist ‘D” Central Ground water Board, North Central Region, Bhopal
20 February 2016 Joshi.devendra @hotmail.com

2 | P a g e
Aquifer mapping & Management plan of Phanda block
Aquifer mapping & Management plan of Phanda block, Bhopal District, Madhya Pradesh
CONTENT PAGE NO 1. Introduction
1.1 Objectives, Scope of the Study, Approach and Methodology, Area Details,
1.2 Data availability, Data adequacy and data gap analysis and Data generation,
1.3 Rainfall-spatial, temporal and secular distribution, 1.4 Physiographic setup, Physiography/DEM, 1.5 Geomorphology, 1.6 Land use, 1.7 Soil, 1.8 Hydrology and Drainage, 1.9 agriculture, irrigation, cropping patterns, 1.10 prevailing water conservation/recharge practices and
any other relevant Information
2.0 Data collection and generation 2.1. Geology
2.2 Hydro geomorphology 2.3 Hydrogeological data 2.4 Hydrochemical (water quality) 2.5 Geophysical (Location, number, analytical techniques etc.), 2.6 Exploratory drilling-State, CGWB and private wells
3.0 Data Interpretation, Integration and Aquifer Mapping 3.1 Results and interpretation of all studies and preparation of aquifer maps- 2 D and
3D diagrams.
4.0 Ground Water Resources 4.1 Recharge, Draft and Stage of groundwater development of replenishable resource. 4.2 Static resource and extraction from unconfined aquifer as well as in/from deeper
aquifers, if any.
5.0 Ground Water Related Issues 5.1 Identification of issues, 5.2 Geographical distribution and quantification with respect to ground water
resources 5.3 Ground water quality/contamination; 5.4 Future demand (for 2025 and 2030) scenario and stress aspects of the aquifer. 5.5 Participatory ground water management issues.
3 | P a g e
Aquifer mapping & Management plan of Phanda block
6.0 Management Strategies
6.1 Plan for sustainable management of the resource- aquifer wise including modeling
outputs. 6.2 Aquifer wise availability of unsaturated zone. 6.3 Augmentation plan of the resource through artificial recharge and water
conservation. 6.4 Demand side management, through irrigation efficiency, ground water use
efficiency etc. 6.5 Stress aspect against future demand (2025,2030) and strategies for addressing
those.

4 | P a g e
Aquifer mapping & Management plan of Phanda block
Aquifer mapping & Management plan of Phanda block, Bhopal District, Madhya Pradesh
1. Introduction
1.1 Objectives, Scope of the Study, Approach and Methodology, Area Details,
1.1.1 Objectives
• Define aquifer geometry at 1: 50,000 scale, type of aquifers, ground water regime behavior, hydraulic characteristics, and geochemistry of aquifer systems.
• Develop a dynamic system for sustainable management of ground water resources for an aquifer as a unit.
1.1.2 Scope of the Study Under NAQUIM, Phanda block have been studied during the AAP2012-2013 Data collection, compilation, bringing entire data to GIS platform, data gap analysis and
data creation To establish the aquifer geometry & characteristics Aquifer Management Plan.
1.1.3 Approach and Methodology
• Entire Phanda block has been covered under Basaltic lava flows areas.
• Area divided grid wise and aquifer wise basic requirement for establishing aquifer
geometry and characteristics upto 200 m where data generation is required, quality
parameters specific to the area
• Preparation of Base Map A physical map on A2 size, Geology and Geomorphology
• Compilation of existing data for mapping : Exploratory Data Availability, Geophysical
Information
• Pre processing of data Exploratory Data , Ground Water Level, Ground Water Quality
• METHODOLOGY FOR ARRIVING AT DATA GAP
Exploratory Data : Desirable spatial scale -5’ x 5’ grids ,200 m depth. 5 EW’s and 5 OW’s should
be constructed at suitable locations, preferably one in central quadrant and one each in the four
corner quadrants for establishing aquifer geometry and determining aquifer parameters.Aquifer
performance test shall be conducted at all the five EW’s tapping the fracture aquifer to estimate the
aquifer hydraulic parameters and water quality .Existing exploratory Data and Data gap analysis

5 | P a g e
Aquifer mapping & Management plan of Phanda block
Geophysical Data : 2 or 3 Profiling/VES/TEM having 200 meter interpretation depth should be carried
out in each of the nine quadrants of the toposheet totaling 18 to 27 nos. in each sheet to decipher aquifer
geometry) .Existing Geophysical Data and Data gap analysis
Ground Water Monitoring Data : Data Required : 5’ x 5’ grids. For 1st aquifer (un-
confined/Phreatic) two open/dug wells are recommended for each quadrant of a toposheet.For
2nd and 3rd aquifer the well-constructed in the Well field and Special Purpose wells may be used
as piezometers for GW monitoring.Minimum four times monitoring annually
Ground Water Quality Data : 5’ x 5’ grids. For 1st aquifer (un-confined/Phreatic) one sample from open/dug wells are recommended for each quadrant of a toposheet For 2nd aquifer the sample is to be collected from well-constructed in the Well field explained
above and Special Purpose wells for GW Quality monitoring .Minimum two times monitoring
initially is recommended.
Data Generation: Value addition of Geological map.Preparation of subsurface geology of the area
,Value addition of Geomorphological map ,Analysis of Land use pattern, Conduct additional required
VES/TEM ,Analysis of Water bodies of the area ,Impact of Water bodies on surrounding Ground Water
Regime, Surfacewater –Groundwater interaction studies, Water level monitoring of key wells wells - 4
Times in a year for 3 Consecutive 3ear ,Exploratory drilling –Construyction of EW,OW,PZ,SH. ,Pump
test of EW TO Determination of Aquifer Parameters,Peizometer construction for AWLR
DATA GENERATION:CHEMICAL: Collection of required water samples QUALITY ASSESSMENT
AQUIFER MAP PREPARATION : 1:50,000 SCALE MAP SHOWING DIFFERENT LAYERS
Aquifer Wise Management Plan Aquifer wise ground water management through integration of various data / information in the form of thematic layers
Feasible areas for ground water development along with yield potential / Depth of
drilling / safe yields etc. Feasible areas for rainwater harvesting and ground water recharge vis a vis aquifer
storage available for recharge and surplus non committed surface water available for recharge.
Aquifer wise vulnerability map in terms of ground water availability (potential areas / ground water stress areas), water logged areas and quality problem areas.
Demarcation of Ground Water Regulatory Zones (GRZ). Demarcation of Ground Water Sanctuaries to be reserved for drought proofing. Ultimate goal is to construct a ground water flow simulation models at appropriate scale
to arrive at technically and economically feasible aquifer management options.

6 | P a g e
Aquifer mapping & Management plan of Phanda block
1.1.4 Area Details:
The total geographical area of Phanda block is 1348.37 sq km2, and hilly& forest area in it is about 64.37 km. The mappable area or recharge worthy area is 1284 sq km (95%).There are 284 villages in the block . The Population (2001) in the Phanda block is :221423
The area falls between North latitude 230 04’18” and 230 25’46” and East longitude 770 10’07” and 770 37’32 in the survey of India toposheet (part) 55E/3.E/4.E/7,E/8,E/11& E/12. Location of Phanda block is given in Fig:1 Elevation in the area various from625 m to 370 m amsl.The annual normal rainfall in the area is 1126.7 mm/yr
Bhopal urban area is about 296 Sq km (22%) in the Phanda block.
Fig:1 Location of Phanda block

7 | P a g e
Aquifer mapping & Management plan of Phanda block
1.2 Data availability, Data adequacy and Data gap analysis and Data generation,
1.2.1 Data availability There are 09 exploratory wells are constructed in the area of mapping ,out of which 06 exploratory wells are in the urban area & 10 exploratory wells are in the Kolana watershed-the feeder region of source of drinkingwater.
Table1.3. :Wells constructed by CGWB in Phand block
Fig 1.3 :Exploratory wells location in the Phanda block
Exploratory well Observation Ratibar Nabibagh Naval Selection centre –I Naval Selection centre-II
Barktullah University Sarwar Sarwar (OW-I)
Sarwar (OW-II) Phanda Bilkisganj Gandhi Nagar CGWB campus I,II,III(EW), IV
G.S.I. E-5 Sector
year EW OW DW PZ
1983-85 03 - - - 1987-88 05 02 - - 2000-02 01 03 10 02
Total 09 05 10 02
Deposit well in Urban Bhopal area
1 .Janta Colony 2. Ashoka Society E-7 Sector 3. Baghira Apartment E-7 4. Shyam Nagar 5. Char Imli 6. M.A.C.T. 7. Shyamla Hills (Regional college) 8. Manaw Sanghralaya shyamla Hill 9. Gautam Nagar 10. Shivaji Nagar

8 | P a g e
Aquifer mapping & Management plan of Phanda block
1.2.2 Data adequacy and Data gap analysis
Data gap analysis & status as on 1st April 2012 based on EFC Norms Targets as per EFC norms and actual achievements are given below:
Block Phanda As per EFC
norms Actual
achievements
Area in sq.km 1348 Preparation of Sub-surface Geology (area in
1348 Existing data
Geo-morphological analysis (area in sq.km) 1348 GSI layer Land use pattern (area in sq.km) 1348 Layer yet to
Vertical electrical Sounding (VES) (Nos) 41 25 41 Bore Hole Logging (Nos) 5
Need based
Need based
2-D Imaging (Line Km) Ground TEM (Nos) Heliborne TEM & Gravity (Line km)
Preparation of Drainage Map (area in Sq.km) 1348 completed Demarcation of water bodies (area in sq.km) 1348 completed Soil infiltration studies (Nos.) 42 33 0 Rainfall data analysis for estimation of recharge to ground water (area in sq.km)
1348 Monthly data yet to receive
Canal flow, impact of recharge structures
1348 Existing data Water level monitoring (No of stations*
frequency) (No of monitoring stations) 38*4*3 456
Exploratory Wells 10 10 Observation Wells 08 2 Slug test (Nos) 0 0 0 Specific Yield test (Nos) 0 0 0 Micro-level hydro-geological data Acquisition including Quality Monitoring
102 37
Water Quality (sampling and Analysis) for Basic Constituent, Heavy Metals etc Analysis of Ground water for Pesticides, Bacteriological contamination in Ground water
0 0 0
Carbon dating (Nos) 0 0 0 Isotopic studies (Nos) 0 0 0 Core drilling (Nos) 0 Need based

9 | P a g e
Aquifer mapping & Management plan of Phanda block
1.2.3 Data generation
09 exploratory wells in the Kolans watershed are constructed in the year 2012-13 to depth range of 200m or above. There are 09 quardent in the of Phanda block,which doesn’t have any exploration wells.
1.3 Rainfall-spatial, temporal and secular distribution
Climate & Rainfall
Bhopal has a humid subtropical climate, with mild, dry winters, a hot summer and a humid monsoon season. Summers start in late April and go on till mid-June, the average temperature being around 30 °C (86 °F), with the peak of summer in May, when the highs regularly exceed 40 °C (104 °F). The monsoon starts in late June and ends in late September. These months see about 40 inches (1020 mm) of precipitation, frequent thunderstorms and flooding. IMD normal annual rainfall of Bhopal city is 1260.2 mm.
The average temperature is around 25 °C (77 °F) and the humidity is quite high. Temperatures rise again up to late October when winter starts, which lasts up to early March. Winters in Bhopal are mild, sunny and dry, with average temperatures around 18 °C (64 °F) and little or no rain. The winter peaks in January when temperatures may drop close to freezing on some nights. Daily mean normal temperature of Bhopal in May - 40.70 C and minimum - 26.40 C.On 6 January 2011 Temperature was 2 °C the lowest temperature more than Shimla.
year EW OW 2012-13 09 09
Exploration in Kolans watershed Exploratory well Observation
well Bakaniya 01 Barjheri 01 Barkheri 01 02 Barkhera Nathu 01 Kolans Kala 02 02 Kaliukheri 01 01 Nandni 01 03 Ulijhwan 01 01

10 | P a g e
Aquifer mapping & Management plan of Phanda block
1.4 Physiographic setup, Physiography/DEM,
Topography of the Phanda block is highly rugged and undulating comprising hills, dissected plateaux, valley and flats. The maximum elevation of about 605.09 m amsl is observed in the area at village Mugalichhap (77.359:23.09)and lowest elevation is 410.25 m asl in the reserve forest in North east of Phanda block
1.5 Geomorphology,
The gemophohgical condition in the area are such that the area becomes steep to moderately slopping to nearly flat in the middle reaches of the river.The distribution and structure of valleys landforms reflect the geomorphic processes that created them. Landform, any conspicuous topographic feature - mountains (including volcanic cones), plateaus,
The Betwa river sub basin in phanda block are consist of geomorphic surface including the denudation hill, highly dissected Plateau. Pediment , vally fill and pedplain (Fig 1.5)

11 | P a g e
Aquifer mapping & Management plan of Phanda block
Fig 1.5 : Geomorphology of Phanda block The
study of Landsat imagery
interpretation revealed that the different geological formation have developed distinct land form which helped in identifying the different geological units. The major landform in the area are classified into 5 units:
Table 1.5: Geomorphic landform of phanda block
Geomorphic landform Area covered(sq.km) / % Pediments 823 61.05
Valley fill 21 1.55
Vindhyan upland 278 20.62
pediplain 44 3.26
penpalain 182 15

12 | P a g e
Aquifer mapping & Management plan of Phanda block
Large areas within the Phanda block are pediment surfaces (61%). A pediment is a gently sloping erosion surface or plain of low relief formed by running water in semiarid region at the base of a receding mountain front. A pediment is underlain by bedrock that is typically covered by a thin, discontinuous veneer of soil and alluvium derived from upland areas. Much of this alluvial material is in transit across the surface, moving during episodic storm events or blown by wind Peneplain, gently undulating, broad, relatively flat rock face, an extensive area of low relief formed by the joining of several pediments almost featureless plain that it may be final stage of geomorphic cycle of landform evolution., dominated by convex-up (‘bulging’) hill slopes mantled by a continuous regolith, and by wide, shallow river valleys.
1.6 Land use Cultivated area is about 592.65 km2 which is 43.95 % of total block area.
Fig 2: Land use pattern & crop area
Cultivated area
Non cultivable land
Fallow land
Km2 592.65 2.90 77.65

13 | P a g e
Aquifer mapping & Management plan of Phanda block
1.7 Soil : Black cotton soil, mixed soil, and Red Loamy soil
14 | P a g e
Aquifer mapping & Management plan of Phanda block
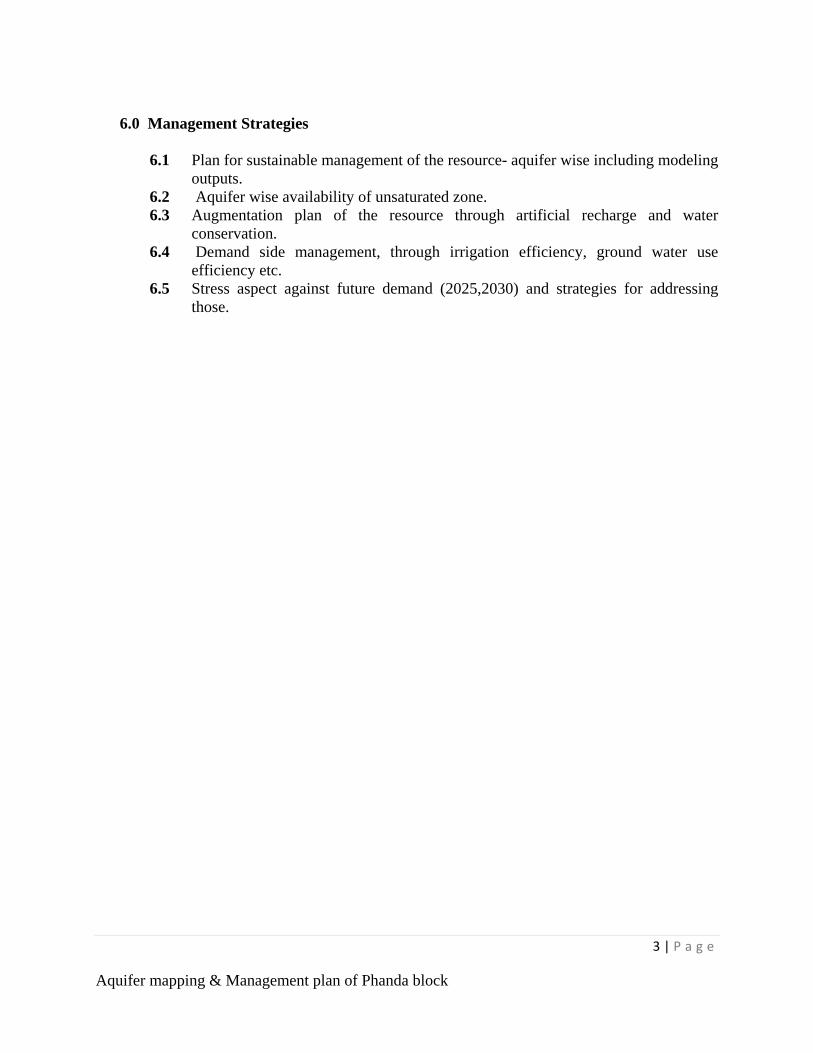
1.8 Hydrology and Drainage
Drainage: : The area forms part of Betwa sub basin of Yamuna river basin and is drained by Halai, Kalans, Kaliasot and Kerwa rivers The major Streams are flowing in south eastern and central direction The major and minor streams shows dendritic and sub parallel drainage pattern. In the valley fill area the branching of the stream is not visible. The Stream gradient is steep to moderate in the source region and it is moderate to gentle in the middle & lower reaches
1.9 Agriculture & cropping patterns The total crop area is 1027.92 Sq km while double crop area is 435.27 sq km
Area of Kharif crop 525.07 Sq km
Area of Rabi 576.12 Sqkm
Cultivated area(Ha) 107043 Double crop ara(Ha) 48043 Total crop area(Ha) 107043

15 | P a g e
Aquifer mapping & Management plan of Phanda block
The main crops in kharif season are Soyabean ,Alsi,Groundnut while in the Rabi crops are Wheat,jowar,Maize etc
Table 1.9: cropping pattern
Rabi crop(ha) Kodukut 10 Joa 12 Dhan 615 Wheat 42312 Jowar 272 Maize 1115 Bajara 10 44346
1.10 Irrigation 1.10.1 Irrigated areas & structures
Groundwater irrigation is about 356.88 sq km which is 79.63% of total irrigated area i.e 448.15 sq km.
Table1.10.1: Irrigated area Groundwater structures in the area : There are 24433 (dug wells & tube wells).
Table1.10.2: Number of Irrigation structure‘s
1.10.2 Medium & Minor irrigation project
There are 02 medium & 11 minor irrigation structures that irrigated an area of 59.53 sq km
Oil seed(Ha) Alsi 176 Groundnut 212 Tile 123 Rai 146 soyabean 47619 sunflower 5 others 2 Total 48283
Pulses(Ha) Matare 426
Gram 18012 Ahare 963 Lenticle 710 Dalhan 122 Urd 117 others 38 Total 20388
Irrigated area (sq km)
Surface water
Canal 65.12 Ponds 20.15
Groundwater Tube wells 308.80 Dug wells 48.08
others 6.00 Total 448.15
Irrigation structure (Number)
Dugwells 3218 Tube wells 21215
Ponds 112

16 | P a g e
Aquifer mapping & Management plan of Phanda block
Table 1.10.2: Irrigation project in Phanda block
Fig 1.2.2 Irrigation project in Phanda
1.11prevailing water conservation/recharge practices and any other relevant Information Water conservation structures These structures are constructed in 48 villages and irrigate an area of 4.80 sq km
Structure’s Stop dam Pond Number 82 33 storage (cum) 347654 96176 Area irrigated (sq km) 4.80
Villages 47
Irrigation project Medium Minor Cachment area (Sqkm) 445.88 1369.493 CCA (sqkm) 99.38 1307.1.3 Live capacity ( mcm) 57.01 162.91 Area irrigated(sqkm) 2012-13
47.95 11.58

17 | P a g e
Aquifer mapping & Management plan of Phanda block
2.0 Data collection and generation
2.1 Data collection 2.1.1 Geology
Geological succession in the area of Phanda is given in the table-3
Table 2.1: Geological succession
Succession Formation Age Area covered Km2
Alluvium/ Laterite
Clay with kanker, sand and river alluvium
Recent to Pleistocene
214.6 / 7.2
Deccan trap Basaltic lava flows with redbole and interappean beds
Upper cretaceous to Eocene
819.70
----------------------------------------------Unconformity------------------------------
Upper Vindhyan Bhander Group
Sandstone and Shale sequence with conglomerate
Upper pre Cambrian to Lower protoeozoic
306.45
Fig 2.1 Geology of Phanda block The vindhyan formation occupy the south west & North east of the study area and forms 306.45 sq km (22.72%).This formation acts as the basement over which extensively occupying Deccan Basaltic lava flows were deposited. This forms dissected plateau and hills on the western and central parts of area, which covers about 819.70sq km (60.80%). Alluvium formation occupy in the parts of south eastern area and as villary fill along Halali nadi in the north eastern area. Laterite occurs as isolated capping over the Deccan trap in the extreme north western part of area. The general level of occurrence of the laterite

18 | P a g e
Aquifer mapping & Management plan of Phanda block
capping is 500m amsl. It is reddish brown , limonite soft rock.
2.1.2 GSI work: Geo-resource of Phanda block
Deccan trap basalt flows occupy vast area in the north, central and western parts of Phanda block. They have been classified into two formations viz: Kankariya and Indore based on diagnostic characters and marker horizons or intertreappen beds.
Table 3.2 : Malwa group of Deccan trap formation in Phanda block
Malwa trap No. of flows Nature & Characteristics
Indore formation 03 Black, fine to medium grained, moderately porphritic, hard rock
Kankariya formation 03 Black ,light greenish, fine to medium grained, moderately porphritic, hard rock
Vindhyan formation Upper Bhander sandstone Pink,maroon pink ,chocolate brown, fine to coarse grained, hard rock
Sirbu shale Yellow greenish and chocolate brown thinly laminated ,fine grained
Lower Bhander sandstone Pink, Pink brown, dark red, , fine to coarse grained, hard rock, thickly bedded
2.1.3 The Upper Betwa river project work (1981) 2.1.3 Basaltic flow unit ; Each individual lava flow can be sub divided into 3 distinct units- (i) Red bole (impersistent horizon)/clay.
(II) Vesicular/Amygdular basalt
(III) Massive and compact basalt
Red bole clay : The top of the individual flows is occasional marked by reddish brown clay material, termed as “Red bole” which at places is represented by grayish clay .The thickness of red bole varies from few centimeter to few meters. The red bole in its genetic relationship is an insitu product of backing and weathering of basalts representing a time gap between the two Successive flows. They indicate the local topographic highs during the time gap of successive flows Vesicular/ Amygdulear basalt: The vesicular unit of each flows forms the upper horizon and ranges in thickness from 1.5 meters to as much as 06 m forming 25 to 30% of the total thickness of flows. It is medium to coarse grained, softer than massive basalt and vesicles are commonly filled with secondary mineral like calcite, Zeolites and quartz.

19 | P a g e
Aquifer mapping & Management plan of Phanda block
Massive Basalt: It is fine to medium grained compact, dark greenish to grey colour and form 60 to 70% of the flow unit. It weathers along joints and spheroidal weathering is commonly seen. Columnar jointing is quite common
2.1.4 Bhander group of upper Vindhyan formation The Bhander group of Vindhyan outcrop form part of southern basin boundary around Bhopal occurs as monoliths’ forming mesas and isolated hillocks protruding from an otherwise flat country.This group has been further sub divided into different units & its description is given below :
(i) Upper Bhander Sandstone (ii) Sirbu Shale (iii) Lower Bhander Sandstone (iv) Ganurgarh Shale
Upper Bhander Sandstone: It is fine to medium grained, compact, well sorted and indurated .They are light brown to reddish brown colour and highly jointed. The upper Bhanders in the south-west of Bhopal shows N_S strike with gentle dips towards east and stike becomes NNW-0SSEcand finally becomes east-West. The dip rages from 20 to 50 and rarely exceeds 50 . The semi-circular outcrop with convex side facing south of vindhyan exposures are seen in the south & north east of Bhopal. Sirbu shale : They are fine grained, argillaceous, chocolate brown thinly laminted and splintery in nature. They have been eroded easily and formed valleys which are covered with soil .It is a inconsistent unit forming valley plain as seen near chicklod kalan. Lower Bhander Sandstone: They are hard and compact. Their colour varies from flesh red to Pin and orthoquartzitic in nature, they are also jointed but the joints are less prominent as compared to upper bhander Sandstone. They occupy the southern portion of semi-circular outcrop outcrop of upper vidhyan in the south. Outcrops have been mapped to the west and north of Bhopal, Salamatpur , Dohad tank. They form prominent scraps with dip slops from 050 to 150 Ganurgarh Shale : They are yellowish to brownish with interaltion of siltstone.They are encountered in deep bore well in the area
2.1.5 Joints in Deccan trap & Vindhyan formation Joints in Deccan trap : Basaltic lava flows do not show any effect of tectonic disturbance and are sub-horizontal in disposition as revealed by subsurface correlation. The major joints as deciphered are
(i) NE – SW (N 400 -600E,- S 400 – 600 W) (ii) NW – SE (N 300 -500E,- S 300 – 500 E)
Join in upper Vindhyans :The Bhander group of vindhyans formation occupy two broad locals in the Phanda block, one in the north east and other in the south west with few isolated outcrop in the central portion which show good development of joints- Upper Bhander Sandstone: They show following sets of joints;
(i) N 350 E – S 350 W (ii) NE – SW

20 | P a g e
Aquifer mapping & Management plan of Phanda block
(iii)N 800 E – S 800 W (iv) N 700 W –S 700 E The two major joints (i) and (iv) are closely spaced and give rise to perfect rectangular blocks. The joints are vertical to steeply dipping. Lower Bhander Sandstone: The joints are not as well developed as compared to that of upper Bhander sandstone. They show following sets of joints;
(i) N 100 E – S 100 W (ii) N 400 E – S 400 W (prominent in the outcrops south of Bhopal
N 500 W –S 500 E
2.1.6 Sub surface geology and correlation of Basaltic Lava flows:
In order to study the subsurface geology and to correlate the basaltic lava flows a number of cross have been prepared using the drilling data of exploration data of exploratory bore holes
In order to define the individual lava flows the geophysical logs viz. resistivity and natural gamma logs provided a rapid means of flow demarcation and correlation. The resistivity logs helped in differentiating the individual lava flows, whereas the natural gamma logs recording a distinct change in gamma logs repose in certain flows served as tool in correlation of lava flows. The signatures recorded on gamma logs against different flows taking into account the change in borehole diameter, casing details etc., have been grouped into two distinct categories: (i) Flows with low gamma repose and (ii) Flows with high gamma repose
In the area, a total of 16 flows have been delineated between the elevation ranges of 625.70 and 430.30 m amsl. The thickness of lava flows ranges from 14.70 to 35.20 m and the average thickness is about 18.0-20.m.Exceptional thickness of flows ranging from 41 to 61m have been met with in the Phanda & Ratibar section. The flows have a gentle slop from south west to north east. The lateral and vertical variations in flows characteristic are quite common in the area.
2.1.7 Lineaments The lineaments gives linear expression on the Landsat imagery as well as on aerial photograph as
I. Linear topographic features , trenches or ridges, river alignments etc II. Linear vegetation and soil/land use pattern

21 | P a g e
Aquifer mapping & Management plan of Phanda block
Fig 2.1.7 Landsat imagery
These are linear to curvilinear features on the surface of earth, of tectonic significance -mainly fractures and /or faults and sometimes master joints.
There are 217 lineaments in the study area. NW and NE are predominant direction of lineaments

22 | P a g e
Aquifer mapping & Management plan of Phanda block
Fig 2.1.7: lineaments in the Phanda block
2.1.7 The major Lineament within the area of Phanda block is discussed below: Bhojpur -Bhopal Lineaments : It runs for distance of 42 km in the NW – SE .The vindhyan formation and Ajnar syncline .Thus the lineament may be the manifestation of a subsurface fault. Mapping of lineaments closely related to groundwater occurrence and yield is essential to groundwater surveys, development and management
Studies revealed a close relationship between lineaments and groundwater flow and yield. Generally lineaments are underlain by zones of localized weathering and increased permeability and porosity

23 | P a g e
Aquifer mapping & Management plan of Phanda block
2.2 Hydro geomorphology Hydrogeomorphological mapping (fig2.2_) is one of the best-suited approaches to explore the possibility of groundwater resources especially in those areas where availability of surface water in insufficient .Study hydro geomorphological features and their prospects for groundwater in Phanda block
Fig 2.2 : Hydrogeomorphology map of Phanda

24 | P a g e
Aquifer mapping & Management plan of Phanda block
Table 2.2 : Classification of Hydrogeomorphic surface of Phanda block
Geomorphic Surface
Geomorphic unit
Area (Sq. km)
No. Bore well Examined
No. of Linea- ments
Yield range lps
yield of well at Lineaments
Plateau dissected PLU-1 96.5 04 13 0.6-3.5 3.5
PLU-2 237.4 06 11 1.1-4.8 4.8
PLU-3 11.24 07 01 1.5-2.84
2.84
PLU-4 87.66 04 03 - - Plateau moderately dissected
PLM-2 47.1 02 - -
PLM-622 132 03 25 0.6-1.0 1.0 Plateau Weatherly dissected
PLW-3 69.1 02 01 0 -
PLW-4 41.0 06 34 - Plateau slightly dissected
PLS-1 35.2 39 04 dry -
PLS-2 241.7 53 0.4-4.8 -
PLS-3 35.22 03 04 0.6-1.8 1.8 Pedplain shallow weathered
PPS-51 54.64 28 05 0.9-4 75
4.75 Valley fill VFS 44.7 04 17 1.5 -
Water body - 215.0 Plateaus dissected (PLU-1,PLU-2.PLU-3,PLU-4): These are highly fractured and weathered surface and occurring in southern southwestern of area. It covers an area of 432.65 sq km (32%).. The land of these unit is severely dissected the stream of Kaliasot and Kerwa river giving rise to a stream consist of flat topped ridges & steep scrap. They ranges in elevation from___to___m amsl. There are 50 lineaments in the area of Plateaus dissected . 19 –bore well data have been examined In general Ground water yield of the geomorphic surface is poor to moderate in dissected plateau from 36 to 288 lpm, The yield of bore wells in range of 140 to 288 lpm are located at lineaments Plateaus moderately dissected (PLM-2,PLM-622) : It covers an area of 179.10 sq km (13.28%) These are highly weathered surface & fractured and occurring in North east of area of Halai, , Ghorapachar river. There are 27 lineaments in the area of Plateaus moderately dissected. The yields of wells are in the 36 to 60 lpm Plateau Weatherly dissected (PLW-3,PLW-4): It covers an area of 110.10 sqkm and occurs as isolated area along extreme north west and north in the Halai catchment. 06 –bore well data have been examined There are 35 lineaments in the area and found that no yield in the bore wells .

25 | P a g e
Aquifer mapping & Management plan of Phanda block
Plateau slightly dissected (PLS-1,PLS-2,PLS-3,) it occurs in the northern part of Plateaus dissected and covers an area of 312.12 sq km .42 –bore wells have been examined. There are 81 lineaments in area. The yield of bore wells are in the 36 to 288 lpm.The yield of well is found at lineaments about 108 lpm
Pediment (PD-51) : There is the gently sloping and undulating rock surface with or without a veneer of weathered material. Pediment is noted as a narrow strip adjoining the highly dissected plateau PLU-2 and at foot hill zone. They range in elevation from_ to m amsl. Groundwater potential in pediment is mordant except along fracture where limited quantity of groundwater can be obtained for domestic purpose for 4.10 to 12.02 mbgl. The yield ranged from 60 to 138lpm. Pediplain (PPS-51) : There surface are formed by the wreathing of the dissected plateaus and covers an area of 54.64 sq km.. They are characterized by highly porosity permeability and infiltration rate and hence the moderate to good potential of groundwater. They are found in the central portion in the down srtream of Upper lake . They rage in elevation from m amsl. Ground water ate yield of the geomorphic surface varies from 60 to 285 lpm in bore wells Valley fill (VFS) : Valley fill deposit is about 44.7 sq km and found in the northern and northeastern part of the area along Halai river has good potential of agriculture. They ranges in elevation from to in a amsl . The morph metric attributer of the valley fill are such that the gradient in mordantly steep (50 to 80), valley fill deposit consist mainly of weathered product of surrounding basaltic books, mostly comprising moderately thick gravel Pebbles, sand & silt The Ground water potential ranges from moderate to good. The water level fluctuation are raging from 4.10 to 6.02 m. They yield ranges from 308 to 363 lpm. They valley are developed along the fractured and such place can be exploited for groundwater through deep bore wells.
Table2.2.2 Relationship of Geomorphic surface with Ground water potential
Origin Geomorphic Unit Description Groundwater
potential Structural
Highly dissected plateaus
Moderate to steeply sloping basaltic plateau margin with high drainage density negligible soil cover
Poor
Structural
Highly dissected plateaus
Moderate sloping basaltic plateau margin with high drainage density and weathered moderately soil cover
Poor
Structural
Plateaus top
Isolate3d basaltic plateaus with steep side slop with moderate soil cover
Poor
Structural
Moderately dissected plateaus
Basaltic plateaus moderately dissected with high drainage density with soil cover
Poor
Structural
Moderately dissected plateaus
Basaltic plateaus moderately dissected with high drainage density with thick soil cover
moderate

26 | P a g e
Aquifer mapping & Management plan of Phanda block
Data generation
2.2.1 Hydrogeological (water level, pumping tests, etc.), Monitoring of key wells: There are 94 Groundwater structures have been monitored in 76 villages(table 2.2.1) in the period 2012-13.Based on the water level data the pre and post moon water with water level fluctuation map have been prepared and given below Table2.2.1 : Numbers of Groundwater monitoring structures in the investigation area
Investigation area Numbers Villages/location HP I/W BW DW DCB BW(D) Total
Kolans WS 23 16 09 04 01 07 37 Bamori WS 07 06 01 02 - 01 10 Patera 19 12 01 06 01 - 20 Halali nadi WS 05 02 03 - - 05 Urban Bhopal 22 - 22 - - 22 Total 76 36 11 37 02 08 94

27 | P a g e
Aquifer mapping & Management plan of Phanda block
Hydro geological flow : There area 15 have been demarcated based on aquifer disposition
Aquifer –I occurs in 5-Basaltic lava flows between elevation 530-421m amsl Both Aquifer- I & II occurs in 3 flows from 503 – 440 m amsl Aquifer-II occurs in basaltic flows from 503- 276 m asml
Basalt flow
Elevation (m amsl)
Thickness (m) Aquifer-I Aquifer-II
XV 530-514 16 9.15-12
XIV 514-503 11 8.2-9
19-21 XIII 503-478 25 9.15-21 36-43 XII 478-462 16 13-24 42-57 XI 462-440 22 12.0-18.0 54-76
X 440-421 19 27.4-27.7 76-77
83-89 IX 421-396 25 100-129 VIII 396-378 18 76-80 VII
378-362 16 145-148
140-145
II
294-276
18 234-267

28 | P a g e
Aquifer mapping & Management plan of Phanda block

29 | P a g e
Aquifer mapping & Management plan of Phanda block
30 | P a g e
Aquifer mapping & Management plan of Phanda block
Hydrochemical (water quality sampling, number of samples and analysis mechanism etc.), 2.2.3 Geophysical (Location, number, analytical techniques etc.),
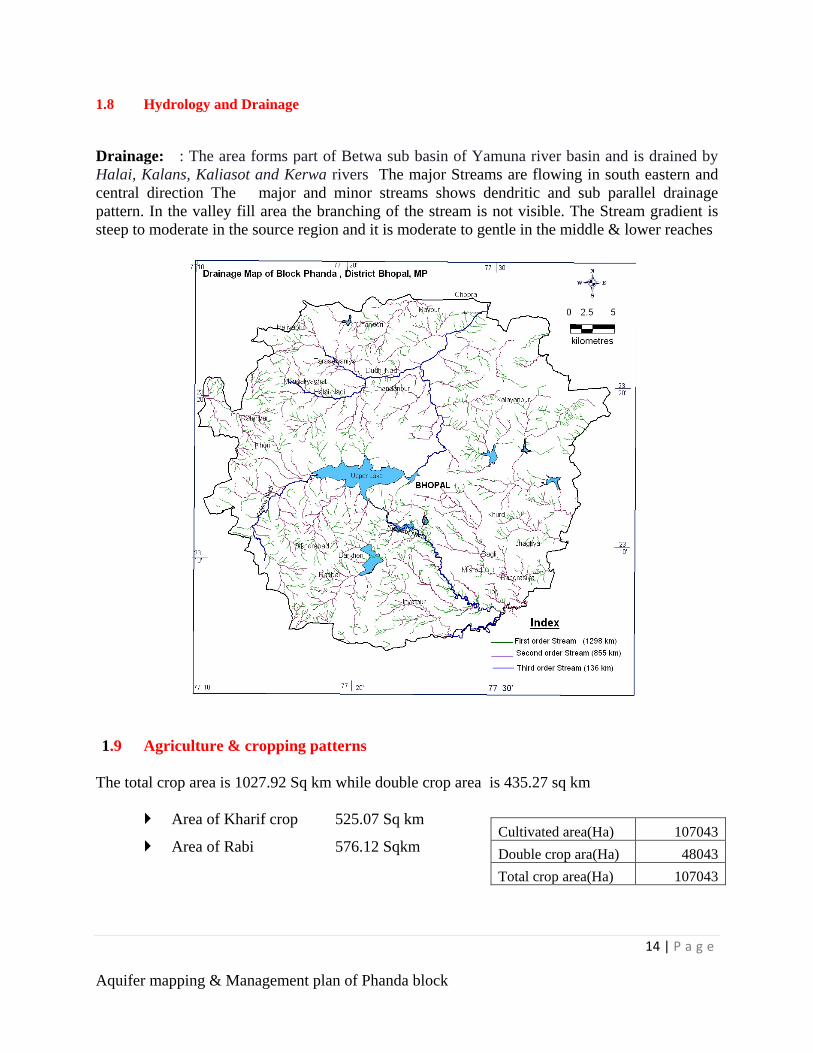
2.2.4 Exploratory drilling-State, CGWB and
private wells (number, location, depths, well design etc.)
2.2.5 Nine exploratory wells have been constructed with 09 obsrvation wells in the 2012-13.In Betwa project(1981) two exploratory wells were constructed

31 | P a g e
Aquifer mapping & Management plan of Phanda block
Aquifer of kolans
Location Well Aquifer Depth of Aquifer mbgl
Discharge lps
Aquifer elevation m asl
Flow
Bakniaya EW Vesicular basalt 62.90-70.0 0.14 455.20-448.10 Flow VI
Barjhri EW Vesicular basalt 08.0-9.0 0.14 536.30-535.30 Flow X
Vesicular basalt 35.40-38.40 0.14 508.90-505.90 Flow IX
Barkhera Nathu EW Vesicular basalt 264.10-267.20
0.61 268.30-228.60 Flow 0
Barkheri
EW Vesicular basalt 36.0-37.0 0.14 492.7-491.7 Flow-VII
Vesicular basalt 77.0-78.10 18.64 451.7-450.6 Flow-VI
Vesicular basalt 99.50 -105.6 reduced to 8.24
429.20-423.10 Flow-V
Vesicular basalt 130.0-132.6 l reduced to 3.41
398.7-396.1 Flow-IV
Barkheri
OW-I Basalt mfj 41.0-41.5 18.64 487.20-478.0 Flow-VII
Barkheri
OW-II Vesicular basalt 75.10-78.10 6.31 453.6-450.6 Flow-VII
Kolans Kal EW Vesicular basalt 14.10-17.10 0.14 501.30-498.30 Flow-VIII
Vesicular basalt 220.50-227.60
2.34 294.90-297.80 Flow-II
EW-II Vesicular basalt 220.50-227.60
0.85 294.90-297.80 Flow-II
OW-I Massive fractured / jointed Vesicular basalt
12.0-12.50 26.30-29.30
0.14 0.85
505.40-505.90 489.10-486.40
Flow-VIII
OW-II Massive fractured / jointed
8.10-11.0 0.14 507.40-504.40 Flow-VIII
OW-(A) Vesicular basalt 114.60-117.70
0.14 400.80-397.70 Flow-V
Kolhukheri
EW Vesicular Basalt 18-19.30 70.0-72.0
4.75 lps 1.13 lps
490.30-489.0 438.30-436.30
Flow-IV Flow-III
OW Vesicular Basalt 69-75.0 0.14 lps 439.30-433.10 Flow-III
Nandani
EW-I Massive fractured / jointed
145.20-148.30
1.13 lps 380.4-377.30 Flow-III

32 | P a g e
Aquifer mapping & Management plan of Phanda block
Location Well Aquifer Depth of Aquifer mbgl
Discharge lps
Aquifer elevation m
asl
Flow
Nandani
OW-I
Vesicular Basalt Zeolitic Basalt
20.20-26.30 77.0-80.20
0.14 lps 8.24 lps
525.6-499.30 448.60-444.40
Flow-VIII Flow-VI
Nandani
OW-II Massive fractured / jointed
72.0-75.10 0.14 lps 453.6-450.5 Flow-VI
Nandani
OW-III Vesicular Basalt 69.0-75.10 1.13 lps 456.6-450.5 Flow-VI
Ulijhanwan
EW Massive fractured / jointed
50.70-51.0 0.14 lps 478.10-478.10 Flow-III
Vesicular Basalt 129.0-132.0 3.41lps 400.10-397.10 Flow-0
Ulijhanwan
OW Massive fractured / jointed
14.10-20.2 0.14 lps 515.0-508.9 Flow-IV
Massive fractured / jointed
20.2-41.50 0.85 lps 508.9-487.60 Flow-IV
Massive fractured / jointed
41.50-44.60 1.31 lps 487.560-484.5 Flow-III
Vesicular Basalt 148.5-151.30 18.64 lps 380.6-377.80 Flow-0

33 | P a g e
Aquifer mapping & Management plan of Phanda block
Data Interpretation, Integration and Aquifer Mapping Results and interpretation of all studies mentioned in point no. 2 leading to preparation of aquifer maps- 2 D and 3D diagrams. Kolans Watershed
Regional View of Kolans River Watershed Image Characteristics of Kolans River Watershed
S. No.
Geomorphological Unit
Spectral Signature prospect for ground water
1. Plateau Highly Dissected
Medium to dark brownish tone, medium texture, dendritic drainage pattern and moderate drainage density, Very gentle to gentle slope, extensively cultivated
Good prospect for ground water recharge
2. Plateau Moderately Dissected
Medium to light bluish reddish tone, coarse texture, medium drainage density, Gentle to moderate slope, extensively cultivated
Better prospect along fracture zone
3. Plateau Slightly Dissected
Light Bluish green tone, coarse to fine texture, dendritic drainage pattern and high drainage density, Moderately to slightly undulating, under rainfed cultivation
High priority for recharge structure
4. Alluvial Plain Light to medium grey tone, mottled texture, Very gentle to gentle slope, cultivated.
Good recharge from surrounding areas
5. Valley Fills Reddish tone, smooth texture, sparse vegetation, confined along stream course.
High priority for recharge structure
6. Denudational Hills Brownish tone, fine texture, High dissected with high relief, vegetation present.
Runoff zone, Not suitable for recharge
7. Waterbody Bluish tone ----

34 | P a g e
Aquifer mapping & Management plan of Phanda block

35 | P a g e
Aquifer mapping & Management plan of Phanda block
Lineament Analysis
The lineaments present in the study area are both geomorphic as well as controlled lineament The mapped structural lineaments were analyzed using the lineament density (LD) and lineament frequency (LF) parameters. The results of the analysis are presented as lineament density map and rose diagram (figures 6, 7& 8) respectively. .
The frequency of total number of 118 lineaments has been plotted in 100azimuth class interval. The rose diagram shows bimodal distribution with dominant trends
.
The rose diagram (Figure) shows the directional frequency of the mapped lineaments over the area of study. It was interpreted as a statistical means of representing the anisotropy of the fractured environment, as well as the fissure development tendency on a regional. The rose diagram of the detected lineaments show two prominent trends in the direction of N S and N-W axis which is also the principal direction of the regional structures directions. A comparison of Lineament density variation map shows that the two prominent lineament trends (NW SE and N-S) are correlated with high density variation zones of the study area. This can be an indication of the direction of groundwater movement in the studied area.

36 | P a g e
Aquifer mapping & Management plan of Phanda block
The lineament density variation map (Fig.) shows the lineament numbers to be of the ranges varying between 3 and 4 in numbers. The denser the lineaments typified the intense of rock fracturing which is a prerequisite for development of hollow passages over an area. The areas around the central, northeastern and south western parts of the study area has a relatively high density value (>4) while the south-eastern, north-western, and nothern parts of the study area are covered by density values (<4). The zones of relatively high lineament density are identified as zones of high degree of rock fracturing which are prerequisite for groundwater conduit development in an area.
A comparison of Figure- with Figure – Lineament density variation map, shows that the areas underlain by high density are characterized by relatively high lineament intersection value. The zones of high lineament intersection over the study area are feasible zones for groundwater potential evaluation.

37 | P a g e
Aquifer mapping & Management plan of Phanda block
In the Recharge region of Kolan WS along Highly dissected pleatus
4-exploratory wells drilled in the depth range- 151.50-290.41
Elevation area ranges from 537.5 – 547.6m amsl
4- hydrogeological flows of thickness variation of 09-30m encountered to depth of 120m
Aquifers are weathered basalt. basalt fractured &jointed and vesicular basalt with discharge
Flows Aquifer disposition(mbgl)/Elevation (m amsl)
Elevation Thickness
Bamuliya
Ulijhawan Bilkisganj
Barjari
549-536 13m
0.90-9.0 -
536-518 8m 9.5-17-WB (531.5- 524)
8-11(WB) –WB (529-526)
518-503 503-488
30m 41.50 – 44.60 BFJ
35.40- 38.40
488-429 9m 54 – 56 (VB) (487-489)
50.50 -51.0 BFJ (486.60-486.8)

38 | P a g e
Aquifer mapping & Management plan of Phanda block
Groundwater Potential Model (GPM) Groundwater Favorable Zone
A groundwater favorable
zonation of the study area has been analyzed by the using of Model Builder Application in ESRI ArcGIS 9.3.1 with the
lithological structural, lineament density,
drainage density, land use, hydro-geomorphological elements, and the background of the survey of India topographical maps on 1:50,000 scale. On the basis of integration of these maps groundwater favorable zones of the study area were identified. The groundwater favourable zones are shown in Fig. -.
On the above considerations, the various hydro-geomorphic units have then been classified into five categories of groundwater potentiality namely, very good, good, moderate, poor and very poor.
The hydro-geomorphological units such as Alluvial Plain, Valley Fills, Deccan Plateau, Buried Pediment (sand stone) are most favourable zones for groundwater exploration & development in the study. Hence, these areas are marked as good to very good favourable zones. These zones are distributed mostly in the north, and middle of the study area and only some few in the southern portion of the area. A glance at Fig. -reveals that the northern part and some of the southern part of the study area have excellent groundwater potential as compared to the upper middle basin and east-south-eastern part of the basin. These are also verified from field check. This information is very useful for the further groundwater development in the study area.
Very High High Moderate Low Groundwater Potential Class
4.26 29.29 45.79 20.64 Area %

39 | P a g e
Aquifer mapping & Management plan of Phanda block
4.0 Ground Water Resources 4.1 Recharge, Draft and Stage of groundwater development of replenishable resource.
4.1.1 Recharge
Data Variables used in Dynamic Ground water Resources Annual Rainfall (mm) 989.1
Average Pre-monsoon Water level (mbgl) 10.87 Average Post-monsoon Water Level (mbgl) 6.84 Average Fluctuation (m) 4.03 Number for Irrigation structure
DW with electric /diesel pump 4383
Bore well 8448
Parameters Used in the Assessment of Dynamic Ground water Resources
Rainfall Infiltration Factor (in fraction) 0.13/.06 Specific Yield (in fraction) 0.02/.015
Recharge From Rain Fall During Monsoon Season Ham 17214.39 Recharge From Other Sources During Monsoon Season Ham 1172.63 Recharge From Rain Fall During Non Monsoon Season Ham 0 Recharge From Other Sources During Non Monsoon Season Ham 3252.14 Total Annual Recharge Ham 21639.16 Natural Discharge During Non Monsoon Period Ham 1081.96 Net Ground Water Availability Ham 20557.2
Total Geographical Area(ha) 134837 Hilly Area(Ha) 6437 Ground Water Recharge Worthy Area(Ha) 128400 Non-command area

40 | P a g e
Aquifer mapping & Management plan of Phanda block
4.1.2 Draft
Parameters Used in the Assessment of Dynamic Ground water Resources
Season-wise Unit draft Irrigation(ha m)
DW with electric /diesel pump
Monsoon 0.13
Non-Monsoon 0.26
Bore well
Monsoon
0.52
Non-Monsoon 1.04
Ground Water Draft Existing Gross Ground Water Draft for Irrigation Ham 13788.79 Existing Gross Ground Water Draft for Domestic & Industrial Water Supply Ham 2096.24 Net Ground Water Availability for Future Irrigation Development Ham 4418.7
4.1.3 Stage of groundwater development of replenishable resource Stage of Ground Water Development % 77.27
4.2 Static resource and extraction from unconfined aquifer as well as in/from deeper aquifers, if any.

41 | P a g e
Aquifer mapping & Management plan of Phanda block
4.2 Ground Water Related Issues 4.3 Identification of issues,
Limited Yield Potential:
• During Rabi period yield of Groundwater abstraction structure reduces & do not meet crop water requirement. Bore wells yield reduces in peak Rabi season (From 65-324m3/day during start of Rabi to 22-162 m3/day during Peak Rabi Season).
• Aquifers –I: Low to medium potential in Basalt / V. Sandstone aquifers. • Aquifers -II :Limited vesicles/fracture thickness resulting into low yield of bore
wells. Declining Water levels
Water level 4.35-8.40m (Premoonsoon 2005) to 7.70-18.34m Premoonsoon 2015)
Dependency of Irrigation on Ground Water ~ 80% of irrigation requirement from Ground Water
4.4 Geographical distribution and quantification with respect to ground water resources
4.5 Future demand (for 2025 and 2030) scenario and stress aspects of the aquifer.
4.6 Participatory ground water management issues.

42 | P a g e
Aquifer mapping & Management plan of Phanda block
6.0 Management Strategies (≈5 pages)
6.1 Aquifer wise Plan for sustainable management of the resource
6.2 Aquifer wise availability of unsaturated zone.
The availability of unsaturated zone in the area is about 1145.34 sq km.
Based on National Hydrograph Monitoring Wells data of phanda block showing administrative boundary and post monsoon, 2015, depth to water level zones varying from 0-3, 3-6, 6-9 and more than 9 metres below ground level (Fig 6.2) l with post monsoon declining trend of >0.10 metres/year for 10 years from 2005 to 2015 were prepared (Fig 5) to visualize and identify the feasible areas. Areas showing depth to water level between 0 and 3 m bgl have not been considered for computing the potential zones available for recharge.
The area suitable for artificial recharge have been segregated into 2-categories as follows:
1. Depth to water level between < 3 m bgl and declining trend of 0.10m /year.
2. Depth to water level more than > 3 and declining trend of 0.10m /year.
The areas of above 2 categories are demarcated on base map and areas with water level more than 3 m bgl are identified for artificial recharge to ground water (Fig 6.2).
Estimation Of Available Sub Surface Storage Potential
The thickness of available unsaturated zone (below 3 m bgl) of above categories is estimated by considering the different ranges of water level. The total volume of unsaturated strata is calculated by considering the above categories and unsaturated thickness of different range.(table- This volume was then multiplied by average specific yield i.e. 1.5% for hard rock on area specific basis to arrive at the net amount of water required which is to be recharged by artificial recharge to saturate the aquifer up to 3 m bgl.
Table 6.2 : stprage potential of available unsaturated zone Zone Area of Unsaturated zone Total storage(mcm) 3-6 138.74 15.410 6-9 202.0 11.817 >9 804.9 78.44 Total 1145.34 95.677

43 | P a g e
Aquifer mapping & Management plan of Phanda block
Surface Water Requirement After assessing the actual volume of water required for saturating the vadose zone, the actual requirement of source water is to be estimated. Based on the experience gained in the field experiments, an average recharge efficiency of 75% of the individual structure is only possible. Therefore, to arrive at the total volume of actual source water required at the surface, the volume of water required for artificial recharge calculated is multiplied by 1.33 (i.e. reciprocal of 0.75). 6.3 Augmentation plan of the resource through artificial recharge and water conservation.
Area suitable for recharge (sq km) : 682
Average pos-monsoon water level (m) : 7.50
Average SP Yield (%) : 0.015
Source Water for Artificial Recharge
Sub-surface storage (mcm)
Surface water required (mcm)
Surface water (Run-off) available (mcm)
Non-committed Run-off (mcm)
46.03 61.23 230.53 69.16 Number of Recharge Structure
Structure Proposed Already Constructed Balance Percolation tank 61 33 28 Recharge shaft/ Tube well 1837 NB/ CD/ CP Proposed 612 82 530 Financial Outlay of the Plan
Structure Unit Cost (Rs in Crores)
Number Cost (Rs in Crores)
Percolation Tanks 0.2 28 5.65 NB/ CD/ CP 0.1 530 53.03 Recharge shaft/ Tube well 0.01 1837 18.37
Total Cost (RS in Crores 77.04

44 | P a g e
Aquifer mapping & Management plan of Phanda block
Projected status of Ground water Resources & Utilization
Status Net Ground Water Availability
Additional Recharge from water conservation & AR Structures
Total Net GW Availability after intervention
Existing Gross Ground Water Draft for All Uses
Net Ground water draft after interventions
Present Stage of Ground Water Development
Projected Stage of Ground Water Development in
Category
mcm mcm mcm mcm mcm % % Before Intervention
After Intervention
Present Status 202.54 202.54 159.01 159.01 79 - Semi
Critical
Status after Intervention without Creating additional Draft
202.54 46.03 248.57 159.01 159.01 79 64 Semi Critical Safe
After Craeting Additional Irrigation Potential of 9695 ham
202.54 46.03 248.57 - 202.5 100 81 OE Semi Critical