CENTRAL BANK OF NIGERIA YEAR 2019... · 15. Shehu A. Goringo - Gombe 16. Babangida Jino - Gusau 17....
221
2019 CENTRAL BANK OF NIGERIA ECONOMIC REPORT FOR THE FIRST HALF OF 2019
Transcript of CENTRAL BANK OF NIGERIA YEAR 2019... · 15. Shehu A. Goringo - Gombe 16. Babangida Jino - Gusau 17....

2019
CENTRAL BANK OF NIGERIA
ECONOMIC REPORT FOR THE FIRST
HALF OF 2019

ii
Central Bank of Nigeria
Corporate Head Office
33 Tafawa Balewa Way
Central Business District
P. M. B. 0187
Garki Abuja
Website: www.cbn.gov.ng Contact Centre
Tel: +234 700 225 5226
© 2019 Central Bank of Nigeria
ISSN 1597 - 2976

iii
Vision
“Be THE MODEL CENTRAL BANK delivering PRICE and
FINANCIAL SYSTEM STABILITY and promoting SUSTAINABLE
ECONOMIC DEVELOPMENT.”
Mission
“To be proactive in providing a stable framework for the
economic development of Nigeria, through the effective,
efficient and transparent implementation of monetary and
exchange rate policy, and management of the financial
sector.”

iv
THE CENTRAL BANK OF NIGERIA
Established by the Central Bank of Nigeria (CBN) Act of 1958, the
Principal objects of the Bank, as contained in the new CBN Act, 2007,
are to:
• ensure monetary and price stability;
• issue legal tender currency in Nigeria;
• maintain external reserves to safeguard the international
value of the legal tender currency;
• promote a sound financial system in Nigeria; and
• act as banker and provide economic and financial
advice to the Federal Government of Nigeria.

v
MEMBERS OF THE BOARD OF DIRECTORS OF THE BANK
AS AT JUNE 30, 2019
1. Godwin I. Emefiele, CON - Governor Chairman
2. Edward L. Adamu - Deputy Governor (C S) Member
3. Okwu J. Nnanna - Deputy Governor (E P) Member
4. Aishah N. Ahmad - Deputy Governor (FSS) Member
5. Folashodun A. Shonubi - Deputy Governor (Ops) Member
6. Adeola Adetunji - Non-Executive Director Member
7. Idris Ahmed - Non-Executive Director Member
8. Mahmoud Isa-Dutse - Non-Executive Director Member
9. Ummu A. Jalingo - Non-Executive Director Member
10. Mike Obadan - Non-Executive Director Member
11. Justitia O. Nnabuko - Non-Executive Director Member
12. Abdu Abubakar - Non-Executive Director Member
Alice Karau - Secretary
MEMBERS OF THE COMMITTEE OF GOVERNORS OF
THE BANK AS AT JUNE 30, 2019 1. Godwin I. Emefiele, CON - Governor (Chairman)
2. Edward L. Adamu - Deputy Governor (Corporate Services)
3. Okwu J. Nnanna - Deputy Governor (Economic Policy)
4. Aishah N. Ahmad - Deputy Governor (Financial System Stability)
5. Folashodun A. Shonubi - Deputy Governor (Operations)
Alice Karau - Secretary
MEMBERS OF THE MONETARY POLICY COMMITTEE (MPC)
AS AT JUNE 30, 2019
1. Godwin I. Emefiele, CON - Governor (Chairman)
2. Edward L. Adamu - Deputy Governor (CS)
3. Okwu J. Nnanna - Deputy Governor (EP)
4. Aishah Ahmad - Deputy Governor (FSS)
5. Folashodun A. Shonubi - Deputy Governor (Ops)
6. Festus A. Adenikinju - Member
7. Aliyu R. Sanusi - Member
8. Robert C. Asogwa - Member
9. Dahiru H. Balami - Member
10. Mike Obadan - Member
11. Mahmud Isa-Dutse - Member
Moses K. Tule - Secretary

vi
DEPARTMENTAL DIRECTORS
1. Dipo T. Fatokun - Banking Services
2. Ahmad Abdullahi - Banking Supervision
3. Musibau Fisayo Olatinwo - Branch Operations
4. Aisha Balewa Abubakar* - Capacity Development
5. Sirajuddin Kofo Salam-Alada - Consumer Protection
6. Isaac A. Okorafor - Corporate Communications
7. Alice Karau - Corporate Secretariat
8. Prescilia Eleje - Currency Operations
9. Mudashir A. Olaitan - Development Finance
10. Ekwueme Benjamin Fakunle - Finance
11. Angela Adewunmi Sereejembi - Financial Markets
12. Kevin N. Amugo - Financial Policy and Regulation
13. Dabai M. Suleyman - FSS 2020
14. Jeremiah Abue - Governors’ Department
15. Umma Dutse (Haj.) - Human Resources
16. Rakiya Shuaibu Mohammed* - Information Technology
17. Vivian I. Agu (Mrs.) - Internal Audit
18. Johnson O. Akinkunmi - Legal Services
19. Mohammed Ahmed Shehu - Medical Services
20. Moses K. Tule - Monetary Policy
21. Agnes O. Martins (Mrs.) - Other Financial Institutions
Supervision
22. Samuel Chukwuyem Okojere - Payments System Management
23. Arinze A. Stanley - Procurement & Support Services
24. Uwatt B. Uwatt - Research
25. Salihi Abba - Reserve Management
26. Oluwafolakemi J. Fatogbe (Ms.) - Risk Management
26. Oluwakemi Omobosede Osa-Odigie* - Security Services
27. Mohammed Tumala M. - Statistics
28. Mohammed Dabai Suleyman - Strategy Management
29. Ahmed Bello Umar - Trade & Exchange
30. Eunice N. Egbuna** - Secondment to WAMI
* Overseeing the Department
**On secondment

vii
BRANCH CONTROLLERS/CURRENCY OFFICERS
1. Christopher Onah Adayi - Abakaliki
2. Lanre Wahab Oseni - Abeokuta
3. Ibeawuchi Francis Amagwu - Abuja
4. Ademola-Ganiyu Atobatele - Ado-Ekiti
5. Fatai Adebare Yusuf - Akure
6. Patricia Nwabune Ukwu - Asaba
7. Benedict I. C. Maduagwu - Awka
8. H. A. Idris - Bauchi
9. Renner Davis Jumbo - Benin
10. T. G. Mohammed - Birnin-Kebbi
11. Chuks Monday Sokari - Calabar
12. Abubakar Hamman Joda - Damaturu
13. Sa’adatu Aminu Ibrahim (Mrs.) - Dutse
14. Emmanuel C. Okonjo - Enugu
15. Shehu A. Goringo - Gombe
16. Babangida Jino - Gusau
17. Olufolake Mobolade Ogundero - Ibadan
18. Babatunde Ademola Amao - Ilorin
19. John S. Minya - Jalingo
20. Yusuf Baguro Duniya - Jos
21. Ahmed Mohammed Wali - Kaduna
22. Abdulkadir Idris Ali - Kano
23. D. N. Usman - Katsina
24. S. Isuwa - Lafia
25. Atise Johnson Ekhator - Lagos
26. Ahmed Isa Sule - Lokoja
27. Tijani Kanuriana Lawan - Maiduguri
28. Bulus Ibrahim Abba - Makurdi
29. Mas’ud Tule Ibrahim - Minna
30. Ajuma Daphne Madojemu - Osogbo
31. Georgina Nwankwo - Owerri
32. Romades Adewole Randle - Port Harcourt
33. Yusuf B. Wali - Sokoto
34. Onyeka Michael Ogbu - Umuahia
35. Itohan Mercy Ogbomon-Paul - Uyo
36. Sikiru Kolawole Osidele - Yenagoa
37. Satu Jatau - Yola

viii
TABLE OF CONTENTS PAGE Summary .. .. .. .. .. .. .. .. .. .. xvii
1.0 INTRODUCTION .. .. .. .. .. .. .. .. 1
2.0 OPERATIONS OF THE CENTRAL BANK OF NIGERIA .. .. .. 2
2.1 Liquidity Management .. .. .. .. .. .. 2
2.2 Monetary Policy Committee (MPC) Decisions .. .. .. 2
2.3 Developments in the Payments system .. .. .. .. 3
2.3.1 Payments System Initiatives .. .. .. .. 3
2.3.1.1 Framework for Bank Verification Number (BVN)
Operations and Watch-List .. .. .. 3
2.3.1.2 Nigeria Electronic Fraud Forum (NeFF) .. .. 4
2.3.1.3 Licensing of Payments System Participants .. 4
2.3.1.4 Examination of Payments Service Providers .. 5
2.3.1.5 Revised Nigeria Cheque Standards and Cheque
Printers Accreditation Scheme .. .. .. 5
2.3.1.6 Payments System Vision 2020 (PSV 2020) .. 6
2.3.2 Retail Payments .. .. .. .. .. .. 7
2.3.2.1 Electronic Payments .. .. .. .. 7
2.3.2.2 Cheque .. .. .. .. .. .. 7
2.3.2.3 Electronic Transactions .. .. .. .. 8
2.3.2.3.1 ATM Transactions .. .. .. .. 10
2.3.2.3.2 Web Transactions .. .. .. .. 11
2.3.2.3.3 Point of Sale (PoS) Transactions .. .. 12
2.3.2.3.4 Mobile Payments .. .. .. .. 13
2.3.3 Wholesale Payments System .. .. .. .. 14
2.3.3.1 Real Time Gross Settlement (RTGS) System .. 14
2.3.3.2 Nigeria Inter-bank Settlement System Instant
Payment (NIP) .. .. .. .. .. 15
2.3.3.3 NIBSS Automated Payment Services (NAPS) .. 16
2.3.4 Currency Operations .. .. .. .. .. 17
2.3.4.1 Issuance of the Legal Tender .. .. .. 17
2.3.4.2 Currency-in-Circulation (CIC) .. .. .. 18
2.4 Financial Sector Surveillance .. .. .. .. .. 19
2.4.1 Banking Supervision .. .. .. .. .. 19
2.4.2 Routine/Target Examination .. .. .. .. 23
2.4.3 Special/ Foreign Exchange Examinations .. .. .. 24
2.4.4 Banking Sector Soundness .. .. .. .. .. 24
2.4.5 Banks’ Compliance with the Code of Corporate
Governance .. .. .. .. .. .. .. 25
2.4.6 Financial Crimes Surveillance/Anti-Money Laundering
/Combating the Financing of Terrorism (AML/CFT).. .. 26
2.4.7 Cross Border Activities .. .. .. .. .. 27
2.4.8 Update on Basel II/III Implementation .. .. .. 28
2.4.9 Fraud and Forgeries.. .. .. .. .. .. 29
2.4.10 Consumer Protection .. .. .. .. .. 29
2.4.11 Financial Literacy .. .. .. .. .. .. 31

ix
2.4.12 Examination of Other Financial Institutions .. .. 32
2.5 Foreign Exchange Market and Management .. .. .. 35
2.5.1 Spot Transactions in the Foreign Exchange Market .. .. 35
2.5.2 Forwards and Swaps Transactions .. .. .. .. 35
2.5.3 Exchange Rate Movements .. .. .. .. 36
2.5.3.1 Spot Exchange Rates .. .. .. .. 36
2.5.4 Foreign Exchange Flows .. .. .. .. .. 38
2.5.5 Sectoral Utilisation of Foreign Exchange .. .. .. 41
2.5.6 Nominal Effective Exchange Rate (NEER) and Real
Effective Exchange Rate (REER) Indices .. .. .. 43
2.6 Development Finance Operations .. .. .. .. 44
2.6.1 Real Sector Interventions .. .. .. .. .. 44
2.6.1.1 Credit Support Schemes .. .. .. .. 44
2.6.1.1.1 Commercial Agriculture Credit Scheme
(CACS) .. .. .. .. .. 44
2.6.1.1.2 Paddy Aggregate Scheme (PAS) .. 45
2.6.1.1.3 Anchor Borrowers’ Programme (ABP) 45 2.6.1.1.4 Accelerated Agriculture Development
Scheme (AADS) .. .. .. .. 46
2.6.1.1.5 MSME Development Fund (MSMEDF) .. 46
2.6.1.1.6 Agri-business/Small and Medium Enterprises
Investment Scheme (AGSMEIS) .. .. 47
2.6.1.1.6.1 Creative Industry Financing
Initiative (CIFI) .. .. .. 47
2.6.1.1.7 Youth Entrepreneurship Development
Programme (YEDP) .. .. .. 47
2.6.1.1.8 Real Sector Support Facility (RSSF) .. 48
2.6.1.1.8.1 Differented Cash Reserve Ratio
(DCRR) Window of the RSSF
(RSSF-DCRR) .. .. .. 48
2.6.1.1.9 Small and Medium Enterprises and
Refinancing Facility (SMERRF) .. .. 48
2.6.1.1.10 Textile Sector Intervention Fund (TSIF) .. 49
2.6.1.1.11 Power and Airline Intervention Fund (PAIF) 49
2.6.1.1.12 Nigeria Electricity Market Stabilisation
Facility (NEMSF) .. .. .. .. 49
2.6.1.1.13 Nigeria Bulk Electricity Trading Payment
Assurance Facility (NBET-PAF) .. .. 50
2.6.1.1.14 CBN-BOI Industrial Facility .. .. 50
2.6.1.1.15 National Food Security Programme (NFSP) 51
2.6.1.1.16 Presidential Fertiliser Initiative (PFI) .. 51
2.6.1.1.17 Non-oil Export Stimulation Facility (NESF) 51
2.6.1.1.18 Export Development Facility (EDF) .. 52
2.6.1.1.19 Shared Agent Network Expansion Facility
(SANEF) .. .. .. .. .. 52
2.6.2 Credit Guarantee Schemes .. .. .. .. 52
2.6.2.1 Agricultural Credit Guarantee Scheme Fund (ACGS) 52
2.6.2.1.1 Interest Drawback Programme (IDP) .. 53
2.7 Financial Inclusion .. .. .. .. .. .. .. 53
2.8 National Collateral Registry (NCR) .. .. .. .. .. 54

x
ECONOMIC REPORT
3.0 GLOBAL ECONOMIC DEVELOPMENTS .. .. .. .. .. 56 3.1 Global Output .. .. .. .. .. .. .. 56
3.2 Global Commodity Prices .. .. .. .. .. .. 58
3.3 Global Inflation.. .. .. .. .. .. .. .. 59
3.4 International Financial Markets .. .. .. .. .. 61
3.5 World Economic Outlook for the Rest of 2019 .. .. .. 64
4.0 DEVELOPMENTS IN THE DOMESTIC ECONOMY .. .. .. 66
4.1 Monetary and Credit Developments .. .. .. .. 66
4.1.1 Reserve Money .. .. .. .. .. .. 66
4.1.2 Broad Money (M3) .. .. .. .. .. .. 68
4.1.3 Broad Money (M2) .. .. .. .. .. .. 68
4.1.3.1 Quasi Money (QM) .. .. .. .. .. 68
4.1.4 Narrow Money (M1) .. .. .. .. .. .. 68
4.1.5 Currency-in-Circulation and Deposits at the CBN .. .. 69
4.1.6 Currency Outside Bank (COB) .. .. .. .. 69
4.1.7 Demand Deposits .. .. .. .. .. .. 69
4.1.8 Drivers of Growth in Monetary Supply .. .. .. 70
4.1.8.1 Net Foreign Assets (NFA) .. .. .. .. 70
4.1.8.2 Net Domestic Credit (NDC) .. .. .. .. 70
4.1.8.2.1 Net Credit to the Government (NCG) 71
4.1.8.2.2 Credit to the Private Sector (Cp) 71
4.1.8.3 Other Assets (Net) (OAN) .. .. .. .. 71
4.1.9 Sectoral Distribution of Credit.. .. .. .. .. 72
4.1.10 Maturity Structure of DMBs’ Outstanding
Loans and Advances, and Deposit Liabilities.. .. .. 73
4.1.11 Market Structure of the Banking Industry .. .. .. 75
4.1.12 Consumer Credit .. .. .. .. .. .. 76
4.1.13 Money Market Developments.. .. .. .. .. 77
4.1.13.1 Money Market Assets Outstanding.. .. .. 77
4.1.13.2 Primary Market.. .. .. .. .. .. 78
4.1.13.3 Structure of Outstanding Nigeria Treasury Bill
Outstanding .. .. .. .. .. 79
4.1.13.4 Federal Government of Nigeria Bonds .. .. 79
4.1.13.5 Open Market Operations (OMO).. .. .. 80
4.1.13.6 OMO Auctions .. .. .. .. .. 80
4.1.13.7 The Two-Way Quote Trading in NTBs.. .. .. 81
4.1.13.8 Tenor Repurchase Transactions.. .. .. .. 81
4.1.13.9 Discount Window Operations .. .. .. 81
4.1.13.9.1 Over the Counter (OTC) Transactions .. 81
4.1.13.9.2 CBN Standing Facilities .. .. .. 82
4.1.13.9.3 Standing Lending Facility (SLF). .. .. 82
4.1.13.9.4 Standing Deposit Facility (SDF). .. .. 82
4.1.13.9.5 Inter-Bank Funds Market .. .. .. 82
4.1.14 Interest Rates Developments.. .. .. .. .. 83
4.1.14.1 Money Market Rates.. .. .. .. .. 83
4.1.14.1.1 Deposit Rates.. .. .. .. .. 84
4.1.14.1.2 Lending Rates.. .. .. .. .. 85
4.1.15 Institutional Savings .. .. .. .. .. .. 85

xi
4.1.16 Other Financial Institutions .. .. .. .. .. 86
4.1.16.1 Development Finance Institutions.. .. .. 86
4.1.16.2 Microfinance Banks (MFBs).. .. .. .. 86
4.1.16.3 Finance Companies (FCs).. .. .. .. 87
4.1.16.4 Primary Mortgage Banks (PMBs) .. .. .. 88
4.1.16.5 Bureaux-De-Change (BDCs) .. .. .. 89
4.1.17 Capital Market Developments.. .. .. .. .. 89
4.1.17.1 Institutional Developments.. .. .. .. 89
4.1.17.2 The Nigerian Stock Exchange(NSE).. .. .. 91
4.1.17.3 The New Issues Market .. .. .. .. 92
4.1.17.4 The Secondary Market.. .. .. .. .. 93
4.1.17.5 All-Share Index and Aggregate Market
Capitalisation .. .. .. .. .. 94
4.2 Fiscal Operations .. .. .. .. .. .. .. 95
4.2.1 Federation Account Operations .. .. .. .. 95
4.2.1.1 Federally Collected Revenue Distribution.. .. 98
4.2.1.2 VAT Pool Account .. .. .. .. .. 98
4.2.1.3 Cumulative Distribution .. .. .. .. 98
4.2.2 Federal Government Finances .. .. .. .. 99
4.2.2.1 Federal Government Fiscal Balance .. .. 99
4.2.2.2 Federal Government Retained Revenue .. .. 100
4.2.2.3 Federal Government Expenditure .. .. .. 101
4.2.3 State Government Finances .. .. .. .. 104
4.2.4 Local Government Finances .. .. .. .. 105
4.2.5 Public Debt .. .. .. .. .. .. .. 106
4.2.5.1 Consolidated Government Debt .. .. .. 106
4.2.5.1.1 Domestic Debt .. .. .. .. 107
4.2.5.1.2 External Debt .. .. .. .. 107
4.2.5.2 Total Debt Service .. .. .. .. .. 107
4.3 Real Sector Developments .. .. .. .. .. .. 109
4.3.1 Agriculture.. .. .. .. .. .. .. .. 109
4.3.1.1 Agricultural Policies and Institutional Support.. .. 109
4.3.1.2 Agricultural Production and Prices.. .. .. 111
4.3.2 Industry.. .. .. .. .. .. .. .. 112
4.3.2.1 Industrial Policy and Institutional Support .. .. 112
4.3.2.2 Industrial Production .. .. .. .. 114
4.3.2.3 Manufacturing .. .. .. .. .. 115
4.3.3 Crude Oil .. .. .. .. .. .. .. 115
4.3.3.1 Policy and Institutional Support .. .. .. 115
4.3.3.2 Crude Oil Production and Demand .. .. 117
4.3.3.3 Crude Oil Prices.. .. .. .. .. .. 117
4.3.4 Refining Utilisation .. .. .. .. .. .. 118
4.3.5 Gas .. .. .. .. .. .. .. .. 119
4.3.5.1 Policy and Institutional Support .. .. .. 119
4.3.6 Solid Minerals .. .. .. .. .. .. .. 120
4.3.6.1 Policy and Institutional Support .. .. .. 120
4.3.6.2 Solid Mineral Production .. .. .. .. 121
4.3.7 Electricity Generation .. .. .. .. .. 121
4.3.8 Electricity Consumption .. .. .. .. .. 121
xii
4.3.9 Industrial Financing.. .. .. .. .. .. 121
4.3.9.1 The Bank of Industry (BOI) .. .. .. .. 121
4.3.9.2 The Nigerian Export-Import Bank (NEXIM).. .. 122
4.3.10 Consumer Prices .. .. .. .. .. .. 122
4.3.10.1 Headline Inflation .. .. .. .. .. 123
4.3.10.2 Core Inflation.. .. .. .. .. .. 123
4.3.10.3 Food Inflation.. .. .. .. .. .. 124
4.3.10.4 Urban and Rural Consumer Price Indices and
Inflation Rates .. .. .. .. .. 125
4.3.11 Communication .. .. .. .. .. .. 126
4.3.12 Transportation .. .. .. .. .. .. 127
4.3.12.1 Aviation Services .. .. .. .. .. 127
4.3.12.1.1 Domestic Operations .. .. .. 127
4.3.12.1.2 International Operations.. .. .. 128
4.3.12.2 Railway Services .. .. .. .. .. 128
4.3.12.3 Maritime Services .. .. .. .. .. 128
4.3.13 Social Sector Development.. .. .. .. .. 128
4.3.13.1 Health .. .. .. .. .. .. 128
4.3.13.2 Education .. .. .. .. .. .. 129
4.3.13.3 Environment .. .. .. .. .. 129
4.3.13.4 Housing and Urban Development .. .. 130
4.3.14 Activities of the National Emergency Management Agency 131
4.3.15 Activities of the Niger Delta Development Commission .. 131
4.4 External Sector Developments .. .. .. .. .. 133
4.4.1 Current Account .. .. .. .. .. .. 133
4.4.1.1 Trade .. .. .. .. .. .. .. 133
4.4.1.2 Services .. .. .. .. .. .. .. 138
4.4.1.3 Income .. .. .. .. .. .. .. 139
4.4.1.4 Current Transfers.. .. .. .. .. .. 139
4.4.2 Capital and Financial Accounts .. .. .. .. 140
4.4.2.1 Foreign Direct Investment .. .. .. .. 141
4.4.2.2 Portfolio Investment .. .. .. .. .. 141
4.4.2.3 Other Investment .. .. .. .. .. 141
4.4.3 Capital Importation and Capital Outflow .. .. .. 142
4.4.4 External Reserve .. .. .. .. .. .. 144
4.4.5 External Debt .. .. .. .. .. .. .. 145
5.0 INTERNATIONAL ECONOMIC RELATIONS 146 5.1 Global Institutions .. .. .. .. .. .. .. 146
5.1.1 The International Monetary Fund (IMF)/World Bank Spring
Annual Meetings .. .. .. .. .. .. 146
5.1.2 The 2019 World Economic Forum (WEF) Annual Meeting .. 148
5.1.3 The Group of Twenty-Four (G-24) Technical Group Meeting 149
5.2 Regional Institutions .. .. .. .. .. .. .. 149
5.2.1 African Union (AU) .. .. .. .. .. .. 149
5.2.2 Association of African Central Bank (AACB) .. .. 150
5.3 Sub-Regional Institutions .. .. .. .. .. .. 152
5.3.1 West African Institute for Financial and Economic
Management (WAIFEM) .. .. .. .. .. 152
5.3.2 West African Monetary Zone (WAMZ) .. .. .. 152

xiii
5.3.3 West African Monetary Agency (WAMA) .. .. .. 154
5.3.4 ECOWAS Single Currency Working Group Meeting .. 154
6.0 OUTLOOK FOR THE SECOND HALF OF 2019 .. .. .. .. 155
TABLES Selected Macroeconomic and Social Indicators .. .. .. .. xxvii
1 Monetary Policy Benchmarks and Outcomes .. .. .. 1
2 Monetary Policy Committee Decision During the First Half of 2019 3
3 Licensed Payments System Participants .. .. .. .. 5
4 Volume and Value of Electronic Payments .. .. .. 7
5 Structure of the CIC .. .. .. .. .. .. .. 19
6 Nominal and the Real Effective Exchange Rate Indices .. 44
7 Summary of MSMEDF Disbursements and Repayment .. .. 47
8 Summary of PAIF Disbursement and Repayment .. .. 49
9 Summary of Financing Statements on the NCR .. .. .. 55
10 Indices of Selected International Stock Markets .. .. .. 63
11 Exchange Rates of Selected Countries .. .. .. .. 64
12 Sources and Uses of Reserve Money .. .. .. .. 67
13 Growth in Monetary Aggregates .. .. .. .. .. 72
14 Share of Credit to the Core Private Sector.. .. .. .. 73
15 Maturity Structure of Banks Assets and Liabilities.. .. .. 75
16 Money Market Rates.. .. .. .. .. .. .. 84
17 DMBs Deposit and Lending Rates. .. .. .. .. .. 85
18 Key Indicators of Finance Companies .. .. .. .. 88
19 Key Indicators for Primary Mortgage Banks .. .. .. 89
20 DMBs’ Credit to Core Private Sector .. .. .. .. 157
21 Money Market Rates .. .. .. .. .. .. 158
22 Selected Interest Rates .. .. .. .. .. .. 158
23 Open Market Operations (OMO) Sessions .. .. .. 159
24 Treasury Bills: Issues and Allotments .. .. .. .. 160
25 Monetary and Credit Developments.. .. .. .. .. 161
26 Value of Money Market Assets .. .. .. .. .. 162
27 Selected Interest Rates .. .. .. .. .. .. 163
28 Federation Account Operations .. .. .. .. .. 164
29 Federally Collected Revenue Distribution .. .. .. 165
30 Summary of Federal Government Finances .. .. .. 166
31 Functional Classification of Federal Government Recurrent and
Capital Expenditure. .. .. .. .. .. .. 167
32 Summary of Statutory & VAT Revenue Allocation to State
Governments.. .. .. .. .. .. .. .. 168
33 Allocation to Local Government From the Federation and VAT
Pool Accounts .. .. .. .. .. .. .. 170
34 Domestic Debt of the Federal Government .. .. .. 172
35 Domestic Debt Service Payment of the Federal Government .. 173
36 External Public Debt Outstanding .. .. .. .. .. 174
37 External Debt Service Payments .. .. .. .. .. 175
38a Consolidated Debt of the Federal Government .. .. .. 176
38b Consolidated Debt Payments .. .. .. .. .. 176
39 Gross Domestic Product at 2010 Constant Basic Prices .. .. 177
40 Gross Domestic Product at Current Basic Prices .. .. .. 178

xiv
41 Selected Real Sector Indicators.. .. .. .. .. .. 179
42 Composite Consumer Price Index .. .. .. .. .. 181
43 Urban and Rural Consumer Price Index .. .. .. .. 182
44 Balance of Payments Analytic Presentation (US$).. .. .. 183
45 Balance of Payments Analytic Presentation (Naira) .. .. 184
46 Foreign Exchange Flows Through the Economy.. .. .. 185
47 Nigeria’s Gross External Reserves.. .. .. .. .. .. 186
48 Nigeria’s Foreign Exchange Cross Rates.. .. .. .. .. 187
49 Monthly Average Exchange Rate Movement.. .. .. .. 188
50 Supply of Foreign Exchange .. .. .. .. .. 189
51 Sectoral Utilization of Foreign Exchange .. .. .. .. 190
52 Total External Assets of Financial Institutions.. .. .. .. 191

xv
CHARTS
1 Volume of Cheques Cleared.. .. .. .. .. .. 8
2 Value of Cheques Cleared.. .. .. .. .. .. 8
3 Classification of E-Payment by Volume .. .. .. .. 9
4 Classification of E-Payment by Value .. .. .. .. 9
5 Volume of Electronic Payments .. .. .. .. .. 9
6 Value of Electronic Payments .. .. .. .. .. 10
7 Volume of ATM Transactions .. .. .. .. .. 10
8 Value of ATM Transactions.. .. .. .. .. .. 11
9 Volume of Web Transactions .. .. .. .. .. 11
10 Value of Web Transactions .. .. .. .. .. .. 12
11 Volume of PoS Transactions .. .. .. .. .. 12
12 Value of PoS Transactions .. .. .. .. .. .. 13
13 Volume of Mobile Transactions .. .. .. .. .. 13
14 Value of Mobile Transactions .. .. .. .. .. 14
15 Volume of RTGS Transactions .. .. .. .. .. 14
16 Value of RTGS Transactions .. .. .. .. .. .. 15
17 Volume of NIP Transactions .. .. .. .. .. .. 15
18 Value of NIP Transactions .. .. .. .. .. .. 16
19 Volume of Transactions (NAPS) .. .. .. .. .. 16
20 Value of Transactions (NAPS) .. .. .. .. .. 17
21 Credit Risk Management System (CRMS) Statistics.. .. .. 23
22 Supply of Foreign Exchange .. .. .. .. .. 36
23 Exchange Rate Movements.. .. .. .. .. .. 37
24 Interbank/Bureau-de-Change Foreign Exchange (N/US$) Premium 37
25 Foreign Exchange Disbursements Through the CBN.. .. .. 40
26 Foreign Exchange Transactions Through the CBN.. .. .. 41
27 Sectoral Utilisation of Foreign Exchange (Visibles).. .. .. 42
28 Sectoral Utilisation of Foreign Exchange (Invisibles).. .. .. 43
29 Nominal Effective Exchange Rate (NEER) and Real Effective
Exchange Rate (REER) .. .. .. .. .. .. .. 43
30 Numbers of Savings Accounts in DMBs and BVN Enrollment .. 54
31 Performance of the Naira against Major Currencies .. .. 62
32 Performance of the Naira against Regional Currencies .. 62
33 (a) Reserve Money and its Components: Sources .. .. .. 67
33 (b) Reserve Money and its Components: Uses .. .. .. 68
34 Ratio of Currency Outside Bank to Broad Money Supply .. 69
35 Growth in Money Supply.. .. .. .. .. .. .. 70
36 Distribution of Aggregate Credit to the Economy .. .. 70
37 Distribution of Bank Loans and Advances by Maturity .. .. 74
38 Maturity Structure of Banks Deposits .. .. .. .. .. 74
39 (a) Market Concentration Ratios of Banks (Assets and Deposits) .. 76
39 (b) Measures of Competition in Banks: Herfindahl-Hirschman Index 76
40 Consumer Credit and Ratio of Claims on Core Private Sector .. 77
41 Money Market Assets Outstanding.. .. .. .. .. 78
42 Nigerian Treasury Bills Outstanding .. .. .. .. .. 79
43 Distribution of FGN Bonds.. .. .. .. .. .. .. 80
44 Money Market Rates.. .. .. .. .. .. .. 84
45 Complaints Received and Resolved .. .. .. .. 91

xvi
46 Volume and Value of Transactions at the NSE .. .. .. 94
47 Structure of Gross Federation Revenue.. .. .. .. .. 95
48 Composition of Oil Revenue.. .. .. .. .. .. 96
49 Composition of Non-Oil Revenue.. .. .. .. .. 97
50 Composition of Federally-Collected Revenue (Net) .. .. 97
51 Cumulative Distribution to the tiers of Government and 13%
Derivation Fund .. .. .. .. .. .. .. 99
52 Federal Government (FGN) Fiscal Balance.. .. .. .. 100
53 Composition of Federal Government Retained Revenue.. .. 101
54 Composition of Federal Government Expenditure.. .. .. 102
55 Economic Classification of Federal Government Recurrent
Expenditure.. .. .. .. .. .. .. .. 103
56 Composition of Total Allocation to State Governments .. .. 104
57 Composition of Statutory Allocation to Local Governments .. .. 106
58 Composition of Federal Government Consolidated Debt .. 106
59 Breakdown of External Debt Stock .. .. .. .. 107
60 Breakdown of Extenal Debt Service .. .. .. .. 108
61 GDP Growth Rate.. .. .. .. .. .. .. .. 109
62 Industrial Production Index.. .. .. .. .. .. 114
63 Crude Oil Production and Exports.. .. .. .. .. 118
64 Average Spot Prices of Selected Crudes .. .. .. .. 118
65 Sectoral Disbursement of BOI Loans .. .. .. .. 122
66 Consumer Price Indices.. .. .. .. .. .. .. 123
67 Inflation Rate .. .. .. .. .. .. .. .. 124
68 Urban and Rural Consumer Price Indices.. .. .. .. 126
69 Total Active Lines and Tele-density .. .. .. .. 127
70 Exports, Imports and Trade Balance.. .. .. .. .. 135
71 Visible Import by Sector .. .. .. .. .. .. 135
72 Non-Oil Exports by Products.. .. .. .. .. .. 136
73 Non-Oil Exports to the ECOWAS Sub-Region .. .. .. 137
74 Share of Services Out Payments.. .. .. .. .. .. 139
75 Private Home Remittances.. .. .. .. .. .. 140
76 Foreign Capital Inflows .. .. .. .. .. .. 142
77 Capital Importation by Sector.. .. .. .. .. .. 143
78 Capital Outflows and Outward Transfers .. .. .. .. 144
79 External Reserves Stock and Months of Import Commitments .. 144

xvii
SUMMARY
POLICY FRAMEWORK
In the first half of 2019, the Central Bank of Nigeria reviewed downwards
its Monetary Policy Rate (MPR) to signal the monetary policy direction.
Consequently, the MPR which had been kept at 14.0 per cent since 2016
was reduced by 50 basis points to 13.50 per cent at the MPC meeting of
March 20 & 21, 2019, to further encourage credit flow to the productive
sector and stimulate economic growth. However, the cash reserves ratio
and liquidity ratio were retained at 22.5 and 30.0 per cent, respectively.
Similarly, the asymmetric corridor of +200/-500 basis points around the
MPR for the standing lending and deposit facilities, respectively, were
unchanged. Open Market Operations (OMO) remained the Bank’s major
instrument of liquidity management, complemented by reserve
requirement, standing facilities, discount window operations, as well as,
intervention in the foreign exchange market. The autonomous inflow
through the Investors’ and Exporters’ (I&E) window contributed to stabilise
the domestic currency.
CBN OPERATIONS:
Developmental
Initiatives
The CBN sustained the implementation of its development finance
initiatives, including: the Anchor Borrowers’ Programme (ABP);
Commercial Agriculture Credit Scheme (CACS) and the associated
Paddy Aggregation Scheme (PAS); Micro, Small and Medium Enterprises
Development Fund (MSMEDF); National Food Security Programme (NFSP);
Power and Airline Intervention Fund (PAIF); Textile Sector Intervention Fund
(TSIF); Nigeria Electricity Market Stabilisation Facility (NEMSF); Real Sector
Support Facility (RSSF); Agri-business/ Small and Medium Enterprises
Investment Scheme (AGSMEIS); and Accelerated Agriculture
Development Scheme (AADS).
Liquidity
Management
Excess liquidity continued to pose challenge to monetary policy
implementation in the first half of 2019, due, largely, to increased fiscal
disbursements and inflow from the settlement of matured CBN bills. The
redemption of Nigerian Treasury Bills (NTBs) and FGN Bonds also impacted
significantly on the liquidity condition. Consequently, the Bank intensified
liquidity management pursuant to its mandate of monetary and price
stability conducive for economic growth.

xviii
Payments
&
Clearing System
The Bank intensified effort to improve the credibility, reliability and
efficiency of the Nigerian Payments System. In this regard, the Bank
continued the implementation of BVN Operations and Watch-list; and its
oversight function on payments service providers. It approved the
establishment of the Payment System Security and Risk Management
Centre (PSSRMC), to curb emerging cyber security threats in the payments
space; and the implementation of the revised Nigeria Cheque Standards
(NCS) and Nigeria Cheque Printers Accreditation Scheme (NICPAS).
Financial Sector
Surveillance
The CBN continued its supervision and surveillance of the banking system
in the first half of 2019, to further strengthen the safety, soundness and
stability of the financial system. In this regard, the Bank carried out regular
off-site appraisal of banks’ returns and periodic on-site examination
(special investigations and spot checks) to ensure compliance with the
provisions of extant laws, regulations and guidelines. In the other financial
institutions (OFIs) sub-sector, approval was granted for the constitution of
the governance structure for the configuration of Microfinance Banks
(MFBs) on the National Association of Microfinance Banks Uniform
Information Technology (NAMBUIT) platform that would oversee the
successful delivery of the Project mandate. The Bank continued with
offsite Credit Risk Management System (CRMS) compliance status checks
in line with the requirements of the Regulatory Guidelines for the
Operation of the Redesigned CRMS. It commenced the re-validation of
all eligible bank assets transferred to the Asset Management Corporation
of Nigeria (AMCON) by banks with a view to capturing them on the CRMS
platform and granting the AMCON update rights.
Asset quality of the banking industry, measured by non-performing loans
ratio to total loans (NPL ratio) improved to 9.36 per cent at end-June 2019,
from 12.45 per cent, in June 2018. It, however, remained above the
regulatory threshold of 5.0 per cent. The industry average capital
adequacy ratio (CAR) improved to 15.3 per cent, from 12.8 per cent at
end-June 2018. The regulatory threshold remained at 15.0 per cent for
banks with international authorisation and 10.0 per cent for those with
national and regional authorisation. The industry liquidity ratio increased
to 73.0 per cent at the end of the first half of 2019, from 46.1 per cent at
end-June 2018, reflecting the rise in the stock of liquid assets held by banks.

xix
The regulatory minimum liquidity ratio remained at 30.0, 20.0 and 10.0 per
cent for commercial, merchant and non-interest banks, respectively.
The Bank conducted routine and special examinations of 437 other
financial institutions (OFIs) in the first half of 2019. The examination covered
risk-based supervision (RBS) of five (5) development finance institutions
(DFIs), income audit of nine (9) primary mortgage banks (PMBs) and two
(2) finance companies (FCs), target examination of 345 MFBs and 12
bureaux-de-change (BDCs), RBS and income audit of 12 MFBs, as well as,
AML/CFT examination of 29 MFBs and 23 PMBs, using the Risk-Based
Approach
The Bank received 1,528 complaints against banks and OFIs in the first half
of 2019, compared with 1,439 in the corresponding period of 2018, and
resolved 1,548 cases, including those outstanding from 2018. Compliance
examination conducted on 20 banks revealed high level of compliance
in the areas of facility enhancement, management, restructuring and
commitment fees; deposit held as collateral; and compliance with
previous directives. During the period, the CBN was admitted into the
International Financial Consumer Protection Organisation (FINCONET) to
deepen consumer protection and conduct supervision in Nigeria.
Foreign Exchange
Management
To sustain the stability of the naira exchange rate and engender stable
macroeconomic environment, the Bank continued its interventions in the
foreign exchange market. During the review period, textile and palm oil
were added to the list of items not valid for foreign exchange purchase
at the official window, thereby bringing the total to 44 items. The
exchange rate of the naira to the US dollar remained relatively stable
during the period. At N306.90/US$ and N361.33/US$, average exchange
rate of the naira to the US dollar depreciated by 0.4 and 0.2 per cent, at
the inter-bank segment and Investors’ & Exporters’ window, respectively,
relative to their levels in the corresponding period of 2018. It, however,
appreciated by 0.7 per cent to N359.77/US$ at the BDC segment.

xx
THE FINANCIAL
SECTOR
Broad money supply, M3, grew by 5.0 per cent to N35,018.77 billion at end-
June 2019, compared with 2.4 per cent at end-June 2018. The
development resulted from the growth of 17.3 and 0.4 per cent in net
domestic credit and foreign assets (net) of the banking system,
respectively. At N8,088.46 billion, reserve money rose by 13.4 per cent
above its level at end-December 2018, in contrast to a decrease of 1.9
per cent at the end of the corresponding period of 2018. Quasi money
grew by 9.3 per cent to N16,733.2 billion at end-June 2019, compared with
8.9 per cent at the end of the corresponding period of 2018. Narrow
money (M1) fell by 5.1 per cent to N11,159.1billion at end-June 2019,
compared with 4.3 per cent at the end of the corresponding period of
2018. The development was due, largely, to the respective decline of 13.7
and 3.4 per cent in currency outside banks and demand deposits.
Currency-in-circulation fell by 13.6 per cent to N2,014.1 billion, compared
with 11.9 per cent at end-June 2018.
Net domestic credit (NDC) grew by 17.3 per cent to N32,332.6 billion at
end-June 2019, in contrast to the decline of 3.3 per cent at the end of the
corresponding period of 2018. Net claims on the Federal Government
grew by 55.8 per cent to N7,581.5 billion at the end of the first half of 2019,
in contrast to the decline of 22.9 per cent at the end of the corresponding
half of 2018, due to increased holdings of government treasury bills by the
banking system. Credit to the private sector grew by 9.0 per cent to
N24,751.1 billion at end-June 2019, in contrast to a decrease of 0.04 per
cent at the end of the corresponding period of 2018.
The movement in money market rates reflected the level of liquidity in the
banking system in the first half of 2019. The weighted average monthly
inter-bank call and OBB rates for the first half of 2019, stood at 11.30 per
cent and 13.28 per cent, respectively, compared with 14.64 per cent and
12.46 per cent in the corresponding period 2018. The weighted average
of the Nigeria Inter-Bank Offered Rate (NIBOR) was 13.85 per cent,
compared with 14.24 per cent in the corresponding half of 2018. The
average term deposit rate increased by 0.21 percentage point to 8.77 per
cent, above its level in the corresponding half of 2018. Rates on deposits
of various maturities ranged from 8.56 to 8.77 per cent in the first half of
2019, compared with the range of 8.54 to 9.23 per cent in the first half of
2018. With the year-on-year inflation at 11.22 per cent in June 2019, all

xxi
deposit rates were negative in real terms. The weighted average prime
and maximum lending rates fell by 0.29 and 0.01 percentage points to
16.27 and 30.79 per cent, respectively, below 16.57 per cent and 30.80 per
cent, in the first half of 2018. Consequently, the spread between the
average term deposits and maximum lending rates widened by 0.22
percentage point to 22.2 percentage points.
There was initial slowdown in activities in the capital market due to rising
interest rates in the United States, which posed a major threat to the
retention of portfolio investments in the review period. The market,
however, closed on a mixed note, at the end of the first half of 2019. The
aggregate volume and value of traded securities fell by 23.2 and 32.4 per
cent to 51.50 billion shares and N538.67 billion, respectively, relative to the
levels in the corresponding period of 2018. The aggregate market
capitalisation rose by 7.3 per cent, while All-Share Index (ASI) declined by
21.7 per cent, at end-June 2019. The telecoms giant, the MTN Nigeria, was
listed on the NSE by the Introduction of Premium Board of 20.4 billion
ordinary shares at N90 per share.

xxii
THE
GOVERNMENT
SECTOR
Provisional gross federally-collected revenue in the first half of 2019 stood
at N4,590.87 billion or 7.0 per cent of GDP. This indicated a 38.6 per cent
decline below the proportionate budget, but was 2.1 per cent above the
level in the corresponding period of 2018. The shortfall in revenue relative
to half-year budget, was attributed to low earnings from both oil and non-
oil components.
At N2,030.15 billion or 3.1 per cent of GDP, the provisional Federal
Government retained revenue was lower than the half-year budget by
52.0 per cent, but was 1.2 per cent higther than the level in the
corresponding period of 2018. The development, relative to the
proportionate budget, was attributed to the drop in all its components.
The aggregate expenditure of the Federal Government in the first half of
2019 was N4,531.24 billion or 6.9 per cent of GDP, representing a 12.7 per
cent decline below the proportionate budget, but was above the level in
the corresponding period of 2018 by 17.5 per cent. The development,
relative to the proportionate budget was as a result of the decline in all
the expenditure components.
Recurrent expenditure accounted for 69.6 per cent of total expenditure,
while capital expenditure and statutory transfers constituted 25.3 and 5.1
per cent, respectively. The fiscal operations of the Federal Government,
in the first half of 2019, resulted in an overall deficit of N2,501.10 billion or
3.8 per cent of GDP, against the proportionate budget of N959.24 billion
and compared with N1,850.75 billion in the corresponding period of 2018.
The deficit was financed from domestic source.
The consolidated debt stock of the Federal Government at end-March
2019, stood at N20,974.29 billion or 16.1 per cent of GDP, indicating an
increase of 2.1 per cent above the level at end-December 2018. Of the
total debt stock, domestic debt constituted N13,113.42 billion or 62.5 per
cent, while external debt amounted to N7,860.87 billion (US$25.61 billion)
or 37.5 per cent.
THE REAL
SECTOR
Economic activities in first half of 2019 maintained a modest growth with
sustain improvement in both oil and non-oil sectors. Data from the
National Bureau of Statistics (NBS) indicated that, the gross domestic
product (GDP), at 2010 constant basic prices, grew by 2.02 per cent in the
first half of 2019, relative to 1.69 per cent in the corresponding period of

xxiii
2018. The development was due mainly to the relative stability in the
foreign exchange market, improved business climate, as well as, sustained
investment in infrastructure, and sustained peace deal in the Niger Delta
which ensured improved oil output. The agricultural sector witnessed
improved performance in the first half of 2019 on account of concerted
efforts of the Federal Government, the CBN and other stakeholders to
bring about desired transformation in the sector. The Bank entered into
partnership with eleven (11) palm oil-producing states for disbursement of
loans at not more than 9.0 per cent interest rate to increase productivity
in the sub-sector. The industrial sector recorded marginal growth, due,
mainly, to improved business environment through: implementation of the
4th National Action Plan on Ease of Doing Business; agreement to increase
made-in-Nigeria goods for export; improved electricity access in the rural
areas through the Off-Grid Expansion Programme of the Rural
Electrification Agency; and activities under the Cotton, Garment and
Textile Revival initiative of the Bank.
The Niger Delta Area remained relatively calm but crude oil output
witnessed a marginal decline, due to ageing infrastructure. Consequently,
average daily crude oil production fell by 0.05 mbd or 2.6 per cent to 1.85
million barrels per day (mbd) or 334.9 million barrels (mb), below the level
in the corresponding half of 2018. At end-June 2019, the average spot
price of Nigeria’s reference crude, the Bonny Light declined by 5.7 per
cent to US$67.90 per barrel, compared with US$71.99 in the corresponding
period of 2018. The fall in oil price was attributed to growing concerns
about global economic growth, weak oil demand outlook, amid trade
tension between the United States (US) and China and rising US crude oil
inventories.
Inflation declined for most parts of the period except for April and May
2019. The decline was attributed to moderation in both food and non-
food prices. The all-items composite Consumer Price Index (CPI) was 289.7
(November 2009=100) at end-June 2019, compared with 274.6 and 260.5
at end-December 2018 and end-June 2018, respectively. Headline
inflation, on year-on-year and 12-month moving average bases stood at
11.22 and 11.30 per cent, respectively, at end-June 2019, compared with
11.23 per cent and 14.37 per cent at end-June 2018.
xxiv
THE
EXTERNAL
SECTOR
The external sector performance remained favourable in the first half of
2019, with an overall balance of payments surplus of 2.0 per cent of gross
domestic product (GDP). The current account, however, recorded a
deficit of ₦1,324.44 billion, as against a surplus of ₦2,826.55 billion in the first
half of 2018. The capital and financial account recorded a net financial
asset of ₦2,246.70 billion (6.7% of GDP), in contrast to a net financial liability
of N824.80 billion (1.4% of GDP) in the first half of 2018. The stock of external
reserves at end-June 2019, grew by 5.1 per cent to US$44.75 billion,
compared with US$42.59 billion at end-December 2018 and could finance
10.9 months of imports (goods only) or 6.2 months (goods and services).

xxv
OUTLOOK
FOR THE REST
OF 2019
Global growth was projected to slow to 3.2 per cent in 2019, from 3.6 per
cent in 2018 (WEO, July 2019). The advanced economies were projected
to grow by 1.9 per cent in 2019, compared with 2.2 per cent in 2018,
mostly, reflecting an upward revision for the United States. Inflationary
pressures are expected to moderate, reflecting weak global activity, and
in some cases mounting disinflationary pressures, increased debt service
burden and constrained monetary policy space. The gloomy outlook for
2019 was on account of the escalating trade tensions between the United
States and China, and Brexit-related uncertainty, which significantly
weakened consumer and business confidence, as well as, global trade.
In the emerging market and developing economies, growth was
projected to weaken to 4.1 per cent in 2019, from 4.5 per cent in 2018, on
account of the negative effects of escalating tariffs, weakening external
demand and other idiosyncratic developments in the region.
In sub-Saharan Africa, growth was projected at 3.4 per cent in 2019, from
3.1 per cent in 2018, reflecting high oil prices. The optimistic outlook for the
region reflected improved prospects for the Nigerian economy, projected
to grow from 1.9 per cent in 2018 to 2.3 per cent in 2019. The South African
economy was also expected to grow by 0.7 per cent in 2019, from 0.8 per
cent in 2018.
The outlook for Nigeria’s economy for the second half of 2019 is cautiously
optimistic in the face of structural imbalances. Output in the near-term is
expected to expand moderately, premised on continued growth in the
oil and non-oil sectors, sustained stability in the exchange rate and the
continued interventions in critical sectors of the economy.
Activities in the real sector are expected to be supported by government
spending on infrastructure and CBN interventions in growth-stimulating
sub-sectors. Specifically, the renewed focus of the CBN in improving credit
delivery to the agricultural and manufacturing sub-sectors would
moderate unemployment and give impetus to the growth trajectory. Also,
the targeted FGN initiatives in the power and transport sub-sectors are
expected to improve the macroeconomic environment, boost business
and consumer confidence, expand production, generate employment
and reduce poverty. However, the general insecurity, especially in major
food-producing areas, and less-than-expected yields from the

xxvi
forthcoming harvest could lead to a build-up in inflationary pressure and
weaken recovery.
The performance of the external sector for the rest of the year is expected
to remain strong, due to continued improvement in crude oil prices and
domestic oil production, improvement in net exports, modest accretion to
reserves, and stable exchange rate. The outlook in the near-term, would
be reinforced by the CBN’s initiatives towards the diversification of the
export base.
In the fiscal sector, there is mild prospect for increased government
revenue, as crude oil price is expected to average US$64.00 per barrel,
which is above the budget benchmark of US$60.00 per barrel.
Furthermore, efforts at diversification of the economy and the expansion
of the tax base, through the recent tax reform are expected to further
boost government revenue. However, rising debt service obligation
remains a threat to fiscal operations.
The financial sector is expected to remain resilient in the second half of
2019, on account of the CBN’s commitment towards ensuring financial
system stability, deeper financial inclusion through credit delivery, as well
as, intensified financial literacy and consumer protection programmes.
The renewed policies aimed at enhancing the payments system and the
cash-less initiative are expected to further improve credibility, reliability
and efficiency in the Nigerian payments system.

xxvii
Indicator Jun-15 Jun-16 Jun-17 Jun-18 Jun-19 2/
Domestic Output and Prices
GDP at Current Mkt Prices (₦ billion) 44,323.45 46,172.76 53,495.25 59,638.24 67,329.35
GDP at Current Mkt Prices (US$ billion) 234.06 227.68 174.99 195.03 219.39
Nominal GDP per Capita (₦) 483,036.77 489,481.20 551,639.56 598,235.16 655,969.22
Nominal GDP per Capita (US$) 2,550.79 2,413.69 1,804.49 1,956.38 2,137.41
Real GDP per Capita (₦) 357,746.92 343,862.19 334,076.63 330,559.55 327,521.71
Real GDP per Capita (US$) 1,889.17 1,695.63 1,092.81 1,081.01 1,067.20
Real GDP Growth (%) 3/ 3.14 -1.08 -0.09 1.69 2.02
Oil Sector -7.49 -8.15 -6.58 4.63 1.71
Non-oil Sector 4.50 -0.29 0.58 1.41 2.05
Sectoral Classification GDP Growth (%) 3/
Agriculture 4.07 3.84 3.19 2.05 2.45
Industry -4.88 -6.93 -2.72 3.31 1.01
Construction 8.67 -5.83 0.14 3.18 1.83
Trade 5.77 0.99 -2.36 -2.36 0.30
Services 5.56 -1.04 0.41 2.40 3.04
Oil Production (mbd) 1.89 1.68 1.63 1.90 1.85
Manufacturing Capacity Utilisation (%) *** *** *** 53.09
Inflation Rate (%) (Year-over-Year) 9.17 16.48 16.10 11.23 11.22
Inflation Rate (%) (12-month moving average) 8.42 11.37 17.58 14.37 11.30
Core Inflation Rate (%) (Year-over-Year) 4/ 8.40 16.22 12.46 10.39 8.84
Core Inflation Rate (%) (12-month moving average) 4/ 7.01 10.86 16.22 11.65 9.64
Food Inflation Rate (%) (Year-over-Year) 10.04 15.30 19.91 12.98 13.56
Food Inflation Rate (%) (12-month moving average) 9.53 11.67 17.87 17.75 13.42
Federal Government Finance (% of GDP) 5/
Retained Revenue 3.57 2.83 4.39 3.36 3.02
Total Expenditure 5.10 5.45 6.15 6.47 6.73
Recurrent Expenditure 4.23 4.08 4.53 4.55 4.68
Of which: Interest Payments 1.34 1.32 1.73 1.80 1.65
Foreign 0.08 0.07 0.10 0.19 0.30
Domestic 1.26 1.25 1.63 1.61 1.35
Capital Expenditure and Net Lending 0.62 0.75 1.01 1.53 1.71
Transfers 0.26 0.21 0.32 0.22 0.41
Current Balance (Deficit(-)/Surplus(+)) -0.65 -1.26 -0.14 -1.19 -1.67
Primary Balance (Deficit(-)/Surplus(+)) -0.19 -1.30 -0.02 -1.30 -2.07
Overall Fiscal Balance (Deficit(-)/Surplus(+)) -1.53 -2.62 -1.76 -3.10 -3.71
Financing 1.53 2.62 1.76 3.10 3.71
Foreign 0.00 0.00 0.00 0.00 0.00
Domestic 1.53 2.62 1.76 3.10 3.71
Banking System 0.00 0.00 0.00 0.00 0.00
Non-Bank Public 0.74 1.14 0.00 0.69 0.61
Others 0.78 1.49 1.76 2.42 3.11
Consolidated Government Debt Stock 6/ 11.76 14.94 15.55 15.85
External 2.29 3.45 4.30 5.66
Domestic 9.47 11.49 11.25 10.19 12.47
Selected Macroeconomic and Social Indicators 1/

xxviii
Indicator Jun-15 Jun-16 Jun-17 Jun-18 Jun-19 2/
Money and Credit (Growth Rate %)
Reserve Money 0.25 -7.58 -6.29 -1.91 13.35
Narrow Money (M1) -4.87 11.05 -9.59 -4.25 -5.03
Broad Money (M2) -0.39 10.23 -6.83 2.79 3.07
Broad Money (M3) 2.16 10.57 -0.64 2.35 4.63
Net Foreign Assets -14.42 25.69 -7.45 18.15 0.40
Net Domestic Assets 10.03 5.24 2.58 -16.29 9.83
Net Domestic Credit 11.08 13.93 1.41 -3.25 17.29
Net Credit to Government 118.79 9.66 7.69 -22.92 55.84
Credit to Private Sector 4.26 14.59 0.02 -0.04 9.03
Money Multiplier for M3 3.65 4.47 5.17 4.61 4.32
Income Velocity of M3 4.09 3.85 3.78 4.06 3.86
Interest Rates (% per annum)
Monetary Policy Rate (MPR) (end period) 7/ 13.00 12.00 14.00 14.00 13.50
Repurchase Rate (Average)
Reverse Repurchase Rate (Average)
Treasury Bill Rate (Average)
91-day 9.95 8.32 13.50 10.00 10.17
Inter-bank Call Rate (end-period) 10.85 35.26 13.46 5.00 5.00
Deposit Rates (end-period)
Savings Rate 3.60 3.61 4.08 4.07 3.93
3-months Fixed 10.27 6.92 9.01 9.38 9.10
6-months Fixed 10.81 6.59 10.68 10.15 10.84
12-months Fixed 10.83 5.17 11.15 10.05 10.57
Prime Lending Rate (end period) 17.24 16.78 17.59 16.78 15.80
Maximum Lending Rate (end period) 26.84 26.93 30.94 31.17 31.04
External Sector
Current Account Balance (% of GDP) 5/ -3.44 -0.29 2.72 2.96 -2.58
Goods Account -1.18 -1.19 2.43 6.03 1.48
Services Account (net) -3.64 -1.65 -2.45 -5.46 -7.38
Income Account (net) -3.11 -1.81 -3.16 -3.68 -2.81
Current Transfers 4.49 4.36 5.90 6.07 6.13
Capital and Financial Account Balance (% of GDP) 5/ 1.25 0.12 1.87 -0.71 -3.64
Overall Balance (% of GDP) 5/ -2.60 -0.68 1.87 4.01 0.98
External Reserves (US$ million) 28,335.21 26,505.50 30,340.96 47,157.90 44,747.02
Number of Months of Import Equivalent 6.11 8.14 11.02 15.33 9.58
Debt Service Due (% of Exports of Goods and Services)
Average Crude Oil Price (US$/barrel) 58.54 40.51 52.19 71.99 67.90
Average Official Rate (₦/US$) 189.37 202.79 305.70 305.79 306.90
End of Period Official Rate (₦/US$) 196.95 283.00 305.90 305.75 306.90
Average Bureau de Change Exchange Rate (₦/US$) 213.55 325.00 426.85 362.25 359.77
End of Period Bureau de Change Exchange Rate (₦/US$) 225.50 348.00 366.00 360.50 360.00
Capital Market
All Share Value Index (1984=100) 33,456.83 29,597.79 33,117.48 38,278.55 29,966.87
Value of Stocks Traded (₦ billion) 557.13 313.25 376.77 798.63 539.74
Market Capitalization (₦ Trillion) 11.42 9.79 11.45 13.87 13.21
Social Indicators
Population (million) 183.52 188.66 193.95 199.38 205.28
Population Growth Rate (%) 2.80 2.80 2.80 2.80 2.80
Life Expectancy at Birth (Years) *** *** *** *** ***
Adult Literacy Rate (%) *** *** *** *** ***
Incidence of Poverty *** *** *** *** ***
1/ Revised
2/ Provisional
3/ Based on GDP measured at basic prices.
4/ Core Inflat ion is measured as the rate of change of all-
item Consumer Price Index (CPI) less farm produce.
5/ Computat ions are based on GDP at Current Market Prices.
6/ Includes State Government Debts
7/ MPR replaced MRR with effect from December 11, 2006.
Sources: Central Bank of Nigeria (CBN), Federal Ministry of Finance (FMF), National Bureau of Statistics (NBS), National Population Commission (NPOPC)
Nigeria National Petroleum Corporation (NNPC), Nigerian Stock Exchange (NSE)
Selected Macroeconomic and Social Indicators 1/ . . . Continued
1
CENTRAL BANK OF NIGERIA
REPORT FOR THE FIRST HALF OF 2018
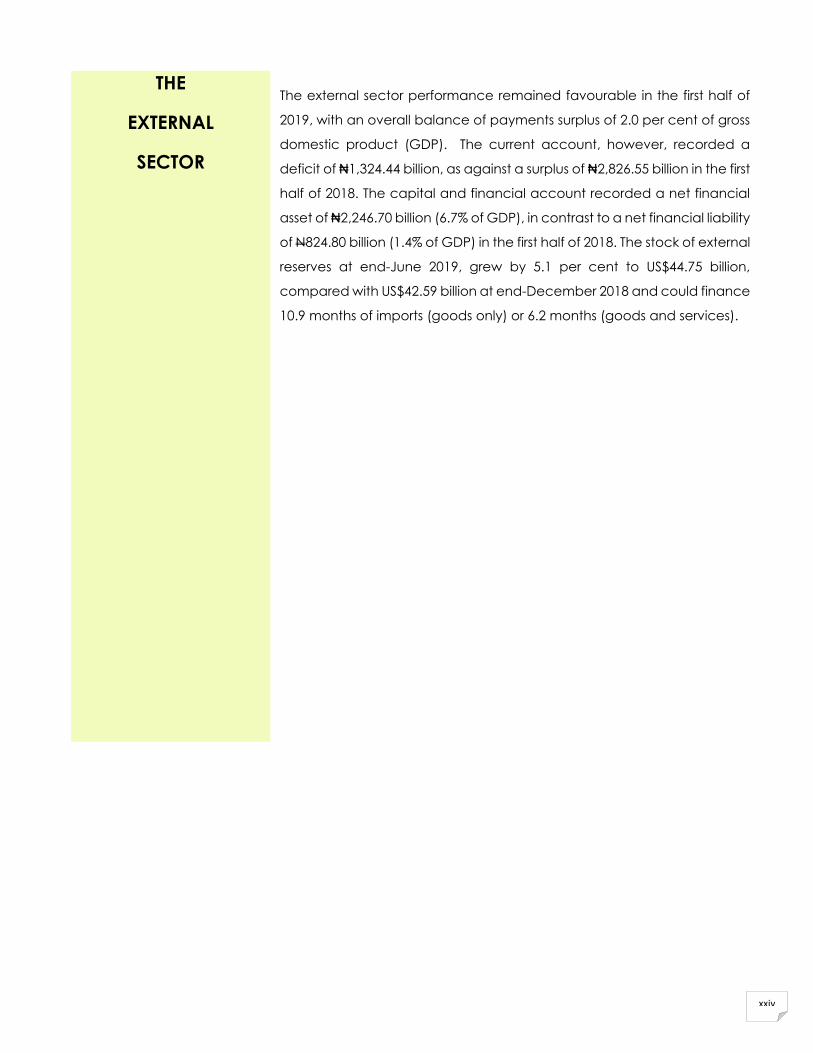
1.0 INTRODUCTION
The domestic economy witnessed a modest growth in the first half of 2019,
driven, largely, by enhanced crude oil receipts, external reserves accretion,
moderation in inflation and relative stability in the exchange rate. The
economy was, however, impacted by slow growth in global output, arising
from the escalating US–China trade dispute, uncertainties surrounding the
Brexit and geopolitical tensions in the Middle East. The Bank relaxed its
monetary policy stance but sustained secondary market intervention sales in
the foreign exchange market, and also retained the Investors’ and Exporters’
(I&E) window to boost foreign exchange supply from autonomous sources so
as to stabilise the domestic currency. The framework for monetary policy
remained monetary targeting, with the monetary policy rate (MPR) as the
anchor for signaling the direction of short-term money market rates. Open
Market Operations (OMO) remained the major instrument for liquidity
management, complemented by cash reserve ratio (CRR), standing facilities
window and intervention in the foreign exchange market.
Table 1
Monetary Policy Benchmarks and Outcomes
(Growth in % except otherwise stated) Key Variables Dec 2016 Jun 2017 Dec 2017 Jun 2018 Dec 2018 Jun 2019
Be
nc
hm
ark
Ou
tco
me
Be
nc
hm
ark
Ou
tco
me
Be
nc
hm
ark
Ou
tco
me
Be
nc
hm
ark
Ou
tco
me
Be
nc
hm
ark
Ou
tco
me
Be
nc
hm
ark
Ou
tco
me
Broad Money (M3) 31.23 -0.64 0.59 2.35 16.36 4.97
Broad Money (M2) 11.0 17.78 10.3 -6.83 10.3 2.33 10.48 2.79 12.13 3.04
Narrow Money (M1) 11.3 31.5 11.0 -9.59 11.07 -0.85 8.04 -4.25 5.16 -5.05
Base Money (Reserve) 13.2 0.61 11.4 -6.29 11.4 10.88 9.69 -1.91 10.05 13.35
Net Domestic credit (NDC) 17.9 24.27 17.9 1.41 17.93 -3.45 12.45 -1.43 6.34 17.26
Credit to Government (Net) 47.43 68.58 33.1 7.69 32.9 -25.32 54.25 -9.74 33.72 55.80
Credit to the private sector 13.4 17.42 14.9 0.02 14.9 1.4 5.75 -0.07 1.87 9.00
Inflation rate 11.9 18.6 10.7 16.1 10.7 15.37 13.00 11.23
Real GDP 3.6 -1.3 4.1 0.55 4.09 2.11 2.50 1.5
Source: CBN

2
2.0 OPERATIONS OF THE CENTRAL BANK OF NIGERIA
2.1 Liquidity Management
In the first half of 2019, the domestic economy continued to face liquidity
challenges in the banking system due, primarily, to increased fiscal
disbursements. The inflow from maturing CBN bills and the redemption of
Nigerian Treasury Bills (NTBs) and the FGN Bonds also exacerbated the liquidity
condition. Consequently, the Bank intensified liquidity management pursuant
to its mandate of monetary and price stability conducive for economic
growth. The Bank, generally, adopted policy measures to promote financial
market efficiency, boost foreign capital inflow and stabilise the domestic
currency. Open Market Operations (OMO) remained the major instrument of
liquidity management, complemented by reserve requirements, standing
facilities and discount window operations.
The MPR was reduced to 13.50 per cent at the March 2019 Monetary Policy
Committee (MPC) meeting but the asymmetric corridor of +200/-500 basis
points for the standing lending facility (SLF) and the standing deposit facility
(SDF), respectively, was retained. The Cash Reserve Ratio (CRR) and Liquidity
Ratio (LR) were also retained at 22.5 and 30.0 per cent, respectively, during
the review period. Consequently, reserve money stood at N8,088.46 billion at
end-June 2019, reflecting an increase of 27.2 and 13.4 per cent above its
levels in the corresponding and preceding periods of 2018, respectively. The
Bank also sustained its intervention in the foreign exchange market, and
retained the I&E window to encourage autonomous inflow of foreign
exchange and stabilise the domestic currency.
2.2 Monetary Policy Committee (MPC) Decisions
In the first half of 2019, the Monetary Policy Committee (MPC) held three (3)
regular meetings. A summary of key decisions of the Committee was as follows:

3
Table 2
Monetary Policy Committee Decisions during the First Half of 2019
Date of Meeting Type of
Meeting Decision
January 21 and 22,
2019
Regular
• Retained the MPR at 14.0 per
cent;
• Retained the CRR at 22.5 per
cent;
• Retained the LR at 30.0 per cent;
and
• Retained the asymmetric
corridor at +200/– 500 basis
points around the MPR.
March 20 and 21, 2019
Regular
• Reduced the MPR by 50 basis
points from 14.00 to 13.50 per
cent;
• Retained the CRR at 22.5 per
cent;
• Retained the LR at 30.0 per cent;
and
• Retained the asymmetric
corridor at +200/– 500 basis
points around the MPR.
May 20 and 21, 2019
Regular
• Retained the MPR at 13.50 per
cent;
• Retained the CRR at 22.5 per
cent;
• Retained the LR at 30.0 per cent;
and
• Retained the asymmetric
corridor at +200/– 500 basis
points around the MPR. Source: Central Bank of Nigeria MPC Communiqués
2.3 Developments in the Payments System
In the review period, the Bank continued to improve on the safety and
efficiency of the Nigerian Payments System.
2.3.1 Payments System Initiatives
2.3.1.1 Framework for Bank Verification Number (BVN) Operations and
Watch-list
At end-June 2019, the number of BVN increased by 13.6 per cent to 38.3
million, compared with 33.7 million, recorded in the corresponding period of
2018. Active customer accounts stood at 72.9 million, out of which 51.4 million

4
accounts, representing 70.5 per cent, had been linked with BVN, and 1,463
were listed in the BVN watch-list.
2.3.1.2 Nigeria Electronic Fraud Forum (NeFF)
The 2018 Annual Report of the NeFF (a multi-industry anti-electronic fraud
initiative) with the theme “Emerging Fraud Threats: An Evaluation of the
Industry Cybersecurity Posture” was released in the review period. The Report
analysed the industry posture towards cyber security issues and proffered
responses to associated threats.
In a bid to keep in check rising incidences of SIM Swap fraud, outcome of
consultations had proposed that Mobile Network Operators be allowed to
submit SIM swap/churn status on real time basis and that banks be allowed to
query the database and take further precautions in the event of a suspicious
SIM Swap.
In the review period, the CBN approved the commencement of the
implementation of recommendations for the establishment of the Payments
System Security and Risk Management Centre (PSSRMC). When
operationalised, the Centre would curb emerging cyber security threats in the
country’s payments space.
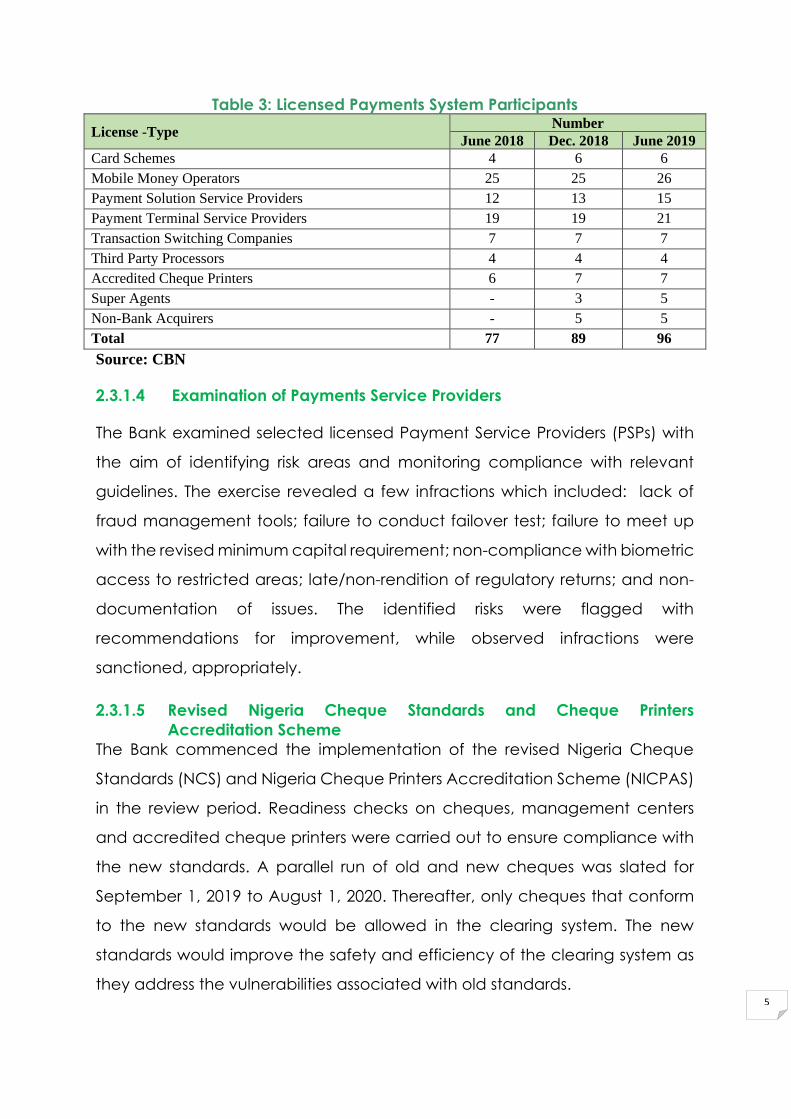
2.3.1.3 Licensing of Payments System Participants
The CBN sustained its oversight on payments service providers. In the review
period, seven (7) licences were issued. Of these, one (1) was issued to a mobile
money operator, while two (2) each were issued to payments solution service
providers, payment terminal service providers, and super agents. At the end
of the review period, 96 payments system participants had valid licences to
operate in the different segments of the payments system, compared with 77
participants in the corresponding period of 2018.
5
Table 3: Licensed Payments System Participants
License -Type Number
June 2018 Dec. 2018 June 2019
Card Schemes 4 6 6
Mobile Money Operators 25 25 26
Payment Solution Service Providers 12 13 15
Payment Terminal Service Providers 19 19 21
Transaction Switching Companies 7 7 7
Third Party Processors 4 4 4
Accredited Cheque Printers 6 7 7
Super Agents - 3 5
Non-Bank Acquirers - 5 5
Total 77 89 96
Source: CBN
2.3.1.4 Examination of Payments Service Providers
The Bank examined selected licensed Payment Service Providers (PSPs) with
the aim of identifying risk areas and monitoring compliance with relevant
guidelines. The exercise revealed a few infractions which included: lack of
fraud management tools; failure to conduct failover test; failure to meet up
with the revised minimum capital requirement; non-compliance with biometric
access to restricted areas; late/non-rendition of regulatory returns; and non-
documentation of issues. The identified risks were flagged with
recommendations for improvement, while observed infractions were
sanctioned, appropriately.
2.3.1.5 Revised Nigeria Cheque Standards and Cheque Printers
Accreditation Scheme
The Bank commenced the implementation of the revised Nigeria Cheque
Standards (NCS) and Nigeria Cheque Printers Accreditation Scheme (NICPAS)
in the review period. Readiness checks on cheques, management centers
and accredited cheque printers were carried out to ensure compliance with
the new standards. A parallel run of old and new cheques was slated for
September 1, 2019 to August 1, 2020. Thereafter, only cheques that conform
to the new standards would be allowed in the clearing system. The new
standards would improve the safety and efficiency of the clearing system as
they address the vulnerabilities associated with old standards.
6
2.3.1.6 Payments System Vision 2020 (PSV 2020)
In continuation of the implementation of the PSV 2020 and preparation for the
development of the PSV2030, views and insights were sought from a wide
group of stakeholders and experts. The feedback was used to articulate the
PSV2030 Framework, which recognises the swiftly evolving user requirements,
technical solutions, regulatory environments and external threats that typify
the industry. In addition, through the Payments Scheme Boards, Special
Interest Working Groups and Initiative Working Groups, the CBN:
• Was working towards the implementation of the proposed risk-based
collateral management model that addresses liquidity and credit risks
associated with the Deferred Net Settlement System;
• Was developing the draft of the “Regulation for the Operation of
Indirect Participants in the Payments System”;
• Developed the draft of the “Revised Standards on Nigeria Uniform Bank
Account Number (NUBAN) for Banks and Other Financial Institutions”;
• Developed the draft of the “Regulation on End-to-End Electronic
Payments of Salaries, Pensions and other Remittances, Suppliers and
Revenue Collections in Nigeria”; and
• Developed the draft of “Nigerian Payments System Risk and Information
Security Management Framework”, to set out standards regarding the
management of risks in the payments system.
2.3.2 Retail Payments
2.3.2.1 Electronic Payments
The volume and value of electronic payments increased to 1,233.04 million
and N76,478.35 billion at end-June 2019, compared with 953.0 million and N62,
816.27 billion at end-June 2018, respectively, representing an increase of 29.4

7
and 21.8 per cent. The rise in both volume and value of transactions reflected
higher adoption of this mode of payment by economic agents.
Table 4
Volume and Value of Electronic Payments
Payment
Channel
Number of
Terminals Number of Transactions
%
Change
(Volume)
Value N’ Billion %
Change
(Value) Jun Jun Jun-18
(Million)
Dec-18
(Million)
Jun-19
(Million) Jun-18 Dec-18 Jun-19
2018 2019
ATMs 18,052 18,913 429.8
445.7
424.6 -1.21 3,172.12
3,307.97
3,238.43
2.09
POS 118,707 166,078 120.8 175.1
187.7
55.38 1,018.36
1,364.75
1,383.62
35.87
Mobile 27.6 51.1
25.7
-6.88 594.91
1,091.02
564.92
-5.04
Internet
(Web)
17.7
31.3
47.9 170.62 109.54
290.60
223.90
104.40
NIP 308.4 354.7
504.2
63.49 36,892.99
43,530.03
49,350.18
33.77
e-Bills
Pay 0.5
0.5
0.6
20.00 256.65
243.56
281.56
9.71
REMITA 20.3 24.2
21.6
6.40 9,319.06
9,176.93
9,839.29
5.58
NAPS 8.9 18.5
20.6
131.46 4,003.67
8,075.24
11,596.45
189.65
Total 953.0 1,050.2 1,232.9 62,816.27 67,080.10
76,478.35
Source: CBN
2.3.2.2 Cheque
The volume and value of cheques decreased to 3.4 million and N2,270.92
billion, respectively, in the first half of 2019, from 4.7 million and N2,600.43 billion
in the corresponding period of 2018, reflecting declines of 27.7 and 12.7 per
cent. The decrease was attributed to growing customers’ preference for
electronic payment channels.

8
Figure 1
Volume of Cheques Cleared
(Million)
Source: CBN
Figure 2
Value of Cheques Cleared
(N’ Billion)
Source: CBN
2.3.2.3 Electronic Transactions
During the review period, the volume and value of electronic transactions,
comprising ATM, PoS, Mobile payments and Internet, increased to 685.9 million
and N5,410.87 billion in the first half of 2019, compared with 596.0 million and
N4,894.90 billion in the corresponding period of 2018, representing, an increase
of 15.1 and 10.5 per cent, respectively. The increase in both volume and value
reflected greater usage of electronic-based transactions.
A breakdown of the volume and value of e-payment channels for the review
period indicated that ATM remained the most patronised, accounting for 61.9
per cent, followed by PoS and web (internet), with 27.4 and 7.0 per cent,
respectively. Mobile payment was the least patronised, accounting for 3.7 per
cent of the total. In terms of value, ATM accounted for 59.9 per cent; PoS, 25.6
per cent; mobile payment, 10.4 per cent; and the web (Internet), 4.1 per cent.
Figure 3
Classification of Electronic Payment by Volume, First Half 2019
4.7 4.3
3.4
-
1.0
2.0
3.0
4.0
5.0
First Half 2018 Second Half 2018 First Half 2019
Mill
ion
2,600.4 2,439.4 2,270.9
- 500.0
1,000.0 1,500.0 2,000.0 2,500.0 3,000.0 3,500.0
First Half 2018 Second Half 2018 First Half 2019
N'B
illio
n

9
(Per cent)
Source: CBN
Figure 4
Classification of Electronic Payment by Value, First Half 2019
(Per cent)
Source: CBN
Figure 5
Volume of Electronic Payments
(Million)
Source: CBN
Figure 6
Value of Electronic Payments
ATM
61.9%
PoS
27.4%
Internet
7.0%
Mobile
3.7%
ATM
59.9%
PoS
25.6%
Mobile
10.4%
Internet
4.1%
596.0
703.2
685.9
550.0
600.0
650.0
700.0
First Half 2018 Second Half 2018 First Half 2019
Mill
ion

10
(N’Billion)
Source: CBN
2.3.2.3.1 ATM Transactions
The number of ATM units at end-June 2019 stood at 18,913, compared
with18,052 in the corresponding period of 2018. The volume of transactions
decreased by 1.2 per cent to 424.6 million, compared with 429.8 million in the
corresponding period of 2018. The value of transactions, increased by 2.1 per
cent to N3,238.43 billion, compared with N3,172.12 billion in the corresponding
period.
Figure 7
Volume of ATM Transactions
(Million)
Source: CBN
4,894.9
6,054.3 5,410.9
-
1,000.0
2,000.0
3,000.0
4,000.0
5,000.0
6,000.0
7,000.0
First Half 2018 Second Half 2018 First Half 2019
N' B
illio
n
429.8
445.7
424.6
410.0
415.0
420.0
425.0
430.0
435.0
440.0
445.0
450.0
First Half 2018 Second Half 2018 First Half 2019
Mill
ion
11
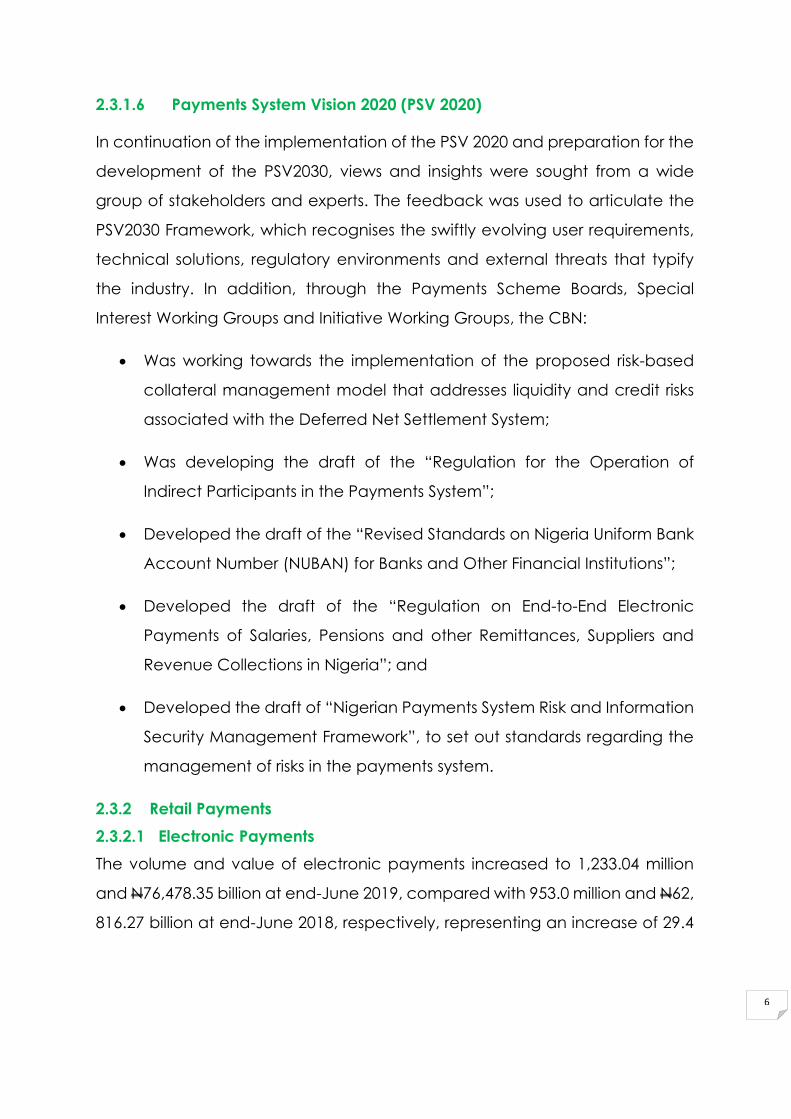
Figure 8
Value of ATM Transactions
(N’ Billion)
Source: CBN
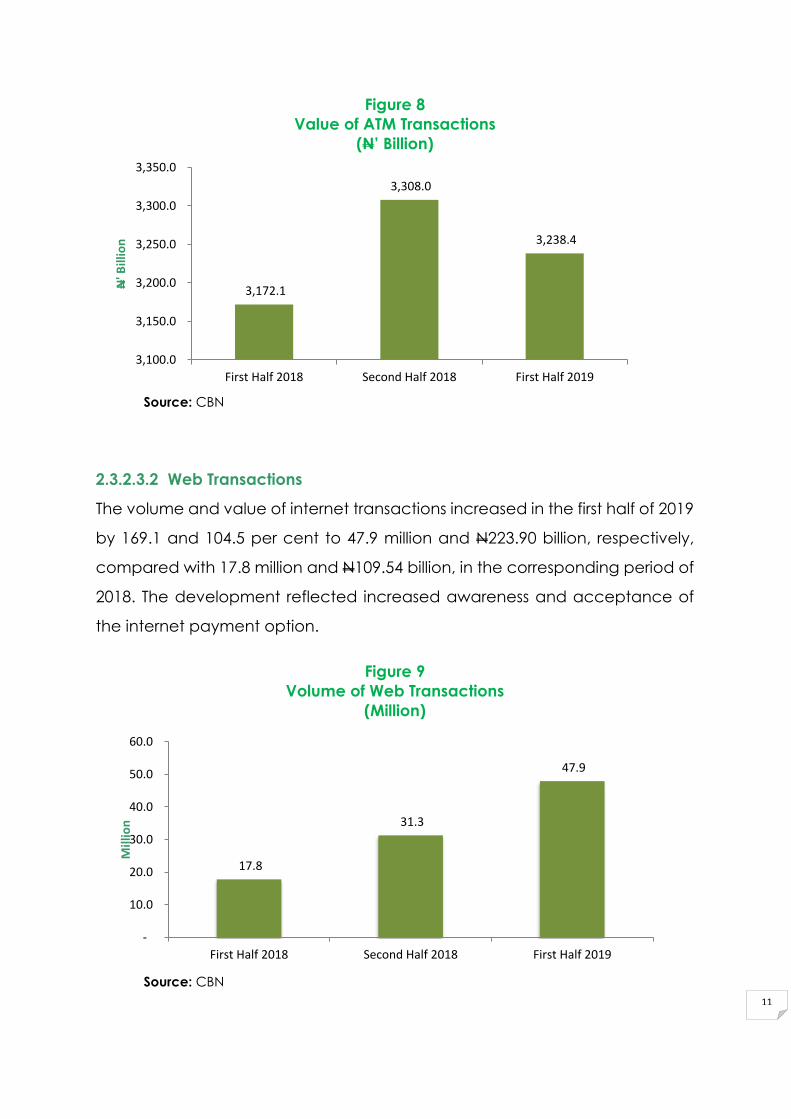
2.3.2.3.2 Web Transactions
The volume and value of internet transactions increased in the first half of 2019
by 169.1 and 104.5 per cent to 47.9 million and N223.90 billion, respectively,
compared with 17.8 million and N109.54 billion, in the corresponding period of
2018. The development reflected increased awareness and acceptance of
the internet payment option.
Figure 9
Volume of Web Transactions
(Million)
Source: CBN
3,172.1
3,308.0
3,238.4
3,100.0
3,150.0
3,200.0
3,250.0
3,300.0
3,350.0
First Half 2018 Second Half 2018 First Half 2019
N' B
illio
n
17.8
31.3
47.9
-
10.0
20.0
30.0
40.0
50.0
60.0
First Half 2018 Second Half 2018 First Half 2019
Mill
ion

12
Figure 10
Value of Web Transactions
(N’Billion)
Source: CBN
2.3.2.3.3 Point of Sale (PoS) Transactions
The number of PoS terminals deployed at end-June 2019 was 166,078,
compared with 118,707 in the corresponding period of 2018. The volume and
value of transactions rose by 55.4 and 35.9 per cent to 187.7 million and
N1,383.62 billion, respectively, in the first half of 2019, compared with 120.8
million and N1,018.36 billion in the corresponding period of 2018, on account
of sustained increase in public confidence in the channel.
Figure 11
Volume of PoS Transactions
(Million)
Source: CBN
109.5
290.6
223.9
-
50.0
100.0
150.0
200.0
250.0
300.0
350.0
First Half 2018 Second Half 2018 First Half 2019
N'B
illio
n
120.8
175.1
187.7
-
50.0
100.0
150.0
200.0
250.0
300.0
350.0
First Half 2018 Second Half 2018 First Half 2019
Mill
ion

13
Figure 12
Value of PoS Transactions
(N’Billion)
Source: CBN
2.3.2.3.4 Mobile Payments
The volume and value of mobile payments decreased by 6.9 and 5.0 per cent
to 25.7 million and N564.9 billion, respectively, in the first half of 2019, compared
with 27.6 million and N594.91 billion in the corresponding period of 2018. The
decline in the use of mobile payments option was due to consumers’
preference for alternative channels.
Figure 13
Volume of Mobile Transactions
(Million)
Source: CBN
1,018.4
1,364.8 1,383.6
-
200.0
400.0
600.0
800.0
1,000.0
1,200.0
1,400.0
1,600.0
First Half 2018 Second Half 2018 First Half 2019
N'B
illio
n
27.6
51.10
25.7
-
10.0
20.0
30.0
40.0
50.0
60.0
First Half 2018 Second Half 2018 First Half 2019
Mill
ion

14
Figure 14
Value of Mobile Transactions
(N’Billion)
Source: CBN
2.3.3 Wholesale Payments System
2.3.3.1 Real Time Gross Settlement (RTGS) System
The volume and value of inter-bank fund transfers through the RTGS System
increased to 550,243 and N226,275.85 billion, respectively, in the first half of
2019, compared with 530,121 and N179,748.00 billion in the corresponding
period of 2018. These represented increase of 3.8 and 25.9 per cent in volume
and value, respectively.
Figure 15
Volume of RTGS Transactions
(Million)
Source: CBN
594.9
1,091.0
564.9
-
200.0
400.0
600.0
800.0
1,000.0
1,200.0
First Half 2018 Second Half 2018 First Half 2019
N'B
illio
n
530,121.0
559,317.0
550,243.0
510,000.0
520,000.0
530,000.0
540,000.0
550,000.0
560,000.0
570,000.0
First Half 2018 Second Half 2018 First Half 2019
Mill
ion

15
Figure 16
Value of RTGS Transactions
(N’ Billion)
Source: CBN
2.3.3.2 Nigeria Inter-bank Settlement System Instant Payment (NIP)
The volume and value of the NIBSS Instant Payment transactions increased to
504.2 million and N49,350.18 billion, respectively, in the first half 2019, from 308.4
million and N36,892.99 billion, in the corresponding period of 2018. This
indicated respective increase of 63.5 and 33.8 per cent, attributed to users’
preference for instant value.
Figure 17
Volume of NIP Transactions
(Million)
Source: CBN
179,748.0
204,212.0
226,275.9
-
50,000.0
100,000.0
150,000.0
200,000.0
250,000.0
First Half 2018 Second Half 2018 First Half 2019
N'B
illio
n
308.4 354.7
504.2
-
100.0
200.0
300.0
400.0
500.0
600.0
First Half 2018 Second Half 2018 First Half 2019
Mill
ion

16
Figure 18
Value of NIP Transactions
(N’Billion)
Source: CBN
2.3.3.3 NIBSS Automated Payment Services (NAPS)
During the review period, the volume and value of the NIBSS Automated
Payment Services (NAPS) increased by 131.5 and 189.7 per cent, respectively,
to 20.6 million and N11,596.45 billion, compared with 8.9 million and N4,003.67
billion, in the first half of 2018. The significant increase in both volume and value
was attributed to the inclusion of NEFT and PMS in the data for NAPS with effect
from October, 2018.
Figure 19
Volume of NAPS Transactions
(Million)
Source: CBN
36,893.0
43,530.0
49,350.2
-
10,000.0
20,000.0
30,000.0
40,000.0
50,000.0
60,000.0
First Half 2018 Second Half 2018 First Half 2019
N'B
illio
n
8.9
18.5 20.6
-
5.0
10.0
15.0
20.0
25.0
First Half 2018 Second Half 2018 First Half 2019
Mill
ion

17
Figure 20
Value of NAPS Transactions
(N’Billion)
Source: CBN
2.3.4 CURRENCY OPERATIONS
2.3.4.1 Issuance of the Legal Tender
The Bank ordered an aggregate indent of 3,830.94 million pieces of various
denominations of banknotes to meet the currency needs of the economy for
2019. This indicated an increase of 479.60 million pieces or 14.3 per cent, above
the 3,351.34 million pieces of banknotes ordered in the preceding year. The
Bank engaged the Nigerian Security Printing and Minting (NSPM) Plc to print
the entire indent. At end-June 2019, the NSPM Plc had delivered 1,266.81
million pieces or 33.1 per cent of the total indent, compared with 1,019.20
million pieces or 30.4 per cent delivered at end-June 2018.
The Bank released the “Clean Note Policy” and “Banknote Fitness Guidelines”
document. The two documents were produced in collaboration with key
industry stakeholders, including: Cash-in-Transit Companies (CITs), banks,
Currency Processing Companies (CPCs) and the Nigerian Cash Management
Scheme (NCMS). The Policy encapsulates diverse currency management
activities to preserve the integrity and quality of banknotes in circulation and
maintain public confidence. The Policy also provides that newly produced
and used banknotes should conform to predefined currency management
standards before issuance and re-circulation in the economy. The Banknote
Fitness Guidelines offers the financial industry with clear and acceptable
4,003.7
8,075.2
11,596.5
3,000.0
4,500.0
6,000.0
7,500.0
9,000.0
10,500.0
12,000.0
First Half 2018 Second Half 2018 First Half 2019
N'B
illio
n

18
criteria for determining the quality of banknotes in circulation. The document
provides guidelines on how to identify fit and unfit banknotes, and the various
degradation levels of banknotes among others.
The Bank approved the mop-up of over circulated/mutilated naira banknotes
from banks at no fee for a 3-month period, starting from June 3, 2019 –
September 2, 2019.
Similarly, the Bank continued with processing and authentication of excess
dollar deposits by banks with CBN Lagos & Abuja Branch at a handling charge
of 0.03 per cent of total deposits. A total of US$12.17 billion had been
processed as at June 30, 2019, with N11.28 billion earned as income from
processing charges.
2.3.4.2 Currency-in-Circulation (CIC)
Currency-in-circulation stood at N2,014.07 billion at end-June 2019,
representing an increase of 6.0 per cent above the level in the corresponding
period of 2018. This comprised 6,409.39 million pieces of banknotes and
2,317.10 million pieces of coins, valued at N2,012.47 billion and N1.60 billion,
respectively. In value terms, banknotes, increased by 6.0 per cent, compared
with the level in the first half of 2018, while coins remain unchanged. The growth
in CIC reflected increased economic activities and spendings associated with
the 2019 general election.
In terms of composition, the combined volume of N5, N10, N20 and N50
banknotes, as share of total currency in circulation in the first half of 2018,
increased to 33.2 per cent, from 27.0 per cent in the first half of 2018. Similarly,
the value rose to 2.7 per cent, from 1.8 per cent in the corresponding period
of 2018. At end-June 2019, the value of N1,000, N200, N50, N20, N10 and N5
banknotes in circulation rose by 9.0, 9.5, 192, 16.3, 29.0 and 27.1 per cent,
respectively. The value of N500 and N100 denominations, however, declined
by 2.7 and 10.0 per cent, respectively, compared with the levels in the first half
of 2018. In value terms, the N1,000 and N500 banknotes remained dominant
with shares of 62.5 and 25.8 per cent, compared with 60.7 and 28.1 per cent,
respectively, in the first half of 2018.

19

20
Table 5
Structure of CIC
Volume Value Volume Value Volume Value Volume Value Volume Value
(million) (N billion) (million) (N billion) (million) (N billion) (million) (N billion) (million) (N billion)
N2 204.37 0.41 204.36 0.41 204.37 0.41 204.37 0.41 204.37 0.41
N 1 736.05 0.74 736.05 0.74 736.05 0.74 736.05 0.74 736.05 0.74
50k 681.48 0.34 681.48 0.34 681.48 0.34 681.48 0.34 681.48 0.34
25k 348.25 0.09 348.25 0.09 348.25 0.09 348.25 0.09 348.25 0.09
10k 315.58 0.03 315.58 0.03 315.58 0.03 315.58 0.03 315.58 0.03
1k 31.37 0.00 31.37 0.00 31.37 0.00 31.37 0.00 31.37 0.00
Sub Total 2,317.10 1.61 2,317.09 1.60 2,317.10 1.60 2,317.10 1.60 2,317.10 1.60
Notes
N1000 946.90 946.90 1,029.37 1,029.37 1,156.82 1,156.82 1,154.35 1,154.35 1,258.45 1,258.45
N500 951.29 475.64 1,000.16 500.08 1,075.69 537.84 1,066.75 533.37 1,038.14 519.07
N200 339.57 67.91 400.66 80.13 495.06 99.01 530.78 106.16 581.11 116.22
N100 399.21 39.92 405.32 40.53 414.76 41.48 708.22 70.82 637.73 63.77
N50 178.85 8.94 191.07 9.55 209.95 10.50 158.62 7.93 463.24 23.16
N20 759.01 15.18 789.55 15.79 836.76 16.74 893.46 17.87 1,039.47 20.79
N10 419.58 4.20 480.67 4.81 575.08 5.75 627.27 6.27 809.22 8.09
N5 450.22 2.25 572.39 2.86 761.21 3.81 458.16 2.29 582.03 2.91
Sub-Total 4,444.62 1,560.94 4,869.18 1,683.12 5,525.32 1,871.94 5,597.60 1,899.07 6,409.39 2,012.46
Total 6,761.72 1,562.55 7,186.27 1,684.72 7,842.42 1,873.54 7,914.70 1,900.67 8,726.49 2,014.06
June 2015 - June 2019
Jun-19Jun-18Jun-17Jun-16Jun-15
Coins
Source: CBN
2.4 Financial Sector Surveillance
2.4.1 Banking Supervision
The CBN sustained its supervision and surveillance of the banking system in the
first half of 2019, to further strengthen the safety, soundness and stability of
financial institutions. Activities of the Bank in this regard included regular off-
site appraisal of banks’ returns and periodic on-site examination (special
investigations and spot checks) to ensure compliance with the provisions of
extant laws, regulations and guidelines.
In the other financial institutions (OFIs) sub-sector, approval was granted for
the constitution of the governance structure of the National Association of
Microfinance Banks Uniform Information Technology (NAMBUIT) platform that
would oversee the successful delivery of the Project mandates. Consequently,
the governance structure, which comprised the Steering, Executive and
Technical committees, was set-up and inaugurated.

21
The objective of the Project was to implement a unified IT platform for
microfinance banks (MFBs), comprising core and agent banking solutions to:
• Automate the operations of all MFBs;
• Assist MFBs gain economies of scale, through bulk purchase benefits;
• Enable the CBN gain better visibility and surveillance on their operations
to enhance its supervisory process;
• Enable integration of MFBs with the National Payments System; and
• Assist in operationalising BVN enrolment for the MFBs.
At end-June 2019, the consultant, Inlaks Computers, in collaboration with the
Technical Committee, functioning as the Interim NAMBUIT Operating Centre
(NOC), executed the following:
• A detailed statement of work, implementation plan, and initial selection
of pilot MFBs, comprising 2 National, 10 State and 100 Unit MFBs. The
number was later increased to 144 MFBs, consisting 2 National, 10 State
and 132 Unit MFBs for the pilot phase;
• Set-up of NAMBUIT on the existing infrastructure and databases for
implementation;
• Deployed the Solution for Core T24, Agency Banking, Interfaces and
Channels, and Offline Banking Resilience;
• Conducted assessment of 144 MFBs for Data Mapping and on-boarding
requirements;
• Prepared training manuals and materials for on boarding of MFBs and
undertook data cleansing training for pilot MFBs, using Data Validator
tool;
• Obtained approval for the allocation of an office space and equipment
for the NOC Project Management within the premises of the CBN, Abuja
Branch; and
• Commenced implementation and deployment with NPF MFB, and
successfully on-boarded 41 MFBs on the NAMBUIT platform across the
country.

22
In another development, a total subsidy package of N250.0 million was
provided by the CBN as counterpart funding from the grant component of the
Micro, Small and Medium Enterprises Development Fund (MSMEDF) to the
National Association of Microfinance Banks (NAMB). The subsidy package was
for the purchase of data capturing machines (DCM), to facilitate the
enrolment of MFBs’ customers for BVN. Also, the Bank disbursed a second
tranche payment of N10.40 million (at N200,000 per DCM) for 52 DCMs to
verified MFBs, through NAMB. In addition to the first tranche payment of N49.20
million for 246 DCMs, cumulative subsidy payment by the Bank amounted to
N59.60 million for 298 DCMs. At end-June 2019, 453 out of 906 MFBs had
submitted their BVN enrolment data to the CBN, indicating that only 1,756,950
or 19.8 per cent of 8,866,443 active customers had enrolled for the BVN.
Furthermore, during the review period, 542 candidates had completed Level
II Certification examination administered by the Chartered Institute of Bankers
of Nigeria (CIBN), resulting in a total of 6,332 certified candidates at end-June
2019, compared with 5,790 at end-December 2018.
In the mortgage sub-sector, the review of the Primary Mortgage Bank (PMB)
Guidelines aimed at strengthening primary mortgage banks and
complementing other on-going reforms in the sub-sector was completed in
the first half of 2019. An exposure draft of the Guidelines was also issued on
April 16, 2019 for input from stakeholders. In addition, the Uniform Underwriting
Standards (UUS) for mortgage lending earlier adopted for the formal sector
was approved for the informal sector and non-interest mortgages. The CBN
also approved the establishment of Mortgage Interest Drawback Fund (MIDF),
as an intervention fund, to deepen the mortgage and housing finance market.
For capital relief and computation of CAR by the PMBs, the Bank: approved
the assignment of a risk weight of 50.0 per cent to guaranteed legal
mortgages; maintained the 75.0 per cent risk weight on non-guaranteed legal
mortgages but set the Loan-to-Value (LTV) threshold at 70.0 per cent to
replace the current 80.0 per cent; and retained the 100.0 per cent risk weight
on equitable mortgages.

23
The Bank facilitated at the AML/CFT workshop for mortgage operators held in
Lagos in March 2019. The Workshop was organised by the Mortgage Bankers
Association of Nigeria (MBAN), in collaboration with the Nigeria Financial
Intelligence Unit (NFIU). The Bank also developed and exposed a draft Risk-
Based Cybersecurity Guidelines and Framework for OFIs to external
stakeholders for input. The Bank also issued a circular in March 2019, requiring
all OFIs using web-based mails for their official communication to create their
own official e-mails within one month, and notify it accordingly. The circular,
which was part of protective measures to guard against the risk of cyber-
attacks that may arise from the use of web-based mails, such as Yahoo or
Gmail, stipulated that only OFIs with corporate e-mails can make regulatory
submissions and communicate with the Bank via e-mails, it had restricted all
web-based e-mails from its domain. As part of efforts to build capacity, some
staff of the Bank attended a workshop organised by NIBSS on the
“Fundamentals of e-Payment” held at the CBN International Training Institute
(ITI), Abuja in May 2019. The Programme also covered cybersecurity risk
management.
The Bank continued with offsite Credit Risk Management System (CRMS)
compliance status checks in line with the requirements of the Regulatory
Guidelines for the Operation of the Redesigned CRMS for Commercial,
Merchant and Non-Interest Banks. The Bank also kept on with the phased
deployment of the redesigned CRMS to other financial institutions with a pilot
run with DFIs. In addition, an interface was created for the Nigeria Deposit
Insurance Corporation (NDIC) to manage credit records in respect of banks-
in-liquidation. Similarly, the Bank commenced the re-validation of all eligible
bank assets transferred to the Asset Management Corporation of Nigeria
(AMCON) by banks with a view to adequately capturing them on the CRMS
and granting the Corporation update rights on them.
Consequently, the patronage of the CRMS improved significantly in the review
period. At end-June 2019, there were 1,600,072 borrowers with outstanding
facilities, made up of 1,504,782 individuals and 95,290 corporates, compared
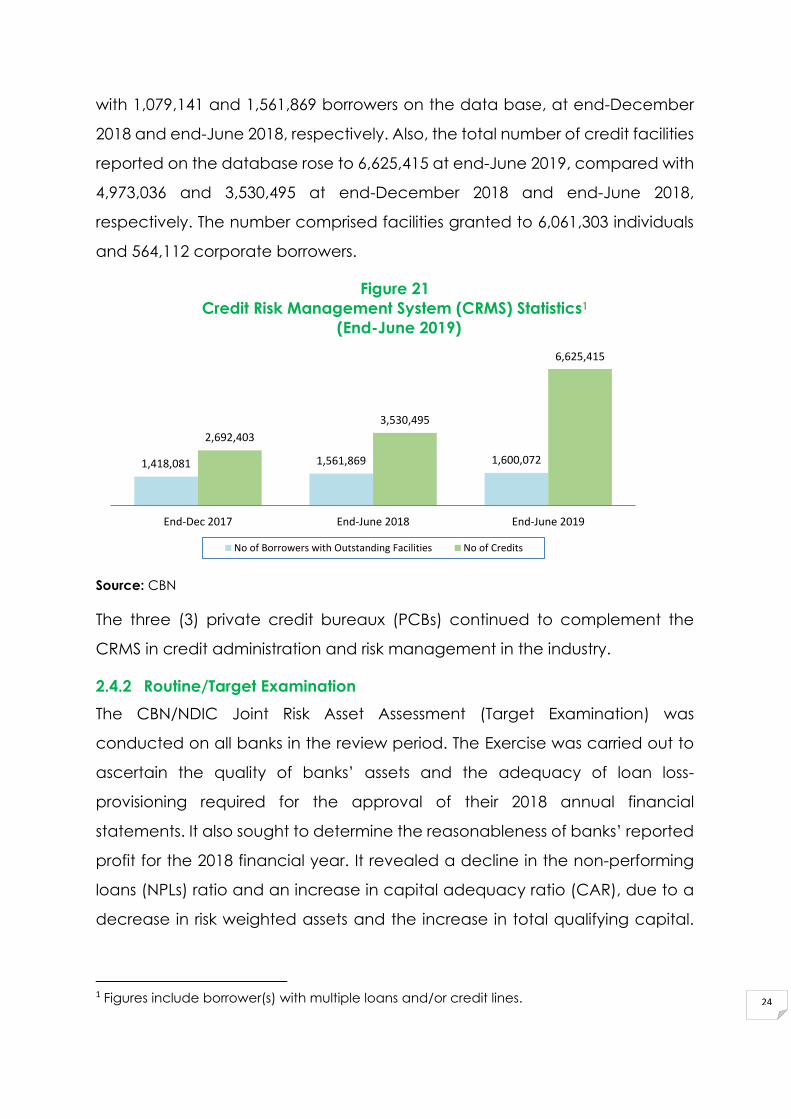
24
with 1,079,141 and 1,561,869 borrowers on the data base, at end-December
2018 and end-June 2018, respectively. Also, the total number of credit facilities
reported on the database rose to 6,625,415 at end-June 2019, compared with
4,973,036 and 3,530,495 at end-December 2018 and end-June 2018,
respectively. The number comprised facilities granted to 6,061,303 individuals
and 564,112 corporate borrowers.
Figure 21
Credit Risk Management System (CRMS) Statistics1
(End-June 2019)
Source: CBN
The three (3) private credit bureaux (PCBs) continued to complement the
CRMS in credit administration and risk management in the industry.
2.4.2 Routine/Target Examination
The CBN/NDIC Joint Risk Asset Assessment (Target Examination) was
conducted on all banks in the review period. The Exercise was carried out to
ascertain the quality of banks’ assets and the adequacy of loan loss-
provisioning required for the approval of their 2018 annual financial
statements. It also sought to determine the reasonableness of banks’ reported
profit for the 2018 financial year. It revealed a decline in the non-performing
loans (NPLs) ratio and an increase in capital adequacy ratio (CAR), due to a
decrease in risk weighted assets and the increase in total qualifying capital.
1 Figures include borrower(s) with multiple loans and/or credit lines.
1,418,081 1,561,869 1,600,072
2,692,403
3,530,495
6,625,415
End-Dec 2017 End-June 2018 End-June 2019
No of Borrowers with Outstanding Facilities No of Credits

25
The industry average CAR, was above the regulatory minimum of 10.0 and 15.0
per cent for banks with national and international authorisations, respectively.
The annual target/follow up on-site monitoring of the AMCON was conducted
in the review period. The report was awaiting Management’s consideration. In
addition, the Bank carried out monitoring/follow-up exercise on the
implementation of major observations from the previous risk-based
examination for banks with ‘High’ and ‘Above Average’ composite risk ratings.
2.4.3 Special/Foreign Exchange Examinations
The Bank conducted a review of foreign exchange operations of 27 banks (23
commercial and 4 merchant) in April 2019 to ascertain the level of compliance
with extant foreign exchange regulations. The review covered foreign
exchange activities for the period, April 1, 2018 to March 31, 2019. Major
infractions observed included: non-repatriation of export proceeds within the
stipulated time; dealing in high value foreign exchange transactions with
multiple corporate customers yet to be on-boarded on the FMDQ Advised
Trading and Surveillance System; and rendition of inaccurate returns. Others
were non-compliance with approved net foreign currency trading position,
lapses in foreign trade documentation and failure to comply with regulations.
The affected institutions were penalised in line with extant regulation.
2.4.4 Banking Sector Soundness
The health of banks improved in the review period, following the sustained
recovery in macroeconomic conditions, including declining inflation, stable
exchange rate and gradual upswing in the real economy. Asset quality of the
banking industry, measured by the ratio of non-performing loans to total loans
(NPL ratio), improved to 9.4 per cent at end-June 2019, compared with 11.4
and 12.5 per cent at end-December 2018 and end-June 2018, respectively. At
this level, the ratio, remained above the regulatory threshold of 5.0 per cent.
The decrease in the NPL ratio reflected improvements in credit quality, driven
by favourable macroeconomic conditions and increased compliance with
prudential regulations. To further consolidate on the improvement, the CBN
directed banks to intensify efforts at debt recovery, realise collateral for lost

26
facilities and strengthen their risk management processes. Loan loss provision
was 80.1 per cent at end-June 2019, compared with 102.8 per cent in the
corresponding period of 2018.
At end-June 2019, the industry average capital adequacy ratio (CAR)
remained at 15.3 per cent, same as the level at end-December 2018,
compared with 12.1 per cent at end-June 2018. The development reflected
the increase in banks’ total qualifying capital and a decrease in risk weighted
assets. The industry threshold, however, remained at 15.0 per cent for banks
with international authorisation and 10.0 per cent for banks with either national
or regional authorisation.
The industry liquidity ratio increased to 73.0 per cent at the end of the first half
of 2019, from 46.1 per cent at end-June 2018, reflecting the rise in the stock of
liquid assets held by banks. With the exception of two (2) commercial banks,
all others met the minimum regulatory liquidity ratios of: 30.0 per cent for
commercial banks; 20.0 per cent for merchant banks; and 10.0 per cent for
non-interest banks, at end-June 2019.
2.4.5 Banks’ Compliance with the Code of Corporate Governance
To ensure compliance, the CBN continued its oversight of the corporate
governance regime in Nigerian banks in the review period. To that end, the
Bank concluded the Corporate Governance Scorecard Assessment on twelve
(12) banks. The objectives of the assessment included: establishing the level of
compliance with the CBN Code of Corporate Governance, OECD Principles
and the Global Best Practices by banks; enhancement of the reputation of
Nigeria’s banking industry; and enhance disclosure and transparency in the
banking Industry.
2.4.6 Financial Crimes Surveillance/Anti- Money Laundering/Combating
the Financing of Terrorism (AML/CFT)
The Bank conducted an AML/CFT risk management examination of all
reporting banks in the first half of 2019. The exercise covered the period, April
1, 2018 to March 31, 2019. During the first quarter of 2019, the Bank conducted
a pilot run of AML/CFT Risk Based Examination on three (3) banks. The pilot run

27
was to enable the AML/CFT examiners explore the Offsite Risk Assessment
Methodology (ORAM) tool, and come up with some learning points to guide
onsite examiners and aid in the examination of all the banks in the industry on
the risk-based approach (RBA). The Exercise provided useful feedback for the
maiden risk-based AML/CFT examination.
Also, a maiden risk–based AML/CFT examination of twenty-seven (27) banks
was conducted from April 8, 2019 to May 17, 2019, with a year coverage of
April 1, 2018 to March 31, 2019. The RBA was conducted, using the International
Monetary Fund’s (IMF) ORAM tool. The Exercise exposed all banks to RBA, and
enabled the CBN to prepare for the upcoming Mutual Evaluation exercise by
GIABA and FATF in September 2019.
The examination focused on: identification and measurement of ML/FT
inherent risks in banks’ customers, products and services, delivery channels
and geographical spread; review of relevant policies, procedures, risk
assessments, management information; internal audit and compliance
reports; interviews with key senior staff, including the Money Laundering
Reporting Officers, on-site walk-throughs of key AML/CFT and banking
processes; among others.
Certain deficiencies and issues identified from the examination included:
• Lack of ML/FT Risk Assessment Framework and comprehensive ML/FT risk
profile, to include enterprise ML/TF Risk Assessment Matrix for periodic
review and regular assessment of ML/TF risks;
• Failure to identify ML/FT risk in Enterprise Risk Management Framework;
• Failure to include AML/CFT reviews in annual monitoring and internal
audit plans;
• Deficiencies in the politically-exposed persons (“PEPs”) on-boarding
process, including initial screening, the timing of senior management
approval and the failure to sufficiently identify, verify and document
Sources of Funds (“SOF”) and Sources of Wealth (“SOW”);
• Non-adherence to stated AML/CFT policies; and

28
• Failure to ensure the provision of appropriate and comprehensive
AML/CFT training to board and committee members, as well as,
enhanced training for staff in key AML/CFT and specific roles. In addition,
there was general absence of function - specific AML/CFT training to
enable staff perform their roles effectively, to mitigate ML/FT risks.
Consequently, the banks were assessed and rated with overall AML/CFT
ratings of “Above Average”, “Medium” and “Low” risks based on their
structural risks, inherent risks, and risk mitigants. There was no record of an ML/FT
high risk bank in Nigeria. Penalties were imposed on the banks for various
infractions identified during the examination.
2.4.7 Cross-Border Activities
The number of foreign subsidiaries of Nigerian banks remained at 58 in the first
half of 2019. The number of representative offices, affiliates and international
branches of Nigerian banks were five (5), one (1) and two (2), respectively,
bringing the total number of offshore entities to 66 at end-June 2019, as
approval was granted for the closure of a representative office of a bank.
In collaboration with host supervisors, a joint examination of two (2) offshore
subsidiaries of UBA in Guinea and Sierra Leone was carried out in the first half
of 2019. The examination revealed that the subsidiary in Guinea had
composite risk rating of ‘High’. The subsidiary was required to take appropriate
remedies to address the concerns. Staff of the CBN attended the conference
of the Community of African Banking Supervisors (CABS), held in Cape Town,
South Africa from June 25 -26, 2019, and the annual conference, which held
in Egypt from June 10 – 11, 2019.
In addition, staff of the Bank attended the 32nd and 33rd meetings of the
College of Supervisors of the West African Monetary Zone (CSWAMZ) during
the review period. The meetings reviewed developments in the banking
system across the Zone. Discussions were also held on the implementation of
IFRS/IFRS 9, Basel I, II and III, Integrated Regulatory Solution (IRS) and other
relevant issues concerning financial system stability in the sub-region in line with
the mandate of the College.

29
Furthermore, the Bank hosted a team of examiners from the Bank of Uganda
on an Anti-Money Laundering Attachment Programme, to strengthen
collaboration for capacity building in the area of AML Inspection.
2.4.8 Update on Basel II/III Implementation
The Bank continued to monitor the implementation of Basel II/III standards.
Accordingly:
• The Guidelines for Credit Concentration Risk, and Interest Rate Risk in the
Banking Book (IRRBB), Business & Strategy Risk, Reputation Risk and Stress
Testing were concluded and issued in March 2019. All the guidelines
were to be implemented immediately, while IRRBB would come into
effect from January 2020;
• The B2 implementation team held interactive sessions with the Other
Financial Institutions Department (OFISD) in the quest to implement Basel
II/III in the OFI sub-sector for the systemically-important other financial
institutions (SIOFIs);
• The Bank prepared draft guidelines on Liquidity Standards, Liquidity
Coverage Ratio and liquidity monitoring tools, and leverage ratio, to
complement Pillar 1 risks assessment and large exposure measure to
strengthen concentration risk management in banks. Other draft
guidelines were, Liquidity Risk Management and Internal Liquidity
Adequacy Assessment Process (ILAAP) and Regulatory Capital
definition. The IMF provided technical assistance for the review of the
guidelines;
• The Bank prepared a draft questionnaire on the state of readiness of
banks for some of the proposed guidelines and to conduct a
Quantitative Impact Study (QIS) on the potential impact of the
guidelines on banks; and
• The off-site review of the ICAAPs of banks with a CRR of “High” and
“Above Average” was concluded in readiness for the On-site

30
engagement, to ensure that the findings from the Supervisory Review
Evaluation Process (SREP) ultimately feed into the overall risk assessment
of each bank.
2.4.9 Fraud and Forgery
During the first half of 2019, there were 29,215 reported cases of fraud and
forgeries (both attempted and successful), representing an increase of 40.7
per cent over the 20,768 cases recorded in the first half of 2018. The value of
attempted and successful cases, however, declined by 57.8 per cent to N8.35
billion in the first half of 2019, from N19.77 billion in the corresponding period of
2018.
The actual loss due to fraud and forgeries for the first half of 2019 was N2.38
billion. This represented a decrease of 80.3 per cent below N12.06 billion,
incurred in the first half of 2018.
As in the previous half-year, the fraud and forgeries reported during the period
under review were majorly perpetrated by outsiders (non-bank staff). The types
of frauds were: pilfering of cash; suppression and conversion of customer’s
deposits; stealing; illegal funds transfer; defalcation; and fraudulent ATM
withdrawals.
2.4.10 Consumer Protection
The Bank received 1,528 complaints from consumers of financial services in the
first half of 2019, compared with 1,439 in the corresponding period of 2018. Of
this number, 1,476 complaints or 96.6 per cent were against banks, while 52
complaints or 3.4 per cent were against other financial institutions (OFIs). The
complaints were, mainly, in respect of excess charges, frauds, dishonoured
guarantees and unauthorised deductions/transfers, among others. A total of
1,548 complaints, including those outstanding from 2018, were resolved in the
review period, compared with 2,451 complaints in the corresponding period
of 2018.
Total claims in the review period in local and foreign currencies amounted to
N8.70 billion and US$315,475.54, compared with N20.50 billion, US$163,479.00,

31
£2,889.98 and €32.82 in the corresponding period of 2018. The sum of N7.2
billion and US$315,229.02 were refunded, compared with N6.80 billion,
US$119,349, £2,889.98 and €32.82 refunded in the corresponding period of
2018.
Compliance examination was conducted on 20 banks in the first half of 2019,
to ascertain their level of compliance with consumer protection regulations,
particularly, the Guide to Charges by Banks and Other Financial Institutions
(GCBOFI). The exercise revealed 100.0 per cent compliance in the area of
facility enhancement fee. Compliance levels in other areas were:
management fee (95%); restructuring fee (85%); deposit held as collateral
(70%); commitment fee (65%); compliance with previous directive (81%); and
outstanding complaints (38.4%). Overall, the examination revealed
improvement in the level compliance level in most areas. The CBN directed
banks to implement specific remedial action, in areas of non-compliance,
including refunds to customers.
As part of effort to further improve market conduct, the Bank developed and
exposed the Guidelines on Complaints Handling and Redress, Fair Treatment,
Disclosure and Transparency and Responsible Business Conduct to
stakeholders in the review period.
In a related development, the CBN was admitted into the International
Financial Consumer Protection Organisation (FINCONET) to deepen consumer
protection and conduct supervision in Nigeria. FINCONET is an international
organisation of supervisory authorities with the responsibility of ensuring
financial consumer protection.
2.4.11 Financial Literacy
The Bank, in collaboration with the German Agency for International
Development (GIZ) and other stakeholders, commenced the development
and implementation process of the financial literacy e-learning portal in the
review period. The project was aimed at deploying a fully digital national e-
Learning platform to provide a knowledge base and support financial
education trainers/facilitators/multipliers as a collective effort to enhance

32
financial literacy in Nigeria. A Vendor was selected to deliver on the Project
and the financial literacy e-Learning platform was expected to go live by first
quarter of 2020.
Following the National Financial Literacy Stakeholders Conference held in
January 2019, the Bank engaged with relevant stockholders to discuss and
collaborate on ways to effectively implement the decisions taken at the
Conference, as contained in the communiqué. The stakeholders were the
Nigeria Deposit Insurance Corporation (NDIC), the Securities and Exchange
Commission (SEC) and the Nigerian Stock Exchange (NSE).
The Bank, in conjunction with other stakeholders, coordinated activities to
commemorate the 2019 Global Money Week. The event, with the theme
“Learn, Earn and Save”, was marked with a global money walk in Abuja and
a school outreach/mentoring programme in Abuja, and the 36 states of the
Federation. A total of 138,163 children were reached during the Programme.
The Bank also partnered with Enhancing Financial Inclusion and Access (EFInA)
in Gombe and Kano states on the school mentoring programme and media
engagement.
As part of the efforts to introduce financial literacy into the formal school
system, the Bank, in collaboration with the Nigeria Educational Research and
Development Council (NERDC), continued the project of mainstreaming
Financial Education (FE) into the Nigerian curricula at basic and senior
secondary levels. This was done by implementing the monitoring and
administration of instruments for pilot testing of the financial education
curriculum in Katsina State- one of the two nominated states, where the pilot
scheme was conducted. The pilot test covered selected primary and
secondary schools in the State.
Other activities by the Bank, in furtherance of the financial literacy objectives,
included:
• Sensitisation activities during CBN fairs and trade fairs;
• Sensitisation activities for faith-based organisations; and

33
• The launch of the Consumer Protection Newsletter.
2.4.12 Examination of Other Financial Institutions
The Bank conducted routine and special examination of 437 other financial
institutions (OFIs) in the first half of 2019. The examination covered Risk-Based
Supervision (RBS) of five (5) development finance institutions (DFIs), income
audit of nine (9) PMBs and two (2) finance companies (FCs), target
examination of 345 MFBs and 12 Bureaux-De-Change (BDCs), RBS and Income
Audit of 12 MFBs, as well as, AML/CFT examination, using the Risk-Based
Approach for 29 MFBs and 23 PMBs.
The examination report of the seven (7) licensed DFIs2, revealed that the
Composite Risk Rating for four (4) institutions was “High”, one (1), “Above
Average”, one (1), “Moderate” and one (1), “Low”. Similarly, examination of
386 MFBs was conducted in the review period, compared with 224 MFBs in the
corresponding period of 2018. The excercise also covered RBS examination
and income audit of 12 MFBs designated as Systemically-Important Other
Financial Institutions (SIOFIs) and special examination of 374 MFBs. Highlights of
the RBS examination of the 12 MFBs revealed that the capital ratings for seven
(7) were “Strong”, four (4), “Acceptable”, and one (1), “Needs Improvement”.
Earnings ratings for the institutions indicated nine (9) were “Acceptable”, two
(2), “Needs Improvement” and one (1), “Weak”, while the composite risk
ratings for five (5) MFB were “Moderate”, four (4) “Above Average” and three
(3) “High”.
The special examination report of the 345 MFBs showed that: 234 MFBs met the
required 20.0 per cent minimum liquidity ratio; 96 MFBs met the required
minimum capital adequacy ratio of 10.0 per cent; and 5 MFBs satisfied the 5.0
per cent stipulated maximum for portfolio-at-risk. The report further revealed:
absence of capital management plans and weak strategic objectives; high
incidence of non-performing credit (above PAR of 5%); high operating costs;
inadequate capitalisation; poor corporate governance; and weak risk
2 The RBS Examination of BOA and NMRC were conducted in 2018 and the ratings were
adopted in this analysis.

34
management practices. Consequently, regulatory directives were issued to
the affected MFBs to immediately take definitive measures to meet required
thresholds.
In addition, the income audit examination reports revealed that:
• The identified SIOFIs, in collaboration with their external auditors adopted
models for recognition, measurement and disclosure of income, as
required by the IFRS 9;
• Further collaboration was required by the Bank and the external auditors
to build competencies for staff of the MFBs in recognising and making
adequate impairments for their Expected Credit Losses (ECL) models;
and
• There was the urgent need to review the current 5 per cent Pass and
Watch regulatory provision in view of the “90 days past due” rebuttable
presumption for ECL under the IFRS 9.
The Bank also conducted income audit of nine (9) PMBs during the review
period. The examination report indicated the following regulatory/supervisory
challenges: high credit concentration risk; inadequate capitalisation below
the regulatory minimum of N2.5 billion or N5.0 billion for institutions with either
State or National authorisation, respectively; increase in personnel costs and
impairment charges; and deterioration in risk asset quality.
The average CAR of the sub-sector increased from 18.4 per cent at end-
December 2018 to 41.0 per cent at end-June 2019. The asset quality of the
industry further deteriorated, as the average non-performing loan ratio,
generally, exceeded the regulatory maximum of 30.0 per cent. However, the
sub-sector recorded an increase in the average liquidity ratio to 98.4 per cent
at end-June 2019, from 46.1 per cent at end-December 2018. There were five
critically illiquid PMBs with average liquidity ratio of 9.9 per cent. In all, seven
(7) PMBs failed to meet the minimum liquidity ratio benchmark of 20.0 per cent
at end-June 2019, compared with eight (8) at end-June 2018. However,
liquidity ratio maintained by the institutions were generally above the 20.0 per
cent regulatory minimum, signifying low liquidity risks.

35
Special examination of two (2) FCs was conducted in the review period. The
examination covered income audit of the institutions designated as SIOFIs, to
determine the authenticity of their reported incomes in compliance with the
IFRS 9 disclosure requirements. The exercise facilitated the issuance of “No
Objection” for the publication of the financial statements of the institutions for
the year ended December 31, 2018.
Examination reports3 of 53 FCs conducted in the last quarter of 2018
highlighted the following challenges in the sub-sector: high NPL Ratio due to
poor asset quality arising from non-performing credit facilities and poor
collateral cover; inability of FCs to raise cheap funds as they are not permitted
to accept deposits and their borrowings are not insured; dominance of
owner/managers with attendant corporate governance issues; inability of
many FCs to acquire and adopt appropriate IT platforms to cope with Fintech
innovations. Other challenges included: difficulty in pursuing mergers and
acquisitions due to non-homogenous products, control and lack of trust
among equity holders; data integrity as many FCs do not report their activities
correctly either deliberately or as a result of skills gap; and competition from
banks and other financial institutions (OFIs). Supervisory Letters were issued to
the affected institutions, with recommendations for observed infractions and
time lines to ensure compliance.
In addition, the Bank conducted a special examination, involving spot checks
on 12 BDCs in May 2019, following intelligence reports of their alleged
involvement in forex malpractices. The exercise revealed breaches of the
Revised BDC Guidelines and other relevant regulations such as dealing in
wholesale transactions, poor record-keeping and documentation of forex
purchases and sales, as well as, non-rendition of AML/CFT returns to the
relevant authorities.
2.5 Foreign Exchange Market and Management
In the first half of 2019, the Bank sustained its intervention in the foreign
exchange market, aimed at enhancing the stability of the naira exchange
3 The examination reports were analysed during the review period.

36
rate to engender a stable macroeconomic environment. On March 5, 2019
and June 3, 2019, the Bank added textile and palm oil, respectively, to the list
of items not valid for foreign exchange at the official window, which brought
the total number of items to 44.
2.5.1 Spot Transaction in the Foreign Exchange Market
The aggregate foreign exchange supplied by the Bank to the inter-bank and
BDC segments amounted to US$0.81 billion and US$6.86 billion, respectively, in
the review period, compared with US$3.20 billion and US$3.17 billion, in the
corresponding period of 2018. This indicated a decrease of 70.2 per cent in
total sales to the inter-bank, but an increase of 116.4 per cent to the BDC
segment, relative to the levels in the corresponding period of 2018. In addition,
foreign exchange sales under the Secondary Market Intervention Scheme
(SMIS), and Small and Medium Enterprises (SME) amounted to US$3.22 billion
and US$0.63 billion, respectively. The Bank also supplied US$1.08 billion at the
I&E window to enhance liquidity and stability in the market.
2.5.2 Forwards and Swaps Transactions
In the first half of 2019, the value of forwards contracts disbursed at maturity for
inter-bank and wholesale were US$1.47 billion and US$1.91 billion, respectively.
The Bank undertook swaps transactions valued at US$2.01 billion, compared
with US$2.25 billion and US$2.33 billion in the first and second halves of 2018,
respectively.

37
Figure 22
Supply of Foreign Exchange
(US$’ Billion)
Source: CBN
2.5.3 Exchange Rate Movements
The exchange rate of the naira to the US dollar in the first half of 2019 remained
relatively stable at the inter-bank and BDC segments of the foreign exchange
market. The development was attributed, largely to increased intervention by
the Central Bank, which enhanced liquidity and dampened demand pressure.
2.5.3.1 Spot Exchange Rates
The average exchange rate of the naira to the US dollar at the inter-bank
segment was N306.90/US$, a depreciation of 0.2 and 0.4 per cent, below the
levels in the preceding and the corresponding period of 2018, respectively. At
the BDC segment, the average exchange rate of the naira appreciated by
0.3 and 0.7 per cent to N359.77/US$, above the respective levels in the
preceding and corresponding period of 2018. At the I&E window, the average
exchange rate was N361.33/US$, representing an appreciation of 0.6 per cent,
above the level in the preceding period, but a depreciation of 0.2 per cent,
relative to the level in the corresponding period of 2018. Consequently, the
premium between the average inter-bank and BDC rates narrowed to 17.2
per cent during the review period, from 18.5 per cent in the first half of 2018.
Similarly, the premium between the average I&E and the BDC rates narrowed
to 0.4 per cent in the first half of 2019, from 0.5 per cent in the corresponding
period of 2018.
The end-period exchange rate of the naira to the US dollar at the inter-bank
segment closed at N306.90/US$ at end-June 2019, compared with
0
1
2
3
4
5
Jan-18
Feb-18
Mar-18
Apr-18
May-18
Jun-18
Jul-18 Aug-18
Sep-18
Oct-18
Nov-18
Dec-18
Jan-19
Feb-19
Mar-19
Apr-19
May-19
Jun-19
US$
Bill
ion

38
N307.00/US$ at end-December 2018 and N305.75/US$ at end-June 2018. At
the BDC segment, the naira closed at N360.00/US$, relative to N361.00/US$ at
end-December 2018 and N360.50/US$ at end-June 2018. At the I&E window,
the exchange rate closed at N360.74/US$ at end-June 2019, compared with
N364.00/US$ at end-December 2018 and N361.32/US$ at end-June 2018.
Figure 23
Exchange Rate Movements
(First Half 2018 – First Half 2019)
(N/US$)
Source: CBN
Figure 24
Inter-bank/Bureau-de-Change Foreign Exchange (N/US$) Premium
(Per cent)
Source: CBN
2.5.4 Foreign Exchange Flows
Aggregate foreign exchange inflow into the economy in the first half of 2019
amounted to US$67.34 billion, representing an increase of 17.2 and 2.3 per
cent above the levels in the second and first halves of 2018, respectively. Of
250.00
300.00
350.00
400.00
N/U
S$
Interbank BDC
0.0
10.0
20.0
30.0
40.0
50.0
60.0
70.0
Per
ce
nt
Inter-bank/BDC Premium 5% International Benchmark

39
the total, inflow through autonomous sources accounted for 54.2 per cent,
while inflow through the CBN accounted for 45.8 per cent. Foreign exchange
inflow through autonomous sources was US$36.52 billion in the first half of 2019,
indicating an increase of 27.2 and 3.5 per cent, relative to the respective levels
in the second and first halves of 2018. The development was attributed to 27.5
and 24.6 per cent increase in non-oil export receipts and invisible purchases,
respectively.
A disaggregation of the inflow through autonomous sources showed that:
invisible purchases amounted to US$33.77 billion; non-oil export receipts,
US$2.66 billion; and external account purchases, US$0.10 billion. Of the total
invisible purchases, ordinary domiciliary accounts and over-the-counter (OTC)
purchase were US$7.69 billion and US$26.08 billion, respectively. A
disaggregation of the OTC purchases showed that: capital importation
amounted to US$14.59 billion; purchases by banks from oil companies, US$0.86
billion; home remittances, US$0.69 billion; and other OTC purchases, US$9.93
billion.
Foreign exchange inflow through the CBN was US$30.82 billion, indicating an
increase of 7.3 and 1.0 per cent, over their respective levels in the preceding
and corresponding periods of 2018. A breakdown of foreign exchange inflow
through the Bank showed that crude oil receipts amounted to US$7.02 billion,
a decline of 11.4 and 1.1 per cent, below the levels in the preceding and
corresponding period of 2018, respectively. However, non-oil receipts through
the Bank rose by 14.4 and 1.7 per cent to US$23.80 billion, above the levels in
the preceding and corresponding periods of 2018, respectively. The
development was attributed, mainly, to increase in foreign exchange
purchases at US$9.50 billion; banks cash receipts, US$4.72 billion; and other
official receipts, US$2.85 billion. Others were unutilised funds from foreign
exchange transactions, US$1.13 billion; returned payments (wired/cash),
US$0.64 billion; and interest on reserves and investments, US$0.57 billion. A
further analysis of non-oil inflow showed decline in inter-bank swaps, at US$1.73

40
billion; TSA and third-party receipts, US$1.97 billion; and unutilised IMTO
receipts, US$0.70 billion.
Aggregate foreign exchange outflow from the economy declined by 14.6 per
cent to US$30.74 billion, below the level in the second half of 2018, but higher
by 23.3 per cent compared with the level in the corresponding period of 2018.
Aggregate outflow from autonomous sources, at US$1.89 billion, fell by 27.2
and 4.8 per cent, relative to their respective levels in the second and first halves
of 2018. This was driven, largely, by invisible import at US$1.19 billion, while
visible import amounted to US$0.70 billion, representing 63.1 and 36.9 per cent,
respectively. Foreign exchange outflow through the CBN was US$28.85 billion,
indicating a decrease of 13.6 per cent below the level in the second half of
2018, but an increase of 25.7 per cent compared with the level in the first half
of 2018.
A disaggregation of the total outflow through the Bank indicated 16.6 and 80.9
per cent increase in inter-bank utilisation at US$18.04 billion and “other” official
payments, at US$7.48 billion, respectively. Other sources of outflow were: third
party MDAs transfer, US$2.23 billion; external debt service, US$0.62 billion;
drawings on letters of credit (L/Cs), US$0.39 billion; foreign exchange special
payment, US$0.08 billion; and others, the balance.
Foreign exchange market utilisation comprised: inter-bank forwards, US$1.47
billion (8.2%); inter-bank sales, US$0.81 billion (4.5%); BDC sales, US$6.86 billion
(38.0%); and swaps, US$2.07 billion (11.5%). Others included foreign exchange
sales at I&E window, US$1.08 billion (6.0%); SMIS intervention, US$3.22 billion
(17.8%); and wholesale forwards, US$1.91 billion (10.6%).
Outflow in respect of ‘Other’ official payments amounted to US$7.48 billion,
indicating increase of 24.9 and 80.9 per cent above the respective levels in
the preceding and corresponding period of 2018. This comprised: Joint
Venture Companies (JVC) cash calls, US$2.06 billion; estacodes, US$0.03
billion; and miscellaneous, US$5.39 billion.
Figure 25
Foreign Exchange Disbursements through the CBN

41
(First Half 2019)
Source: CBN
Aggregate foreign exchange flows through the Bank recorded a net inflow of
US$1.97 billion in the first half of 2019, as against a net outflow of US$4.46 billion
in the second half of 2018, and net inflow of US$7.72 billion in the first half of
2018. Foreign exchange transactions through autonomous sources recorded
a net inflow of US$34.63 billion in the review period, compared with US$26.12
billion and US$33.25 billion in the preceding and corresponding periods of
2018, respectively. Foreign exchange flow, through the economy, resulted in
a net inflow of US$36.61 billion, relative to US$21.47 billion and US$40.97 billion,
in the second and first halves of 2018, respectively. This showed an increase in
net flow of 70.9 per cent in the first half of 2019, but a decrease of 10.7 per
cent, compared with the corresponding period of 2018.
Interbank utilisation62.5%
Drawings on L/Cs1.4%
External Debt Service
2.2%
Forex Special Payments
0.3%
Other Official Payments
25.9%
3rd Party MDA Transfers
7.7%

42
Figure 26
Foreign Exchange Transactions through the CBN
(First Half 2019, US$’ Billion)
Source: CBN
2.5.5. Sectoral Utilisation of Foreign Exchange
Aggregate sectoral utilisation of foreign exchange in the first half of 2019 was
US$17.99 billion, representing a decrease of 22.4 per cent, compared with the
level in the preceding period, but an increase of 1.9 per cent above the level
in the corresponding period of 2018. A disaggregation showed that, visible
import fell by 16.5 and 8.9 per cent to US$6.92 billion, relative to the levels in
the second and first halves of 2018. Similarly, invisible transactions fell by 25.7
per cent to US$11.07 billion, compared with the level in the second half of 2018,
but increased by 10.1 per cent, above the level in the corresponding period
of 2018. Of the total utilisation, visible import accounted for 38.5 per cent of
the total, while invisible import was 61.5 per cent.
Further analysis of foreign exchange utilised for visible import indicated that
the industrial sector import at US$3.10 billion decreased by 20.8 and 6.6 per
cent, below the levels in the preceding and corresponding periods of 2018,
respectively. Similarly, amount utilised for food products, manufactured
products, agricultural and oil sectors declined by 5.4, 22.8, 11.8 and 9.3 per
cent to US$1.00 billion, US$1.44 billion, US$0.11 billion and US$0.81 billion, below
their respective levels in the corresponding period of 2018. However, utilisation
for transportation and mineral sectors rose by 16.0 and 129.4 per cent to
US$0.29 billion and US$0.15 billion, respectively.
30.51 28.73 30.82
22.94
33.39 28.85
7.57
(4.66)
1.97
-10
0
10
20
30
40
1st Half 2018 2nd Half 2018 1st Half 2019
US$
bill
ion
Inflow Outflow Netflow

43
A breakdown of foreign exchange utilised for invisibles showed that financial
services, communication, tourism and travel, construction and engineering
related, as well as, distribution services increased to US$9.39 billion, US$0.14
billion, US$0.05 billion, US$0.006 billion and US$0.02 billion, compared with the
levels in the corresponding period of 2018, respectively. However, education,
transport and other services (n.i.e.) declined by 68.9, 71.5, 42.2 and 36.4 per
cent to US$0.09 billion, US$0.41 billion, and US$0.08 billion, respectively,
compared with the levels in the first half of 2018. Others constituted the
balance.
Figure 27
Sectoral Utilisation of Foreign Exchange (Visibles)
(First Half 2019)
Source: CBN
Industrial sub-
sector
44.8%
Food Products
14.5%
Manufactured
Products
20.8%
Transport sub-
sector
4.2%
Agricultural sub-
sector
1.7%
Minerals sub-
sector
2.2%Oil sub-sector
11.8%

44
Figure 28
Sectoral Utilisation of Foreign Exchange (Invisibles)
(First Half 2019)
Source: CBN
2.5.6 Nominal Effective Exchange Rate (NEER) and Real Effective Exchange
Rate (REER) Indices
Provisional data for the average 19-currency Nominal Effective Exchange
Rate (NEER) index in the review period was 180.38, indicating a decrease of
0.7 and 5.8 per cent, relative to the levels in the second and first halves of 2018,
respectively. The average Real Effective Exchange Rate (REER) index, which
measures external competitiveness of a country, was 84.71, representing a
decline of 4.0 and 12.8 per cent, below the levels in the preceding and
corresponding periods of 2018.
Figure 29
Nominal Effective Exchange Rate (NEER) and Real Effective Exchange Rate
(REER) January 2018 – June 2019
Source: CBN
Business
8.4%Communication
1.3%
Construction &
related
engineering
0.1%
Distribution
0.2%
Educational
0.8%
Financial
88.8%
tourism &travel
related
0.4%
0.00
50.00
100.00
150.00
200.00
250.00
Jan-18
Feb-18
Mar-18
Apr-18
May-18
Jun-18
Jul-18 Aug-18
Sep-18
Oct-18
Nov-18
Dec-18
Jan-19
Feb-19
Mar-19
Apr-19
May-19
Jun-19
N/U
S$
Nominal Effective Exchange Rate Real Effective Exchange Rate

45
Table 6
Nominal and the Real Effective Exchange Rate Indices
(November 2009=100)
Nominal Effective
Exchange Rate (NEER)
Real Effective
Exchange Rate (REER)
2018
Jan 196.82 101.42
Feb 194.48 99.75
Mar 194.86 99.13
Apr 191.14 96.68
May 187.45 93.97
Jun 184.14 91.36
1st Half 2018 191.48 97.05
Jul 184.94 91.43
Aug 181.18 88.84
Sep 181.32 88.28
Oct 179.17 86.84
Nov 181.63 87.21
Dec 181.98 86.67
2nd Half 2018 181.70 88.21
2019
Jan 183.86 87.11
Feb 181.52 85.77
Mar 179.85 84.58
Apr 179.08 83.71
May 177.57 82.19
1st Half 2019 180.38 84.67
Source: CBN
2.6 Development Finance Operations
2.6.1 Real Sector Interventions
2.6.1.1 Credit Support Schemes
2.6.1.1.1 Commercial Agricultural Credit Scheme (CACS)
The Scheme was established to fast-track the development of the agricultural
sector by providing credit facilities to commercial agricultural enterprises at
single digit interest rate and promoting low food inflation. It, also, has a non-
interest component that aligns with the principles of islamic finance.
A total of N4.84 billion was disbursed to five (5) banks for six (6) projects under
the Scheme in the first half of 2019, compared with N39.34 billion disbursed to
eight (8) banks for sixteen (16) projects in the first half of 2018. Cummulative
disbursements from inception in 2009 to end-June 2019 stood at N608.13 billion
for 588 projects. State government projects accounted for N329.27 billion
(54.1%), while private sector projects recieved N 278.86 billion (45.9%).

46
Aggregate repayments during the first half of 2019 stood at N23.91 billion
through thirteen (13) banks in respect of 139 projects, compared with N17.01
billion repaid through fourteen (14) banks in respect of 51 projects in the same
period of 2018. This brought cumulative repayment from inception to end-June
2019 to N349.99 billion.
2.6.1.1.2 Paddy Aggregation Scheme (PAS)
The Paddy Aggregation Scheme was a short-term bridging facility introduced
in 2017 to enable rice millers purchase paddy for all-year processing. The sum
of N35.20 billion was released to seven (7) banks for twelve (12) projects in the
first half of 2019, compared with N4.25 billion released to three (3) banks for
three (3) projects in the corresponding period of 2018. This brought total
disbursement to N88.83 billion for 25 projects, at end-June 2019.
The sum of N1.5 billion was repaid in the review period, compared with N13.37
billion in the first half of 2018. Cumulative repayment from inception to end-
June 2019 was N34.63 billion.
2.6.1.1.3 Anchor Borrowers’ Programme (ABP)
The ABP was designed to finance smallholder farmers and create an
economic linkage between them and commodity processors/millers. This was
with a view to increasing farm production and enhancing capacity utilisation
in agro-processing industry.
In the first half of 2019, N26.67 billion was disbursed to 237,967 smallholder
farmers, compared with N36.37 billion disbursed to 155,732 farmers in the
corresponding period of 2018. This represented a decrease of 36.4 per cent in
amount disbursed, but an increase of 52.8 per cent in the number of
smallholder farmers under the Programme. Furthermore, area under
cultivation increased from 155,732 hectares in the first half of 2018 to 259,086
hectares in the review period, representing an increase of 66.4 per cent.
Products financed included: cassava, cotton, maize, rice, soya bean, tomato,
wheat, poultry, cattle and fish. From inception to end-June 2019, N201.97
billion had been disbursed through nineteen (19) Participating Financial
Institutions (PFIs) to 1,140,854 farmers, involved in seventeen (17) crops,

47
livestock and fishery activities. In addition, a total of 255 private and fourteen
(14) state government anchors had participated from inception in 2015 to
end-June 2019.
The amount repaid during the review period was N2.89 billion, representing an
increase of 84.1 per cent above N1.57 billion in the same period of 2018. This
resulted in aggregate repayment of N14.68 billion from inception to end-June
2019. The ABP has created over 2.5 million direct and indirect jobs, promoted
the establishment of new and expansion of existing rice mills, and also
contributed to reduction in food import bill.
2.6.1.1.4 Accelerated Agriculture Development Scheme (AADS)
The Scheme was launched in 2018 as an off-shoot of the ABP with the major
objective of encouraging youths to actively engage in agricultural activities.
It was jointly implemented with state governments, with a target to
productively engage at least 10,000 youths in each state. It commenced
operation in the first half of 2019, with N1.37 billion disbursed to one state
government-owned poultry project.
2.6.1.1.5 Micro, Small and Medium Enterprises Development Fund (MSMEDF)
The Fund serves to channel affordable credit to MSMEs, especially, women
entrepreneurs, to create jobs and enhance productivity.
In the first half of 2019, N625.55 million was disbursed for 1,103 projects,
compared with N4.77 billion for 14,492 projects in the same period in 2018. This
showed decrease of 92.4 and 661.7 per cent in value and number,
respectively. Cumulative disbursement from inception in 2013 to end-June
2019 was N85.70 billion for 216,989 projects. Of this amount, state governments
accessed N58.23 billion (67.9%), while MSMEs (private sector) collectively
accessed N27.47 billion (32.1%). Repayments during the review period
amounted to N3.63 billion, bringing total repayment from inception to N30.19
billion, at end-June 2019.

48
Table 7
Summary of MSMEDF Disbursement and Repayment
Activity
From inception to
Dec. 31, 2018
(₦’ billion)
Jan – June
2019
(₦’ billion)
Cumulative
as at June 2019
(₦’ billion)
Disbursement to MSMEs 27.47 0.01 27.47
Disbursement to State Governments 57.61 0.62 58.23
Total Disbursement 85.08 0.63 85.70
Undisbursed Funds 0.00 0.00 0.00
Repayment Received 26.57 3.63 30.19
Source: CBN
2.6.1.1.6 Agri-business/ Small and Medium Enterprises Investment Scheme
(AGSMEIS)
The Bankers’ Committee established AGSMEIS in 2017 to support the Federal
Government’s efforts at promoting agricultural businesses towards generating
employment. Commercial and merchant banks contributed 5.0 per cent of
their profit after tax, annually, to fund the Scheme. In the first half of 2019, N1.29
billion was disbursed to 595 projects, compared with N111.81 million to 353
projects in the same period of 2018. Aggregate disbursement from inception
in 2017 to end-June 2019 was N1.74 billion for 1,111 projects. Repayment in the
review period was N0.981 million, bringing aggregate repayment from
inception to end-June 2019 to N0.986 million.
2.6.1.1.6.1 Creative Industry Financing Initiative (CIFI)
The Initiative was introduced during the review period as a window under the
AGSMEIS to improve access to long-term, low-interest financing by
entrepreneurs and investors in the creative industry and information
technology (IT) sub-sectors. Activities eligible for financing include fashion,
information technology, software development, movie and music production
and distribution. However, operations had not commenced as at the end of
the review period.
2.6.1.1.7 Youth Entrepreneurship Development Programme (YEDP)
The YEDP was aimed at deepening credit delivery to diligent youth
entrepreneurs, including serving and ex-National Youth Service Corps
members. There was no disbursement in the review period, but from inception

49
in 2016 to end-June 2019, N173.42 million was disbursed for sixty-seven (67)
projects. The sum of N20.65 million was repaid during the review period,
compared with N7.01 million in the corresponding period of 2018. This brought
the cumulative repayment at end-June 2019 to N32.94 million.
2.6.1.1.8 Real Sector Support Facility (RSSF)
This was established in 2014 to provide financing to large-scale enterprises with
high potentials for growth, increase accretion to foreign reserves, expand the
industrial base and diversify the economy. In the first half of 2019, N40.00 billion
was released for one (1) project, compared with N23.91 billion for five (5)
projects in the same period of 2018. Cumulatively, N157.51 billion had been
disbursed to twenty-four (24) projects from inception to end-June 2019. The
sum of N2.90 billion was repaid in the review period, compared with N960.16
million in the first half of 2018. This brought total repayment from inception to
end-June 2019 to N11.81 billion.
2.6.1.1.8.1 Differentiated Cash Reserve Ratio (DCRR) Window of the RSSF
(RSSF-DCRR)
To further improve access to affordable long-term finance in the
manufacturing, agricultural and other highly employment-elastic and growth-
stimulating sectors, the DCRR window was introduced under the RSSF. In the
first half of 2019, eighteen (18) projects were financed with N75.55 billion,
bringing aggregate disbursement to N81.71 billion for 22 projects, from
inception in the second half of 2018 to end-June 2019. All the loans were under
moratorium as at the end of the review period.
2.6.1.1.9 Small and Medium Enterprises Restructuring and Refinancing
Facility (SMERRF)
The SMERRF was established to revive ailing manufacturing companies by
refinancing and restructuring their existing credit facilities with banks. A total of
604 projects accessed N300.1 billion from the Facility before it was
discontinued in December 2014. In the review period, repayments amounted

50
to N12.60 billion. Consequently, cumulative repayments from inception in 2010
to end-June 2019 stood at N132.16 billion.
2.6.1.1.10 Textile Sector Intervention Facility (TSIF)
The Programme is targeted at the revival of the cotton, textile and garment
industry to promote local production of fabrics and create jobs. In the first half
of 2019, no disbursement was made, compared with N19.08 billion disbursed
for two (2) projects in the first half of 2018. Cumulatively, N55.76 billion had
been disbursed for thirty-three (33) projects from inception to end-June 2019.
During the review period, N884.38 million was repaid by six (6) projects, bringing
total repayment from inception to end-June 2019 to N3.11 billion.
2.6.1.1.11 Power and Airline Intervention Fund (PAIF)
The PAIF was designed to stimulate private sector investments in power and
aviation. There was no disbursement in the review period, compared with
N18.74 billion disbursed for four (4) projects in the first half of 2018. From
inception to end-June 2019, N301.37 billion had been disbursed for seventy-
one (71) projects. A breakdown of cumulative disbursement indicated that
forty-seven (47) power projects accounted for N180.61 billion (59.9%) and
twenty-four (24) airline projects accounted for N120.76 billion (40.1%).
Table 8
Summary of PAIF Disbursement and Repayment
S/N
Type No. of Projects
Disbursement
(₦’ billion)
%
Repayment
(₦’ billion)
1 Airline 24 180.61 40.1 76.30
2 Power 47 120.76 59.9 81.95
Total 71 301.37 100.00 158.25
Source: CBN
The sum of N12.72 billion was repaid in the first half of 2019, compared with
N12.35 billion in the same period of 2018. Aggregate repayment from
inception to end-June 2019 stood at N158.25 billion.

51
2.6.1.1.12 Nigeria Electricity Market Stabilisation Facility (NEMSF)
The NEMSF was introduced to provide liquidity to the Nigerian Electricity Supply
Industry (NESI) by settling the shortfall in revenue during the Interim Rules Period
(IRP) up to end-December 2014 and outstanding gas debts or legacy debts
owed by the former Power Holding Company of Nigeria (PHCN). This would
position NESI on the path of sustainable growth and viability.
In the review period, there was no disbursement, compared with N38.53 billion
disbursed to twenty-nine (29) market participants in the first half of 2018,
comprising: one (1) distribution company (DisCo), seventeen (17) generating
companies (GenCos), six (6) gas companies (GasCos) and five (5) service
providers. This was, also, in contrast to N24.34 billion disbursed to thirty-one (31)
market participants in the preceding period of 2018: one (1) DisCo, eighteen
(18) GenCos, six (6) GasCos and six (6) service providers. From inception to
end-June 2019, N183.09 billion had been disbursed to the Nigerian Electricity
Supply Industry Stabilisation Strategy (NESISS) Ltd., to refinance thirty-seven (37)
eligible market participants. The sum of N9.36 billion was repaid in the review
period, compared with N4.99 billion in the corresponding period of 2018. The
total repayment from inception to end-June 2019 amounted to N39.82 billion.
2.6.1.1.13 Nigeria Bulk Electricity Trading Payment Assurance Facility (NBET-
PAF)
This was a bridging facility introduced in 2017 to enable NBET Plc. provide at
least 80.0 per cent payment to GenCos to sustain power supply. The sum of
N98.12 billion was disbursed in the review period, compared with N248.40
billion in the same period of 2018. Total disbursement at end-June 2019 stood
at N623.88 billion.
2.6.1.1.14 CBN-BOI Industrial Facility
This Facility was provided by the Bank to the Bank of Industry (BOI) to enhance
its financing of the industrial sector through investments in value-added
projects. In the first half of the year, there was no disbursement, in contrast to
N50.00 billion disbursed for twenty-seven (27) projects in the corresponding
period of 2018, and N50.00 billion for thirty-three (33) projects in the preceding

52
period of 2018. From inception to end-June 2019, N100.00 billion had been
disbursed for sixty (60) projects.
2.6.1.1.15 National Food Security Programme (NFSP)
The NFSP was introduced to enable large-scale enterprises support the Federal
Government’s Strategic Grains Reserves. The sum of N8.90 billion was disbursed
to two (2) enterprises for two (2) projects in the first half of 2019, compared with
about N4.04 billion released to one (1) enterprise for three (3) projects in the
corresponding period of 2018. Cumulative disbursement from inception in 2017
to end-June 2019 stood at N53.49 billion to four (4) enterprises for eleven (11)
projects. Repayments in the review period amounted to N2.60 billion, raising
cumulative repayments from inception to end-June 2019 to N5.39 billion.
Additionally, over 58,947 outgrowers had been engaged by beneficiary
enterprises.
2.6.1.1.16 Presidential Fertiliser Initiative (PFI)
The Initiative was introduced to increase the production of nitrogen,
phosphorus and potassium (NPK) fertiliser by local blending plants. This was
expected to enhance fertiliser availability and affordability, with a view to
improving farmers’ productivity and creating jobs. In the review period, no
disbursement was made under the Initiative, in contrast to N20.00 billion
disbursed for three (3) projects in the first half of 2018 and N10.00 billion for one
(1) project in the preceding period of 2018. Cumulatively, from inception in
2016 to end-June 2019, N35.00 billion had been disbursed for five (5) projects,
through the Nigeria Sovereign Investment Authority (NSIA), the managing
agent of the Initiative.
2.6.1.1.17 Non-oil Export Stimulation Facility (NESF)
The NESF, which commenced in 2018, was to provide concessionary finance
to exporters for expansion and the promotion of diversification of the
economy. In the first half of 2019, N8.00 billion was disbursed for two (2)
projects, compared with N19.04 billion disbursed for six (6) projects in the same
period of 2018. Aggregate disbursement from inception to end-June 2019 was
N33.49 billion. The sum of N1.00 billion was repaid in the review period,

53
compared with N5.04 billion in the first half of 2018. Cumulative repayment
from inception to end-June 2019 was N6.04 billion.
2.6.1.1.18 Export Development Facility (EDF)
The EDF was introduced in 2018 to finance investments in export-oriented
projects. The Bank underwrote the N50.00 billion debenture issued by the
managing agent, the Nigerian Export Import Bank (NEXIM), to finance the
Scheme. Cumulative disbursement from inception to end-June 2019 was
N50.00 billion. In the first half of 2019, there was no repayment under the
Facility.
2.6.1.1.19 Shared Agent Network Expansion Facility (SANEF)
In collaboration with the Body of Bank Chief Executives, the Bank established
SANEF, as a long-term financing facility to enable CBN-licensed Super Agents
and Mobile Money Operators (MMOs) expand capacity and increase access
points across the country, particularly in highly financially-excluded locations.
The ultimate goal was to accelerate and deepen financial inclusion.
In the first half of 2019, there was no disbursement under the Facility, compared
with N3.75 billion disbursed to eight (8) projects in the corresponding period of
2018. From inception to end-June 2019, the sum of N5.50 billion had been
disbursed for eleven (11) projects.
2.6.2 Credit Guarantee Schemes
2.6.2.1 Agricultural Credit Guarantee Scheme (ACGS)
In the first half of 2019, a total of 11,981 loans valued at N1.68 billion was
guaranteed under the ACGS, compared with 10,420 loans valued at N1.75
billion in the first half of 2018. This showed an increase of 14.9 per cent in volume
but a decline of 4.1 per cent in value guaranteed. A breakdown of the volume
of loans guaranteed by purpose showed that: food crops accounted for 8,183
(68.3%); livestock, 1,171 (9.8%); mixed crops, 702 (5.9%); cash crops, 1,213
(10.1%); fisheries, 444 (3.7%); and ‘others’, 268 (2.2%). An analysis of value of
loans guaranteed by category of borrowers showed that: individuals
accounted for N1.58 billion, (93.7%); informal groups, N98.82 million (5.9%);
cooperatives, nil; and companies, N7.00 million (0.4%), compared with N1.71

54
billion, (97.3%) for individuals; informal groups, N26.02 million (1.5%);
cooperatives, N11.61 million (0.7%); and companies, N9.75 million (0.6%) in the
corresponding period of 2018. The cumulative number of loans guaranteed
from inception of the Scheme in 1978 to end-June 2019 was 1,143,781, valued
at N115.93 billion.
During the review period, a total of 8,676 loans valued at N1.32 billion were
fully repaid, compared with 17,977 loans valued at N3.05 billion in the
corresponding period of 2018. The cumulative repayment from inception to
end-June 2019 was N88.27 billion for 897,944 loans.
Furthermore, only one (1) default claim valued at N0.047 million was settled in
the review period, compared with none in the corresponding period of 2018.
Consequently, the cumulative number of settled default claims at end-June
2019 stood at 17,758, valued at N652.64 million.
2.6.2.1.1 Interest Drawback Programme (IDP)
The Interest Drawback Programme (IDP) was designed to complement the
ACGS by providing a rebate of 40.0 per cent of the market interest rate on
ACGS loans which were repaid as and when due, with a view to reducing the
effective cost of borrowing for farmers, thereby encouraging loan repayment.
In the first half of 2019, a total of 5,760 rebate claims valued at N87.64 million
were settled, compared with 5,929 rebate claims valued at N89.31 million in
the corresponding period of 2018, showing a decrease of 0.69 per cent in
volume, but an increase of 60.23 per cent in value of settled claims. The
number of IDP rebates settled from inception in 2003 to end-June 2019 was
357,300, valued at N3.19 billion.
2.7 Financial Inclusion
The “ownership” indicators under the Payments and Savings in the banking
sector, recorded significant improvement during the review period. The total
number of savings account of banks at end-June 2019 stood at 98.48 million,
indicating an increase of 16.9 per cent above the level in the corresponding
period of 2018. Similarly, total Bank Verification Number (BVN) enrollment
increased from 33.5 million at end-June 2018 to 38.3 million at end-June 2019,

55
representing an increase of 14.3 per cent. During the review period, a total of
2.1 million new bank accounts were opened.
Figure 30
Numbers of Savings Accounts in DMBs and BVN Enrollment
Source: Enhancing Financial Innovation and Access (EFinA) Monthly Returns
2.8 National Collateral Registry (NCR)
The NCR facilitates the use of movable assets as collateral for bank credit. By
reducing emphasis on fixed assets as collaterals, it encourages small-scale
borrowers to use their movable assets, such as stocks, valuables, and
equipment, to obtain credit from financial institutions.
In the first half of 2019, the Registry enrolled 15 financial institutions, comprising
seven (7) microfinance banks, seven (7) non-bank financial institutions, and
one (1) development finance institution on its portal. From inception in 2016 to
end-June 2019, the number of financial institutions registered on the NCR
portal rose to 643, consisting of twenty-one (21) banks, 558 microfinance banks
(MFBs), four (4) merchant banks, five (5) development finance institutions,
nineteen (19) non-bank financial institutions, thirty-five (35) finance companies,
and one (1) non-interest bank.
During the review period, the NCR registered 10,580 financing statements
valued at ₦65.75 billion and US$12.28 million, compared with 7,621 valued at
₦113.34 billion and US$13.38 million registered in the corresponding period of
2018. The financing statements detailed the priority interest of sixty-three (63)
financial institutions in movable assets used as collateral by 19,228 borrowers,
74
,01
2,4
95
79
,46
2,9
98
84
,19
9,1
13
91
,01
2,4
35
98
,48
0,7
19
29
,50
0,0
00
31
,40
0,0
00
33
,50
0,0
00
36
,16
9,6
04
38
,26
8,5
39
0
20,000,000
40,000,000
60,000,000
80,000,000
100,000,000
120,000,000
June 2017 Dec 2017 June 2018 Dec 2018 June 2019
Total No. of Savings Accounts in DMBs Total No. of BVN enrollment

56
compared with forty-two (42) financial institutions that registered financing
statements in respect of 23,953 borrowers in the corresponding period of 2018.
Cumulatively, 50,365 financing statements valued at ₦1.29 trillion, US$1.16
billion and €6.08 million in respect of 177,144 borrowers, had been registered
by 100 financial institutions since inception. An analysis of the number of
borrowers showed that: individuals accounted for 17,275 (89.8%); large
businesses, 58 (0.3%); medium businesses, 232 (1.2%); small businesses, 494
(2.6%); and micro businesses, 1,169 (6.1%).
Table 9
Summary of Financing Statements on the NCR as at end-June 2019
Borrower
Type
No. of borrowers
Number of financing
statements
Currency
Value of financing
statements (₦’million)
Jan - Jun
2019 Cumulative
Jan - Jun
2019 Cumulative
Jan - Jun
2019 Cumulative
Individual 17,275 167,031 9,930 44,100
₦ 19,890.48 149,990.11
US$ 0 0.64
€ 0 0
Large
Business 58 769 49 742
₦ 23,589.22 883,890.94
US$ 7.28 1,147.18
€ 0 6.06
Medium
Business 232 2,434 216 2,389
₦ 20,747.48 232,285.44
US$ 5.00 8.41
€ 0 0
Micro
Business 1,169 4,612 118 1,184
₦ 289.96 5,972.73
US$ 0 0
€ 0 0
Small
Business 494 2,298 267 1,950
₦ 1,230.56 21,132.92
US$ 0 0.12
€ 0 0.02
Total 19,228 177,144 10,580 50,365
₦ 65,747.70 1,293,272.13
US$ 12.28 1,156.35
€ 0 6.08
Source: National Collateral Registry

57
ECONOMIC REPORT
3.0 GLOBAL ECONOMIC DEVELOPMENTS
3.1 Global Output
Global economic activity remained subdued during the first half of 2019. The
International Monetary Fund (IMF) estimated global growth at 3.6 per cent
for 2018, and reviewed downward the global forecast for 2019 at 3.2 per cent
(WEO, July 2019). The growth projection reflected a number of key
developments, including escalating trade tension between the United States
and China, global technology supply chains uncertainty, resulting from US
sanctions and Brexit-related uncertainty. Others were waning global consumer
demand across advanced and emerging market economies, as firms and
households continue to subdue long-term spending, as well as, rising
geopolitical tensions in the Middle-East, which affected energy prices.
In the advanced economies, growth remained modest, despite better-than-
expected surprises in the United States and Japan, as trade tension took a
toll on business confidence, worsening financial market sentiment. Growth in
the advanced economies was expected to decline to 1.9 per cent in 2019,
from 2.2 per cent in 2018. In the United States, real gross domestic product
(GDP) increased by 2.1 per cent in the second quarter of 2019, compared with
3.1 per cent in the first quarter, reflecting a slowdown in business investment.
Growth in the euro area slowed to 0.2 per cent in the second quarter, down
from 0.4 per cent in the first quarter. The slowdown reflected a lull in
manufacturing activities and the impact of global trade tensions.
In the United Kingdom (UK), output grew by 0.5 per cent during the first quarter
of 2019, indicating a 1.8 per cent year-on-year increase. The growth reflected
the offset between the positive contributions from household expenditure,
government consumption and investment, and negative contributions from
net trade. The IMF maintained a downward revision of the UK growth to 1.4
per cent and 1.3 per cent for 2018 and 2019, respectively.
The Japanese economy grew by 0.9 per cent in the first quarter of 2019,
compared with 0.3 per cent in the fourth quarter of 2018, reflecting additional

58
fiscal support to the economy, including measures to mitigate the effects of
the consumption tax slated to commence in October 2019.
In emerging market and developing economies, growth was weaker than
anticipated, following softened global activity on account of intensified US-
China trade and technology tensions, as well as, prolonged uncertainty
surrounding the Brexit.
In China, growth slowed to 6.2 per cent in the second quarter, from 6.4 per
cent in the first quarter of 2019, the slowest pace in almost three decades, as
the trade war with the US took its toll on exports. The IMF revised the Chinese
economic growth to 6.2 per cent for 2019, down from 6.6 per cent in 2018,
despite the country’s resilient domestic demand.
The Russian economy grew by 0.5 per cent in the first quarter of 2019, a lower-
than-expected performance, reflecting weak consumption on the back of
pension age increase. In addition, a higher VAT rate in January and a much
more unpredictable warmer winter, which lowered utilities output, accounted
for the performance.
In sub-Saharan Africa (SSA), growth performance was mixed, with strong
growth in some non-resource-intensive countries offsetting the lackluster
performance of the region’s dominant economies. In addition, higher oil prices
supported a better outlook for oil-exporting countries, including Angola and
Nigeria. Activity in the region portends a favourable outlook for Nigeria’s
economy, as growth was expected to improve from 1.9 per cent in 2018 to 2.3
per cent in 2019. The Nigerian economy grew by 2.01 per cent in the first
quarter of 2019.
The South African economy was expected to slow down, due to a larger-than-
expected effect of strike activity, energy supply issues in mining, and weak
agricultural production.
3.2 Global Commodity Prices
Global commodity prices rebounded in the first quarter of 2019. The
production cuts by OPEC and substantial reduction in world supply, which

59
resulted in increase in oil prices contributed significantly to the upward trend
in global commodity prices. Prices of metal and minerals recovered from losses
experienced in the last quarter of 2018, amidst firming economic activity
prospects for China. The expansion of fiscal stimulus and the resumption of US-
China negotiations early in the year further supported the upward trend in the
global commodity prices. Major prices of agricultural products increased
moderately due to lower harvest. Global crude oil prices increased marginally
from US$65.33 pb at end-December 2018 to US$65.60 pb at end-June 2019.
The Food and Agriculture Organisation (FAO) Food Price Index (FFPI) averaged
173.0 points in June 2019, indicating an increase of 11.30 points (7.0%) over
161.70 points in December 2018. The development was driven, largely, by
weather conditions, sharp increase in maize export prices, increased
expectations of tighter export supplies and high demand for corn in the
production of biofuels and ethanol by the United States. The FAO Cereal Price
Index averaged 173.2 points in June 2019, showing an increase of 5.4 points
(3.2%) above 167.8 points in December 2018, and 7 points (4.2%) above 166.2
points in the corresponding period of 2018.
The FAO Dairy Price Index averaged 199.2 points in June 2019, representing an
increase of 29.2 points (17.2%) above 170.0 points in December 2018. It was,
however, lower by 14.0 points (6.6%), compared with the level in the
corresponding period of the preceding year. The increase in June 2019
reflected higher export demand in the United States and the EU.
The FAO Meat Price Index averaged 176.0 points in June 2019, representing an
increase of 13.6 points (8.4%) above 162.4 points in December 2018,
compared with 169.8 points in the corresponding period of 2018. The increase
was driven, largely, by strong demand, particularly for pig, poultry and ovine
meat, and weak domestic production caused by the spread of swine fever.
The FAO Vegetable Oil Price Index averaged 125.5 points in June 2019,
representing a marginal decrease of 0.30 point (0.2%) lower than 125.8 points
in December 2018, marking its seventh consecutive fall. This represented 20.6
points (14.1%) lower than 146.1 points in the corresponding period of 2018. The

60
decrease was due, primarily, to declining palm oil and soy oil prices, despite a
slight increase in sunflower and rapeseed oil prices.
The FAO Sugar Price Index averaged 183.3 points in June 2019, representing
an increase of 3.7 points (2.1%), higher than 179.6 points in December 2018
and 5.9 points (3.33%) above the corresponding period of 2018. The increase
was due, largely, to the appreciation of the Brazilian real against the United
States dollar, and the decline in exports from the EU.
3.3 Global Inflation
Global consumer prices generally trended downward, owing to decline in
price levels in most advanced, emerging market and developing economies.
Aligning with the slowdown in global consumer demand, core inflation
remained below targets in some advanced countries, including the United
States, the euro area and Japan. Core inflation fell below historical averages
in many emerging market and developing economies, except in a few
countries, such as Argentina, Turkey, and Venezuela. Headline inflation also
slowed down in both developed and emerging market economies,
contributing significantly to the moderation in projected inflation. Despite the
increase in oil prices and higher tariffs in some countries, cost remained muted,
indicating still-tepid wage growth in various economies, even as the labour
market remained tight.
In the advanced economies, inflation moderated, and was expected to drop
to 1.6 per cent in 2019, below the 2.0 per cent in 2018, reflecting the subdued
global economic activities and reduction in commodity prices.
In the euro area, inflation was estimated at 1.3 per cent in June 2019, lower
than 1.4 and 1.7 per cent estimated for January 2019 and April 2019,
respectively. The low inflation recorded during the period under review was
influenced by reduction in the prices of both unprocessed food and energy
products. Inflation, in the euro area, was expected to decline to 1.3 per cent
in 2019, from 1.8 per cent in 2018.
Inflation in the UK moderated to 2.0 per cent in June 2019, from 2.1 per cent in
April 2019, due to a drop in fuel prices. However, the rate was higher than 1.8

61
per cent estimated for January 2019. The rate was anticipated to moderate to
1.8 per cent in 2019, from 2.5 per cent in 2018.
In the United States, inflation was 1.6 per cent in June 2019, same as in January,
but was lower than 2.0 per cent in April 2019, reflecting a drop in energy prices.
In the US, inflation forecast for 2019 was 2.0 per cent, compared with 2.4 per
cent in 2018. It was expected that the US economy would operate above
potential in 2019-2020, with core inflation exceeding the medium-term target
of 2.0 per cent.
In the emerging market and developing economies (excluding Venezuela),
inflation was expected to rise slightly to 4.9 per cent in 2019, from 4.8 per cent
in 2018, reflecting higher value-added tax rate, relatively strong demand
conditions and a modest increase in food inflation in some countries. Over the
medium-term, inflation is set to moderate to about 4.0 per cent, as growth
stabilises across the region.
In China, inflation increased to 2.7 per cent in June 2019, from 2.5 per cent in
April 2019 and 1.7 per cent in January 2019, attributed to the increase in the
prices of food, fruit, pork and non-food items. The rate was projected at 2.3
per cent for 2019, from 2.1 per cent in 2018.
In Japan, inflation decreased to 0.7 per cent in June 2019, from 0.9 per cent in
April 2019, due to a fall in energy prices. However, the rate was relatively higher
than 0.2 per cent for January 2019. Inflation was still below the Bank of Japan’s
target of 2.0 per cent. In Brazil, inflation also trended downward to 3.4 per cent
in June 2019, below 3.8 per cent in January 2019, amidst a slowdown in the
cost of food and non-alcoholic beverages, housing and transport. The IMF
projected inflation to increase in Russia as a result of a higher value-added tax
rate. Inflation was expected to reach 5.0 per cent in 2019 from 2.9 per cent in
2018.
In sub-Saharan Africa, inflation was estimated at 8.1 per cent for 2019, from 8.5
per cent in 2018, though expected to remain at double digits for some large
economies. In Nigeria, inflation fell to 11.2 per cent (year-on-year) in June 2019,

62
from 11.4 per cent in the previous month, reflecting the effect of the CBN’s
monetary policy stance and increase in crude oil prices, which boosted
external reserves and supported the domestic currency. It was expected to
decline from 12.1 per cent in 2018 to 11.7 per cent in 2019.
Similarly, inflation in Angola fell to 16.9 per cent in June 2019, from 17.1 per cent
in the previous month, being the lowest rate since January 2016. The rate was
projected to decline to 17.5 per cent in 2019, from 19.6 per cent in 2018. In
Ghana, inflation fell to 9.1 per cent in June 2019, from 9.4 per cent in the
previous month. It was the lowest rate since January, as prices of both food
and non-food products reduced slightly. Ghana’s headline inflation was
estimated at 9.1 per cent in 2019, compared with 9.8 per cent in 2018.
3.4 International Financial Markets
The global stock markets experienced a sharp reversal during the first half of
2019, after a near bearish performance in the last three months of 2018. The
development was influenced by the general expectation of a resolution of the
U.S. and China trade dispute, early signs of China stimulus taking hold, and an
optimistic shift by the U.S. Fed and other central banks. The market was
generally bearish in Africa, but bullish in other regions.
In North America, the United States S&P 500, Canadian S&P/TSX Composite
and Mexican Bolsa Indices increased by 17.3, 14.4 and 3.7 per cent,
respectively. In South America, the Brazilian Bovespa Stock, Argentine Merval
and Columbian COLCAP indices rose by 13.8, 38.0 and 16.8 per cent,
respectively.
In Europe, the United Kingdom FTSE 100, France CAC 40 and Germany DAX
indices increased by 10.4, 17.1 and 17.4 per cent, respectively. In Asia, Japan’s
Nikkei 225, Shanghai Stock Exchange-A and India’s BSE Sensex indices rose by
6.3, 19.5 and 9.2 per cent, respectively.
In sub-Saharan Africa, the South African JSE All-Share and Egyptian EGX CASE
30 indices increased by 10.4 and 8.2 per cent, respectively, while the Nigerian
NSE All-Share, Kenyan Nairobi NSE 20, and Ghanaian GSE All-Share indices
decreased by 4.7, 7.1 and 4.2 per cent, respectively.

63
Figure 31
Performance of the Naira against Major Currencies
2.55
2.6
2.65
2.7
2.75
2.8
2.85
2.9
2.95
100
250
400
03/0
4/20
17
20/0
4/20
17
08/0
5/20
17
23/0
5/20
17
08/0
6/20
17
23/0
6/20
17
12/0
7/20
17
27/0
7/20
17
11/8
/201
7
28/8
/201
7
14/0
9/20
17
29/0
9/20
17
17/1
0/20
17
01/1
1/20
17
16/1
1/20
17
12/0
4/20
17
19/1
2/20
17
08/0
1/20
18
23/1
/201
8
02/0
7/20
18
22/2
/201
8
03/0
9/20
18
26/3
/201
8
04/1
2/20
18
26/4
/201
8
14/5
/201
8
30/5
/201
8
14/6
/201
8
3/7/
2018
18/7
/201
8
2/8/
2018
17/8
/201
8
5/9/
2018
20/9
/201
8
8/10
/201
8
23/1
0/20
18
11/7
/201
8
11/2
3/20
18
10/1
2/20
18
27/1
2/20
18
14/1
/201
9
29/1
/201
9
13/2
/201
9
28/2
/201
9
15/3
/201
9
1/4/
2019
16/4
/201
9
5/2/
2019
5/17
/201
9
6/6/
2019
6/24
/201
9
Nair
a pe
r Jap
anes
e Ye
n
Naira
per
For
eign
Cur
renc
ies
USD GBP EUR JPY
Source: CBN
Figure 32
Performance of the Naira against Regional Currencies
0.3000
0.3500
0.4000
0.4500
0.5000
0.5500
0.6000
350.0000
370.0000
390.0000
410.0000
430.0000
450.0000
470.0000
01/0
2/20
18
15/1
/201
8
26/1
/201
8
02/0
8/20
18
21/2
/201
8
03/0
6/20
18
19/3
/201
8
3/4/
2018
16/4
/201
8
27/4
/201
8
11/5
/201
8
24/5
/201
8
7/6/
2018
22/6
/202
0
5/7/
2018
18/7
/201
8
31/7
/201
8
11/8
/201
7
28/8
/201
8
10/9
/201
8
21/9
/201
8
5/10
/201
8
18/1
0/20
18
31/1
0/20
18
11/1
3/20
18
11/2
7/20
18
12/1
0/20
18
21/1
2/20
18
8/1/
2019
21/1
/201
9
1/2/
2019
14/2
/201
9
27/2
/201
9
12/3
/201
9
25/3
/201
9
5/4/
2019
18/4
/201
9
5/6/
2019
5/17
/201
9
5/31
/201
9
6/18
/201
9
Nai
ra p
er C
FA F
ranc
Nai
ra p
er W
AU
A
WAUA CFA
Source: CBN

64
Table 10
Indices of Selected International Stock Markets
(As at End-June 2019)
The global foreign exchange market witnessed appreciation of major
currencies against the U.S. dollar during the first half of 2019. The depreciation
of the U.S dollar was, attributed largely, to the weakening global output growth
amidst prevailing uncertainties from headwinds. These included further
escalation of trade tensions between the US and China, in addition to the
trend of declining long term yields in the United States, which resulted in
increased capital inflow to emerging market and developing economies.
In South America, the Brazilian real and Colombian peso appreciated by 0.52
and 1.18 per cent, respectively, while the Argentine peso depreciated by
11.26 per cent. Most currencies in Europe depreciated during the review
period. The Russian ruble appreciated by 10.26 per cent, while the pound
sterling and the euro depreciated by 0.50 and 1.14 per cent, respectively. In
North America, the Mexican peso and the Canadian dollar appreciated by
3.82 and 2.24 per cent, respectively.
Country Index End-Dec, 2017 End-Dec, 2018 End-June, 2018
% Change
End-Dec 2017 -
End-Jun 2019
% Change End-
Dec 2018 - End-
Jun 2019
AFRICA
Nigeria ASI 38,243.19 31,430.50 29,966.87 -21.64 -4.66
South Africa JSE African AS 59,504.67 52,736.86 58,203.84 -2.19 10.37
Kenya Nairobi NSE 20 3,711.94 2,833.84 2,633.32 -29.06 -7.08
Egypt EGX CSE 30 15,019.14 13,035.77 14,100.74 -6.11 8.17
Ghana GSE All Share 2,579.72 2,499.33 2,394.82 -7.17 -4.18
NORTH AMERICA
US S&P 500 2,673.61 2,506.85 2,941.76 10.03 17.35
Canada S&P/TSX Composite 16,209.13 14,322.86 16,382.20 1.07 14.38
Mexico Mexico Bolsa (IPC) 49,354.42 41,640.27 43,161.17 -12.55 3.65
SOUTH AMERICA
Brazil Bovespa Stock 76,402.08 87,887.26 100,000.97 30.89 13.78
Argentina Merval 30,065.61 30,292.55 41,796.36 39.02 37.98
Colombia COLCAP 1,513.65 1,325.93 1,548.98 2.33 16.82
EUROPE
UK FTSE 100 7,687.77 6,728.13 7,425.63 -3.41 10.37
France CAC 40 5,312.56 4,730.69 5,538.97 4.26 17.09
Germany DAX 12,917.64 10,558.96 12,398.80 -4.02 17.42
ASIA
Japan NIKKEI 225 22,764.94 20,014.77 21,275.92 -6.54 6.30
China Shanghai SE A 3,463.48 2,611.38 3,119.99 -9.92 19.48
India BSE Sensex 34,056.83 36,068.33 39,394.64 15.67 9.22
Source: Bloomberg

65
In Asia, the Japanese yen, Chinese renminbi and Indian rupee appreciated
by 1.63, 0.15 and 0.10 per cent, respectively. The appreciation of the yen
against the dollar was due, largely, to Japan's economic recovery, which
attracted more investors.
In Sub-saharan Africa, the Nigerian naira, the South African rand and the
Egyptian pound appreciated by 0.03, 1.92 and 7.37 per cent, respectively,
while the Kenyan shilling and the Ghanaian cedi depreciated by 0.44 and
10.05 per cent, respectively.
Table 11
Exchange Rates of Selected Countries
(Value in Currency Units to US$)
Source: Bloomberg
YoY = Year on Year
YTD = Year to Date
3.5 Global Economic Outlook for the Rest of 2019
The IMF projected global growth to slow to 3.2 per cent in 2019, from 3.6 per
cent in 2018 (WEO, July 2019). The advanced economies were projected to
Currency End-June
2018
End-
December
2018
End-June
2019
End-Dec, 2018 -
End-Jun, 2019 %
(YTD) App/Dep
Y-on-Y %
App/Dep
AFRICA
Nigeria Naira 305.75 307.00 306.90 0.03 -0.37
South Africa Rand 13.73 14.35 14.08 1.92 -2.49
Kenya Shilling 101.01 101.85 102.30 -0.44 -1.26
Egypt Pound 17.92 17.92 16.69 7.37 7.37
Ghana Cedi 4.73 4.92 5.47 -10.05 -13.53
NORTH
AMERICA
Canada Dollar 1.31 1.36 1.31 3.82 0.00
Mexico Peso 19.91 19.65 19.22 2.24 3.59
SOUTH
AMERICA
Brazil Real 3.88 3.87 3.85 0.52 0.78
Argentina Peso 28.93 37.66 42.44 -11.26 -31.83
Colombia Peso 2,930.50 3,249.75 3,211.86 1.18 -8.76
EUROPE
UK Pound 0.76 0.78 0.78 -0.50 -3.05
Euro Area Euro 0.86 0.87 0.88 -1.14 -2.27
Russia Ruble 62.74 69.72 63.23 10.26 -0.77
ASIA
Japan Yen 110.76 109.69 107.93 1.63 2.62
China Yuan 6.62 6.88 6.87 0.15 -3.64
India Rupee 68.47 69.77 69.70 0.10 -1.76

66
grow by 1.9 per cent in 2019, compared with 2.2 per cent in 2018, due, largely,
to upward revision for the United States. Inflationary pressures generally
softened, reflecting weak global activity, and in some cases, mounting
disinflationary pressures, increased debt service burdens and constrained
monetary policy space. In these circumstances, accommodative monetary
policy remains appropriate. In the United States, growth was projected at 2.6
per cent in 2019, from 2.9 per cent in 2018. In the euro area, growth was
projected at 1.3 per cent in 2019, compared with 1.9 per cent in 2018. The IMF’s
projections for other advanced economies, such as the United Kingdom,
Japan and Canada, were similar, with reduced optimism for 2019. The gloomy
outlook for 2019 was on account of the escalating trade tensions between the
United States and China and Brexit-related uncertainty, that significantly
weakened consumer and business confidence, as well as, global trade.
In the emerging market and developing economies, growth was projected to
weaken to 4.1 per cent in 2019, from 4.5 per cent in 2018, on account of the
negative effects of escalating tariffs, declining external demand and other
idiosyncratic developments in the region.
The Chinese economy was projected to grow by 6.2 per cent in 2019,
compared with 6.6 per cent in 2018, reflecting the impact of its ongoing trade
tension with the United States. Growth in the Indian economy was projected
at 7.0 per cent in 2019, compared with 6.8 per cent in 2018, driven, mainly, by
domestic demand.
In Brazil, growth was projected to slow to 0.8 per cent in 2019, from 1.1 per cent
in 2018, due to weak sentiment from uncertainties surrounding the approval of
pension and other structural reforms.
In sub-Saharan Africa, growth was projected at 3.4 per cent in 2019, from 3.1
per cent in 2018, due to high oil prices. The optimistic outlook for the region
reflected improved prospects for the Nigerian economy, projected to grow
from 1.9 per cent in 2018 to 2.3 per cent in 2019. The South African economy
was projected to slow-down to 0.7 per cent in 2019, from 0.8 per cent in 2018.

67
4.0 DEVELOPMENTS IN THE DOMESTIC ECONOMY
4.1 Monetary and Credit Developments
The domestic economic indicators remained, largely, stable in the first half of
2019, with real GDP growth at 2.01 per cent in the first quarter, compared with
growth of 1.89 per cent in the corresponding period of 2018. Inflation
moderated and the exchange rate was stable. The Bank relaxed its monetary
policy stance in March 2019, to encourage credit flow to the productive
sectors of the economy and stimulate economic growth. The monetary policy
committee (MPC) reduced the monetary policy rate (MPR) by 50 basis points
to 13.50 per cent, but retained the cash reserve ratio at 22.50 per cent, liquidity
ratio at 30.00 per cent and the asymmetric corridor of +200/-500 basis points
around the MPR for the standing lending and deposit facilities, respectively.
4.1.1 Reserve Money
At N 8,088,46 billion, reserve money rose by 13.4 per cent above its level at
end-December 2018, in contrast to a decrease of 1.9 per cent at the end of
the corresponding period of 2018. The development reflected the growth in
domestic assets of the CBN, which more than offset the 3.4 per cent decline in
NFAs. The rise in domestic assets resulted from significant increase in net claims
on the Federal Government (247.8 per cent) and on other sectors of the
economy (15.8 per cent). The corresponding rise in the Bank’s liabilities
resulted, wholly, from the increase in total bank reserves.
Aggregate credit (net) to the domestic economy rose by 17.3 per cent at end-
June 2019, driven by the increase in net claims on the Federal Government
and credit to the private sector. Growth in consumer credit rose in tandem
with the increase in credit to the private sector and constituted 3.3 per cent of
total credit to the core private sector, in the first half of 2019.

68
Table 12
Sources and Uses of Reserve Money
Dec 16 Jun 17 Dec 17 Jun 18 Dec 18 Jun 19
Foreing assets (net) 8,790.7 8,378.9 15,134.6 17,844.1 18,181.5 17,569.4 Foreign Assets 9,248.6 9,449.9 15,313.3 18,204.7 18,182.2 17,658.8
Foreign Liabilities 458.0 1,071.0 178.6 360.7 0.8 89.4
Domestic Assets (net) (1,854.0) (2,103.0) (5,413.9) (8,086.0) (7,626.0) (7,676.8) Net credit to Government 409.5 728.7 284.8 198.6 998.8 3,473.5 Net Claims on Private Sector (3,895.7) (4,517.1) (7,370.0) (10,060.3) (10,978.9) (12,710.4) Claims on Banks 1,632.1 1,685.3 1,669.2 1,775.7 2,354.2 1,560.1 Other Assets (net) (1,088.7) (795.7) (3,236.4) (3,397.6) (3,419.8) (1,804.1)
RESERVE MONEY 5,847.9 5,480.2 6,484.3 6,360.5 7,135.7 8,088.5 Currency in Circulation 2,179.2 1,873.5 2,157.2 1,900.7 2,329.7 2,014.1 Banks Reserves 3,668.7 3,606.7 4,327.1 4,459.8 4,806.0 6,074.4
Reserve Money 5,847.9 5,480.2 6,484.3 6,360.5 7,135.7 8,088.5 Source: CBN
Figure 33 (a)
Reserve Money and its Components: Sources
(N’ Billion)
Source: CBN
(8,000.00)
(4,000.00)
-
4,000.00
8,000.00
12,000.00
16,000.00
20,000.00
Dec 16 Jun 17 Dec 17 Jun 18 Dec 18 Jun 19
N'b
illio
n
RM NFA NDA OIN

69
Figure 33 (b)
Reserve Money and its Components: Uses
(N’ Billion)
Source: CBN
4.1.2 Broad Money (M3)
Broad money supply (M3) grew by 5.0 per cent to N35,018.77 billion at end-
June 2019, compared with 2.4 per cent at end-June 2018. The development
resulted from the respective growth of 17.3 and 0.4 per cent in net domestic
credit and foreign assets (net) of the banking system.
4.1.3 Broad money (M2)
Broad money supply (M2) grew by 3.0 per cent to N 27,892.32 billion at end-
June 2019, compared with 2.8 per cent at the end of the corresponding
period of 2018. Growth in quasi money of 9.3 per cent accounted majorly for
the growth in M2.
4.1.3.1 Quasi Money
Quasi money grew by 9.3 per cent to N16,733.20 billion at end-June 2019,
compared with 8.9 per cent at the end of the corresponding period of 2018.
This was due to the growth in savings and time deposits with banks, particularly
foreign currency deposits, which rose by 12.4 per cent.
4.1.4 Narrow Money (M1)
Narrow money supply (M1) fell by 5.1 per cent to N11,159.10 billion at end-June
2019, compared with 4.3 per cent at the end of the corresponding period of
2018. The development was due to the respective decline of 13.7 and 3.4 per
cent in currency outside banks and demand deposits.
-
2,000.00
4,000.00
6,000.00
8,000.00
10,000.00
Dec 1
6
Jun
17
Dec 1
7
Jun
18
Dec 1
8
Jun
19
N'b
illio
n
RM CIC RM2

70
4.1.5 Currency-in–Circulation (CIC) and Deposits at the CBN
Currency-in-circulation fell by 13.6 per cent to N2,014.10 billion, compared with
11.9 per cent at end-June 2018. Bank reserves, on the other hand, grew by 26.4
per cent to N6,074.40 billion, compared with the growth of 3.1 per cent at the
end of the first half of 2018. As a proportion of reserve money, CIC and bank
deposits constituted 24.9 and 75.1 per cent, respectively.
4.1.6 Currency Outside Banks (COB)
Currency outside banks fell by 13.7 per cent to N1,651.10 billion at end-June
2019, compared with the decline of 14.7 per cent at end-June 2018. This
reflected increased use of electronic payments channels during the review
period. As a percentage of broad money (M3), COB constituted 5.9 per cent,
compared with 6.1 per cent at end-June 2018.
4.1.7 Demand Deposits
Demand deposits fell by 3.4 per cent to N9,508.03 billion at end-June 2019,
compared with 2.3 per cent at the end of the corresponding period of 2018.
The decline in demand deposits reflected growth in electronic mode of
payments.
Figure 34
Ratio of Currency Outside Bank to Broad Money Supply
Source: CBN
0.00
2.00
4.00
6.00
8.00
10.00
12.00
14.00
16.00
18.00
Dec 16 Jun 17 Dec 17 Jun 18 Dec 18 Jun 19
Pe
r ce
nt
COB/ M3 COB/ M1

71
Figure 35
Growth in Money Supply
(Per cent)
Source: CBN
4.1.8 Drivers of Growth in Money Supply
4.1.8.1 Net Foreign Assets (NFA)
Net foreign assets of the banking system grew by 0.4 per cent to N18,471.24
billion at the end of the review period, compared with 18.2 per cent at end-
June 2018. The contribution of NFA to the growth of M3 was 0.2 percentage
point, compared with the contribution of 9.8 percentage points at end-June
2018.
4.1.8.2 Net Domestic Credit (NDC)
Net domestic credit (NDC) grew by 17.3 per cent to N32,332.63 billion at end-
June 2019, in contrast to the decline of 3.3 per cent at the end of the
corresponding period of 2018. This resulted from the growth of 55.8 per cent in
net claims on the Federal Government and the 9.0 per cent increase in private
sector credit. Consequently, NDC contributed 14.3 percentage points to the
growth in broad money supply, in contrast to the negative contribution of 2.9
percentage points at end-June 2018.
Figure 36
Distribution of Aggregate Credit to the Economy
(N’ Billion)
(40.00)
(20.00)
-
20.00
40.00
60.00
80.00
Dec 16 Jun 17 Dec 17 Jun 18 Dec 18 Jun 19
Per c
ent
Claims on Private Sector Claims on Federal Government
Source: CBN
-15.00-10.00
-5.000.005.00
10.0015.0020.0025.0030.0035.00
Dec 16 Jun 17 Dec 17 Jun 18 Dec 18 Jun 19
Pe
r ce
nt
M3 M1

72
4.1.8.2.1 Net Credit to the Government (NCG)
Net claims on the Federal Government grew by 55.8 per cent to N7,581.50
billion at the end of the first half of 2019, in contrast to the decline of 22.9 per
cent at the end of the corresponding half of 2018. This was due, largely, to
increased holdings of government treasury bills of 704.8 and 6.7 per cent by
the CBN and banks, respectively. Consequently, the contribution of net claims
on the Federal Government to the growth of total monetary assets was 8.4
percentage points, in contrast to a negative contribution of 2.9 percentage
points at end-June 2018.
4.1.8.2.2 Credit to the Private Sector (CP)
Credit to the private sector grew by 9.0 per cent to N24,751.13 billion at end-
June 2019, in contrast to a decrease of 0.04 per cent at the end of the
corresponding period of 2018. The development was due to the 2.7 and 9.5
per cent growth in claims on state and local Governments and claims on the
core private sector, respectively. The contribution of claims on the private
sector to the growth of total monetary assets was 6.1 percentage point, in
contrast to the negative contribution of 0.03 percentage point in the second
half of 2018.
4.1.8.3 Other Assets (net) (OAN)
Other assets (net) of the banking system fell by 25.2 per cent at end-June 2019,
compared with negative 10.2 per cent at the end of the corresponding period
of 2018. This was caused by the decline in unclassified assets of the CBN. The
contribution of other assets (net) of the banking system to the growth of broad
money was negative 9.5 percentage points at the end of the review period,
compared with negative 4.5 percentage points at the end of the
corresponding period of 2018.

73
Table 13
Growth in Monetary Aggregates
Over Preceding December (Per cent)
Dec ‘16 Jun ‘17 Dec ‘17 Jun ‘18 Dec ‘18 Jun ‘19
Domestic Credit (Net) 24.27 1.41 (3.45) (3.25) 6.34 17.26
Claims on Federal Government (Net) 68.59 7.69 (25.32) (22.92) 33.72 55.80
Claims on Private Sector 17.42 0.02 1.40 (0.04) 1.87 9.00
Foreign Assets (Net) 61.85 (7.45) 69.63 18.15 18.54 0.40
Other Assets (Net) (71.58) (10.54) (39.43) (10.17) 1.31 (25.15)
Total Monetary Assets (M3) 31.23 (0.64) 0.59 2.35 16.36 4.97
Quasi-Money 7.52 (4.30) 5.23 8.85 18.13 9.25
Money Supply (M1) 31.50 (9.59) (0.85) (4.25) 5.16 (5.05)
Total Monetary Assets (M3) 31.23 (0.64) 0.59 2.35 16.36 4.97
Source: CBN
4.1.9 Sectoral Distribution of Credit
Of the total banks’ claims on the core private sector, credit to the priority
sectors (agriculture, industry and construction), constituted 4.2, 39.6 and 4.4
per cent, respectively, of the total in June 2019, compared with 3.4, 38.6 and
4.0 per cent, in June 2018. As in the corresponding period of 2018, oil & gas
accounted for the largest share of the industrial sector with 22.0 per cent, while
mining and quarrying explained the least at 0.1 per cent. Manufacturing and
power & energy sub-sectors accounted for 15.3 and 2.2 per cent, respectively,
of the total credit at end-June 2019.

74
Table 14
Share of Credit to the Core Private Sector, 2018 – 2019 (per cent)
Item
Share
in Total
Share
in total %Change
Jun18 Jun19 Jun18 Jun 19 1&2
N Billion N Billion
1 2 3 4
Agriculture 523.08 636.08 3.42 4.2 21.60
Industry 5,899.92 5,991.84 38.59 39.59 1.56
Mining & Quarrying 10.18 8.66 0.07 0.06 -14.93
Manufacturing 2,018.97 2,318.17 13.2 15.32 14.82
Oil & Gas 3,454.43 3,329.47 22.59 22.0 -3.62
Power and Energy 416.34 335.54 2.72 2.72 -19.41
Construction 612.85 664.87 4.01 4.39 8.49
Trade/General Commerce 1,044.36 994.18 6.83 6.57 -4.80
Government 1,474.13 1,323.64 9.64 8.75 -10.21
Services 5,786.60 5,522.25 37.85 36.49 -4.57
Real Estate 744.56 582.96 4.87 3.85 -21.70
Finance, Insurance and Capital Market 991.22 1131.3 6.48 7.48 14.13
Education 71.85 60.38 0.47 0.4 -15.96
Oil & Gas 1,235.66 1,061.73 8.08 7.02 -14.08
Power and Energy 319.91 295.48 2.09 1.95 -7.64
Others 2,423.40 2,390.42 15.85 15.8 -1.36
of which: i. General 942.68 1,015.49 6.17 6.71 7.72
ii. Information & Communication 814.57 689.2 5.33 4.55 -15.39
iii. Transportation & Storage 304.45 317.07 1.99 2.1 4.15
Total Private sector Credit 15,289.47 15,134.20 100 100 -1.02
Source: CBN
4.1.10 Maturity Structure of DMBs’ Outstanding Loans and Advances, and
Deposit Liabilities
Analysis of the structure of bank’s credit in the first half of 2019, indicated that
credit of short-term maturities remained dominant. Credit maturing within one
year accounted for 47.0 per cent, compared with 44.1 per cent at end-June
2018. The medium-term (equal to or greater than 1year but less than 3 years)
and long-term (3years and above) maturities stood at 18.9 and 34.1 per cent,
respectively, compared with 19.3 and 36.6 per cent at the end of the
corresponding period of 2018.

75
Figure 37
Distribution of Bank Loans and Advances by Maturity
Source: CBN
Similarly, deposits of less than one-year maturity constituted 87.7 per cent (of
which 69.2 per cent had maturity of less than 30 days), compared with 89.1
per cent at the end of the first half of 2018. Further analysis showed that the
medium and long-term deposits constituted 4.2 and 8.1 per cent, respectively,
compared with 3.6 and 7.3 per cent at end-June 2018. Consequently, loan-
to-deposit ratio stood at 60.2 per cent at end June 2019, compared with 79.0
per cent at end-June 2018, and reflected holdings of government securities
by banks and claims on the core private sector.
Figure 38
Maturity Structure of Bank Deposits (per cent)
Source: CBN
0.00
5.00
10.00
15.00
20.00
25.00
30.00
35.00
40.00
45.00
50.00
Dec '16 Jun '17 Dec '17 Jun '18 Jun '19
Short-Term Medium-Term Long-Term
0.00
2.00
4.00
6.00
8.00
10.00
82.00
84.00
86.00
88.00
90.00
92.00
94.00
96.00
98.00
Dec 16 Jun '17 Dec 17 May '18 Jun' 18 Jun 19
Per
cent
Per
cent
Short term Medium Term(rhs) Long-Term(rhs)

76
Table 15
Maturity Structure of Banks Assets and Liabilities
Assets (Loans and Advances) Jun 16 Dec
16
Jun 17 Dec 17 Jun 18 Dec
18
Jun 19
Tenor
0-30 days 26.6 27.3 27.9 25.6 25.3 25.2 28.1
31-90 days 7.1 6.8 6.6 7.8
6.8 9.3 7.6
91-181 days 7.5 7.2 4.7 5.3 5.9 4.4 4.7
181-365 days 4.7 5.1 4.4 5.0 6.1 8.3 6.6
Short-Term 46.0 46.4 43.7 43.65
44.06 47.14
47.00
Medium-Term (Above 1yr and
below 3yrs) 18.1 20.7 18.4 18.0 19.3 17.4
18.9
Long-Term (3 Years and Above)
35.9 32.9 37.9 38.4
36.6 35.4
34.1
100 100 100 100 100 100 100
Liabilities
0-30 days 75.45 75.91 74.87 74.37 70.25 72.92 69.20
31-90 days 12.69 11.83 12.88 12.92 12.42 10.06 11.61
91-181 days 4.02 4.38 4.71 4.84
3.99 3.22
4.47
181-365 days 3.16 3.51 3.61 3.71
2.41 1.86
2.41
Short-Term 95.32 95.62 96.07 95.85
89.07 88.06
87.69
Medium-Term (Above 1yr and
below 3yrs) 1.83 1.23 0.97 1.32
3.59
3.83
4.24
Long-Term (3 Years and Above) 2.85 3.15 2.95 2.83
7.34 8.11
8.07
Total 100 100 100 100 100 100 100
Source: CBN
4.1.11 Market Structure of the Banking Industry
The structure of Nigerian banking system remained oligopolistic in the first half
of 2019, with the concentration ratios of the largest six banks (CR6) at 63.6 in
deposits and 52.6 in assets. However, there was no dominance of a single
bank, as the share of the largest in deposits and assets stood at 14.9 and 13.2
per cent, respectively, compared with 12.5 and 14.5 per cent in the first half of
2018. Nineteen (19) banks had percentage shares ranging from 0.01 to 4.3 per
cent in deposits and 0.1 to 4.2 per cent in assets, compared with 0.1 to 5.2 per
cent and 0.1 to 5.1 per cent, respectively in the corresponding period of 2018.
The absence of dominance of any bank in the market was further indicated

77
by the Herfindhal Hirschman Indices (HHI) of 664.08 (on a scale of 100 to 10,000)
in deposits and 608.64 in assets, compared with 732.7 and 846.1 respectively,
in the first half of 2018.
Figure 39a
Market Concentration Ratios of Banks (Assets and Deposits)
0
10
20
30
40
50
60
70
Jun 16 Jun 17 Jun 18 Jun 19
Per
cen
t
CR6(Deposits) CR6(Assets) CR(Largest-Deposits) CR (Largest-Assets)
Source: CBN
Figure 39b
Measures of Competition in Banks: Herfindahl- Hirschman Index
0
200
400
600
800
1000
Jun 16 Jun 17 Jun 18 Jun 19
HH
I
HHI (Deposits) HHI (Assets)
Source: CBN
Source: CBN
4.1.12 Consumer Credit
At N753.9 billion, consumer credit rose by 12.8 per cent at the end of the review
period, in contrast to the decline of 1.4 per cent at the end of the
corresponding period of 2018. At that level, consumer loans constituted 3.3 per

78
cent of total credit to the core private sector, in the first half of 2019, compared
with 3.0 per cent at the end of the corresponding half of 2018.
Figure 40
Consumer Credit and Ratio of Claims on Core Private Sector
(N’ Billion)
Source: CBN
4.1.13 Money Market Developments
In the first half of 2019, activities in the money market reflected the trend in
liquidity flow in the banking system. Liquidity was influenced, largely, by the
fiscal operations of the Federal Government, effects of CRR, maintenance
period settlement for foreign exchange intervention, maturity of CBN bills and
monetised proceeds from the sale of crude oil (FAAC disbursement). The Bank
also sustained its intervention in the foreign exchange market and retained the
Investors’ and Exporters’ (I&E) window to boost foreign exchange supply from
autonomous sources. Open Market Operations (OMO) remained the major
instrument for liquidity management, complemented by cash reserve ratio
(CRR), standing facilities window and interventions in the foreign exchange
market.
4.1.13.1 Money Market Assets Outstanding
Money market assets outstanding stood at N12,244.48 billion at the end of the
first half of 2019, indicating a decrease of 2.9 per cent, below the level in the
corresponding half of 2018. The development reflected, mainly, decline of
16.0, 3.6 and 2.9 per cent in Bankers’ Acceptances, FGN Bonds and
Commercial Paper outstanding, respectively.
0.00
1.00
2.00
3.00
4.00
5.00
-
200.00
400.00
600.00
800.00
1,000.00
Jun16 Dec 16 Jun 17 Dec 17 Jun 18 Dec 18 Jun 19
Rat
io (
%)
N' B
illio
n
Consumer Credit Ratio of claims on core private sector(rhs)

79
A breakdown of the total money market assets outstanding showed that 77.5
per cent was held in FGN Bonds, 21.65 per cent in NTBs, while Certificate of
Deposits, Commercial Paper and Bankers Acceptances accounted for the
balance.
Figure 41
Money Market Assets Outstanding (End-June 2019)
Source: CBN
4.1.13.2 Primary Market
Total NTBs issued and allotted was N1,473.84 billion apiece, indicating a
decrease of N179.52 billion or 10.9 per cent below the level in the
corresponding period of 2018. The decrease was attributed to fewer NTB issues
and increased OMO auctions in the review period. Total public subscription,
however, stood at N4,153.63 billion, compared with N3,223.36 billion in the
corresponding period of 2018. The rise in the level of public subscription was
attributed to the increased level of liquidity in the banking system.
The structure of holdings of the instrument indicated that banks, including
foreign investors, took up N766.37 billion or 52.0 per cent, Mandate and Internal
fund customers, including CBN Branches, N494.13 billion or 33.5 per cent and
merchant banks, N52.94 billion or 3.6 per cent.
The successful bid rates in the market ranged from 9.60 to 11.00 per cent for
the 91-day, 11.89 to 13.50 per cent for the 182-day and 12.02 to 15.00 per cent
for the 364-day tenors. The range of successful bid rates in the corresponding
period of 2018 was 10.00 to 12.55 per cent for the 91-day, 10.30 to 13.93 per
cent for the 182-day and 10.70 to 14.30 per cent for the 364-day tenors. The
21%
77.51%
0.83%
NTB FGN Bond Others

80
development was, largely, on account of the level of liquidity in the banking
system and the prevailing monetary policy stance.
4.1.13.3 Structure of Outstanding Nigerian Treasury Bill Holdings
Treasury bills outstanding stood at N2,651.51 billion at end-June 2019,
compared with N2,953.58 billion at end-June 2018. The structure of holdings
indicated that banks accounted for 41.7 per cent of the total at end-June
2019, compared with 27.6 per cent in the corresponding period of 2018.
Mandate (parastatals) and Internal Funds customers accounted for 45.5 per
cent, merchant banks 0.8 per cent, while the CBN accounted for 12.0 per
cent.
Figure 42
Nigerian Treasury Bills Outstanding
(N’ Billion)
Source: CBN
4.1.13.4 Federal Government of Nigeria Bonds
The total value of FGN Bonds offered to the public was N700.00 billion, while
public subscription and sale stood at N1,160.45 billion and N615.39 billion,
respectively. The amount offered comprised new issues and re-openings of
FGN Bonds. In the same period of 2018, FGN Bonds issues, subscription and
allotment amounted to N500.00 billion, N829.42 billion and N425.35 billion,
respectively. The increase in issues, subscriptions and allotment was attributed,
largely, to Government’s preference for longer tenored domestic debt,
relative to shorter tenored instruments such as Treasury Bills.
Consequently, the total value of FGN Bonds outstanding at end-June 2019
stood at N10,171.29 billion, compared with N9,407.53 billion at end-June 2018,
2,825.00 2,901.80 2,929.25 2,953.582,651.51
0.00
500.00
1,000.00
1,500.00
2,000.00
2,500.00
3,000.00
3,500.00
First Half 2015 First Half 2016 First Half2017 First Half 2018 First Half 2019
N' B
illio
n

81
indicating an increase of N763.76 billion or 8.1 per cent. The structure of
holdings showed that N3,669.98 billion or 36.1 per cent was held by
commercial banks, N170.48 billion or 1.7 per cent by merchant banks, and the
balance of N6,330.83 billion or 62.2 per cent held by non-bank public.
Figure 43
Distribution of FGN Bonds
(End-June 2019, per cent) Source: CBN
4.1.13.5 Open Market Operations (OMO)
Open Market Operations remained the core instrument for liquidity
management during the review period.
4.1.13.6 OMO Auctions
Total amount of CBN bills worth N11,751.64 billion was issued in the first half of
2019. Public subscription and sale amounted to N13,054.31 billion and
N11,827.64 billion, respectively, compared with N13,972.84 billion issued
N11,651.25 billion and N9,743.76 billion, subscribed to, and allotted, in the first
half of 2018. The high level of activity was attributed, largely, to the increased
monthly disbursements to the three-tiers of government, huge amount of CBN
bills maturities, and increased number of auctions during the period.
Consequently, the cost of liquidity management, in the review period, rose to
N1,284.08 billion, compared with N848.32 billion in the corresponding period of
2018.
DMBs & Merchant37.76%
Non-Bank Public62.24%
DMBs & Merchant Non-Bank Public

82
4.1.13.7 The Two-Way Quote Trading in NTBs
There was no transaction during the review period, same as in the
corresponding period of 2018. The absence of trading was due to the shift in
the Bank’s operational strategy.
4.1.13.8 Tenored Repurchase Transactions
Total request for repo transactions for the first half of 2019 amounted to N611.30
billion, while the applicable interest rates ranged from 18.50 to 19.50 per cent
for the 4- to 90-day tenors, from January 01 to March 25, 2019, and 18.00 to
19.00 per cent from March 26 to June 30, 2019. Consequently, total interest
earned on repo was N19.25 billion. In the preceding half year, request for repo
amounted to N240.73 billion at the range of 18.50 to 19.50 per cent for the
same tenors, while interest earned stood at N6.53 billion. The increased activity
in 2019 reflected preference for tenored funds, relative to overnight facility.
4.1.13.9 Discount Window Operations
Within the period under review, CBN Bills worth N54.44 billion with 170 to 352
days to maturity were rediscounted at the rate of 13.50 per cent, while interest
earned was N6.59 billion. There was no request for the rediscounting of CBN
Bills in the corresponding period of 2018.
4.1.13.9.1 Over the Counter (OTC) Transactions
OTC transactions in NTBs during the first half of 2019 amounted to N44,794.05
billion, indicating an increase of N9,864.81 million or 28.2 per cent over the level
of N34,929.23 billion in the first half of 2018. The increase was attributed, largely,
to improved patronage from foreign and institutional investors.
OTC transactions in FGN Bonds during the first half of 2019 amounted to
N7,052.72 billion, indicating an increase of N1,461.14 million or 26.1 per cent
over the level of N5,591.59 billion in the same period of 2018. The trend was
traced to the active participation of both local and foreign investors.
4.1.13.9.2 CBN Standing Facilities
The trend at the standing facilities window, Standing Lending Facility (SLF) and
Standing Deposit Facility (SDF), showed less frequent recourse to the SLF in the

83
first half of 2019, compared with the corresponding period of 2018. Meanwhile,
the threshold for daily deposits per institution at the SDF Window remained N7.5
billion, in accordance with the Bank’s quest to curtail unrestrained requests by
market participants and encourage lending to the real sector of the economy.
Applicable rates at the SLF and SDF windows were 16.00 and 9.00 per cent,
from January 01 to March 25, 2019; and 15.50 and 8.50 per cent from March
26 to June 30, 2019, respectively. In the first half of 2018, the applicable rates
for SLF and SDF were 16.00 and 9.00 per cent, respectively.
4.1.13.9.3 Standing Lending Facility (SLF)
The daily average request for SLF in the first half of 2019, amounted to N95.63
billion, out of which Intra-day Lending Facility (ILF) conversion was N35.50
billion. Total average daily interest charged was N66.87 million in the 121
transaction days in the review period of 2019. In the corresponding period of
2018, the average daily request for SLF was N57.36 billion in 123 transaction
days, out of which ILF conversion was N45.54 billion, while average daily
interest income stood at N44.40 million.
4.1.13.9.4 Standing Deposit Facility (SDF)
Patronage at the SDF window decreased to an average daily amount of
N67.64 billion for the 121 days in the first half of 2019, from N88.30 billion for the
121 days in the corresponding period of 2018. Similarly, the average daily
interest payments on the deposits decreased to N22.48 million in the review
period, from N30.43 million in the corresponding period of 2018.
4.1.13.9.5 Inter-Bank Funds Market
Total average value of transactions at the inter-bank funds market stood at
N1,205.09 billion, in the first half of 2019, indicating a significant difference of
N489.03 billion or 68.3 per cent, compared with N716.06 billion in the
corresponding period of 2018. A further analysis of the transactions indicated
that the Open-Buy-Back (OBB) at N1,129.61 billion, accounted for 93.7 per
cent, while the unsecured inter-bank call took up 6.3 per cent or N75.48 billion.
In the preceding year, OBB accounted for N685.61 billion or 95.8 per cent,
while the unsecured segment recorded N30.45 billion or 4.3 per cent. The
84
patronage of OBB transactions in the review period was attributed, largely, to
risk aversion by market participants.
4.1.14 Interest Rate Developments
4.1.14.1 Money Market Rates
Movement in money market rates reflected, largely, the level of liquidity in the
banking system in the first half of 2019. Liquidity was influenced by the fiscal
operations of government; effects of CRR maintenance periods; deposits and
settlement for foreign exchange wholesale and retail intervention sales; and
maturities of CBN bills. Consequently, the daily inter-bank call rates ranged
from 3.00 to 35.00 per cent, while the daily OBB ranged from 1.50 to 60.00 per
cent in the review period. The weighted monthly average rates at the call
segment was 12.14 per cent in January, peaked at 16.71 per cent in February
and declined to 6.88 per cent in June 2019. Similarly, at the OBB segment, the
weighted monthly average rate was 17.54 per cent in January, peaked at
18.29 per cent in February and fell significantly to 7.67 per cent in June 2019.
The peak recorded at the inter-bank call and the OBB segments rates in
February 2019, were attributed to frequent OMO and Naira debits for foreign
exchange transactions.
The weighted average monthly inter-bank call and the OBB rate, for the first
half of 2019, stood at 11.30 per cent and 13.28 per cent, respectively,
compared with 14.64 per cent and 12.46 per cent in the corresponding half of
2018. The weighted average of the Nigeria Inter-Bank Offered Rate (NIBOR)
was 13.85 per cent, compared with 14.24 per cent in the corresponding half
of 2018.

85
Table 16
Money Market Rates
(Per cent)
WEIGHTED AVERAGE
MPR Call Rate OBB Rate NIBOR 30-days
Jan 19 14.0 12.14 17.54 14.79
Feb 19 14.0 16.71 18.29 11.92
Mar 19 13.5 10.8 12.07 10.83
Apr 19 13.5 13.98 15.87 12.07
May 19 13.5 7.31 8.25 11.51
Jun 19 13.5 6.88 7.67 22.00
Half year 2018 14.00 14.64 12.46 14.24
Half year 2019 13.67 11.30 13.28 13.85 Source: CBN
Figure 44
Money Market Rates
(Per cent)
0
5
10
15
20
25
Jan 19 Feb 19 Mar 19 Apr 19 May 19 Jun 19
Per
cent
MPR Call Rate OBB Rate NIBOR 30-days
Source: CBN
4.1.14.1.1 Deposit Rates
Developments in deposit rates reflected liquidity condition and other market
fundamentals in the first half of 2019. The average term deposit rates increased
by 0.21 percentage point to 8.77 per cent above its level in the corresponding
half of 2018. Rates on deposits of various maturities ranged from 8.56 to 8.77
per cent in the first half of 2019, compared with the range of 8.54 to 9.23 per

86
cent in the first half of 2018. With the year-on-year inflation at 11.23 per cent in
June 2018, all deposit rates were negative in real terms.
4.1.14.1.2 Lending Rates
The weighted average prime and maximum lending rates fell by 0.29 and 0.01
percentage point to 16.27 and 30.79 per cent, below 16.57 and 30.80 per cent,
respectively, in the first half of 2019. Consequently, the spread between the
average term deposits and maximum lending rates widened by 0.22
percentage point to 22.24 per cent.
Table 17
DMBs Deposits and Lending Rates
(Per cent)
Month Savings Average Term
Deposit Rates
Prime
Lending
Maximum
Lending
Spread
(AVTD-
MXLR)
Jan-19 4.07 8.92 16.01 30.48 21.56
Feb-19 4.07 8.93 16.08 30.56 21.63
Mar-19 3.97 8.73 14.92 30.83 22.10
Apr-19 3.91 8.67 18.92 30.89 22.22
May-19 3.91 8.67 15.33 31.07 22.40
Jun-19 3.93 8.69 16.39 30.93 22.44
Average 2018 First Half 4.18 8.56 16.57 30.80 22.02
Average 2019 First Half 3.98 8.77 16.27 30.79 22.24 Source: CBN
4.1.15 Institutional Savings
Aggregate financial savings rose by 15.7 per cent to N17,151.53 billion in the
first half of 2019, compared with N14,818.54 billion at the end of the
corresponding period of 2018. Commercial and merchant banks remained
the dominant depository institutions in the financial system, accounting for 96.2
per cent of total financial savings, compared with 95.2 per cent in the
preceding half year. Other saving institutions, namely; PMBs, life insurance
companies, pension fund custodians, the Nigerian Social Insurance Trust Fund
(NSITF), and MFBs, accounted for the balance.

87
4.1.16 Other Financial Institutions
4.1.16.1 Development Finance Institutions
Total assets of the seven (7) development finance institutions (DFIs) namely:
the Bank of Industry (BOI); the Federal Mortgage Bank of Nigeria (FMBN); the
Nigerian Export-Import Bank (NEXIM); the Bank of Agriculture (BOA); the
Infrastructure Bank (TIB); the Development Bank of Nigeria (DBN); and the
Nigeria Mortgage Refinance Company (NMRC) decreased by 2.6 per cent to
N1,889.71 billion at end-June 2019, compared with N1,939.29 billion at end-
December 2018. The development was due, largely, to decline in bank
placements and long-term borrowings by the institutions. The paid-up capital,
however, remain unchanged at N238.78 billion, while the net loans and
advances rose by 5.9 per cent to N972.56 billion at end-June 2019, compared
with N918.47 billion at end-December 2018. Aggregate shareholders’ funds
also increased by 18.6 per cent to N298.08 billion at end-June 2019, from
N248.88 billion at end-December 2018. The increase was due, mainly, to the
accretion to reserves by BOI, DBN, and NMRC.
A disaggregation of the total assets by institution indicated that BOI, DBN, FMB,
NEXIM, BOA, NMRC and TIB accounted for 56.5, 15.9, 13.1, 6.2, 4.2, 3.8 and 0.3
per cent, respectively, of the total. The BOI, FMBN, DBN, NEXIM, BOA, and NMRC
accounted for 66.2, 16.3, 5.4, 4.7, 3.7 and 3.9 per cent, of total net loans and
advances, respectively.
4.1.16.2 Microfinance Banks (MFBs)
There were 903 licensed MFBs at end-June 2019, compared with 885 MFBs at
end-December 2018. The number comprised nine (9) National MFBs, 136 State
MFBs, and 758 Unit MFBs. The increase in the number of MFBs was attributed to
the licensing of 18 new MFBs during the review period. Provisional data showed
that total assets of the MFBs amounted to N417.50 billion at end-June 2019 and
represented 1.1 per cent increase over the level at end-December 2018. The
shareholders’ funds of MFBs increased by 8.0 per cent to N105.47 billion at end-
June 2019, from N97.63 billion at end-December 2018. The increase was
attributed, largely, to accretion to reserves from ploughed back profits. The

88
paid-up capital, at N62.53 billion at end-June 2019, showed a decrease of 9.1
per cent, below the level at end-December 2018, while total reserves rose by
49.1 per cent to N42.94 billion at end-June 2019, compared with N28.81 billion
at end-December 2018. Total deposit liabilities increased by 2.2 per cent to
N217.90 billion at end-June 2019, from N213.25 billion at end-December 2018.
Similarly, total deposit liabilities increased by 2.2 per cent to N217.90 billion at
end-June 2019 from N213.25 billion at end-December 2018.
Investible funds available to the sub-sector, in the review period, amounted to
N28.05 billion. The funds were sourced mainly from increase in reserves (N14.13
billion), deposits (N4.65 billion) and reduction in net loans and advances (N8.37
billion). The funds were utilised, mainly, in: reduction of other liabilities (N9.19
billion); settlement of matured long-term loans (N7.24 billion); and acquisition
of short-term investment (N2.36 billion).
4.1.16.3 Finance Companies (FCs)
The number of licensed finance companies (FCs) increased to 73 at end-June
2019, following the licensing of four (4) additional ones. The total assets and
liabilities of the sub-sector decreased by 22.1 per cent to N136.04 billion at end-
June 2019, compared with N174.69 billion at end-December 2018. The
decrease in total assets was attributed to the de-listing of 22 FCs, whose
operating licences were revoked in 2018. Borrowings decreased by 16.7 per
cent to N86.48 billion at end-June 2019, from N103.82 billion at end-December
2018. Shareholders’ funds and fixed assets also decreased by 0.5 and 72.8 per
cent, respectively, to N23.31 billion and N13.35 billion, at end-June 2019, below
N29.25 billion and N49.01 billion at end-December 2018. However, loans and
advances increased by 20.3 per cent to N63.94 billion at end-June 2019, from
N53.16 billion at end-December 2018. Similarly, balances with banks, reserves
and investments increased by 3.0, 20.3 and 12.3 per cent, respectively, to
N6.79 billion, N6.43 billion and N14.60 billion at end-June 2019.
Investible funds available to the sub-sector in the review period amounted to
N38.14 billion. The funds were sourced, mainly, from additional long-term
borrowing (N23.35 billion), increase in reserves (N9.61 billion) and other liabilities

89
(N1.54 billion). The funds were utilised, mainly, to: increase loans and advances
(N12.26 billion); acquire fixed assets (N10.93 billion); increase bank balances
(N4.09 billion); and purchase other assets (N2.23 billion).
Table 18
Key Indicators of Finance Companies at end-June 2019
June 2019
(N’ billion)
December 2018
(N’ billion)
% Change
Total Assets 136.04 174.69 -22.12
Cash in Vault 0.88 4.71 -81.32
Balances with Banks 6.79 6.59 3.03
Loans and Advances 63.94 53.16 20.28
Borrowings 86.48 103.82 -16.70
Investments 14.60 13.00 12.31
Shareholder’s Funds 23.31 29.25 -20.31
Fixed Assets 13.35 49.01 -72.76
Reserves 6.43 12.82 20.28
Paid-up Capital 16.89 16.43 2.80
Source: CBN
4.1.16.4 Primary Mortgage Banks (PMBs)
There were thirty-five (35) licensed operating PMBs at end-June 2019,
comprising 12 national and 23 state PMBs, same as at end-December 2018.
Total assets of the PMBs decreased, marginally, by 0.9 per cent to N447.93
billion at end-June 2019, from N451.95 billion at end-December 2018, due
largely, to decrease in cash holdings, non-current assets held for sale and
investment in quoted shares in the review period. Total loans and advances
and investment in quoted shares decreased by 0.3 per cent and 13.3 per cent,
to N228.86 billion and N16.51 billion at end-June 2019, respectively.
Shareholders’ funds amounted to N55.67 billion at end-June 2019, compared
with N82.99 billion at end-December 2018, indicating a decline of 32.9 per
cent. Deposit liabilities, placement with banks and other liabilities rose by 7.0,
7.0 and 7.3 per cent, respectively, to N150.24 billion, N43.91 billion and N166.25
billion.
Investible funds available to the sub-sector amounted to N33.24 billion at end-
June 2019. The funds were sourced, mainly, from: increase in other liabilities

90
(N11.33 billion); deposits mobilisation (N9.81 billion); and disposal of non-
current assets (N4.96 billion). The funds were utilised, mainly, for decrease in
reserves (N24.83 billion), increase placement with banks (N2.87 billion) and
cash at hand (N2.49 billion).
Table 19
Key Financial Indicators for Primary Mortgage Banks at end-June 2019
June 2019
(N’ billion)
December 2018
(N’ billion)
% Change
Total Assets 447.93 451.95 -0.88
Loans and Advances 228.86 229.60 -0.32
Placement with Banks 43.91 41.03 7.0
Investment in Quoted Shares 16.51 19.04 -13.29
Deposit Liabilities 150.24 140.43 6.98
Other Liabilities 166.25 154.92 7.31
Shareholders’ funds 55.67 82.99 32.91
Source: CBN
4.1.16.5 Bureaux-De-Change (BDCs)
There were 4,798 BDCs in operation in the first half of 2019, compared with
4,492 at end-December 2018. The increase was due, largely, to the licensing
of 306 new BDCs in the review period.
4.1.17 Capital Market Developments
4.1.17.1 Institutional Developments
During the first half of 2019, the Securities and Exchange Commission (SEC)
held its first Capital Market Committee (CMC) meeting for the year, on
Thursday March 21, 2019. The Forum provided a platform for the discussion of
critical issues and decision making, regarding developments in the Nigerian
capital market. The Commission also revealed its set of rules on the electronic
Initial Public Offering (e-IPO) initiative to facilitate the process of public
offerings of securities electronically and reduce marketing time. Furthermore,
the SEC sustained its drive to encourage investors, who participated in public
offerings, which took place in Nigeria before 2010, to approach their

91
stockbrokers, registrars, bankers and other capital market operators, for
guidance on the steps required to regularise those shares and reclaim any
accrued dividends. Similarly, engagements continued between the SEC and
the Corporate Affairs Commission (CAC) on the matter of getting company
Secretaries of unlisted public companies to register their securities. Some
unlisted pubic companies were yet to comply.
The Commission, in collaboration with the Republic of Korea, conducted a
knowledge-sharing programme on the regulation and operation of derivatives
markets in Nigeria, targeted at boosting economic cooperation between the
two countries and providing a mutual learning opportunity for regulators. The
Commission was finalising its guidelines on derivatives and central
counterparties, a necessary step aligned with its plan to introduce financial
derivative products in the Nigerian capital market. Other activities undertaken
by the SEC during the review period, included:
• Organisation of the 3rd in the series of the annual budget seminar, where
the roles of the capital market in effective budget implementation, as
well as, implications for the capital market were discussed;
• Resolution of conflict around the transmission of shares related to the
estate of deceased investors, wherein an approved operating
framework for transmission of shares reduced the timeline for the
transmission of deceased’s shares from three weeks to one week;
• Inauguration of the Board of the SEC, by the Federal Government of
Nigeria, in June 2019. The nine-member Board, under the Chairmanship
of Mr. Olufemi Lijadu, was inaugurated by Mr. Mahmoud Isa Dutse, the
Permanent Secretary, Federal Ministry of Finance; and
• Recognition of individuals who partnered with the Commission to work
in various technical committees, towards achieving the initiatives
contained in the SEC 10-year Capital Market Masterplan.
Figure 45
Complaints received and resolved, end-June 2019

92
Source: Securities and Exchange Commission
4.1.17.2 The Nigerian Stock Exchange (NSE)
The Nigerian Stock Exchange, in the first half of 2019, continued with the
implementation of various initiatives to sustain the post-recession rebound of
investment activities. The NSE, in collaboration with Afrinvest Securities Limited
(“ASL”), launched two new factor indices to serve as benchmarks for
measuring value in banking stocks and high dividend stocks listed on the
Exchange. These were: the NSE-Afrinvest Banking Value Index (NSE-Afr BVI)
and NSE-Afrinvest High Dividend Yield Index (NSE-Afr HDYI). The Exchange also
launched two new style indices, namely; the NSE-Meristem Growth Index and
NSE-Meristem Value Index. The indices were designed to support product
development and investment management, as well as, serve as a benchmark
for gauging the value and growth of stocks listed on the Exchange.
In another development, the Exchange in conjunction with the Fund
Managers Association of Nigeria (FMAN); Association of Stockbroking Houses
of Nigeria (ASHON); and the Central Securities Clearing System (CSCS) Plc,
launched the NSE Mutual Fund Trading and Distribution Platform. This was to
facilitate electronic transactions with seamless interaction between NSE, CSCS
Plc, Fund Managers and Brokers Dealers. Also, the NSE launched its online
learning platform, X-Academy, which offers well-structured and
comprehensive self-paced capital market learning content.
To deepen the growth of islamic finance in Nigeria, the NSE, in partnership with
the REDmoney Group, organised the maiden edition of the IFN Nigeria Forum,
themed; “Harnessing the Islamic Finance Sector for Infrastructure
Development and Economic Growth”.
164143
80
220
91 88
0
50
100
150
200
250
First Half 2017 First Half 2018 First Half 2019Complaints Received Complaints Resolved
Nu
mb
er
of
Co
mp
lain
ts

93
During the first half of 2019, the NSE listed by introduction on its Premium Board,
20,354,513,050 ordinary shares of the MTN Nigeria Communications Plc, at N90
per share. MTN was the first telecommunications company to be listed on the
NSE Premium Board, a listing segment for the elite group of issuers that met the
Exchange’s most stringent corporate governance and listing standards. At
end-June 2019, there were eight (8) companies listed on the Premium Board.
Similarly, the NSE listed by way of an IPO on the Main Board, 1,353,580,000
ordinary shares of Skyway Aviation Handling Company Plc (SAHCOL Plc), at
N4.65 per share. SAHCOL Plc was the first company, under the Bureau of Public
Enterprises (BPE) privatisation programme, to successfully finalise an IPO and
list its shares on the Exchange. The listing of the company’s shares added
N6.29 billion to the market capitalisation of the Exchange and further
deepened the Nigerian capital market.
In addition, the NSE in partnership with the Global Reporting Initiative (GRI),
unveiled the NSE Sustainability Disclosure Guidelines to address the
implementation of sustainability reporting. Furthermore, the Exchange hosted
the Sustainability Reporting Implementation Workshop, in partnership with GRI,
to facilitate the adoption of the reporting principles by listed companies.
4.1.17.3 The New Issues Market
During the first half of 2019, the SEC and NSE streamlined the issuance process
with the listing approval process to eliminate duplication of procedures
between the SEC and the NSE.
In the primary segment of the Nigerian capital market, there were twenty-
three (23) new issues worth N2,057.71 billion in the first half of 2019, compared
with twenty-six (26) valued at N554.77 billion in the corresponding half year of
2018. The issuance comprised: eight (8) new listings amounting to N1,910.88
billion; four (4) memorandum listings (N2.50 billion); and eleven (11)
supplementary listings (N144.34 billion). In the government segment of the
primary market, eighteen (18) new and thirteen (13) supplementary bonds,
worth N601.12 billion were issued and allotted by the Debt Management
Office (DMO) in the review period, compared with sixteen (16) bonds, worth

94
N461.08 billion in the corresponding half year of 2018. The major bond listing in
the review period was the FGN Eurobonds, worth US$5.37 billion.
4.1.17.4 The Secondary Market
Rising interest rates in the United States initially posed a major threat to the
retention of portfolio investments at the beginning of the review period, owing
to investors’ appetite for higher returns. However, activities in the market were
subsequently driven, largely, by key domestic developments, notably; the
listing by introduction of 20.4 billion ordinary shares of telecoms giant, the MTN
Nigeria, on the NSE and the 2019 general elections. Thus, the market closed on
a mixed note, at the end of the first half of 2019.
The aggregate volume and value of traded securities fell by 23.2 and 32.4 per
cent to 51.50 billion shares and N538.67 billion, respectively, in 462,809 deals,
compared with 67.04 billion shares, valued at N797.08 billion, traded in 565,948
deals in the corresponding period of 2018. The equities sub-sector maintained
its dominance in the market, accounting for 90.7 and 99.8 per cent of the
aggregate volume and value of transactions, respectively, while the debt and
Exchange Traded Fund (ETF) segments accounted for the balance. Sectoral
analysis of the market indicated that the financial services sector (measured
by volume of transactions), remained the most active, accounting for 34.98
billion shares (78.5%), valued at N260.20 billion (51.5%), in 270,789 deals,
compared with 48.90 billion shares, valued at N521.01 billion in 389,926 deals in
the first half of 2018. This was followed by the oil & gas and conglomerates
sectors.
Analysis of investors’ activities in the market showed decline in participation by
foreign investors, relative to the first half of 2018. The levels of domestic and
foreign investors’ participation were 54.2 per cent and 45.8 per cent, as
against 50.5 per cent and 49.5 per cent, respectively, in the corresponding half
year of 2018.
Figure 46
Volume and Value of Transactions at the NSE

95
Source: Securities and Exchange Commission (SEC)/Nigerian Stock Exchange (NSE)
4.1.17.5 All-Share Index and Aggregate Market Capitalisation
The NSE All-Share Index was 29,966.87 at end-June 2019, indicating 4.7 and
21.7 per cent decline, relative to 31,430.50 and 38,278.55 at end-December
2018 and end-June 2018, respectively. Aggregate market capitalisation of the
308 listed securities closed at N25.73 trillion, indicating an increase of 17.5 and
7.3 per cent above the levels at end-December 2018 and the corresponding
period of 2018, respectively. Listed equities accounted for 51.4 per cent of the
aggregate market capitalisation, while the debt and ETF components
accounted for the balance of 48.6 per cent. The top-twenty (20) most
capitalised companies on the Exchange accounted for 89.4 per cent (N11.82
trillion) of the total equity capitalisation and 45.9 per cent of the aggregate
market capitalisation.
Eight (8) banks made the list of the top-twenty (20) most capitalised
companies and accounted for N3.08 trillion (23.3%) of the total equity market
capitalisation, compared with six (6) banks and 22.9 per cent in the
corresponding period of 2018. As a percentage of nominal GDP, aggregate
market capitalisation stood at 38.21 per cent at end-June 2019, compared
with 40.5 per cent in the corresponding period of 2018.
0.0
200.0
400.0
600.0
800.0
1000.0
0.0
20.0
40.0
60.0
80.0
First half 2017 First half 2018 First Half 2019
Val
ue
in N
aira
(b
illio
n)
Vo
lum
e in
Nu
me
r (B
illio
n)
Volume of traded securities (LHS) Value of securities (RHS)

96
4.2 FISCAL OPERATIONS
4.2.1 Federation Account Operations
Provisional gross federally-collected revenue4 in the first half of 2019 stood at
N4,590.87 billion or 6.9 per cent of GDP. The amount was lower than the half-
year budget by 38.6 per cent, but was above the level in the corresponding
period of 2018 by 2.1 per cent. The decline in federally-collected revenue,
relative to the proportionate budget, was attributed to the shortfall in both oil
and non-oil revenue. Of the total revenue, oil constituted 57.4 per cent, while
non-oil accounted for the balance of 42.6 per cent.
Figure 47
Structure of Gross Federation Revenue, First Half 2015 - 2019
(Per cent)
Source: Computation based on data from The Office of Accountant General of the
Federation (OAGF) and The Federal Ministry of Finance (FMF)
At N2,632.94 billion or 3.9 per cent of GDP, gross oil revenue fell below the
proportionate budget and the level in the first half of 2018 by 45.1 and 2.0 per
cent, respectively. The drop in oil revenue, relative to the proportionate
budget, was attributed to the decline in the volume and price of crude oil
during the period. Relative to the budget benchmark of 2.3 million barrels per
day (mbd), crude oil production averaged 1.9 mbd. In addition, crude oil
exports dropped below the proportionate budget of N795.22 billion by N571.15
billion or 71.8 per cent. The gross oil revenue comprised: PPT/Royalties,
N1,635.32 billion (62.1%); Domestic Crude Oil/Gas Sales, N717.64 billion (27.3%);
Crude Oil and Gas Exports, N224.07 billion (8.5%); and “Others”, N55.91 billion
(2.1%), respectively.
4 Earnings lodged in the Federation Account by virtue of Section 161 of the Federal Republic of Nigeria Constitution 1999 as amended
59.4 50.2 53.9 59.7 57.4
40.6 49.8 46.1 40.3 42.6
15.0 25.0 35.0 45.0 55.0 65.0 75.0 85.0 95.0
2015 2016 2017 2018 2019
Oil Revenue Non-Oil Revenue

97
Figure 48
Composition of Oil Revenue, First Half 2019
(Per cent)
Source: Computation based on data from the OAGF and the FMF
The sum of N553.49 billion, N24.22 billion and N6.31 billion from the gross oil
revenue were utilised for the Joint Venture Cash (JVC) calls, cost of collection
by the Department of Petroleum Resources (DPR), and Excess Crude
Proceeds, respectively, while N58.84 billion was transferred to “Others”5. The
balance of N1,990.07 billion was retained in the Federation Account for
distribution among the three tiers of government and the 13% Derivation Fund6.
Gross revenue from non-oil sources, at N1,957.93 billion or 2.9 per cent of GDP,
was below the proportionate budget by 27.0 per cent, but was above the
level in the corresponding period of 2018 by 8.1 per cent. The decline in non-
oil revenue, relative to the proportionate budget, was attributed to the fall in
most of its components. The gross non-oil revenue comprised: Corporate Tax,
N629.81 billion (32.2%); Value Added Tax (VAT), N597.11 billion (30.5%);
Customs and Excise Duties, N405.88 billion (20.7%); FGN Independent Revenue,
N143.55 billion (7.3%); and “Others”7, N181.57 billion (9.3%).
5 Included Excess Crude Revenue, Excess PPT/Royalty & NNPC Refunds. 6 Funds set aside for the oil-producing states. 7Include Education Tax Fund; Customs Special Levies (Federation and Non-Federation); and National Information Technology
Development Fund (NITDF).
Crude Oil / Gas
Exports
8.5%PPT & Royalties
62.1%
Domestic Crude
Oil / Gas Sales
27.3%
Others
2.1%

98
Figure 49
Composition of Non-Oil Revenue, First Half 2019
(Per cent)
Source: Computation based on data from the OAGF and the FMF
The sum of N77.19 billion, was deducted from the non-oil revenue, as
combined cost of collection for the Federal Inland Revenue Service (FIRS),
Nigeria Customs Service (NCS), and VAT. Also, N8.15 billion was deducted as
FIRS Tax refunds, leaving a net distributable balance of N1,872.60 billion.
Of the N3,862.67 billion federally-collected revenue (net) from oil and non-oil
sources, N573.23 billion (14.8%), N181.57 billion (4.7%) and N143.55 billion (3.7%),
were transferred to the VAT Pool Account, Other Transfers and FG
Independent Revenue, respectively. The balance of N2,964.32 billion (76.8%)
was retained in the Federation Account for distribution to the three tiers of
government.
Figure 50
Composition of Federally Collected Revenue (Net), First Half 2019
(Per cent)
Source: Computation based on data from the OAGF and the FMF
Corporate Tax
32.2%
Customs &
Excise Duties
20.7%
Value-Added
Tax
30.5%
FGN
Independent
Revenue
7.3%
Other Transfers
9.3%
Retained in
Federation
Account
76.8%
FG Indep. Rev.
3.7%
VAT
14.8%Other Transfers
4.7%

99
4.2.1.1 Federally Collected Revenue Distribution
Distribution from the Federation Account8 to the three-tiers of government in
the first half of 2019 were as follows: Federal Government, N1,425.32 billion;
states, N722.94 billion; and local governments, N557.36 billion. The balance of
N258.71 billion was shared among the oil-producing states as 13% Derivation
Fund.
From the Excess Oil Revenue9, the Federal Government received N35.79 billion,
the state and local governments received N18.15 billion and N14.00 billion,
respectively; while the 13% Derivation Fund received N10.15 billion, bringing
the total to N78.09 billion. Furthermore, from the Exchange Rate Differential
Account the sum of N49.26 billion was drawn to augment the shortfall in
budgeted revenue and shared as exchange gain as follows: The Federal
Government, N22.62 billion; states, N11.47 billion; local governments, N8.85
billion; and the 13% Derivation Fund, N6.31 billion.
In addition, the sum of N12.14 billion was shared as Non-Oil Excess Revenue10
with the Federal Government receiving N6.40 billion, while the state and local
governments received N3.24 billion, and N2.50 billion, respectively.
4.2.1.2 VAT Pool Account11
A total of N573.23 billion accrued to the VAT Pool Account in the first half of
2019, representing a decrease of 30.0 per cent below the proportionate
budget for the fiscal year. The amount was distributed among the three-tiers
of government as follows: Federal Government, N85.98 billion; state
governments, N286.61 billion; and local governments, N200.63 billion.
4.2.1.3 Cumulative Distribution
Total statutory revenue distributed to the three-tiers of government and the
13% Derivation Fund amounted to N3,677.03 billion in the first half of 2019. This
was below the proportionate budget of N6,544.00 billion and the N3,823.26
billion distributed in the first half of 2018 by 43.8 and 3.8 per cent, respectively.
8 Shared as follows: Federal, including Special Funds (52.68%); States (26.72%); and local governments (20.0%) 9 Includes Excess Crude, Goods and Valuable Consideration, and Additional revenue from NNPC. 10Include Excess Bank Charges and other non-mineral revenue 11 Shared as follows: Federal (15.0%); States (50.0%); and local governments (35.0%)
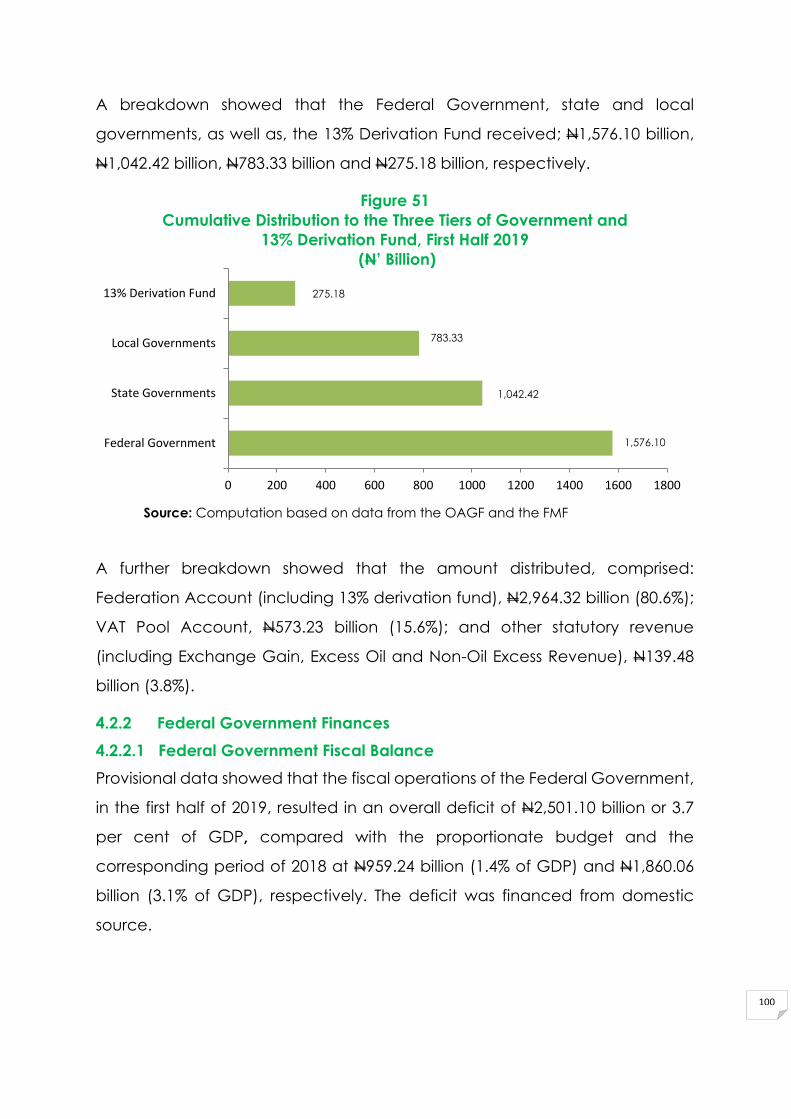
100
A breakdown showed that the Federal Government, state and local
governments, as well as, the 13% Derivation Fund received; N1,576.10 billion,
N1,042.42 billion, N783.33 billion and N275.18 billion, respectively.
Figure 51
Cumulative Distribution to the Three Tiers of Government and
13% Derivation Fund, First Half 2019
(N’ Billion)
Source: Computation based on data from the OAGF and the FMF
A further breakdown showed that the amount distributed, comprised:
Federation Account (including 13% derivation fund), N2,964.32 billion (80.6%);
VAT Pool Account, N573.23 billion (15.6%); and other statutory revenue
(including Exchange Gain, Excess Oil and Non-Oil Excess Revenue), N139.48
billion (3.8%).
4.2.2 Federal Government Finances
4.2.2.1 Federal Government Fiscal Balance
Provisional data showed that the fiscal operations of the Federal Government,
in the first half of 2019, resulted in an overall deficit of N2,501.10 billion or 3.7
per cent of GDP, compared with the proportionate budget and the
corresponding period of 2018 at N959.24 billion (1.4% of GDP) and N1,860.06
billion (3.1% of GDP), respectively. The deficit was financed from domestic
source.
1,576.10
1,042.42
783.33
275.18
0 200 400 600 800 1000 1200 1400 1600 1800
Federal Government
State Governments
Local Governments
13% Derivation Fund

101
Figure 52
FGN Fiscal Deficit, First Half 2015 - 2019
(% of GDP)
Source: Computation based on data from the OAGF and the FMF
4.2.2.2 Federal Government Retained Revenue
At N2,030.15 billion or 3.0 per cent of GDP, provisional retained revenue of the
Federal Government was lower than the proportionate budget by 52.0 per
cent, but was above the level in the first half of 2018 by 1.2 per cent. The
development, relative to the proportionate budget, was attributed to the drop
in all its components. A breakdown of the retained revenue showed that the
share from the Federation Account was N1,425.32 billion (70.2%); Federal
Government Independent Revenue, N143.55 billion (7.1%); VAT Pool Account,
N85.98 billion (4.2%); Excess Oil Revenue, N35.79 billion (1.8%); Exchange Gain,
N22.62 billion (1.1%); Non-Oil Excess Revenue, N6.40 billion (0.3%) and
‘Others’12, N310.49 billion (15.3%).
12 Include revenues from Special Accounts
-4.0
-3.5
-3.0
-2.5
-2.0
-1.5
-1.0
-0.5
0.0
2015 2016 2017 2018 2019
-1.5
-2.6
-1.8
-3.1
-3.7

102
Figure 53
Composition of Federal Government Retained Revenue, First Half 2019
(Per cent)
Source: Computation based on data from the OAGF and the FMF
4.2.2.3 Federal Government Expenditure
Provisional data indicated that the aggregate expenditure of the Federal
Government in the first half of 2019 was N4,531.24 billion or 6.8 per cent of GDP.
This was below the proportionate budget by 12.7 per cent, but was above the
level in the corresponding period of 2018 by 17.2 per cent. The development,
relative to the proportionate budget, was as a result of the decline in all the
expenditure components. Non-debt expenditure was below the
proportionate budget by 20.0 per cent and constituted 45.1 per cent of total
expenditure. Total interest payments amounted to N1,109.10 billion,
representing 54.6 and 24.5 per cent of FGN retained revenue and total
expenditure, respectively.
Federation Account
70.2%
FGN IR
7.1%
Exchange Gain
1.1%
VAT
4.2%
Excess Oil Revenue
1.8%
Non-Oil Revenue
Excess
0.3%
Others
15.3%

103
Figure 54
Composition of Federal Government Expenditure, First Half 2019
(Per cent)
Source: Computation based on data from the OAGF
At N3,152.60 billion, recurrent expenditure fell by 14.4 per cent below the half
year budget and accounted for 69.6 per cent of total expenditure. As a
percentage of GDP, recurrent expenditure was 4.7 per cent, compared with
4.6 per cent in the first half of 2018. A breakdown of the recurrent expenditure
showed that the goods and services component, at N1,769.74 billion or 56.1
per cent of the total, fell below the proportionate budget by 21.4 per cent,
owing to the decline in all its components. Further analysis of the goods and
services component showed that personnel cost accounted for N1,123.31
billion (63.5%), while overhead cost and pension accounted for N499.07 billion
(28.2%) and N147.36 billion (8.3%), respectively.
Interest payments13, at 35.2 per cent of total recurrent expenditure or 1.7 per
cent of GDP, fell by 1.6 per cent to N1,109.10 billion, compared with the
proportionate budget of N1,127.01 billion. Of this amount, N906.94 billion
(81.8%) was expended on domestic debt service, while the balance of
N202.16 billion (18.2%) was for external debt service. Transfers to special funds
(FCT, Stabilisation Fund, Development of Natural Resources and Ecology Fund)
13Include interest payments on CBN Overdraft.
Recurrent
69.6%
Capital
25.3%
Transfers
5.1%

104
and “Others” accounted for N273.75 billion or 8.7 per cent of total recurrent
expenditure.
Figure 55
Economic Classification of FG Recurrent Expenditure, First Half 2019
(Per cent)
Source: Computation based on data from the OAGF
Analysis of recurrent expenditure on a functional basis, showed that outlay on
Administration was N890.28 billion and constituted 28.2 per cent of total
recurrent expenditure. Relative to the level in the corresponding period of
2018, it rose by 13.5 per cent, due to the increase in allocation to all the key
sub-sectors. Similarly, expenditure on Social Services increased by 13.1 per
cent to N489.96 billion, and constituted 15.5 per cent of the total. Economic
Services and Transfers also rose by 21.4 per cent and 16.6 per cent to N242.14
billion and N1,530.22 billion and constituted 7.7 and 48.5 per cent of the total,
respectively.
Capital expenditure at N1,148.48 billion or 1.7 per cent of GDP and 25.3 per
cent of total expenditure, was below the proportionate budget by 8.8 per
cent, reflecting the slow pace of capital releases in the period. As a proportion
of Federal Government retained revenue, capital expenditure, at 56.6 per
cent, was above the stipulated minimum target of 20.0 per cent under the
revised WAMZ secondary convergence criteria.
Goods and
Services
56.1%
Interest
Payments
35.2%Transfers
8.7%

105
Analysis of capital expenditure by function showed that outlay in the
Economic Services Sector was N470.04 billion or 40.9 per cent of the total.
Administration and public investments in Social Services accounted for 38.7
per cent apiece, while Transfers constituted 4.5 per cent of the total.
Statutory Transfers, at N230.16 billion or 0.3 per cent of GDP, fell by 8.3 per cent,
relative to the proportionate budget and accounted for 5.1 per cent of total
expenditure.
4.2.3 State Government Finances
Aggregate statutory allocation to state governments from the Federation
Account, Excess Oil14, Non-oil Excess, Exchange Gain15 and VAT Pool Account
amounted to N1,317.59 billion in the first half of 2019. This was 44.1 and 4.2 per
cent below the proportionate budget and the level in the corresponding
period of 2018, respectively. A breakdown showed that allocation from the
Federation Account was N981.65 billion (74.5%); VAT Pool Account, N286.61
billion (21.8%); Excess Oil Revenue, N28.30 billion (2.1%); Exchange Gain, N17.79
billion (1.3%); and Non-oil Excess N3.24 billion (0.3%).
Figure 56
Composition of Total Allocation to State Governments, First Half 2019
(Per cent)
14 Includes Excess Crude, Goods and Valuable Consideration, and Additional fund from NNPC. 15 Federation account, Excess Oil and Exchange gain includes allocation to the 13% Derivation Fund.

106
Source: Computation based on data from the FMF
The sum of N164.59 billion was deducted as state governments’ contractual
obligations16 from their share of the Federation Account, leaving a net
distributable balance of N817.06 billion. Of the net sum, N558.35 billion was
distributed to the 36 states of the Federation and the balance of N258.71
billion, being 13% Derivation Fund, was allocated to the oil-producing states.
Of the total allocation to state governments from the Excess Oil Revenue and
Exchange Gain Accounts, N10.15 billion and N6.31 billion, respectively, were
shared to the oil-producing states as 13% Derivation Fund. Overall, the net
aggregate statutory allocation to state governments amounted to N1,153.01
billion.
Allocation to the states from the VAT Pool Account increased by 11.8 per cent
above the level in the first half of 2018, while that of the Federation Account
fell by 9.1 per cent. Consequently, the net statutory allocation to states
(including the 13% Derivation Fund) was 9.2 per cent below the level in the first
half of 2018. Thus, aggregate net allocation to state governments was 4.8 per
cent, below the level in the first half of 2018. Further analysis of the state
16 Included contribution to external debt service fund, payments for fertilizer, State Agricultural Project, National
Fadama Project and the National Agricultural Technology Support Programme.
Federation Acct74.5%
VAT21.8%
Excess Oil Revenue
2.1%
Non-Oil Excess0.3% Exchange Gain
1.3%

107
governments’ aggregate allocation showed that Delta, Akwa Ibom, and
Lagos received 8.6, 6.9 and 6.2 per cent of the total, respectively. Conversely
Ebonyi, Kwara and Ekiti states received the least with 1.8 per cent apiece.
4.2.4 Local Government Finances
Provisional data showed that the aggregate statutory allocation to the 774
local governments from the Federation, VAT Pool, Exchange Gain, Excess Oil
and Non-oil Excess Accounts, was N783.33 billion in the first half of 2019,
indicating a decrease of 33.5 per cent, below the proportionate budget. A
breakdown showed that allocation from the Federation Account was N557.36
billion (71.2%); VAT Pool Account, N200.63 billion (25.6%); Excess Oil Revenue
Account, N13.99 billion (1.8%); Exchange Gain, N8.85 billion (1.1%); and Non-
oil Excess Revenue Account, N2.50 billion (0.3%). Allocation to local
governments on state basis indicated that Lagos ranked highest with 6.5 per
cent followed by Kano with 5.6 per cent, and Katsina with 4.1 per cent of the
total. Conversely, Ebonyi, Gombe and Bayelsa ranked lowest with 1.6, 1.5 and
1.1 per cent, respectively.
Figure 57
Composition of Statutory Allocation to Local Governments, First Half 2019
(Per cent)
Source: Computation based on data from the FMF
4.2.5 Public Debt
4.2.5.1 Consolidated Federal Government Debt
The consolidated debt stock of the Federal Government in the first half of 2019,
stood at N21,735.43 billion or 16.3 per cent of GDP, indicating an increase of
VAT
25.6%
Exchange Gain
1.1%
Federation
Account
71.2%
Excess Oil
1.8%
Non-Oil Excess
0.3%

108
5.9 per cent over the level at end-December 2018. Of the total debt stock,
domestic debt was N13,412.80 billion or 61.7 per cent, while external debt
amounted to N8,322.63 billion (US$27.16 billion) or 38.3 per cent of the total.
Figure 58
Composition of Federal Government Consolidated Debt, End-March 2019
(Per cent)
Source: Computation based on data from the Debt Management Office (DMO)
4.2.5.1.1 Domestic Debt
At N13,412.80 billion or 10.0 per cent of GDP, the Federal Government
securitised domestic debt at end-June 2019 was above the level at end-
December 2018 by 5.0 per cent. The increase was due to the issuance of
additional FGN Bonds, Promissory notes and Green Bonds amounting to
N356.68 billion, N376.48 billion and N15.00 billion, respectively. Consequently,
the stock of FGN Bonds increased by 4.2 per cent to N9,723.67 billion,
compared with the level at end-December 2018. The holdings of the total
outstanding domestic debt instruments were: banking system, including
Sinking Fund (68.2%); and non-bank public (31.8%).
4.2.5.1.2 External Debt
The total external debt stock (Federal and states, including the Federal Capital
Territory) at end-June 2019 was US$27.16 billion or 6.2 per cent of GDP. This
represented an increase of 7.5 per cent above the level at end-December
2018, reflecting additional drawdown on multilateral and bilateral loans of
US$1.70 billion and US$0.19 billion for the funding of infrastructure and the
redemption of matured domestic securities. A decomposition by holders
indicated that 46.8 and 41.1 per cent of total debt stock were obligations to
the multilateral and commercial creditors, respectively, while the balance of
12.1 per cent was for bilateral creditors.
External38.3%
Domestic61.7%

109
Figure 59
Breakdown of External Debt Stock, First Half 2015 - 2019
(US$ Billion)
Sources: The Debt Management Office (DMO)
4.2.5.2 Total Debt Service
The consolidated debt service of the Federal Government at end-June 2019
stood at N987.19 billion or 1.2 per cent of GDP, an increase of 7.7 per cent
above the level at end-December 2018. It however fell by 7.9 per cent below
the level in the first half of 2018. A breakdown showed that N800.12 billion or
81.0 per cent of the total was expended on domestic debt service, while
external debt service accounted for the balance of N187.07 billion or 19.0 per
cent. Further analysis of the debt service showed that N951.22 billion was spent
on interest payment, while principal repayments amounted to N35.86 billion.
Figure 60
Breakdown of External Debt Service, First Half 2015 - 2019
(N’ Billion)
Source: Computation based on data from the DMO
7.2
3
7.9
9 9.6
7
10
.88
11
.01
12
.72
3.0
8
3.2
7 5.0
7
10
.90
14
.26
14
.45
0.00
2.00
4.00
6.00
8.00
10.00
12.00
14.00
16.00
1st Half 2015 1st Half 2016 1st Half 2017 1st Half 2018 End-Dec. 2018 1st Half 2019
Multilateral Multilateral Others Others
52
8.5
4
64
1.6
8
70
9.4
5
94
1.0
0
85
6.9
0
80
0.1
2
30
.91
34
.27
56
.90
13
0.7
6
59
.64
18
7.0
7
- 20.00 40.00 60.00 80.00 100.00 120.00 140.00 160.00 180.00 200.00
0.00100.00200.00300.00400.00500.00600.00700.00800.00900.00
1,000.00
1st Half 2015 1st Half 2016 1st Half 2017 1st Half 2018 End Dec. 2018 1st Half 2019
Domestic Debt (N' Billion) External ($US Million)

110
4.3 REAL SECTOR DEVELOPMENTS
Economic activities in first half of 2019 maintained a modest growth with sustain
growth in both oil and non-oil sectors. Data from the National Bureau of
Statistics (NBS) indicated that, the gross domestic product (GDP), at 2010
constant basic prices, grew by 2.02 per cent in the first half of 2019, relative to
1.69 per cent in the corresponding period of 2018. Oil and non-oil sector
output grew by 1.71 and 2.05 per cent, respectively, during the period,
compared with 4.63 and 1.41 per cent in the corresponding period of 2018.
On a quarter-on-quarter basis, the economy witnessed a slower growth of 1.94
per cent in real terms in Q2: 2019 compared with 2.10 per cent in the first
quarter of the year. The development was driven by the non-oil sector, which
grew by 2.05 per cent, due mainly to the relative stability in the foreign
exchange market, improved business climate, as well as, sustained investment
in infrastructure, and improved political environment owing to the successful
completion of 2019 general elections. The growth in the oil sector was
attributed to the sustained peace deal in the Niger Delta which ensured
improved oil output.
Figure 61
GDP Growth Rate
(Per cent)
Source: National Bureau of Statistics (NBS)
1.692.10 2.02
1.41
2.52 2.05
4.63
-2.34
1.71
1st Half 2018 2nd Half 2018 1st Half 2019
Total GDP Non-Oil GDP Oil-GDP

111
4.3.1 Agriculture
4.3.1.1 Agricultural Policies and Institutional Support
The Federal Government continued to demonstrate commitment to the
agricultural sector as an anchor for diversifying the economy. At the 43rd
Meeting of the National Council on Agriculture and Rural Development
(NCARD) the following initiativs were approved, among others:
• The adoption of the Gender Action Plan for Agriculture, which was to
support and empower women farmers to move from subsistence to
commercial farming. An allocation of 35.0 per cent of all subsidised
resources to female value chain actors was proposed in the Plan;
• The adoption of the Draft National Policy on Agricultural Extension. It
mandated the Federal Ministry of Agriculture and Rural Development
(FMARD) to follow-up on the legislative process to ensure enactment by
the National Assembly. This would, among other things, guide and
regulate effective extension and advisory services delivery in the
country; and
• The recapitalisation of the Nigerian Agricultural Insurance Corporation
(NAIC), in view of the need to provide adequate resources to enable
the Corporation meet its obligations, as contained in the NAIC Act of
1993.
Towards reviving the oil palm sector, the Central Bank of Nigeria (CBN) entered
into partnership with eleven (11) oil palm producing states for disbursement of
loan at not more than 9.0 per cent interest rate. The states were to provide at
least 100 hectares of arable land for the take-off of the Initiative.
To boost rice production in the country, the German government, in
collaboration with the Bill and Melinda Gates Foundation, provided €2.0 million
for the implementation of the second phase of the Competitive African Rice
Initiative (CARI) in the country. The Project focused on the rice value chain to
help small-holder farmers to increase their income and provide high-quality
rice grains to the country.

112
The Nigerian Institute for Oceanography and Marine Research (NIOMR) during
the review period, organised a capacity training on aquacultural programme
for youths from Oyo North. The training tagged “Value Capacity Building on
Aquaculture for Youths and Women”, focused on aquaculture production
and fish post-harvest technology. The objective of the Programme was to build
the capacity of youths and women, thereby reducing unemployment.
To support the Federal Government’s plans to resettle herdsmen and end the
farmers/herders clashes in the country, the Niger State Government proposed
to invest N30.0 billion in a 31,000 hectares grazing reserves. The Reserves which
would be located in Bobii village, in Mariga Local Government Area, would
be equipped with a veterinary hospital, two dams, health care facility, grass
growing fields, settlement areas for the herders, milk processing factory,
abattoir and a well-equipped school for the children of the herdsmen.
The Federal Government approved the release of the pod borer resistant
cowpea (popularly called beans) to farmers. The cowpea variety was
developed by the Institute for Agricultural Research (IAR), Ahmadu Bello
University, Zaria. Its introduction would improve the average national
productivity from 10kg/hectare to 350kg/hectare and help to bridge the
deficit in the national cowpea demand by about 500,000 tonnes.
4.3.1.2 Agricultural Production and Prices
Provisional data indicated that, at 137.6 (2010=100), the index of agricultural
production in the first half of 2019 grew by 2.5 per cent, above 134.3 in the
corresponding period of 2018. The performance was attributed to concerted
efforts of the Federal Government, the CBN and other stakeholders towards
achieving the desired transformation in the agricultural sector.
The output of the crops, which comprised staples and other crops, fishery,
forestry, and livestock sub-sectors grew by 2.6, 4.1, 2.7 and 0.4 per cent,
respectively. The improvement was due, largely, to the increased access to
CBN’s interventions, particularly, Commercial Agricultural Credit Scheme
(CACS) and Anchor Borrower Programme (ABP), and the implementation of
the Livestock Transformation Plan.

113
Survey by the CBN on the domestic retail prices of 12 selected agricultural
commodities, indicated that the prices of 8 of the commodities declined,
relative to their levels in the first half of 2018. The price decrease ranged from
1.9 per cent for sweet potatoes, to 57.8 per cent for cashew nut. This was
attributed to improved supply of the commodities, owing to the
implementation of various government policies and CBN interventions in the
agricultural sector. However, the price of rice, sorghum, millet and yam tubers
increased by 13.1, 3.6, 2.2 and 2.1 per cent, respectively.
Provisional data indicated that at 74.5 (2010=100) (dollar-based), all-
commodities price index of Nigeria’s major agricultural export in the first half
of 2019 declined by 5.3 per cent, compared with 78.6 in the corresponding
period of 2018. The price decrease ranged from 2.6 per cent for groundnut to
13.9 per cent for soya beans. The price of soya beans, in particular, continued
to be undermined by the trade dispute between China and the US.
Favourable weather conditions also contributed to fall in price. However, the
price of rubber and wheat increased by 1.9 and 1.3 per cent, respectively. The
price of rubber maintained a steady increase following the implementation of
the Agreed Export Tonnage Scheme by top producers in a bid to reverse the
plummeting price. Thailand, Malaysia, and Indonesia had curbed rubber
exports by 240,000 tonnes since April 2019.
4.3.2 Industry
4.3.2.1 Industrial Policy and Institutional Support
During the review period, the Federal Executive Council (FEC) approved the
extension of the CBN’s Nigerian Electricity Market Stabilization Facility (NEMSF)
to cover the shortfall that might arise after the bulk traders (NBET) settled the
power Generating Companies (GenCos). The shortfalls, to be paid by the
Federal Government, would be converted to loans and paid back to the CBN.
The Nigerian Electricity Regulatory Commission (NERC) issued a license to
Green Energy International Limited (GEIL) for the generation of 40 megawatts
of electricity during the period. The power plant would feed Otakikpo Industrial
Park in Rivers State. Also, approval was given for the commencement of the

114
Meter Asset Providers (MAP) Programme to enhance the delivery of pre-paid
meters to electricity consumers across the country.
To support the Federal Government’s efforts at increasing access to electricity,
the African Development Bank Group (AfDB) approved US$200.00 million to
boost Nigeria’s Off-Grid Expansion Programme, being implemented by the
Rural Electrification Agency (REA). The Project has four components including:
solar hybrid mini grids for rural economic development; stand-alone solar
systems for homes and enterprises, as well as, technical assistance. The Project
would power households, MSMEs, and Federal universities, including teaching
hospitals.
The Transmission Company of Nigeria (TCN), under its Transmission
Rehabilitation and Expansion Program (TREP) received US$245.00 million
financial package from the French Development Agency (AFD). The Fund was
granted for the expansion of the electricity grid in the northern part of the
country, and the West African Power Pool (WAPP) North Core. The WAPP North
Core would connect Niger Republic, Benin Republic and Burkina Faso to a 330
kilovolt (KV) Double Circuit (DC) transmission line.
The Federal Government signed an agreement with the Africa Export and
Import Bank (AFREXIM), Africa Finance Corporation (AFC), African
Development Bank (AfDB), Bank of Industry (BOI), and the Nigerian Sovereign
Investment Authority (NSIA), under the implementation of the Made in Nigeria
for Exports (MINE) project. The Agreement would foster industrial activities in
the country and boost export earnings from made in Nigeria products. Under
the Project, three locations were designated as special economic zones (SEZ)
for the take-off. These were: Enyimba Economic City, in Abia State; Funtua
Cotton Cluster in Katsina State; and Lekki Model Industrial Park in Lagos State.
The Project would boost manufacturing contribution to GDP by 20.0 per cent,
generate export earnings of US$30.0 billion annually and create 1.5 million new
jobs by 2025.
The Presidential Enabling Business Environment Council (PEBEC) commenced
the fourth 60-day National Action Plan (NAP 4.0) on Ease of Doing Business

115
(EoDB). The NAP 4.0, was aimed at further reducing the challenges
encountered by the SMEs and businesses in identified areas, such as, business
start-ups, access to credit, tax, enforcing contracts within and across borders,
among others. The 4th National Action Plan would strengthen ongoing reform,
and improve the ease of doing business.
To revive the textile industry and create jobs for Nigerians, the CBN in
partnership with the National Cotton Association of Nigeria, engaged 100,000
cotton farmers to cultivate 100,000 hectares for the 2019 season. This was
aimed at improving cotton production from about 80,000 tonnes in 2018 to
over 300,000 tonnes by 2020. During the period, the CBN inaugurated the
Textile Revival Implementation Committee, consisting of representatives from
the Bank, Kaduna State Government, Ministries of Power, Works and Housing,
Finance, Agriculture and Rural Development, Industry, Trade and Investment,
and the Nigeria Customs Service. The Committee was mandated to revamp
the cotton, garment and textile sector in Nigeria.
4.3.2.2 Industrial Production
Available data indicated increased activities in the industrial sector in the first
half of 2019. At 108.5 (2010=100), the index of industrial production rose by 4.7
per cent, above the level in the corresponding period of 2018. The
development was attributed, largely, to improved performance in the
manufacturing and mining sub-sectors.

116
Figure 62
Industrial Production Index
(First Half 2017 - 2019, 2010=100)
Source: Computed based on data obtained from NBS and Manufacturing Association of
Nigeria (MAN)
4.3.2.3 Manufacturing
At 179.7 (2010=100), the estimated index of manufacturing production in the
first half of 2019, rose by 0.7 per cent, above 178.5 in the corresponding period
of 2018. The improvement was, largely, due to increase in new orders,
moderation in input prices and enhanced access to foreign exchange by
manufacturers.
4.3.3 Crude Oil
4.3.3.1 Policy and Institutional Support
In the first half of 2019, Nigeria and the Island of São Tomé and Principe,
through their Joint Oil Zone Organisation, signed a new Production Sharing
Contract (PSC) with the Total E&P (Exploration and Production) Nigeria Limited
for the exploration of over 500 million barrels of crude oil. The exploration would
begin in three blocks, 7, 8 and 11, located within the hydrocarbon-rich Joint
Development Zone (JDZ), owned by both countries in the Gulf of Guinea.
Similarly, the NNPC and its production sharing partners signed the Heads of
Term Agreement (HOT) for the development of the Bonga Main and Bonga
South West fields in OML 118. The Project was operated by SNEPCo with the
Esso Exploration & Production Nigeria (Deep-water) Limited, Total E&P Nigeria
Limited, and the Nigerian Agip Exploration Limited as co-ventures. The Project
175.00 178.50 179.70
72.40 76.10 77.90
123.80 132.30 126.20
103.20 107.00 108.50
-
50.00
100.00
150.00
200.00
First Half 2017 First Half 2018 First Half 2019
Manufacturing Mining Electricity Industry

117
has the capacity to increase Nigeria’s daily crude oil production by over
225,000 barrels.
Nigeria’s effort at ensuring local sufficiency in refined petroleum products was
bolstered with the commencement of the first phase of the rehabilitation of
the Port Harcourt Refinery Complex, which has a capacity of 210,000 barrels
per day. The Complex comprised the 60,000 barrels per day (old refinery built
in 1965) and the 150,000 barrels per day (newer refinery, commissioned in
1989). The Project was being executed by the Milan-based Maire Tecnimont
S.P.A, in collaboration with its Nigerian affiliate, Tecnimont Nigeria.
The Nigerian National Petroleum Corporation (NNPC), in collaboration with the
Economic and Financial Crimes Commission (EFCC), commenced the
tracking of Nigeria’s crude oil output and movements of vessels lifting crude
oil from the country. The tracking system would help the Corporation to collect
information on the vessels to determine the owners, the various loading points,
the deadweight, and the volume of crude oil lifted from the country. The
tracking system would be extended to the downstream sector to determine
the volume of premium motor spirit (PMS) imported, the quantity of products
and the depots the commodities are stored up to the point of retail.
Similarly, to curb illegal oil bunkering on Nigeria’s waters ways, the Department
of Petroleum Resources (DPR) developed the Automatic Identification System
(AIS) to track maritime vessels (ocean going vessels) carrying commodities. The
system enables the Agency to ascertain in real time, the volume and source
of products shipped across the globe. The crude oil and gas tracking system
provides data on the movement and operations of vessels that include
loading, cargo details, ship details, destinations (country/continent),
discharges and trade activities.
Also, the DPR, during the review period, developed the National Production
Monitoring System (NPMS), a crude oil and gas accounting solution. This system
would help the country to account for crude oil and gas produced before
export and also block all the leakages in oil and gas operations. It would also

118
ensure transparency, curb crude oil theft and help the country to ascertain its
daily production.
The Federal Government, through the Federal Ministry of Environment,
commenced the verification of the Environmental and Social Impact
Assessment Draft Report of the proposed Edo Modular Refinery, being
promoted by Edo Refinery and Petrochemicals Company Limited. The Refinery
has capacity to refine about 6000 barrels per day. The proposed project was
planned to be implemented in two phases with 1,000 and 5,000 barrels
capacity per day.
4.3.3.2 Crude Oil Production and Demand
Aggregate crude oil production, including natural gas liquids (NGLs) and
condensates by the Organisation of Petroleum Exporting Countries (OPEC),
averaged 35.02 million barrels per day (mbd) in the first half of 2019. This
represented a decrease of 3.9 and 4.9 per cent, below the levels in the
preceding and the corresponding periods of 2018, respectively. The
development was due, largely, to the extended 1.2 mbd OPEC-led supply cut
decision with allied oil-producing nations to stabilise the market.
Non-OPEC supply was estimated at an average of 63.72 mbd, indicating a 3.8
per cent increase above the corresponding period of 2018. The development
was attributed, mainly, to higher production by the US, Brazil, China, and
Australia. Total world supply averaged 98.74 mbd, indicating a marginal
increase of 1.0 per cent above the level in the first half of 2018.
World crude oil demand was estimated at an average of 99.0 mbd,
compared with 97.96 mbd in the corresponding period of 2018, representing
an increase of 1.1 per cent. Of this, demand from the Organisation for
Economic Co-operation and Development (OECD) countries was 47.8 per
cent, while non-OECD countries accounted for the balance. The increase in
World oil demand, during the review period, was attributed to increase from
the OECD region, especially OECD America, due to growth in their
petrochemical sector. In addition, rising demand in the transportation sector
of ‘Other Asia’ and China accounted for the increase in global demand.
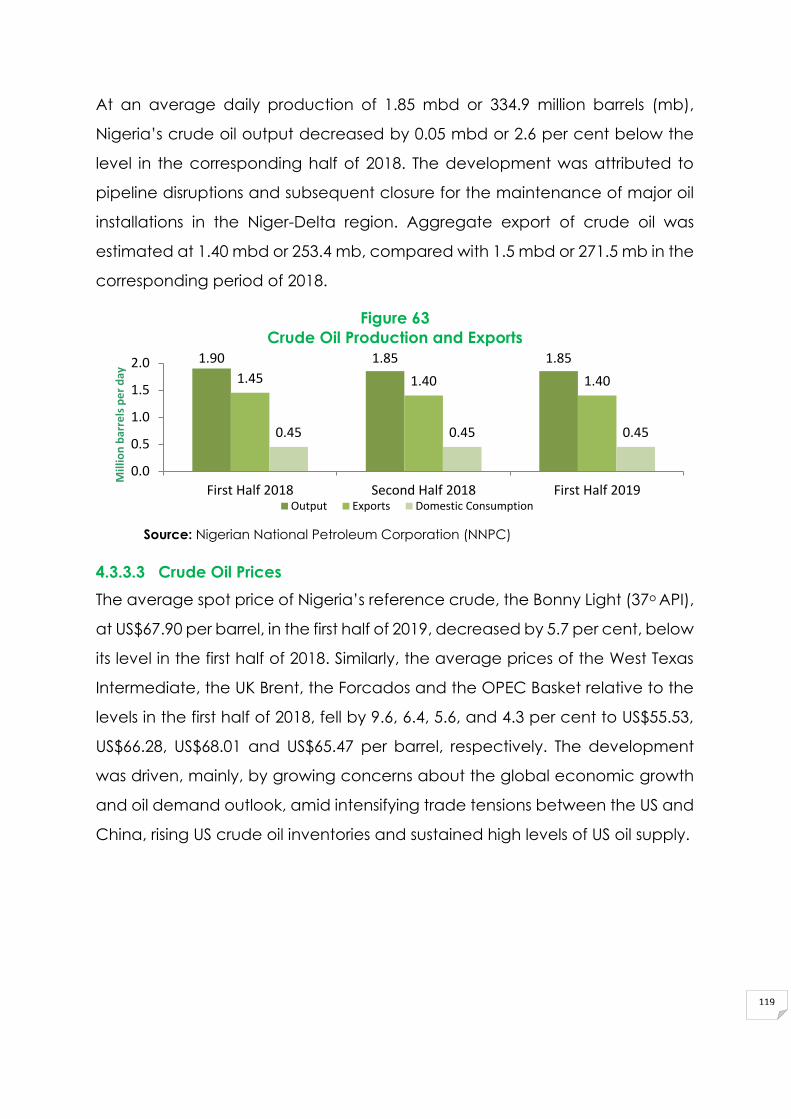
119
At an average daily production of 1.85 mbd or 334.9 million barrels (mb),
Nigeria’s crude oil output decreased by 0.05 mbd or 2.6 per cent below the
level in the corresponding half of 2018. The development was attributed to
pipeline disruptions and subsequent closure for the maintenance of major oil
installations in the Niger-Delta region. Aggregate export of crude oil was
estimated at 1.40 mbd or 253.4 mb, compared with 1.5 mbd or 271.5 mb in the
corresponding period of 2018.
Figure 63
Crude Oil Production and Exports
Source: Nigerian National Petroleum Corporation (NNPC)
4.3.3.3 Crude Oil Prices
The average spot price of Nigeria’s reference crude, the Bonny Light (37o API),
at US$67.90 per barrel, in the first half of 2019, decreased by 5.7 per cent, below
its level in the first half of 2018. Similarly, the average prices of the West Texas
Intermediate, the UK Brent, the Forcados and the OPEC Basket relative to the
levels in the first half of 2018, fell by 9.6, 6.4, 5.6, and 4.3 per cent to US$55.53,
US$66.28, US$68.01 and US$65.47 per barrel, respectively. The development
was driven, mainly, by growing concerns about the global economic growth
and oil demand outlook, amid intensifying trade tensions between the US and
China, rising US crude oil inventories and sustained high levels of US oil supply.
1.90 1.85 1.85
1.45 1.40 1.40
0.45 0.45 0.45
0.0
0.5
1.0
1.5
2.0
First Half 2018 Second Half 2018 First Half 2019
Mill
ion
bar
rels
pe
r d
ay
Output Exports Domestic Consumption

120
Figure 64
Average Spot Prices of Selected Crudes
Source: Reuters
4.3.4 Refinery Utilisation
The estimated average capacity utilisation of the three (3) refineries was 5.08
per cent in the first half of 2019, compared with below 18.6 per cent in the
corresponding period of 2018. A breakdown showed that the average
capacity utilisation of the Kaduna Refining and Petrochemical Company
(KRPC), the Warri Refining and Petrochemical Company (WRPC), and the Port
Harcourt Refining Company (PHRC) was 1.44, 13.21, and 0.58 per cent,
respectively.
Aggregate production of petroleum products from the refineries was
estimated at 6.1 million tonnes in the first half of 2019, compared with 3.9 million
metric tonnes recorded in the corresponding period of 2018. The development
was attributed to sustained seasonal maintenance, which began in 2016,
improved the efficiency of the refineries. Analysis of products by refinery
showed that the WRPC produced 5.7 million tonnes, while the PHRC and the
KRPC produced 0.18 and 0.24 million tonnes, respectively. Of the total, PMS
accounted for the largest share at 31.1 per cent, while the shares of
Automotive Gas Oil (AGO), fuel oil, Dual Purpose Kerosene (DPK), fuel and
losses, Liquefied Petroleum Gas (LPG), and Asphalt were 22.8, 21.6, 14.1, 6.3,
3.7 and 0.4 per cent, respectively.
4.3.5 Gas
4.3.5.1 Policy and Institutional Support
The Nigerian National Petroleum Corporation (NNPC) took a major step in
attaining sufficiency in domestic gas supply with the execution of Final
71
.99
73
.05
67
.90
70
.79
71
.54
66
.28
72
.03
73
.11
68
.01
61
.40
54
.28
55
.53
68
.40
70
.81
65
.47
0.00
20.00
40.00
60.00
80.00
First Half 2018 Second Half 2018 First Half 2019US
Do
llar
pe
r b
arre
l
BONNY LIGHT U.K. BRENT FORCADOS WEST TEXAS INTERMEDIATE OPEC BASKET

121
Investment Decision (FID) on the development of the 4.3 trillion cubic feet Assa
North/Ohaji South Fields (ANOH) in OML 21 with its Joint Venture partners,
which include: Shell Petroleum Development Company (SPDC), Total
Exploration and Production Nigeria (TEPNG) and Nigeria Agip Oil Company
(NAOC). The Project, would add about 600 million standard cubic feet of gas
per day (mmscfd) to the national gas grid with capacity to expand to 1.2
billion cubic feet per day. The ANOH project, a major gas supply hub in
Nigeria’s gas-infrastructure network, would provide the linkage between the
Eastern, Western and Northern gas pipeline system in the country.
In the review period, the Nigeria LNG Limited (NLNG) and Nigerian Content
Development Monitoring Board (NCDMB) signed the Development Plan for
Nigeria Content for NLNG’s Train 7 Project. The Project includes the design,
engineering, procurement, expediting, transportation, management,
construction, installation, pre-commissioning and start up support, and
acceptance testing of an expansion to the existing NLNG facility. Furthermore,
the Project would deepen Nigerian content in line with the Nigerian Oil and
Gas Industry Content Development (NOGICD) Act and also ramp up NLNG’s
production by 35.0 per cent from 22 million tonnes per annum (MTPA) to 30
MTPA.
4.3.6 Solid Minerals
4.3.6.1 Policy and Institutional Support
To curb the activities of armed bandits and illicit miners in Zamfara State, the
Federal Government suspended all forms of mining activities in the State and
ordered foreign miners to vacate mining sites. The operation was aimed at
restoring law and order in the affected communities.
In the review period, the Extractive Industries Transparency Initiative (EITI)
ranked Nigeria as the first Anglophone African country to have made
“Satisfactory Progress” in the implementation of all the requirements of the EITI
standards to entrench transparency in government and company systems.
Under the EITI standards, the member countries were assessed on multi-
stakeholders governance oversight, licenses and contracts, monitoring

122
production, revenue collection, socio-economic contribution, and outcomes
as well as impact.
The Canadian mineral exploration company, Thor Exploration, signed a
construction, engineering and procurement contract worth US$67.5 million
with the Norinco International Cooperation Limited, for its gold project in
Nigeria-Segilola Gold Project. The Plant would produce 650,000 tonnes of gold
ore per annum.
To further boost the performance of the solid mineral sub-sector, the Federal
Government invested N15.0 billion to upgrade a Geo-Science Data Bank that
would place the country on the world mining map. The Project would
generate detailed report that would serve as enabler in locating the vast
mineral resources available in Nigeria.
4.3.6.2 Solid Minerals Production
Provisional data from the Federal Ministry of Mines and Steel Development
indicated that solid minerals production in the first half of 2019 increased by
41.8 per cent above the level in the corresponding period of 2018, to 32.37
million tonnes. The increase in production of principal minerals such as clay,
coal, granite dust and talc accounted for the rise.
4.3.7 Electricity Generation
Average electricity generation, estimated at 4,092.62 MW/h, increased by 7.4
per cent, in the first half of 2019, above with 3,811.18 MW/h in the first half of
2018. This was attributed, largely, to improvement in gas supply to thermal
plants, better water management and enhanced transmission infrastructure.
4.3.8 Electricity Consumption
Average electricity consumed, in the review period, was estimated at 3,098.40
MW/h. This represented an increase of 1.5 per cent, above the level in the
corresponding period of 2018. The increase in consumption was attributed to
the improvement in transmission and distribution infrastructure.

123
4.3.9 Industrial Financing
4.3.9.1 The Bank of Industry (BOI)
The total credit disbursed to the industrial sector under the Bank’s various
facilities in the first half of 2019 fell by 14.7 per cent, to N96.9 billion, compared
with N113.54 billion in the corresponding period of 2018.
A sectoral breakdown of the disbursements showed that the financial services
sector received N23.0 billion, representing 23.7 per cent of the total, followed
by the healthcare and petrochemicals sub-sector, with N14.6 billion, or 15.1
per cent. The sum of N12.9 billion, or 13.3 per cent was disbursed through food
processing, while ; agro processing, creativity industry, engineering and
technology, solid minerals and N-power received N12.0 billion or 12.38 per
cent, N12.0 billion or 12.38 per cent, N8.7 billion or 8.9 per cent, N7.9 billion or
8.2 per cent and N5.0 billion or 5.2 per cent respectively, among others.
Of the total, large enterprises received N62.1 billion, representing 64.1 per cent,
while small and medium enterprises accounted for N34.8 billion, representing
35.9 per cent of the total.
Figure 65
Sectoral Disbursement of BOI Loans, First Half 2019
Source: Bank of Industry BOI
Financial services
24%
Solid Minerals8%
Agro Processing
13%
Creative Industry
12%
Engineering & Technology…
healthcare & petrochemical
15%
Food Processing
13%
Gender Business
0%
oil &gas1%
reewable energy
0%
N-power5%

124
4.3.9.2 The Nigerian Export-Import Bank (NEXIM)
The total funding support provided to the non-oil export sector, under various
facilities of NEXIM in the first half of 2019, was N14.50 million for twenty four (24)
projects, compared with N37.29 million disbursed in 2018 for one (1) project.
The development was attributed to the ongoing restructuring of the Bank’s
funding model. The Facility was, however, disbursed under the export
development fund (EDF).
Figure 66
NEXIM’s Credit Disbursements by Facility, First Half 2019
A sectoral analysis of the distribution showed that the Agriculture Sector had
the highest amount of N13.47 million, representing 93 per cent of the total. This
was followed by the Manufacturing sector, with N0.92 million or 6 per cent, and
Solid minerals with N0.12 million or 1 per cent.
4.3.10 Consumer Prices
Consumer prices declined for most part of the period under review, except for
the months of April and May 2019. The all-items composite consumer price
index (CPI) was 289.7 (November 2009=100) at end-June 2019, compared with
274.6 and 260.5 at end-December 2018 and end-June 2018, respectively. The
all-items less farm produce CPI was 267.9 at end-June 2019, compared with
Standing Facility6%
Direct Lending Facility
93%
Social & Community
Service1%
Standing Facility Direct Lending Facility Social & Community Service

125
256.7 and 246.1 at end-December 2018 and end-June 2018, respectively. The
Food CPI was 316.0 at end-June 2019, compared with 296.4 at end-December
2018 and 278.2 at end-June 2018.
Figure 66
Consumer Price Indices
(November 2009 = 100)
Source: NBS
4.3.10.1 Headline Inflation
The year-on-year headline inflation declined steadily for most months of the
first half of 2019, except for April and May 2019, which recorded slight increase
in the rates. After initial increase, during the period, the rate declined to 11.22
per cent, at end-June 2019, compared with 11.44 and 11.23 per cent at end-
December 2018 and end-June 2018, respectively. Similarly, the 12-month
moving average inflation maintained a steady decline throughout the review
period, as it decreased to 11.30 per cent at end-June 2019, from 12.1 and 14.37
per cent at end-December 2018 and end-June 2018, respectively. The
observed fall in headline inflation was attributed to the decline in the core
component of the CPI.
4.3.10.2 Core Inflation
The year-on-year core inflation (all-items less farm produce) declined
consistently during the first half of 2019, exhibiting the same trend as in the
second and first halves of 2018 (except in October 2018). The rate was 8.8 per
1st Half 2018 2nd Half 2018 1st Half 2019
headline 260.5 274.6 289.7
core 246.1 256.7 267.9
food 278.2 296.4 316.0
0.0
50.0
100.0
150.0
200.0
250.0
300.0
350.0
CP
I

126
cent at end-June 2019, down from 9.8 and 10.4 per cent at end-December
2018 and end-June 2018, respectively. Core inflation, on a 12-month moving
average basis, also showed a similar trend, as it declined to 9.64 per cent at
end-June 2019, compared with 10.51 per cent at end-December 2018 and
11.65 per cent at end-June 2018. The persistent decline in core inflation was
attributed to the moderation in exchange rate pass-through to domestic
prices.
4.3.10.3 Food Inflation
The year-on-year food inflation maintained a downward trend in the first half
of 2019, except in April and May 2019. It was 13.56 per cent at end-June 2019,
same as in end-December 2018. It, however, increased compared with 12.98
per cent recorded in June 2018. On 12-month moving average basis, food
inflation declined during the period, as the rate fell to 13.42 per cent at end-
June 2019, compared with 14.35 and 17.75 per cent at end-December 2018
and end-June 2018, respectively. The decline in food inflation, during the
period, was attributed to increased output, arising from sustained intervention
in the Agriculture sector, such as the Anchor Borrowers’ Programme (ABP) of
the CBN and the implementation of the Agricultural Input Mechanisation
Scheme (AMIS), which improved input supply to farmers.
Figure 67
Inflation Rate
(Year-on-Year, Per cent)
Source: NBS
0.00
5.00
10.00
15.00
20.00
25.00
1st Half 207 2nd Half 2017 1st Half 2018 2nd Half 2018 1st Half 2019
headline core food

127
4.3.10.4 Urban and Rural Consumer Price Indices and Inflation
The all-items urban CPI increased to 294.4 at end-June 2019, compared with
278.5 and 263.8 at end-December 2018 and end-June 2018, respectively. The
development was attributed, majorly, to the increase in the prices of the urban
core and food components of the CPI. Accordingly, the year-on-year urban
inflation declined to 11.61 per cent at end-June 2019, compared with 11.73
and 11.68 per cent at end-December 2018 and end-June 2018, respectively.
Similarly, the all-items rural CPI rose to 285.9 at end-June 2019, compared with
271.4 at end-December 2018 and 257.8 at end-June 2018. The development
was attributed, largely, to the increase in the prices of the rural core and food
components of the CPI. Consequently, the year-on-year rural inflation
declined to 10.87 per cent at end-June 2019, compared with 11.18 and 10.83
per cent at end-December 2018 and end-June 2018, respectively. Urban
headline inflation was higher than the rural headline inflation by 0.74
percentage point in the period under review.
Urban core inflation declined to 9.62 per cent at end-June 2019, compared
with 10.09 per cent at end-December 2018 and 10.83 per cent at end-June
2018. Urban food inflation was 14.40 per cent at end-June 2019, compared
with 14.19 and 13.69 per cent at end-December 2018 and end-June 2018,
respectively.
Rural core inflation fell to 8.2 per cent at end-June 2019, compared with 9.5
per cent at end-December 2018 and 10.0 per cent at end-June 2018. Rural
food inflation was 12.9 per cent at end-June 2019, compared with 13.0 and
12.3 per cent at end-December 2018 and end-June 2018, respectively.

128
Figure 68
Urban and Rural Consumer Price Indices
(November 2009 = 100)
Source: NBS
4.3.11 Communications
In the review period, MTN had been listed on the Nigerian Stock Exchange for
the first time in its operations in Nigeria. This development would drive growth
in the Communications sub-sector of the Nigerian economy because other
mobile operators would be encouraged to get listed.
Digital mobile lines continued to drive growth in the communications sector
during the review period. Data from the Nigerian Communications
Commission (NCC) showed that the number of active telephone lines was
174.0 million at end-June 2019, compared with 172.9 million and 162.8 million
at end-December and end-June 2018, respectively. This represented increase
of 0.64 and 6.88 per cent, relative to the preceding and corresponding periods
of 2018, respectively. In addition, the number of internet users in the country
increased to 122.3 million at end-June 2019, compared with 102.8 million at
end-June 2018. Teledensity, at 91.17 per 100 inhabitants at end-June 2019,
decreased by 25.09 per cent, below the 116.26 per 100 inhabitants recorded
at end-June 2018. Teledensity in Nigeria moved below the International
Telecommunication Union (ITU) minimum standard of 1:100 because from
March 2019, Teledensity was calculated based on a population estimate of
190 million, up from 140 million hitherto.
263.8
278.5
294.4
257.8
273.4
285.9
230.0
240.0
250.0
260.0
270.0
280.0
290.0
300.0
1st Half 2018 2nd Half 2018 1st Half 2019
Urban Consumer Price Index Rural Consumer Price Index

129
Figure 69
Total Active Lines and Teledensity
Source: Nigerian Communication Commission (NCC)
4.3.12 Transportation
The Federal Government during the review period, issued Executive Order 007
of 2019 on the Road Infrastructure Development and Refurbishment
Investment Tax Credit Scheme. The Executive Order provided mechanisms for
groups of investors to pool funds together to invest in road projects directly and
jointly through special purpose vehicles or in collaboration with institutional
investors such as Pension Fund Administrators, Collective Investment Schemes,
Insurance Companies and Investment Banks. These measures were adopted
by the Federal Government to enhance the ease of accessibility to the
Scheme’s benefits by prospective Investors. Under the pilot phase of the
scheme, six private sector players in the construction industry would execute
the Executive Order. They include Dangote Industries Limited, Lafarge Africa
Plc, Unilever Nigeria Plc, Flour Mills of Nigeria Plc, Nigeria LNG Limited, and
China Road and Bridge Corporation Nigeria Limited. These investors showed
interest in investing on 19 eligible road projects, totalling 794.4km, which have
been prioritised in 11 states across each of the six geo-political zones.
4.3.12.1 Aviation Services
4.3.12.1.1 Domestic Operations
According to the Federal Airports Authority of Nigeria (FAAN), a total of
5,186,775 passengers were airlifted by domestic airlines in the first half of 2019.
This represented a 13.6 per cent decrease below the 6,003,642 passengers
16
2.7
6
17
2.8
7
17
4.0
2
116.26123.48
91.17
113,762 113,626
109,182
106,000
108,000
110,000
112,000
114,000
116,000
80
100
120
140
160
180
End-June 2018 End-Dec. 2018 End-June 2019
Mill
ion
s
Mobile Phones (LHS) Teledensity (LHS) Fixed (RHS)

130
airlifted in the corresponding period of 2018. Total aircraft movement for the
first half of 2019 was 90,689 representing a decrease of 22.2 per cent below
the 116,569 recorded in the corresponding period of 2018.
4.3.12.1.2 International Operations
The number of passengers airlifted by airlines on international routes in the first
half of 2019 increased by 13.1 per cent to 2,316,182, compared with 2,048,299
in the first half of 2018. Aircraft movement also declined by 8.5 per cent to
19,114 in the review period, compared with 20,894 in the corresponding period
of the preceding year.
Cargo movement at designated airports increased by 41.8 per cent to 117.8
million kg from 83.1 million kg recorded in the first half of 2019. Mail movement
also rose by 14.9 per cent to 23.1 million kg in the first half of 2019, compared
with 20.1 million kg recorded in the corresponding period of 2018.
4.3.12.2 Railway Services
In the review period, the Federal Government awarded the contract for the
Abuja-Warri rail line. The rail line was planned to connect to a new seaport in
Warri. The planned E-ticketing solution has been approved by the
Infrastructure Concession Regulatory Commission (ICRC) who has issued a
certificate of compliance for the Full Business Case (FBC). Rail Track
rehabilitation and signalling projects
A total of 1,507,571 passengers and 155,206 tonnes of freight were moved by
trains operated by the NRC between January to June, 2019 compared with
1,478,634 passengers and 165,566 tonnes of freight moved during the
corresponding period of 2018.
4.3.12.3 Maritime Services
The Integrated National Security and Waterways Protection Infrastructure in
Nigeria (Deep Blue Project) was established during the period under review.
The project entails a multipronged approach towards tackling insecurity in
Nigerian territorial waters and the entire Gulf of Guinea through a Command,
Control, Communications, Computers and Intelligence (C4i) initiative, as well

131
as prevent illegal activities in the Nigerian Exclusive Economic Zone (EEZ),
among others.
Maritime Services also received a boost during the review period with the
Federal Government’s approval, in May 2019, for the construction of a new
seaport in Warri. The seaport was planned to be connected to Abuja through
the rail lines.
Accrding to the Nigeria Maritime Administration and Safety Agency (NIMASA),
a total of 2,656 ocean going vessels berthed at Nigerian ports during the
review period, compared with 9,289 vessels in the corresponding period of
2018. Cargo throughput stood at 97,934,577.893 metric tonnes in the first half
of 2019, compared with 96,603,396.94 metric tonnes in the corresponding
period of 2018, representing an increase of 1.38 per cent.
4.3.13 SOCIAL SECTOR DEVELOPMENTS
4.3.13.1 Health
The Global Polio Eradication Initiative, a public-private partnership, led by
national governments with five core partners - the World Health Organisation
(WHO), Rotary International, the US Centers for Disease Control and Prevention
(CDC), the United Nations Children's Fund (UNICEF) and the Bill & Melinda
Gates Foundation, pledged US$1.2 billion to eradicate polio in three countries
(Nigeria, Afghanistan, and Pakistan) with high prevalence of the disease. In
addition, the Rotary International donated US$5.7 million to the Nigerian
Government to support its fight against the disease. The Grant would be used
by the WHO and the UNICEF to support polio immunisation campaigns,
research and surveillance in the country.
4.3.13.2 Education
The World Bank initiated Better Education Service Delivery for All (BESDA) worth
US$611.00 million to effectvely tackle the challenge of out-of-school children.
The Initiative, which aimed to address the problem of Out-of-School Children
(OSC) prevalent in Kano, Akwa Ibom, Katsina, Kaduna, Taraba, Sokoto, Yobe,
Zamfara, Oyo, Benue Jigawa and Ebonyi states would also support the
Nigerian government in strengthening the quality of basic education across

132
the country. Consequently, the number of OSC in the country reduced from
13.2 million to 10.2 million during the 2018/19 academic session. To
complement this Initiative, the Federal Government, during the period,
constructed 2,493 new classrooms, 2,457 Ventilated Improved Pit (VIP) toilets,
19 laboratories and 91 boreholes across the country. In addition, 1,266
classrooms were renovated, 192,985 and 10,038 furniture were procured for
pupils and teachers, respectively.
The Nigerian University Commission (NUC), within the review period, approved
four new private universities. These were; Greenfield University, Kaduna,
Kaduna State; Dominion University, Ibadan, Oyo State; Trinity University, Yaba,
Lagos State; and Westland University, Iwo, Osun, State. Consequently, the
number of universities in the country increased from 170 to 174, classified into
Federal (43), State (48) and Private (83) universities.
4.3.13.3 Environment
The Federal Government and other stakeholders commenced the assessment
of projects for submission under the Global Environmental Facility (GEF). Under
the new four-year investment cycle, known as GEF-7, Nigeria would be given
US$20.65 million out of the US$4.1 billion GEF’s Trust Fund. The Project would be
the first funding after Global Goals of Agenda 2030, and the Paris landmark
agreement, aimed at safeguarding the world’s forests, land, water, climate,
and oceans; building green cities, protecting threatened wildlife, and tackling
new environmental threats, such as marine plastic pollution.
The Federal Executive Council approved five new contracts for the clean-up
of Ogoni land in Rivers State. The new contracts, valued at N3.04 billion, were
to further safeguard the flora and fauna; and the health of the community.
The ongoing clean-up activities in 21 remediation sites across Ogoni land is
being carried out by 95.0 per cent of indigenous workers.

133
4.3.13.4 Housing and Urban Development
During the review period, an agreement was signed between the Association
of Housing Corporations of Nigeria (AHCN), Federal Housing Authority (FHA),
the Federal Mortgage Bank of Nigeria (FMBN) and Family Homes Fund (FHF) to
boost provision of affordable houses to low income earners. The target buyers
were mainly NHF subscribers, as each of the housing units was expected to be
between N5.0 million and N10.0 million. Under the Agreement, FHF would
provide fund for construction, FMBN would support subscribers, especially civil
servants with loans, while construction would be handled by AHCN members.
The first phase would consist of 500 units, which would cover Lagos, Enugu,
Akwa Ibom, Niger, Kaduna, Imo and Yobe states.
The Kaduna State Government signed a Memorandum of Understanding with
the China Civil Engineering Construction Corporation (CCECC) for the Kaduna
Urban Renewal Project. The Project was aimed at urbanising the state capital.
The Project has 14 components, which include: roads; mass transit; housing;
improved land use; street lights; parks and recreational centres. The Project
located in four local government areas - Kaduna North, Kaduna South, Chikun
and Igabi, would improve the state’s competitiveness, support economic
development and promote the well-being of the populace.
4.3.14 Activities of the National Emergency Management Agency
The National Emergency Management Agency (NEMA), in collaboration with
the stakeholders, commenced the review of the National Contingency Plan
(NCP) to reposition the country against the impact of disasters. The aim was to
put together, in a simplified manner, the disaster risk management implications
for the 2019 Seasonal Rainfall Prediction (SRP). The Plan, when completed,
would provide information on disaster management implications on
agriculture, water resources, health and infrastructure. This would assist
stakeholders to promptly take necessary actions required to facilitate disaster
risk management in their jurisdictions.

134
During the review period, NEMA offered support to several communities
affected by various forms of disasters across the country. In Niger State, 550
victims of rainstorm disaster were given relief materials to rebuild structures that
were destroyed. In Borno State, 12,000 farmers displaced by the Boko Haram
insurgence were supported under its Emergency Agriculture Intervention
Programme for the cropping season through the National Food Security
Council. The farmers would have access to fertilizers and farm inputs, thereby
improving agricultural produce.
4.3.15 Activities of the Niger Delta Development Commission
The NDDC commissioned a 132 KV transmission line and 30MVA, 132/33KVA
substation at Afiesere, Ughelli in Delta State. The Facility, which cost N2.2 billion,
would improve power supply in Ughelli and its environs. The scope of work
included the construction of 12.3 KM double conduit 132KV transmission line
from Transcorp Power Plant to Afiesere and erection of 2 (two) 132KV line bay
extension substation at Ughelli.
The NDDC, in collaboration with the Centre for Women and Vulnerable
Children (CWVC), organised an empowerment programme for over 500
women in Calabar, Cross River State. The Programme was aimed at
developing the women to be self-reliant socially and economically. It also
collaborated with Potters Heritage Foundation (PHF) to train and empower
over 30 physically-challenged persons with skills acquisition in Bayelsa State.
The beneficiaries were trained on bead making, shoe making, photography,
mobile phone repairs, makeup, confectionary and wig making.
135
4.4 EXTERNAL SECTOR DEVELOPMENTS
In the first half of 2019, the external sector recorded an overall balance of
payments surplus of 1.0 per cent of gross domestic product (GDP). The current
account, however, recorded a deficit of N1,739.69 billion or 2.6 per cent of
GDP, as against a surplus of N1,762.75 billion (3.0% of GDP) in the first half of
2018. The capital and financial account recorded a net financial asset of
N2,449.16 billion, representing 3.6 per cent of GDP in the review period, relative
to N421.43 billion (0.7% of GDP) in the first half of 2018. The stock of external
reserves at end-June 2019, increased by 5.1 per cent to US$44.75 billion,
compared with US$42.59 billion at end-December 2018. The reserves could
finance 9.6 months of import (goods only) or 5.7 months of imports of goods
and services. The stock of external debt increased by 18.6 per cent to US$25.61
billion, equivalent to 11.7 per cent of GDP at end-March 2019, but still within
the sustainable international threshold of 40.0 per cent of GDP. In the foreign
exchange market, the pressure on the naira exchange rate eased, owing to
foreign exchange management initiatives implemented by the Bank. The
average exchange rate of the naira at the inter-bank and BDC segments of
the market were N306.90/US$ and N359.77/US$, respectively, while it
exchanged at N361.33/US$ at the Investors and Exporters (I&E) window.
4.4.1 Current Account
Provisional data showed that the current account recorded a deficit of
N1,739.69 billion or 2.6 per cent of GDP, in contrast to a surplus of N1,762.75
billion or 3.0 per cent of GDP in the corresponding half of 2018. The
development was attributed, largely, to lower trade surplus in the goods
account and higher deficit in the services account, which offset the increased
surplus in the current transfers account.
4.4.1.1 Trade
Estimated aggregate external trade increased to N18,168.06 billion or 27.0 per
cent of GDP, in the first half of 2019, above the N16,869.52 billion or 24.3 per
cent of GDP and N14,863.66 billion or 24.9 per cent of GDP in the preceding
and the corresponding periods of 2018, respectively. A disaggregation

136
showed that export decreased to N9,582.44 billion, from N10,049.19 billion in
the second half of 2018, but increased by 3.8 per cent, compared with
N9,230.40 billion in the first half of 2018. A further analysis revealed that crude
oil and gas component, which constituted 86.4 per cent of total export,
decreased to N8,280.91 billion in the review period, below the N9,457.63 billion
and N8,387.73 billion in the preceding and corresponding periods of 2018,
respectively. This was on account of decrease in production and average
price of crude oil, in the review period. The average price of the Bonny Light
decreased to US$68.03 per barrel from US$71.93 per barrel and US$72.75 per
barrel in the preceding and corresponding halves of 2018, respectively. Non-
oil component, which constituted the remaining 13.6 per cent of total export,
however, grew significantly to N1,301.52 billion in the review period, above the
N591.56 billion and N841.67 billion in the second and first halves of 2018,
respectively. This was attributed to increased export of manufactured goods
and agricultural produce, reflecting on-going efforts towards diversifying the
economy.
Aggregate import was N8,585.62 billion in the review period, compared with
N6,820.32 billion and N5,633.26 billion in the preceding and corresponding
halves of 2018, respectively, indicating increase of 25.9 and 52.4 per cent. The
growth was as a result of the increase in the importation of non-oil products,
which constituted 84.7 per cent of total import or 10.8 per cent of GDP in the
review period. Oil and gas import, representing 15.3 per cent of total import,
decreased to N1,315.64 billion or 2.0 per cent of GDP, below the level in the
preceding and corresponding halves of 2018. Overall, the goods account
registered a trade surplus of N996.82 billion in the review period, relative to
N3,228.87 billion and N3,597.14 billion in the preceding and corresponding
periods of 2018, respectively.

137
Figure 70
Export, Import and Trade Balance
(N’ Billion)
Source: CBN
A breakdown of visible import by sector indicated that industrial sector import
accounted for the largest share of 59.4 per cent, followed by manufactured
products with a share of 34.6 per cent. Oil sector accounted for 4.0 per cent;
food products, 1.9 per cent; and agricultural sector, 0.1 per cent of the total.
Figure 71
Visible Import by Sector, First Half 2019
(Per cent)
Source: CBN
9,2
30
.40
10
,04
9.1
9
9,3
82
.44
5,6
33
.26
6,8
20
.32
8,5
85
.62
-
2.00
4.00
6.00
8.00
10.00
12.00
1st Half 2018 2nd Half 2018 1st Half 2019
Nb
illio
n
Exports Imports Trade Balance
Oil Sector4.0%
Industrial 59.4%
Manufacturig34.6%
Food Product1.9%
Agriculture0.1%

138
A disaggregation of non-oil export by products revealed that agricultural,
other products, semi-manufactured, manufactured and mineral products
accounted for 56.6, 17.8, 11.0, 9.6 and 5.0 per cent of total, respectively.
Figure 72
Non-Oil Export by Products
(First Half 2019, Per cent)
Source: CBN
Analysis of non-oil export to the Economic Community of West African States
(ECOWAS) sub-region showed a total value of US$196.67 million in the first half
of 2019. Among member-countries, export to Ghana was the highest at
US$60.67 million or 30.0 per cent of total. This was followed by Niger, US$44.27
million (22.5%); Togo, US$28.13 million (14.3%); and Benin, US$23.94 million
(12.2%). Export to Cote d’Ivoire was US$16.02 million (8.1%); Senegal, US$11.80
million (6.0%); and Guinea, US$5.55 million (2.8%). Other countries accounted
for the balance. The dominant export commodity to the sub-region remained
instant noodles, detergents, tobacco, plastics, dairy products, soya beans
meal, and carbonated soft drink.
Agricultural, 56.6 %Minerals,
5.0 %
Semi-Manfactured,
11.0%
Manufactured, 9.6 %
Others, 17.8%

139
Figure 73
Non-oil Export to the ECOWAS sub-Region in the First Half of 2019
(Per cent)
Source: CBN
Foreign Exchange Receipts by Top Hundred (100) Exporters
Available data showed that aggregate value of export proceeds of the top
one hundred exporters, in the first half of 2019, was US$976.16 million, indicating
a decline of 14.3 per cent, below the US$1,138.99 million in the corresponding
period of 2018. Analysis of the activities of the “Top 100 Non-oil Exporters”
showed that Olam Nigeria Limited topped the list with a value of US$193.46
million or 19.8 per cent of the total, from the export of cocoa beans, cashew
nuts, and sesame seeds to Turkey and China. The second major non-oil
exporter was Indorama Eleme Fertilizer and Chemicals Limited at US$117.83
million (12.1%), realised from the export of urea, fertilizers and agronomy
services to Turkey and China. The third major non-oil exporter was the British
American Tobacco Nigeria Limited, with a value of US$53.77 million (5.5%) from
the export of cigarettes to Liberia, Guinea, Ghana, Cameroun, Cote d’Ivoire
and Niger. Mamuda Industries Nigeria Limited follwed, with US$39.67 million
(4.1%) from the export of processed and finished leather to Italy, India and
Spain. Metal Recycling Industries Limited was fifth with value of US$38.50 million
(3.9%), from the export of re-melted copper and aluminum ingots to Japan,
Benin, 12.2%
Côte d’Ivoire, 8.1%
Ghana, 30.8% Guinea, 2.8%
Niger, 22.5%
Senegal, 6.0%
Togo, 14.3%

140
China and South Korea. Banarly (Nig) Limited, Llyods Industries Limited and
Colossus Investment Limited, were at 96th, 97th, 98th, and 99th positions with
export earnings of US$1.24 million, US$1.23 million and US$1.18 million,
respectively. Their major export products were frozen shrimps, aluminum alloy
ingots, and cashew nut to Spain, Japan and China, respectively. Saro Agro
Allied Limited placed 100th with export value of US$1.17 million, from the export
of cocoa beans to Estonia, Malaysia and Spain.
4.4.1.2 Services
The deficit in the services account widened significantly to N4,971.81 billion or
7.4 per cent of GDP, from N4,710.75 billion or 6.8 per cent of GDP and N3,256.04
billion or 14.9 per cent of GDP, in the preceding and corresponding periods of
2018, respectively. This was due, mainly, to increased outpayments,
particularly in the transportation and travels components of the account. A
disaggregation of services payments showed that other business services
constituted the bulk at N2,389.12 billion or 48.0 per cent of total payments.
Travel services, at N1,765.88 billion or 35.5 per cent of the total, increased by
29.3 per cent above its level in the preceding period of 2018, as a result of
increased payment in respect of personal travels, mainly education and
health related. Payments in respect of transportation services also increased
to N751.46 billion, accounting for 15.0 per cent of the total, owing to higher
payments of passenger fares and freight charges. Payments in respect of
royalties & license fees increased by 0.2 per cent, to N38.74 billion, representing
0.8 per cent of the total. Government and communication services sub-
accounts though in surplus, declined by 2.3 and 3.3 per cent to N30.43 billion
and N10.09 billion, respectively, in the review period. “Others” accounted for
the balance.

141
Figure 74
Share of Services Out-Payments
(First Half 2019, Per cent)
Source: CBN
4.4.1.3 Income
Provisional data showed that transactions in the income account resulted in a
lower deficit of ₦1,892.69 billion or 2.8 per cent of GDP, compared with
₦2,408.71 billion or 3.5 per cent of GDP and ₦2,196.43 billion or 3.7 per cent of
GDP, in the second and first halves of 2018, respectively. This was due, majorly,
to decreased payment of dividends and distributed branch profits during the
review period. The deficit in the investment income sub-account narrowed by
16.9 and 8.4 per cent to ₦1,927.40 billion, below the ₦2,443.94 billion and
₦2,232.64 billion, in the preceding and corresponding periods of 2018,
respectively. On the contrary, compensation of employees’ sub-account
recorded a surplus of ₦34.71 billion in the review period, though lower than the
₦35.23 billion and ₦36.21 billion in the preceding and corresponding halves of
2018, by 1.5 and 4.1 per cent, respectively.
4.4.1.4 Current Transfers
The surplus in the current transfers account rose to N4,127.99 billion or 6.1 per
cent of GDP, above the N3,756.90 billion (5.4% of GDP) and N3,618.07 billion,
(6.1% of GDP), in the second and first halves of 2018, respectively. This was
influenced, largely, by the sustained inflow of home remittances, and inflow of
aid in form of medical equipment by Doctors Without Borders, during the
Transport15.00%
Travel35.50%
Other Business 48.00%
Insurance1.50%
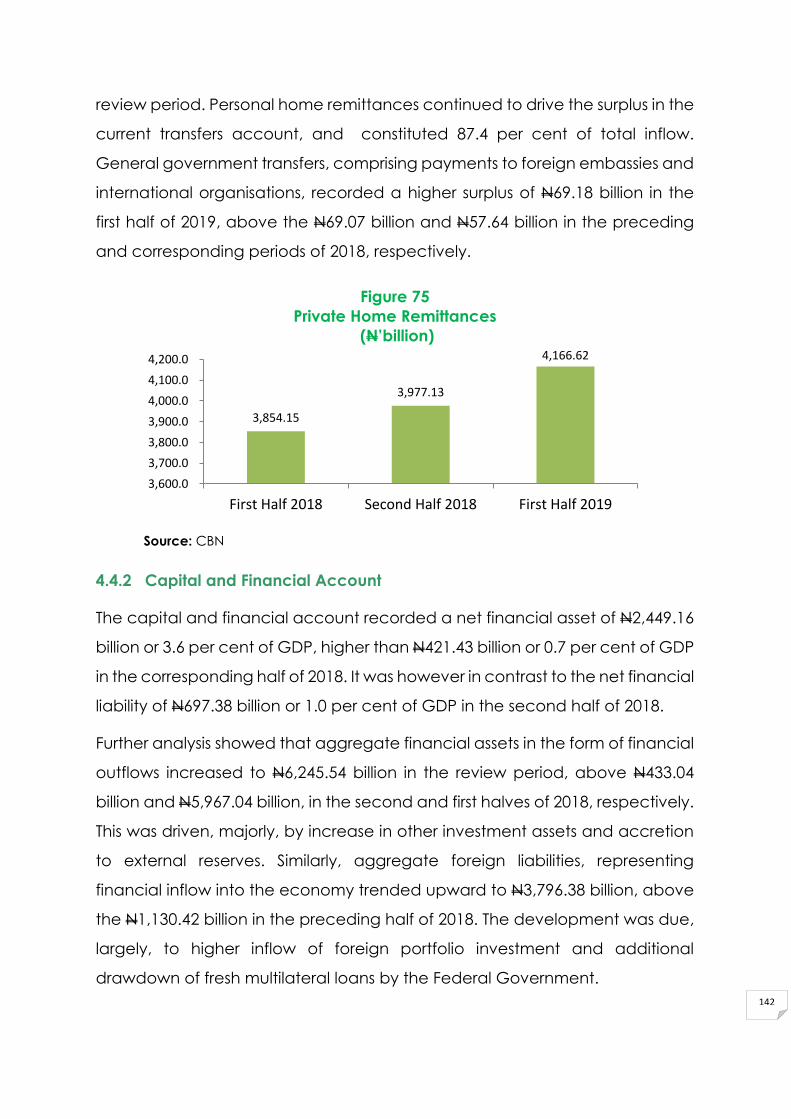
142
review period. Personal home remittances continued to drive the surplus in the
current transfers account, and constituted 87.4 per cent of total inflow.
General government transfers, comprising payments to foreign embassies and
international organisations, recorded a higher surplus of N69.18 billion in the
first half of 2019, above the N69.07 billion and N57.64 billion in the preceding
and corresponding periods of 2018, respectively.
Figure 75
Private Home Remittances
(N’billion)
Source: CBN
4.4.2 Capital and Financial Account
The capital and financial account recorded a net financial asset of N2,449.16
billion or 3.6 per cent of GDP, higher than N421.43 billion or 0.7 per cent of GDP
in the corresponding half of 2018. It was however in contrast to the net financial
liability of N697.38 billion or 1.0 per cent of GDP in the second half of 2018.
Further analysis showed that aggregate financial assets in the form of financial
outflows increased to N6,245.54 billion in the review period, above N433.04
billion and N5,967.04 billion, in the second and first halves of 2018, respectively.
This was driven, majorly, by increase in other investment assets and accretion
to external reserves. Similarly, aggregate foreign liabilities, representing
financial inflow into the economy trended upward to N3,796.38 billion, above
the N1,130.42 billion in the preceding half of 2018. The development was due,
largely, to higher inflow of foreign portfolio investment and additional
drawdown of fresh multilateral loans by the Federal Government.
3,854.15
3,977.13
4,166.62
3,600.0
3,700.0
3,800.0
3,900.0
4,000.0
4,100.0
4,200.0
First Half 2018 Second Half 2018 First Half 2019

143
4.4.2.1 Foreign Direct Investment
Inflow of FDI increased to N631.19 billion, equivalent to 0.9 per cent of GDP in
the first half of 2019, compared with N230.40 billion and N379.84 billion, in the
second and first halves of 2018, respectively. This was as a result of increased
inflow of fresh equity capital during the review period. In terms of share in total
inflow, FDI accounted for 16.6 per cent in the review period. In the same vein,
outward direct investment increased by 8.0 and 8.3 per cent to N228.11 billion
or 0.3 per cent of GDP, above N211.23 billion and N210.73 billion in the second
and first halves of 2018, respectively. This reflected renewed interest of resident
investors in international enterprises. As a share of total capital outflow, FDI
accounted for 3.7 per cent.
4.4.2.2 Portfolio Investment
Portfolio investment inflow surged to N3,556.16 billion or 5.3 per cent of GDP,
above N970.44 billion and N2,862.17 billion, in the preceding and
corresponding halves of 2018, respectively. This was due, largely, to increased
investment in equity and debt securities, particularly short-term debt securities,
occasioned mainly by the attractive returns on investment. The share of
portfolio investment inflow in total capital was 93.7 per cent. A further analysis
showed that the Greenspan-Guidotti measure of external reserve adequacy,
measured by the ratio of portfolio investment to external reserves, remained
adequate at 385.5 per cent, above the 100.0 per cent international
benchmark. Portfolio investment outflow also increased to N3.59 billion in the
review period, compared with N0.04 billion in the preceding half of 2018,
reflecting favourable investment conditions, particularly in the United States.
4.4.2.3 ‘Other’ Investment
“Other” investment driven, largely, by loans, and currency & deposits
recorded an outflow of N390.96 billion (0.6% of GDP) in the review period, as
loan repayment in contrast to an inflow of N2,303.59 billion in the first half of
2018. This was higher than the N70.38 billion outflow recorded in the second
half of 2018. The “other” investment asset sub-account rose significantly to
N5,354.22 billion from N1,608.72 billion and N3,366.86 billion in the preceding

144
and corresponding periods of 2018. This was attributed, largely, to increased
foreign currency holdings of the private sector and banks. “Other” investment
asset constituted the highest share of 85.7 per cent of total financial assets in
the review period.
Figure 76
Foreign Capital Inflows
Source: CBN
4.4.3 Capital Importation and Capital Outflow
Provisional data showed that new capital imported into the economy, as
reported by banks, amounted to US$14.31 billion in the review period,
compared with US$11.82 billion in the first half of 2018. A disaggregation of
capital imported by sectors showed that 33.2 per cent of the total new capital
was invested in banking, while investment in financing accounted for 26.5 per
cent. The purchase of shares, servicing, production/manufacturing,
agriculture, and trading accounted for 24.6, 5.9, 4.2, 2.1 and 1.7 per cent,
respectively, of the total. Other sectors accounted for the balance.
A further breakdown by type of investment, indicated that portfolio investment
remained dominant accounting for 80.0 per cent of the total, followed by
other investments with 16.7 per cent, while FDI inflow accounted for the
remaining 3.3 per cent. By country of origin, the United Kingdom remained the
highest source of inflow, accounting for 53.5 per cent of the total, followed by
the United States with 18.8 per cent. South Africa, United Arab Emirates and
Belgium accounted for 7.5, 4.3 and 3.1 per cent, respectively, while other
countries accounted for the balance.
379.84 230.40
631.19
2,862.17
970.44
3,556.16
2,303.59
(70.38)-390.96
-1,000.00
-500.00
0.00
500.00
1,000.00
1,500.00
2,000.00
2,500.00
3,000.00
3,500.00
4,000.00
1st Half 2018 2nd Half 2018 1st Half 2019
N' b
illio
n
FDI Inflows Portfolio Inflows Other Investment Inflows
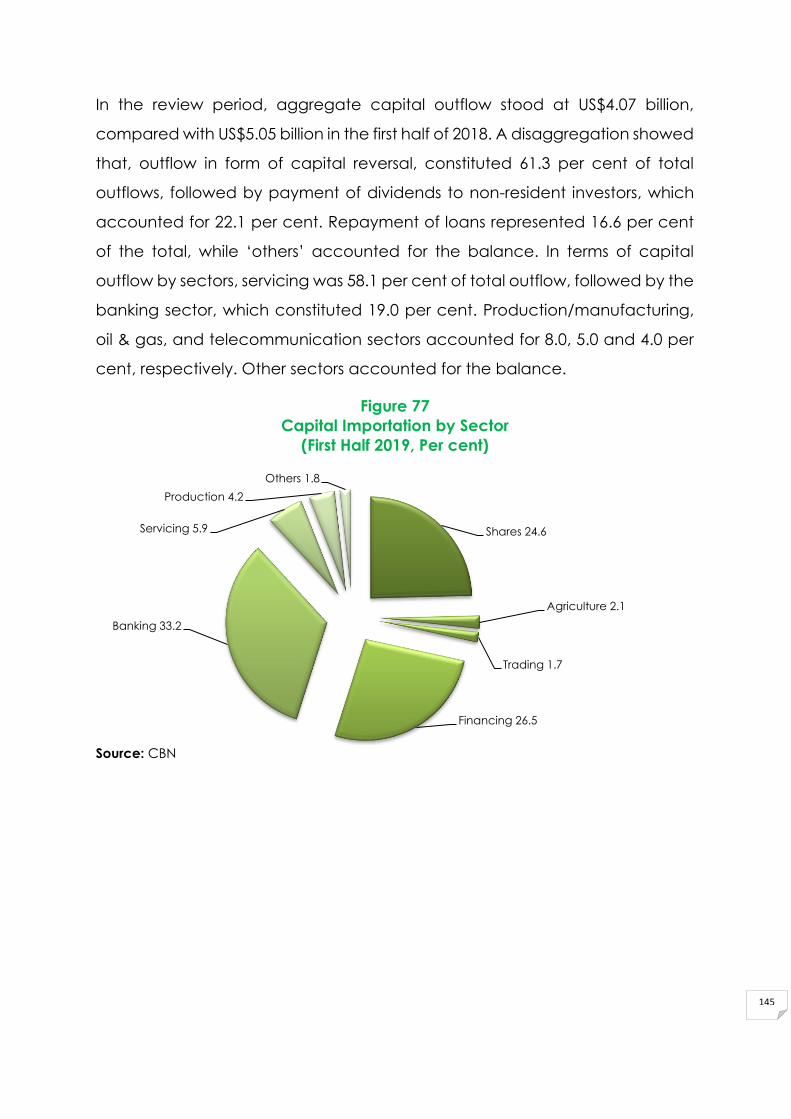
145
In the review period, aggregate capital outflow stood at US$4.07 billion,
compared with US$5.05 billion in the first half of 2018. A disaggregation showed
that, outflow in form of capital reversal, constituted 61.3 per cent of total
outflows, followed by payment of dividends to non-resident investors, which
accounted for 22.1 per cent. Repayment of loans represented 16.6 per cent
of the total, while ‘others’ accounted for the balance. In terms of capital
outflow by sectors, servicing was 58.1 per cent of total outflow, followed by the
banking sector, which constituted 19.0 per cent. Production/manufacturing,
oil & gas, and telecommunication sectors accounted for 8.0, 5.0 and 4.0 per
cent, respectively. Other sectors accounted for the balance.
Figure 77
Capital Importation by Sector
(First Half 2019, Per cent)
Source: CBN
Shares 24.6
Agriculture 2.1
Trading 1.7
Financing 26.5
Banking 33.2
Servicing 5.9
Production 4.2
Others 1.8

146
Figure 78
Capital Outflow and Outward Transfers
(First Half 2019, Per cent)
Source: CBN
4.4.4 External Reserves
Gross external reserves at end-June 2019 stood at US$44.75 billion, compared
with US$42.59 billion at end-December 2018. The increase was due, largely, to
foreign exchange purchases. The external reserves position could finance 5.7
months of import of goods and services or 9.6 months of goods only. A
breakdown of the external reserves by ownership showed that, the CBN had
the largest share of 83.2 per cent, followed by the Federal Government with
16.8 per cent. The share of Federation accounted for the balance of 0.01 per
cent. In terms of currency composition, the US dollar at US$40.14 billion,
constituted 89.7 per cent of total; special drawing rights, US$2.08 billion (4.7%);
Chinese yuan, US$2.06 billion (4.6%); and others, the balance.
Figure 79
External Reserves Stock and Months of Import Commitments
Source: CBN
Capital Transfers61.3
Dividends 22.1
Loans 16.6
47.1642.59 44.75
0
10
20
30
40
50
First Half 2018 Second Half 2018 First Half 2019
US$
bill
ion
External Reserves Months of Import Commitments (Goods only)
Months of Import Commitments (Goods and Services)

147
4.4.5 External Debt
External debt stock at end-March 2019 was US$25.61 billion (11.7% of GDP) an
increase of 18.6 and 16.0 per cent above the US$21.59 billion and US$22.08
billion, at end-December 2018 and end-June 2018, respectively. Further
breakdown showed that loan from multilateral sources, mainly the World Bank
and African Development Bank Groups, amounted to US$11.25 billion (43.9%).
Loan from commercial sources in the form of Eurobond was US$11.17 billion
(43.6%); while bilateral sources, mainly, the China EXIM Bank accounted for the
remaining US$3.19 billion (12.5%).

148
5.0 THE INTERNATIONAL MONETARY SYSTEM
5.1 Global Institutions
5.1.1 The International Monetary Fund (IMF)/World Bank Spring and Annual
Meetings
The 2019 Spring Meetings of the Board of Governors of the World Bank Group
(WBG) and the International Monetary Fund (IMF) were held in Washington
DC, USA, from April 8 – 14, 2019. The Nigerian delegation to the Meetings was
led by the Honourable Minister of Finance, Mrs. Zainab Ahmed, supported by
the Governor, Central Bank of Nigeria, Mr. Godwin Emefiele (CON). The
sideline meetings of the Ministers of the Inter-Governmental Group of 24 on the
International Monetary and Finance Committee (IMFC) and the Development
Committee (DC) were also held. In addition, the delegation attended
seminars and held bilateral meetings with the International Finance
Corporation (IFC) and rating agencies.
The G24 Ministers:
• Noted that global growth was projected to moderate in 2019, and was
expected to pick-up in 2020. They highlighted the ongoing trade
tensions, sharp tightening in financial conditions, large swings in
commodity prices and limited policy space, as downside risks
confronting the global economy;
• Identified the major challenges confronting emerging market and
developing economies (EMDEs) as weak productivity growth, increasing
inequality, climate change, migration, demographic shifts and policy
uncertainty;
• Advocated for multilateralism in addressing trade disputes, and
challenged the Fund to champion a multilateral approach to trade.
They stressed the importance of deepening the voice and governance
reforms for the legitimacy and effectiveness of the two institutions, and
reiterated that the stalled progress of the IMF 15th General Review of
Quota was a major setback to the completion of the Board
Representation Reforms under the 14th Review. They further called for a
third Chair for Sub-Saharan Africa to enhance the voice and

149
representation of the region without this being at the expense of another
EMDEs’ Chair; and
• Called on IMF and WBG to promote staff diversity, educational
institutions diversity and gender balance, especially for some regions
and countries that were grossly under-represented in recruitment and
career progression.
The Development Committee:
• Reaffirmed its commitment to strong governance, including tackling
corruption, implementing policies that foster innovation and fair market
competition, addressing challenges from demographic shifts, ensuring
that gains from technological change and economic integration were
widely shared, and effectively assisting those bearing the costs of
adjustment;
• Promised to expedite work for a globally fair and modern international
tax system and address harmful tax competition, artificial profit shifting
and other tax challenges, such as those related to digitalisation. It also
promised to tackle sources and channels of money laundering and
terrorism financing, proliferation of illicit finances, and, addressing
correspondent banking relationship issues. On promoting debt
transparency and sustainable financing practices by both debtors and
creditors, it promised to strengthen creditor coordination in debt
restructuring; and
• Referred to its endorsed transformative capital package for
International Bank for Reconstruction and Development (IBRD) and
International Finance Corporation (IFC), and noted that the package
and the forward-looking guide was the WBG’s strategic direction to
2030. It welcomed the paper titled “Update: The Forward Look and IBRD-
IFC Capital Package Implementation” and the significant policy reforms
delivered, including: IBRD loan pricing and Single Borrower Limit
differentiation, the IFC Additionality Framework, the IBRD Financial
Sustainability Framework, and the revised methodology for staff

150
compensation. It further noted the strong, yet selective, WBG
engagements in countries above the graduation discussion income as
reflected in the revised guidance for country partnership frameworks. It
encouraged the Group to continue to implement and monitor the
agreed efficiency measures, in addition to a continuous track of
progress against the Forward Look and capital package commitments.
5.1.2 The 2019 World Economic Forum (WEF) Annual Meeting
The 2019 World Economic Forum (WEF) was held in Davos, Switzerland from
January 22-25, 2019 with the theme ‘’Globalization 4.0: Shaping a Global
Architecture in the Age of the Fourth Industrial Revolution'’. Global leaders
from business, government, international organisations, academia and civil
society were in attendance. The annual meeting included sessions on issues
relating to the global economy, energy, technology, leadership, natural
resources, sustainable growth, health and environment, amongst others.
The Meeting was based on the following five working principles:
• Dialogues are critical and must be based on multi-stakeholder
engagements;
• Globalisation must be responsible and responsive to regional and
national concerns;
• International coordination must be improved in the absence of
multilateral cooperation;
• Addressing the biggest global challenges requires the collaborative
efforts of business, government and the civil society; and
• Global growth must be inclusive and sustainable.
Discussions at the Forum included series of “Global Dialogues”, which focused
on the following interrelated areas:
• Geopolitics;
• The future of the global economy;
151
• Industry systems;
• Cyber-security; and
• Human capital and institutional reforms.
5.1.3 The Group of Twenty-Four (G-24) Technical Group Meeting
The Intergovernmental Group of Twenty-Four on International Monetary Affairs
and Development (G-24) Technical Group Meeting (TGM), took place in Lima,
Peru from March 14-15, 2019. The following topics were discussed:
• Coping with Global Uncertainties and the Global Financial Safety Net;
• Global Financial Governance and Development;
• Managing Sustainable Investments and Growth: Some Perspectives;
• Combating Illicit Financial Flows;
• Taxation Challenges: A Focus on the Digital Economy;
• Ensuring Adequate Social Safety Nets; and
• Fiscal Reforms and Governance.
5.2 REGIONAL INSTITUTIONS
5.2.1 African Union (AU)
The 2019 Meeting of Experts of the African Union (AU) 3rd Specialised Technical
Committee (STC) on Finance, Monetary Affairs, Economic Planning and
Integration was held in Yaoundé, Cameroon, March 4 to 6, 2019. The Meeting
held under the themes “Public Policies for Productive Transformation” and
“Capacity Building for the Formulation of Public Policies for Productive
Transformation”. Forty-four (44) Member States, Eighteen (18) Regional
Economic Communities and several International Institutions attended the 3rd
Specialised Technical Committee (STC) of the African Union (AU). Nigeria was
represented by the Federal Ministry of Finance (FMF), Federal Ministry of
Budget and Planning (FMB&P) and Central Bank of Nigeria (CBN).
The discussions and presentations at the 3rd STC Meeting focused on the
following Sub-themes:

152
• Evaluation of Regional Integration: African Multidimensional Regional
Integration Index (AMRII) and Status of Regional Integration in Africa;
• Progress Report on the Establishment of the AU Financial Institutions and
their Roles in Fostering Productive Transformation;
• Report of the Experts Group on the Refinement of the Convergence
Criteria of the African Monetary Cooperation Programme (AMCP);
• Proposal of a Monitoring Framework and a Peer Review Mechanism for
Macroeconomic Convergence;
• Progress Report on Statistical Development in Africa;
• Agenda 2063: First-Ten Year Implementation Plan Monitoring and
Evaluation;
• Status and Progress Report on the Financing of the Union;
• Report of the Workshop on the Role of Capital Markets in Mobilising
Domestic Resources in Africa;
• Update on the Establishment of the African Continental Free Trade Area
(ACFTA);
• Inclusive Labour Market Governance for Productive Transformation (for
information);
• APRM Support to Member States in the Field of Rating Agencies;
• Revenue Statistics; and
• Status of Africa Population Report: A Common African Position on
Population (for information).
5.2.2 Association of African Central Banks (AACB)
The 2019 Continental Seminar of the Association of African Central Banks was
held in Balaclava, Mauritius, May 6 - 8, 2019, with the theme: 'Renewed
Protectionist Tendencies: Some Implications for Macroeconomic Policy in
Africa'. Seventy (70) delegates from twenty-four (24) Member Central Banks,
and twelve (12) Regional and International Institutions were in attendance.
The discussions at the plenary session focused on the following sub-themes:

153
• Mitigating the Impact of Rising Protectionist Tendencies: Role of
Central Banks and the Continental Free Trade Area in Promoting
Intra-African Trade;
• Trade War and Protectionist Tendencies: Implications on External
Sector Performance in Africa; and
• Protectionist Trends Around the World: Prospects for Monetary
Integration in Africa.
At the end of the Seminar, it was recommended that:
▪ African countries and regional or continental institutions should conduct
in-depth studies on the impact of trade war on African economies
(exports, exchange rates, economic growth), which would aid in
developing and proposing strategies for adoption by the African
countries;
▪ African countries were encouraged to pay greater attention to
expanding trade and investment links in Africa from major countries,
following the China’s 'Belt and Road' initiative, which has had a
significant impact on infrastructure in Africa;
▪ African countries should consider diversifying their economies to
enhance their productive capacities and resilience;
▪ The implementation of the AfCFTA should be fast-tracked;
▪ AACB-focused programmes, such as the convergence criteria, which
would facilitate intra-regional trade should be implemented;
▪ Overall macroeconomic conditions should be improved with emphasis
on addressing structural impediments;
▪ There should be increased investment in commodity exchanges to
influence global market prices of commodities for which African
economies are the predominant producers, so as to derive maximum
benefits from those resources; and
▪ Macro-prudential regulation should be strengthened to detect
vulnerabilities emanating from the corporate sector’s exposure to export
sector.
154
5.3 SUB-REGIONAL INSTITUTIONS
5.3.1 West African Institute for Financial and Economic Management
(WAIFEM)
The 39th Meeting of the Technical Committee of the West African Institute for
Financial and Economic Management was held in Accra, Ghana on February
3, 2019. The purpose of the Meeting was to review WAIFEM’s Work-Programme
for 2019 and other administrative issues at the Institute for the financial year
2018. The Meeting was attended by representatives of member Central Banks,
Ministries of Finance, and the West African Monetary Institute (WAMI).
The Institute’s progress report was presented in seven (7) main headings,
namely: (i) Training and Capacity Building Activities; (ii) Business Development
and Consultancy Unit (BD&CU); (iii) E-Learning Programmes; (iv) Research
Department; (v) Administrative Developments; (vi) International Relations; and
(vii) Six (6) Months Outlook.
5.3.2 West African Monetary Zone (WAMZ)
The 44th Meeting of the Technical Committee (TC) of the West African
Monetary Zone was held in Accra, Ghana, from February 4-5, 2019. The
objective of the Meeting was to deliberate on the status of implementation of
the WAMZ Work Programme, as well as, activities under the ECOWAS Single
Currency Programme. All the WAMZ Member States, ECOWAS Commission
and WAMI were represented at the Meeting.
The Meeting considered and noted the Report on macroeconomic
developments and convergence in the WAMZ as at the end of June 2018 and
urged Member States to:
• Deepen structural reforms and diversify their economic base given the
strong linkages between structural reforms and macroeconomic
development;
• Address the multiple legal and regulatory constraints, as well as,
infrastructure and logistic weaknesses to capitalise on the potential
competitive advantage in several manufacturing subsectors which, if
nurtured, could accelerate industrialisation;

155
• Monitor infrastructure developments in the region, which are financed
by external borrowing to ensure that revenue streams, generated in
local currencies were adequate to meet debt obligations when they fall
due;
• Put in place better revenue regimes, including progressive elimination of
the vast array of exemptions and leakages that drain tax systems, to
capture the gains from growth and rapid structural change that some
countries were experiencing;
• Intensify efforts to ensure the provision of reliable trade statistics, improve
coordination among agencies responsible for the implementation of
trade and trade-related issues, as well as, the provision of adequate
funding to enable the responsible institutions in Member States meet
their targets and deliverables;
• Deepen and broaden sensitisation on the ECOWAS Trade Liberalisation
Scheme (ETLS) to enable more companies participate in the Scheme.
Member States were also encouraged to harmonise trade policies with
the protocols of the ETLS and the common external tariffs (CET), as well
as, to encourage proper identification and automation of the ETLS
products and the CET tariff lines;
• Directed WAMI to prepare a form of ombudsman framework to
investigate and address the repeated non-compliance of member
states with the recommendations made by the Council on challenges
observed during multilateral surveillance visits;
• Directed WAMI to prepare a concept note on the institutionalisation of
the College of Insurance and Non-Bank Financial Institutions Supervisors
for consideration at the next meeting;
• Explore the possibility of facilitating national currency swaps among
Member States through their respective central banks, similar to the
arrangements between some Member States and China, with a view to
improving trade financing in the Zone; and
• Further promote quoting and trading in the WAMZ national currencies.

156
5.3.3 West African Monetary Agency (WAMA)
The 2018 End-of-Year Statutory Meeting of the West African Monetary Agency
took place in Dakar, Senegal, from February 18-21, 2019. The Meeting was
attended by representatives of central banks of Member States of the
ECOWAS, and, Ministries of Finance of the respective countries, as well as,
other Regional Institutions.
The Technical Committee reviewed the following documents and presented
recommendations to the Committee of Governors for approval:
• Director General’s Progress Report;
• Report on the ECOWAS Monetary Cooperation Programme for 2018;
• Report on Exchange Rate Developments of ECOWAS Currencies as at
End-December 2018;
• Study on the Effectiveness of the Interest Rate Channel of Monetary
Policy Transmission Mechanism in ECOWAS; and
• Proposed WAMA Budget and Work Programme for 2019.
5.3.4 ECOWAS Single Currency Working Group Meeting
The 2nd Meeting of the ECOWAS Single Currency Working Group was held on
June 10, 2019 at the headquarters of the ECOWAS Commission, Abuja, Nigeria.
The Meeting reviewed the study reports and proposals of two Consultants on
the “Choice of Monetary Policy Framework and Exchange Rate Regime”, and
“Model of the Common Central Bank”, which are essential for the
establishment of the proposed monetary union in ECOWAS.
The Meeting was attended by representatives of the ECOWAS Commission,
Central Bank of Nigeria (CBN), Central Bank of West African States (BCEAO),
Bank of Ghana (BoG), Central Bank of the Republic of Guinea, West African
Monetary Agency (WAMA), and West African Monetary Institute (WAMI). The
United Nations Economic Commission for Africa (UNECA) attended the
Meeting as an observer.

157
6.0 OUTLOOK FOR THE SECOND HALF OF 2019
The outlook for Nigeria’s economy for the second half of 2019 is cautiously
optimistic, amidst structural imbalances, weakening global demand and
attendant adverse effects on crude oil prices. Despite these threats, growth in
the near-term is expected to witness moderate expansion, premised on
continued growth in the oil and non-oil sectors, consequent upon: improved
domestic crude oil production and oil receipts; sustained stability in exchange
rate; and continued interventions in critical sectors of the economy.
Productivity in the real sector is expected to be supported by government
spending on infrastructure and CBN interventions in growth-stimulating sectors.
Specifically, the renewed focus of the CBN in improving credit delivery to the
agricultural and manufacturing sub-sectors, as well as, the micro, small and
medium enterprises (MSMEs), would moderate unemployment and sustain the
growth trajectory. In addition, the targeted FGN initiatives in the power and
transport sub-sectors were expected to improve the macroeconomic
environment, boost business and consumer confidence, increase lending and
investment, expand production, generate employment and reduce poverty.
However, there are headwinds that may undermine these expectations. These
include: persistent structural imbalances, such as the high cost of production;
general insecurity, especially in major food-producing areas; and less-than-
expected returns from the forthcoming harvest that could lead to a build-up
in inflationary pressures and weaken recovery.
The performance of the external sector in the second half of 2019 is expected
to remain strong, due to anticipated improvement in crude oil prices and
domestic oil production, sustained current account surplus, improvement in
export, modest accretion to reserves, and stable exchange rate. Global
economic developments, such as trade tensions between the United States
and China, rising geopolitical tensions in the Middle East and the United States
withdrawal from the 2015 Iranian nuclear deal are expected to impact
positively on crude oil prices at the international market. In addition, the
outlook in the near-term, would be reinforced by the CBN’s initiatives towards

158
the diversification of the economy by increasing its export base. On the other
hand, uncertainties, arising from rising external debt; slowdown in global
demand; and the risk of capital reversal are likely factors that could affect the
viability of the external sector.
In the fiscal sector, there is moderate prospect for increased government
revenue, as crude oil price is expected to average US$64.00 per barrel, which
is above the budget benchmark of US$60.0 per barrel. Furthermore, the
diversification of the economy and the expansion of the tax base, through
recent tax reform measures, are expected to further boost government
revenue. In addition, the expected increase in the pace of capital releases is
expected to have a positive impact on the economy. However, depressed
global demand, output cuts imposed by the OPEC and rising debt service
obligation are major threats to the economy.
The financial sector is expected to remain resilient in the second half of 2019,
on account of the CBN’s commitment towards ensuring financial system
stability, deeper inclusion through credit delivery, as well as, intensification of
financial literacy and consumer protection programmes. The renewed
policies, aimed at enhancing the payments system and cash-less initiative, are
expected to ensure improved efficiency, safety and confidence in the
Nigerian payments system. More so, the proposed extension of the BVN
enrolment to other financial institutions to ease constraint of poor identification
on access to credit would foster the synergies inherent in the financial
inclusion-financial stability nexus.

159
Table 20
DMBs’ Credit to the Core Private Sector: (Percentage Share)
Sources Jun-16 Dec-16 Jun-17 Dec-17 Jun-18 Dec-18 Jun-19
Agriculture 3.09 3.26 3.19 3.36 3.41 4.03 4.20
Industry 37.89 38.82 39.61 39.56 38.46 40.99 39.59
Mining & Quarrying 0.11 0.13 0.07 0.16 0.07 0.14 0.06
Manufacturing 13.25 13.75 14.11 13.79 13.16 14.74 15.32
Oil & Gas 21.66 22.26 22.46 22.72 22.52 23.45 22.00
of which DownStream, Natural Gas and Crude Oil Refining 21.66 22.26 22.46 22.72 22.52 23.45 22.00
Power and Energy 2.88 2.68 2.97 2.88 2.71 2.67 2.22
of which IPP and Power Generation 2.88 2.68 2.97 2.88 2.71 2.67 2.22
Construction 3.91 3.92 4.01 4.17 3.99 4.06 4.39
Trade/General Commerce 6.56 6.11 6.11 6.50 6.81 7.11 6.57
Government 8.91 8.45 8.70 8.84 9.61 9.00 8.75
Services 39.62 39.44 38.38 37.57 37.72 34.80 36.49
Real Estate 4.61 4.91 5.06 4.79 4.85 4.12 3.85
Finance, Insurance and Capital Market 5.51 5.82 5.79 7.15 6.46 7.31 7.48
Education 0.56 0.54 0.48 0.46 0.47 0.38 0.40
Oil & Gas 7.32 7.87 6.94 7.38 8.05 7.25 7.02
of which Upstream and Oil & Gas Services 7.32 7.87 6.94 7.38 8.05 7.25 7.02
Power and Energy 1.53 1.82 1.92 1.91 2.09 2.04 1.95
of which Power Transmission and Distribution 1.53 1.82 1.92 1.91 2.09 2.04 1.95
Others 20.09 18.48 18.18 15.88 15.80 13.71 15.80
of which: i. General 8.53 8.16 8.16 6.59 6.14 5.95 6.71
ii. Information & Communication 6.08 5.25 5.00 4.92 5.31 3.60 4.55
iii. Transportation & Storage 2.94 2.80 2.57 2.11 1.98 1.92 2.10
Total Private Sector Credit 100.00 100.00 100.00 100.00 100.00 100.00 100.00
Source: Central Bank of Nigeria
Share in Outstanding (Per cent)
Table 21

160
Money Market Rates: First Half 2019
(Per cent)
Month MPRInterbank Call
RateOBB NIBOR: Call NIBOR: 30 Days NIBOR: 90 Days
Jan - 1914.00 12.14 17.54 19.09 14.79
Feb - 1914.00 16.71 18.29 18.86 11.92
Mar - 1913.50 10.80 12.07 12.88 10.83
Apr - 1913.50 13.98 15.87 16.27 12.07
May - 1913.50 7.31 8.25 8.68 11.51
Jun - 1913.50 6.88 7.67 16.43 22.73
1st Half 2019 Average 13.67 11.30 13.28 15.37 13.98 #DIV/0!
Jan - 1814.00 14.72 10.04 11.24 15.00 16.21
Feb - 1814.00 23.54 18.40 19.91 15.12 15.79
Mar - 1814.00 16.06 13.92 15.97 15.32 16.38
Apr - 1814.00 3.10 2.88 3.88 12.91 14.08
May - 1814.00 25.43 18.37 22.77 13.15 14.45
Jun - 1814.00 5.00 11.13 11.65 13.94 14.43
1st Half 2018 Average 14.00 14.64 12.46 14.24 14.24 15.22
1st Half 2017 Average 14.00 24.58 28.97 31.41 28.43 29.59
Sources: Central Bank of Nigeria and Financial Markets Dealers Association
WEIGHTED AVERAGE
Table 22
Selected Interest Rates: First Half 2019
(Per cent)
Month SavingsAverage
Term Deposit
Prime
Lending
Maximum
Lending
Jan - 194.07 8.18 16.01 30.48
Feb - 194.07 8.15 16.08 30.56
Mar - 193.97 8.22 14.92 30.83
Apr - 193.91 8.01 15.39 30.89
May - 193.91 8.02 15.33 31.07
Jun - 193.93 7.99 15.80 31.04
1st Half 2019 Average 3.98 8.09 15.59 30.81
1st Half 2018 Average 4.07 8.12 17.25 31.39
Source: Central Bank of Nigeria

161
Table 23
Open Market Operations (OMO) Sessions Total Amount Average Average Yield
Bids Sold Tenor (Days) (%)
(N' Million) (N' Million)
2015
January 1,637,224.91 1,295,880.94 165 15.29
February 279,283.49 217,327.54 193 16.09
March 586,859.44 543,859.44 188 16.09
April 1,027,454.90 933,744.73 261 16.44
May 657,106.07 524,540.43 206 15.24
June 979,350.37 746,365.40 145 14.55
Total 5,167,279.18 4,261,718.48
Average 861,213.20 710,286.41 193 15.61
July 963,380.00 771,823.00 227 15.34
August 226,718.00 73,269.00 346 16.14
September 402,805.00 - - -
October - - - -
November - - - -
December 736,952.00 482,153.00 303 8.57
Total 2,329,855.00 1,327,245.00
Average 582,463.75 442,415.00 292 13.35
2016
January 913,260.00 698,420.00 186 8.15
February 630,890.00 509,230.00 175 8.08
March 706,990.00 394,630.00 231 8.81
April 710,300.00 363,720.00 233 9.72
May 367,700.00 64,630.00 288 10.56
June 540,800.00 299,120.00 285 12.93
Total 3,869,940.00 2,329,750.00
Average 644,990.00 388,291.67 233 9.71
July 909,780.00 695,210.00 233 19.38
August 2,248,650.00 1,728,150.00 275 17.87
September 1,067,340.00 1,057,950.00 232 20.64
October 832,900.00 807,020.00 234 20.67
November 732,660.00 665,570.00 278 17.25
December 633,140.00 575,970.00 266 21.12
Total 6,424,470.00 5,529,870.00
Average 1,070,745.00 921,645.00 253 19.49
2017
January 1,237,870.00 700,520.00 248 20.89
February 621,146.00 619,140.00 249 21.06
March 418,192.00 391,160.00 252 20.93
April 376,660.00 316,090.00 266 21.11
May 585,900.00 580,080.00 259 21.03
June 1,354,120.00 1,267,280.00 252 19.65
Total 4,593,888.00 3,874,270.00
Average 765,648.00 645,711.67 254 20.78
July 1,546,700.00 1,517,530.00 260 21.00
August 1,175,660.00 1,104,570.00 205 19.86
September 787,080.00 741,850.00 219 19.25
October 1,204,690.00 1,179,200.00 226 16.49
November 1,568,350.00 1,461,130.00 226 16.41
December 1,468,530.00 1,467,930.00 219 15.61
Total 7,751,010.00 7,472,210.00
Average 1,291,835.00 1,245,368.33 226 18.11
2018
January 2,132,608.00 2,132,608.00 163 14.71
February 919,310.30 845,282.70 173 14.42
March 1,599,250.20 1,561,378.30 199 14.57
April 3,423,078.00 2,084,455.30 189 13.54
May 2,484,392.20 2,033,421.30 201 13.65
June 1,092,612.10 1,086,612.10 230 12.51
Total 11,651,250.80 9,743,757.70
Average 1,941,875.13 1,623,959.62 193 13.90
July 1,669,120.00 1,669,120.00 203 12.40
August 1,694,130.00 1,529,930.00 178 12.30
September 2,029,460.00 1,651,510.00 177 12.29
October 1,749,510.00 1,743,640.00 213 13.92
November 3,128,050.00 3,020,280.00 227 14.14
December 2,994,770.00 2,991,920.00 222 14.15
Total 13,265,040.00 12,606,400.00
Average 2,210,840.00 2,101,066.67 203 13.20
2019
January 3,113,720.00 3,113,720.00 214 14.60
February 3,721,500.00 3,474,130.00 236 14.73
March 2,574,900.00 2,158,570.00 188 13.62
April 991,410.00 841,200.00 253 14.34
May 1,529,970.00 1,152,690.00 241 13.29
June 1,166,120.00 1,130,620.00 243 13.30
Total 13,097,620.00 11,870,930.00
Average 2,182,936.67 1,978,488.33 229 13.98
Source: Central Bank of Nigeria
Period

162
Table 24
Treasury Bills: Issues and Allotments
(Naira Million)
Deposit Money
Banks
Non-Bank
Public
2015
June 380,023.16 0.00 212,850.32 167,172.84
December 352,034.71 0.00 344,843.52 7,191.20
Annual Total 3,845,317.30 0.00 2,686,460.16 1,158,857.14
Annual Average 320,443.11 0.00 223,871.68 96,571.43
2016
June 480,753.95 28,000.00 260,910.92 191,843.03
December 347,920.69 43,511.80 157,769.48 146,639.42
Annual Total 4,555,502.05 163,590.48 2,329,090.90 2,062,820.67
Annual Average 379,625.17 13,632.54 194,090.91 171,901.72
2017
June 487,067.69 0.00 217,907.79 269,159.90
December 0.00 0.00 0.00 0.00
Annual Total 4,495,472.98 127,180.46 2,495,904.08 1,872,388.44
Annual Average 374,622.75 10,598.37 207,992.01 156,032.37
2018
June 220,867.59 0.00 38,248.38 182,619.21
December 0.00 0.00 0.00 0.00
Annual Total 3,342,388.31 0.00 1,763,470.22 1,578,918.08
Annual Average 278,532.36 0.00 146,955.85 131,576.51
2019
January 554,922.91 73,450.55 222,241.10 259,231.25
February 268,503.85 0.00 93,918.57 174,585.28
March 138,065.00 0.00 106,324.95 31,740.04
April 154,171.38 0.00 97,559.09 56,612.29
May 210,923.77 0.00 163,520.54 47,403.24
June 147,254.83 0.00 82,803.63 64,451.20
Half Year Total 1,473,841.73 73,450.55 766,367.88 634,023.30
Half Year Average 245,640.29 12,241.76 127,727.98 105,670.55
Source: Central Bank of Nigeria
Period IssuesCentral
Bank
Allotment to Subscriber

163
Table 25
Monetary and Credit Developments 3/
(N’ Million) Item Jun 2015 Dec 2015 Jun 2016 Dec 2016 Jun 2017 Dec 2017 Jun 2018 Dec 2018 /4 Jun 2019 /4
(1) Domestic Credit (Net) 21,409,774.20 21,612,452.09 24,623,626.70 26,857,719.34 27,236,433.60 25,929,552.00 25,086,874.73 27,574,319.41 32,332,626.73
(a) Claims on Federal Government (Net) 2,511,101.09 2,891,946.66 3,171,443.45 4,875,570.30 5,250,486.41 3,638,893.69 2,805,008.21 4,866,094.44 7,581,492.53
By Central Bank -769,517.43 -1,653,067.50 -1,185,761.66 109,158.25 232,806.35 -355,592.43 -457,922.57 342,214.29 2,754,064.22
By Commecial Banks 3,219,301.45 4,470,267.34 4,179,939.12 4,563,266.39 4,821,703.05 3,842,802.34 3,137,584.55 4,372,793.47 4,562,911.26
By Merchant Banks 61,317.08 74,746.83 177,266.00 203,145.66 195,977.01 151,683.77 125,346.22 120,802.84 229,573.89
By Non Interest Banks 0.00 0.00 0.00 0.00 0.00 0.00 0.00 0.00 0.00
By Primary Mortgage Banks 7,426.95 7,206.55
By Microfinance Banks 22,856.90 27,736.61
(b) Claims on Private Sector 18,898,673.11 18,720,505.43 21,452,183.25 21,982,149.04 21,985,947.18 22,290,658.31 22,281,866.53 22,708,224.97 24,751,134.20
By Central Bank 5,093,071.50 5,061,611.28 5,402,940.93 5,298,255.90 5,692,288.30 5,870,697.13 6,420,376.25 6,574,674.48 8,504,880.87
By Commercial Banks 13,712,964.87 13,568,543.70 15,903,577.86 16,500,150.26 16,092,233.81 16,193,858.35 15,615,487.94 15,438,603.87 15,461,318.86
By Merchant Banks 68,535.18 62,845.80 111,828.57 145,180.11 161,090.01 176,742.22 196,447.33 229,603.16 269,224.31
By Non Interest Banks 24,101.56 27,504.65 33,835.89 38,562.77 40,335.06 49,360.61 49,555.01 56,127.30 83,435.67
By Primary Mortgage Banks 169,466.28 180,943.63
By Microfinance Banks 239,749.87 251,330.86
(i) Claims on State and Local Govts 472,792.84 585,060.12 729,427.54 989,541.97 1,180,310.12 1,544,829.78 1,628,824.48 1,553,644.79 1,595,805.35
By Central Bank 0.00 0.00 27,800.00 300,379.00 495,915.00 640,431.37 656,531.37 656,531.37 719,474.05
By Commercial Banks 471,430.12 583,817.73 698,822.78 681,830.36 678,439.76 892,044.23 959,904.40 885,257.08 838,406.87
By Merchant Banks 0.00 0.00 1,650.14 6,272.36 4,996.57 6,285.23 5,609.80 1,681.84 1,020.60
By Non Interest Banks 1,362.72 1,242.40 1,154.62 1,060.25 958.80 6,068.95 6,778.90 10,165.01 36,894.34
By Primary Mortgage Banks 9.49 9.49
By Microfinance Banks 0.00 0.00
(ii) Claims on Non-Financial Public Ent's 51,033.53 25,588.01 319,694.07 25,603.30 32,984.48 27,524.42 164,064.18 44,859.43 44,565.91
By Central Bank 51,033.53 25,588.01 319,694.07 25,603.30 32,984.48 27,524.42 164,064.18 44,859.43 44,565.91
By Commercial Banks 0.00 0.00 0.00 0.00 0.00 0.00 0.00 0.00 0.00
By Merchant Banks 0.00 0.00 0.00 0.00 0.00 0.00 0.00 0.00 0.00
By Non Interest Banks 0.00 0.00 0.00 0.00 0.00 0.00 0.00 0.00 0.00
By Primary Mortgage Banks 0.00 0.00
By Microfinance Banks 0.00 0.00
(iii) Claims on Other Private Sector 18,374,846.74 18,109,857.30 20,403,061.64 20,967,003.77 20,772,652.59 20,718,304.11 20,488,977.87 21,109,720.74 23,110,762.94
By Central Bank 5,042,037.96 5,036,023.27 5,055,446.86 4,972,273.60 5,163,388.82 5,202,741.34 5,599,780.69 5,873,283.68 7,740,840.91
By Commercial Banks 13,241,534.75 12,984,725.98 15,204,755.08 15,818,319.90 15,413,794.05 15,301,814.12 14,655,583.54 14,553,346.79 14,622,912.00
By Merchant Banks 68,535.18 62,845.80 110,178.43 138,907.76 156,093.44 170,456.99 190,837.53 227,921.32 268,203.71
By Non Interest Banks 22,738.84 26,262.25 32,681.27 37,502.52 39,376.27 43,291.66 42,776.11 45,962.29 46,541.33
By Primary Mortgage Banks 169,456.79 180,934.14
By Microfinance Banks 239,749.87 251,330.86
(2) Foreign Assets (Net) 5,951,452.90 5,653,320.37 7,105,663.47 9,149,659.29 8,468,080.62 15,520,760.99 18,337,532.47 18,397,816.89 18,471,241.48
By Central Bank 5,795,959.61 5,545,320.51 6,840,426.38 8,790,652.82 8,378,904.55 15,134,616.53 17,844,063.96 18,181,445.77 17,569,374.55
By Commecial Banks 159,892.93 125,384.36 254,493.47 346,200.38 101,695.18 422,361.51 551,440.52 294,364.52 968,607.83
By Merchant Banks -5,946.22 -18,785.78 8,455.14 11,711.36 -21,000.64 -41,666.45 -63,082.90 -86,221.29 -80,166.22
By Non Interest Banks 1,546.58 1,401.28 2,288.47 1,094.72 8,481.53 5,449.39 5,110.89 8,227.89 13,425.32
By Primary Mortgage Banks 0.00 0.00
By Microfinance Banks 0.00 0.00
(3) Other Assets (Net) -5,684,031.66 -5,546,912.18 -7,715,728.00 -7,505,491.25 -7,385,235.26 -12,780,728.39 -14,080,577.65 -12,612,887.76 -15,785,097.10
Total Monetary Assets 21,677,195.44 21,718,860.28 24,013,562.17 28,501,887.38 28,319,278.95 28,669,584.60 29,343,829.54 33,359,248.53 35,018,771.11
Quasi-Money /1 12,269,037.20 11,458,129.82 12,559,032.07 12,320,225.75 11,790,391.44 12,965,060.24 14,112,894.51 15,316,017.08 16,733,203.28
Money Supply (M1) 6,542,392.20 8,571,701.30 9,518,981.39 11,271,506.82 10,190,190.92 11,175,573.96 10,701,110.00 11,752,557.98 11,159,122.62
Currency Outside Banks 1,183,988.38 1,456,096.85 1,379,045.17 1,820,415.90 1,477,147.44 1,782,664.58 1,519,902.32 1,912,975.63 1,651,095.92
Demand Deposits /2 5,358,403.82 7,115,604.46 8,139,936.23 9,451,090.92 8,713,043.48 9,392,909.39 9,181,207.68 9,839,582.35 9,508,026.70
Money Supply (M2) 18,811,429.40 20,029,831.12 22,078,013.46 23,591,732.58 21,980,582.35 24,140,634.21 24,814,004.52 27,068,575.06 27,892,325.89
Central Bank Securities (CBN Bills) 2,865,766.04 1,689,029.17 1,935,548.71 4,910,154.80 6,338,696.60 4,528,950.39 4,529,825.03 6,290,673.48 7,126,445.22
Total Monetary Liabilities 21,677,195.44 21,718,860.28 24,013,562.17 28,501,887.38 28,319,278.95 28,669,584.60 29,343,829.54 33,359,248.54 35,018,771.11
GROWTH RATE OVER THE PRECEDING
DECEMBER (In Percentages)
Credit to the Domestic Economy (Net) 11.08 12.13 13.93 24.27 1.41 -3.46 -3.25 6.34 17.26
Credit to the Private Sector 4.26 3.28 14.59 17.42 0.02 1.40 -0.04 1.87 9.00
Claims on Federal Government (Net) 118.79 151.98 9.66 68.59 7.69 -25.36 -22.92 33.72 55.80
By Central Bank 64.07 22.81 28.27 106.60 113.27 -423.90 106.62
Claims on State and Local Governments -12.25 8.59 24.68 69.14 19.28 56.12 5.44 0.57 2.71
Claims on Non-Financial Public Enterprises 99.42 -0.01 1,149.39 0.06 28.83 7.50 496.07 62.98 -0.65
Claims on Other Private Sector 4.63 3.12 12.66 15.78 -0.93 -1.19 -1.11 1.89 9.48
Foreign Assets (Net) -14.42 -18.71 25.69 61.85 -7.45 69.63 18.15 18.54 0.40
Quasi-Money 2.17 -4.58 9.61 7.52 -4.30 5.23 8.85 18.13 9.25
Money Supply (M1) -4.87 24.64 11.05 31.50 -9.59 -0.85 -4.25 5.16 -5.05
Money Supply (M2) -0.39 6.06 10.23 17.78 -6.83 2.33 2.79 12.13 3.04
Central Bank Securities (CBN Bills) 22.82 -27.61 14.60 190.71 29.09 -7.76 0.02 38.90 13.29
Money Supply (M3) 2.16 2.36 10.57 31.23 -0.64 0.59 2.35 16.36 4.97
Other Assets (Net) -14.10 -11.35 -39.10 -35.31 1.60 -70.29 -10.17 1.31 -25.15
Source: Central Bank of Nigeria
/1 Quasi-Money consists of Time, Savings and Foreign Currency Deposits of Deposit Money Banks excluding takings from Discount Houses.
/2 Demand Deposits consist of state and local government as well as parastatals deposits at the CBN on the one hand; and state and local government and private sector deposits as well as demand deposits of non-financial public
enterprises at the Deposit Money Banks, on the other.
/3 Adoption of International Financial Reporting Standard (IFRS) and bank returns in compliance with the IFRS commenced in March 2015. Table presentation is revised.
/4 Provisional

164
Table 26
Value of Money Market Assets 1/
(Naira Million)
2019 /2
June Dec June Dec June Dec June Dec June
Treasury Bills 2,824,952.25 2,772,867.04 2,901,807.05 3,277,278.83 3,702,831.68 3,579,799.14 2,953,580.70 2,735,967.54 2,651,514.04
Certificates of Deposits 38,693.10 75,702.83 55,020.04 0.00 0.00 59,497.94 59,449.33 59,692.38 59,672.93
Commercial Papers 6,679.00 6,291.85 3,546.10 490.47 497.34 515.98 27,175.48 9,863.80 41,202.37
Bankers' Acceptances 8,596.28 28,417.89 29,755.86 27,795.30 41,039.93 26,428.84 3,826.11 12,179.42 3,553.19
FGN Bonds 5,300,418.82 5,808,140.82 7,473,539.17 7,564,937.47 8,134,876.26 8,715,811.65 8,927,657.64 9,334,737.98 9,691,417.04
FGN Savings Bonds /3 4,754.08 7,197.33 8,521.32 10,750.44 10,431.84
FGN Sukuk /3 100,000.00 100,000.00 200,000.00 200,000.00
FGN Green Bond /3 10,690.00 10,690.00 10,690.00 25,690.00
Total 8,179,339.46 8,691,420.43 10,463,668.22 10,870,502.06 11,883,999.29 12,499,940.88 12,090,900.58 12,373,881.55 12,683,481.42
Treasury Bills 0.33 -1.52 4.65 18.19 12.98 9.23 -17.49 -23.57 -3.09
Certificates of Deposits -24.06 48.57 -27.32 -100.00 -0.08 0.33 -0.03
Commercial Papers -32.00 -35.94 -43.64 -92.20 1.40 5.20 5166.79 1811.67 317.71
Bankers' Acceptances -1.84 224.51 4.71 -2.19 47.65 -4.92 -85.52 -53.92 -70.83
FGN Bonds 10.60 21.20 28.67 30.25 7.53 15.21 2.43 7.10 3.82
FGN Savings Bonds /3 18.40 49.37 -2.96
FGN Sukuk /3 0.00 100.00 0.00
FGN Green Bond /3 0.00 0.00 140.32
Percentage Change of Total 6.54 13.21 20.39 25.07 9.32 14.99 -3.27 -1.01 2.50
Source: Central Bank of Nigeria
/1 Revised
/2 Provisional
/3 FGN Savings Bond, FGN Sukuk and FGN Green Bond were introduced by the Debt Management Office in March, September and December 2017, respectively.
Percentage Change Over Preceding December
Instrument20182015 2016 2017

165
Table 27
Selected Interest Rates /1
(End-Period Rate)
2019
Jun Dec Jun Dec Jun Dec Jun Dec Jun
End-Period Rates
Monetary Policy Rate 13.00 11.00 12.00 14.00 14.00 14.00 14.00 14.00 13.50
Treasury Bills Issue Rate 12.16 6.31 13.47 17.94 17.18 15.36 11.50
Weighted Average Rates
Inter-bank Call Rate 10.85 0.77 35.26 10.39 13.46 9.49 5.00 22.68 8.38
NIBOR Call Rate 14.07 1.04 20.34 8.53 32.88 9.71 11.65
NIBOR 30-days 14.54 9.11 17.62 16.34 30.84 16.95 13.94
NIBOR 90-days 15.30 10.84 18.43 18.66 31.55 18.12 14.43
Open Buy Back (OBB) 10.65 0.98 21.75 7.35 29.57 8.46 10.84 22.94 8.71
Deposit Money Banks (DMBs)
(Weighted Average Rates)
Savings Deposit Rate 3.60 3.33 3.61 4.18 4.08 4.08 4.07 4.07 3.93
Time Deposit Rate (3 months) 10.27 6.91 6.92 8.80 9.01 9.61 9.38 9.50 9.10
Prime Lending Rate 17.24 16.96 16.78 17.09 17.59 17.71 16.78 16.17 15.80
Maximum Lending Rate 26.84 26.84 26.93 28.55 30.94 30.99 31.17 30.52 31.04
Sources: Financial Market Dealers Association (FMDA) and Central Bank of Nigeria
/1 Revised
20182015 2016 2017
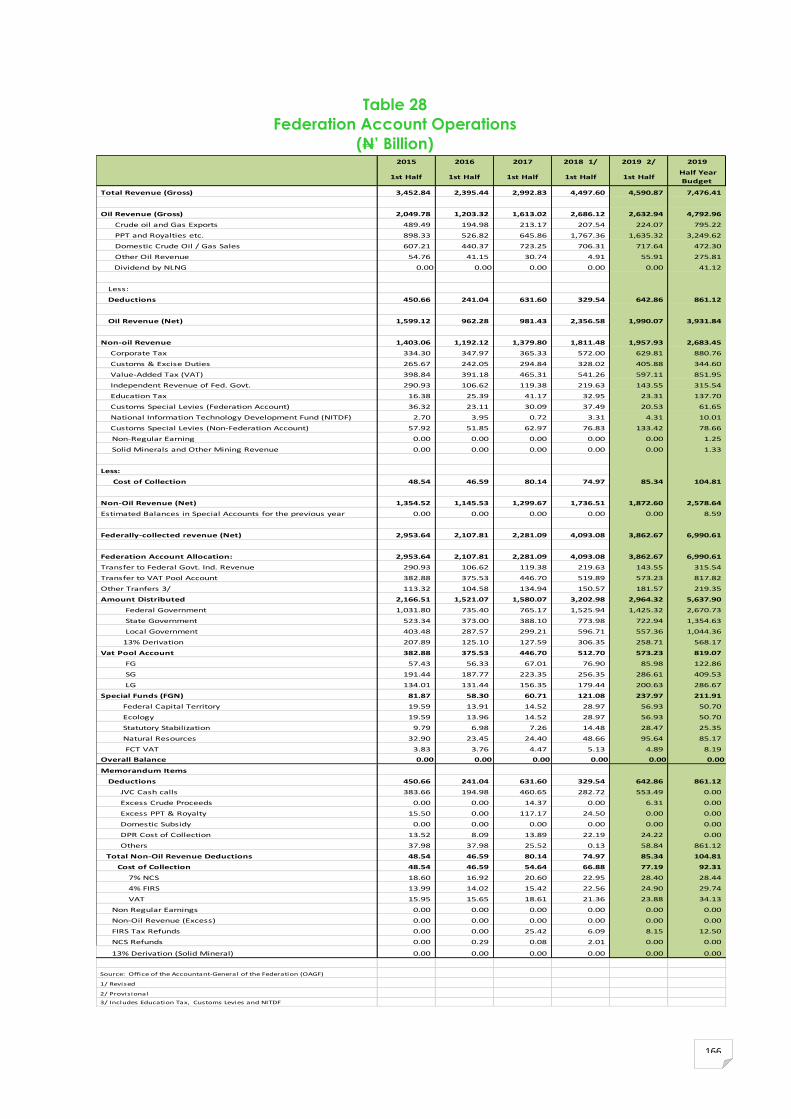
166
Table 28
Federation Account Operations
(N’ Billion) 2015 2016 2017 2018 1/ 2019 2/ 2019
1st Half 1st Half 1st Half 1st Half 1st Half Half Year
Budget
Total Revenue (Gross) 3,452.84 2,395.44 2,992.83 4,497.60 4,590.87 7,476.41
Oil Revenue (Gross) 2,049.78 1,203.32 1,613.02 2,686.12 2,632.94 4,792.96
Crude oil and Gas Exports 489.49 194.98 213.17 207.54 224.07 795.22
PPT and Royalties etc. 898.33 526.82 645.86 1,767.36 1,635.32 3,249.62
Domestic Crude Oil / Gas Sales 607.21 440.37 723.25 706.31 717.64 472.30
Other Oil Revenue 54.76 41.15 30.74 4.91 55.91 275.81
Dividend by NLNG 0.00 0.00 0.00 0.00 0.00 41.12
Less:
Deductions 450.66 241.04 631.60 329.54 642.86 861.12
Oil Revenue (Net) 1,599.12 962.28 981.43 2,356.58 1,990.07 3,931.84
Non-oil Revenue 1,403.06 1,192.12 1,379.80 1,811.48 1,957.93 2,683.45
Corporate Tax 334.30 347.97 365.33 572.00 629.81 880.76
Customs & Excise Duties 265.67 242.05 294.84 328.02 405.88 344.60
Value-Added Tax (VAT) 398.84 391.18 465.31 541.26 597.11 851.95
Independent Revenue of Fed. Govt. 290.93 106.62 119.38 219.63 143.55 315.54
Education Tax 16.38 25.39 41.17 32.95 23.31 137.70
Customs Special Levies (Federation Account) 36.32 23.11 30.09 37.49 20.53 61.65
National Information Technology Development Fund (NITDF) 2.70 3.95 0.72 3.31 4.31 10.01
Customs Special Levies (Non-Federation Account) 57.92 51.85 62.97 76.83 133.42 78.66
Non-Regular Earning 0.00 0.00 0.00 0.00 0.00 1.25
Solid Minerals and Other Mining Revenue 0.00 0.00 0.00 0.00 0.00 1.33
Less:
Cost of Collection 48.54 46.59 80.14 74.97 85.34 104.81
Non-Oil Revenue (Net) 1,354.52 1,145.53 1,299.67 1,736.51 1,872.60 2,578.64
Estimated Balances in Special Accounts for the previous year 0.00 0.00 0.00 0.00 0.00 8.59
Federally-collected revenue (Net) 2,953.64 2,107.81 2,281.09 4,093.08 3,862.67 6,990.61
Federation Account Allocation: 2,953.64 2,107.81 2,281.09 4,093.08 3,862.67 6,990.61
Transfer to Federal Govt. Ind. Revenue 290.93 106.62 119.38 219.63 143.55 315.54
Transfer to VAT Pool Account 382.88 375.53 446.70 519.89 573.23 817.82
Other Tranfers 3/ 113.32 104.58 134.94 150.57 181.57 219.35
Amount Distributed 2,166.51 1,521.07 1,580.07 3,202.98 2,964.32 5,637.90
Federal Government 1,031.80 735.40 765.17 1,525.94 1,425.32 2,670.73
State Government 523.34 373.00 388.10 773.98 722.94 1,354.63
Local Government 403.48 287.57 299.21 596.71 557.36 1,044.36
13% Derivation 207.89 125.10 127.59 306.35 258.71 568.17
Vat Pool Account 382.88 375.53 446.70 512.70 573.23 819.07
FG 57.43 56.33 67.01 76.90 85.98 122.86
SG 191.44 187.77 223.35 256.35 286.61 409.53
LG 134.01 131.44 156.35 179.44 200.63 286.67
Special Funds (FGN) 81.87 58.30 60.71 121.08 237.97 211.91
Federal Capital Territory 19.59 13.91 14.52 28.97 56.93 50.70
Ecology 19.59 13.96 14.52 28.97 56.93 50.70
Statutory Stabilization 9.79 6.98 7.26 14.48 28.47 25.35
Natural Resources 32.90 23.45 24.40 48.66 95.64 85.17
FCT VAT 3.83 3.76 4.47 5.13 4.89 8.19
Overall Balance 0.00 0.00 0.00 0.00 0.00 0.00
Memorandum Items
Deductions 450.66 241.04 631.60 329.54 642.86 861.12
JVC Cash calls 383.66 194.98 460.65 282.72 553.49 0.00
Excess Crude Proceeds 0.00 0.00 14.37 0.00 6.31 0.00
Excess PPT & Royalty 15.50 0.00 117.17 24.50 0.00 0.00
Domestic Subsidy 0.00 0.00 0.00 0.00 0.00 0.00
DPR Cost of Collection 13.52 8.09 13.89 22.19 24.22 0.00
Others 37.98 37.98 25.52 0.13 58.84 861.12
Total Non-Oil Revenue Deductions 48.54 46.59 80.14 74.97 85.34 104.81
Cost of Collection 48.54 46.59 54.64 66.88 77.19 92.31
7% NCS 18.60 16.92 20.60 22.95 28.40 28.44
4% FIRS 13.99 14.02 15.42 22.56 24.90 29.74
VAT 15.95 15.65 18.61 21.36 23.88 34.13
Non Regular Earnings 0.00 0.00 0.00 0.00 0.00 0.00
Non-Oil Revenue (Excess) 0.00 0.00 0.00 0.00 0.00 0.00
FIRS Tax Refunds 0.00 0.00 25.42 6.09 8.15 12.50
NCS Refunds 0.00 0.29 0.08 2.01 0.00 0.00
13% Derivation (Solid Mineral) 0.00 0.00 0.00 0.00 0.00 0.00
Source: Office of the Accountant-General of the Federation (OAGF)
1/ Revised
2/ Provisional
3/ Includes Education Tax, Customs Levies and NITDF

167
Table 29
Federally Collected Revenue Distribution
(N’ Billion)
2015 2016 2017 2018 1/ 2019 2/ 2019
1st Half 1st Half 1st Half 1st Half 1st Half Half Year Budget
Statuory Allocation 2,166.51 1,521.07 1,580.07 3,202.98 2,964.32 5,637.90
Federal Government 1,031.80 735.40 765.17 1,525.94 1,425.32 2,670.73
State Government 523.34 373.00 388.10 773.98 722.94 1,354.63
Local Government 403.48 287.57 299.21 596.71 557.36 1,044.36
13% Derivation 207.89 125.10 127.59 306.35 258.71 568.17
Vat Pool Account 382.88 375.53 446.70 512.70 573.23 819.07
FG 57.43 56.33 67.01 76.90 85.98 122.86
SG 191.44 187.77 223.35 256.35 286.61 409.53
LG 134.01 131.44 156.35 179.44 200.63 286.67
Distribution from Excess Oil Revenue 3/ 68.29 67.38 191.90 11.27 78.09 86.83
Federal Government 51.88 53.47 101.67 5.16 35.79 45.74
State Government 7.04 7.86 38.72 2.62 18.15 23.20
Local Government 5.43 6.06 29.85 2.02 13.99 17.89
13% Derivation 3.94 0.00 21.66 1.46 10.15 0.00
Distribution from Non-Oil Excess Revenue 4/ 0.00 1.59 0.00 3.01 12.14 0.00
Federal Government 0.00 0.84 0.00 1.59 6.40 0.00
State Government 0.00 0.42 0.00 0.80 3.24 0.00
Local Government 0.00 0.33 0.00 0.62 2.50 0.00
13% Derivation 0.00 0.00 0.00 0.00 0.00 0.00
Exchange Rate Gain 5/ 210.43 19.08 311.75 93.30 49.26 0.00
Federal Government 96.44 8.91 145.98 42.76 22.62 0.00
State Government 48.92 4.52 74.04 21.69 11.47 0.00
Local Government 37.71 3.48 57.08 16.72 8.85 0.00
13% Derivation 27.36 2.17 34.65 12.13 6.31 0.00
Total Excluding VAT 2,445.23 1,609.11 2,083.72 3,310.56 3,103.80 5,724.73
Federal Government 1,180.12 798.61 1,012.81 1,575.45 1,490.12 2,716.48
State Government 579.30 385.80 500.87 799.09 755.81 1,377.83
Local Government 446.62 297.44 386.15 616.07 582.70 1,062.25
13% Derivation 239.19 127.26 183.90 319.95 275.18 568.17
Total Statutory Revenue and VAT Distribution 2,828.11 1,984.65 2,530.42 3,823.26 3,677.03 6,544.00
Federal Government 1,237.55 854.94 1,079.82 1,652.36 1,576.10 2,839.34
State Government 770.74 573.57 724.22 1,055.44 1,042.42 1,787.37
Local Government 580.63 428.87 542.49 795.51 783.33 1,348.93
13% Derivation 239.19 127.26 183.90 319.95 275.18 568.37
Source: Office of the Accountant-General of the Federation (OAGF)
1/ Revised
2/Provisional
3/ Includes NNPC Additional revenue, Excess Crude/PPT Revenue and Good & Valuable Consideration
4/ Includes Excess Bank Charges, Other Non-Mineral Revenue
5/ Include Forex Equalisation and Exchange Difference Non-Mineral Revenue

168
Table 30
Summary of Federal Government Finances
(N’ Billion)
2015 2016 2017 2018 1/ 2019 2/ 2019
1st Half 1st Half 1st Half 1st Half 1st Half Half Year Budget
Total Federal Government Retained Revenue 1,583.20 1,305.75 2,348.05 2,005.46 2,030.15 4,232.63
Share of Federation Account (Gross) 1,031.80 735.40 765.17 1,525.94 1,425.32 2,670.73
Share of VAT Pool Account 57.43 56.33 67.01 76.90 85.98 122.86
Federal Government Independent Revenue 290.93 106.62 119.38 219.63 143.55 315.54
Share of Excess Oil Revenue 51.88 53.47 101.67 5.16 35.79 45.74
Share from Non-Oil Excess 0.00 0.84 0.00 1.59 6.40 0.00
Exchange Gain 96.44 8.91 145.98 42.76 22.62 0.00
Others 3/ 54.72 344.19 1,148.85 133.47 310.49 1,077.75
Total Expenditure 2,259.66 2,517.21 3,287.78 3,856.21 4,531.24 5,191.87
Recurrent Expenditure 1,872.80 1,885.36 2,424.04 2,716.37 3,152.60 3,682.20
Goods and Services 1,166.06 1,178.01 1,323.06 1,511.73 1,769.74 2,251.52
Personnel Cost 860.15 890.81 723.89 1,040.99 1,123.31 1,278.35
Pension 96.01 79.18 143.28 95.01 147.36 264.03
Overhead Cost 209.90 208.02 455.89 375.73 499.07 709.14
Interest Payments 592.17 609.52 927.74 1,073.25 1,109.10 1,127.01
Foreign 35.82 30.71 55.80 111.52 202.16 216.90
Domestic 4/ 556.35 578.81 871.94 961.72 906.94 910.11
Transfers 114.57 97.83 173.24 131.40 273.75 303.67
Special Funds and others 5/ 114.57 97.83 173.24 131.40 273.75 303.67
Capital Expenditure & Net Lending 6/ 274.53 346.18 541.42 911.61 1,148.48 1,258.64
Domestic Financed Budgets 274.53 346.18 541.42 911.61 1,148.48 1,258.64
Budgetary 57.43 90.79 0.00 0.00 100.60 1,258.64
Subsidy 61.00 0.00 408.19 0.00 0.00 0.00
SURE-P/ Loan to Ex Dom Naira Account/ CDF Releases 156.10 0.00 133.23 172.51 1,047.88 0.00
Spillover from Previous Year Capital Budget 0.00 255.39 0.00 739.09 0.00 0.00
Transfers 112.33 285.67 322.33 228.23 230.16 251.03
NDDC 7.71 20.53 10.23 0.00 0.00 50.09
NJC 39.71 35.00 10.83 0.00 0.00 55.00
UBE 10.30 38.56 15.41 0.00 0.00 56.24
Refund of Signature Bonuses/Others 54.61 191.59 285.86 228.23 230.16 89.70
Balance Of Revenue And Expenditure
Primary Surplus (+)/Deficit (-) -84.29 -601.94 -11.99 -777.50 -1,391.99 167.77
Current Surplus (+)/Deficit (-) -289.60 -579.61 -75.99 -710.91 -1,122.45 550.43
Overall Surplus (+)/Deficit (-) -676.46 -1,211.46 -939.73 -1,850.75 -2,501.10 -959.24
Financing: 676.46 1,211.46 939.73 1,850.75 2,501.10 959.24
Foreign (Net) 0.00 0.00 0.00 0.00 0.00 401.41
Domestic (Net) 676.46 1,211.46 939.73 1,850.75 2,501.10 557.83
Banking System 0.00 0.00 0.00 0.00 0.00 0.00
CBN 421.20 0.20 0.20 0.00 0.00 0.00
DMBs 0.00 0.00 0.00 0.00 0.00 0.00
Non Bank Public 330.00 524.60 0.00 410.00 410.00 401.41
Privatization Proceeds 72.60 5.92 0.00 0.00 0.00 105.00
Loans from Special Accts 24.01 296.51 0.00 0.00 0.00 51.42
Excess Crude 0.00 0.00 0.00 0.00 0.00 0.00
Recoveries of Misappropriated Funds 0.00 0.00 0.00 0.00 0.00 0.00
Other Funds 249.85 384.42 939.73 1,440.75 2,091.10 401.41
Source: Office of the Accountant-General of the Federation (OAGF)
1/ Revised
2/ Provisional
3/ Includes FGN balance of special accounts, transfers to CRF, Revenues from Special Accounts, payments to FGN and other statutory benefits
4/ Include Ways and Means Advances
5/ Includes FCT share of VAT
6/ Includes net deductions for loans on lent to State,local governments and Federal parastatals/companies.

169
Table 31
Functional Classification of Federal Government Recurrent and Capital
Expenditure
(Naira Billion) 2015
Half - Year
2016
Half - Year
2017
Half - Year
2018
Half - Year 1/
2019
Half - Year 2/
TOTAL EXPENDITURE 2,259.66 2,517.21 3,287.78 3,856.21 4,531.24
A. RECURRENT EXPENDITURE 1,872.80 1,885.36 2,424.04 2,716.37 3,152.60
A1. ADMINISTRATION 607.41 649.01 592.42 784.12 890.28
General Administration 206.57 280.36 255.88 314.69 375.47
Defence 150.73 137.62 125.50 175.65 192.27
Internal Security 250.12 231.03 211.04 293.78 322.54
A2. ECONOMIC SERVICES 123.33 163.75 186.37 199.40 242.14
Agriculture 23.28 24.76 28.76 32.85 37.96
Roads & Construction 23.47 25.13 30.13 33.59 39.03
Transport & Communications 53.98 57.65 68.17 76.81 89.03
Others 22.61 56.21 59.30 56.15 76.12
A3. SOCIAL & COMMUNITY SERVICES 339.31 286.07 401.00 433.20 489.96
Education 158.83 160.03 194.45 218.40 252.90
Health 76.78 74.53 92.98 103.78 119.55
Others 103.69 51.52 113.56 111.02 117.52
A4. TRANSFERS 802.75 786.53 1,244.26 1,299.65 1,530.22
Public Debt Charges (Int) 592.17 609.52 927.74 1,073.25 1,109.10
Domestic 556.35 578.81 871.94 961.72 906.94
Foreign 35.82 30.71 55.80 111.52 202.16
Pensions & Gratuities 96.01 79.18 143.28 95.01 147.36
FCT & Others 114.57 97.83 173.24 131.40 273.75
Contingencies (Others) - - - -
External Obligations - - - -
Extra-Budgetary Expenditure - - - -
Deferred Customs Duties - - - -
Unspecified Expenditure - - - -
Others - - - -
B. CAPITAL EXPENDITURE 274.53 346.18 541.42 911.61 1,148.48
B1. ADMINISTRATION 106.64 134.47 207.89 350.04 444.84
General Administration 66.72 84.13 130.43 219.61 278.70
Defence 15.80 19.92 30.62 51.56 65.72
Internal Security 24.12 30.41 46.84 78.87 100.42
B2 ECONOMIC SERVICES 112.05 141.30 223.38 376.11 470.04
Agriculture & Natural Resources 21.20 24.86 40.78 68.66 85.81
Manuf., Mining & Quarrying 6.48 7.66 12.79 21.54 26.63
Transport & Communications 29.51 34.58 56.96 95.90 119.63
Housing - - - - -
Roads & Construction 38.30 45.02 73.91 124.45 155.37
National Priority Projects - - - - -
JVC Calls/NNPC Priority Projects - - - - -
PTF - - - - -
Counterpart Funding - - - - -
Others 16.55 29.18 38.93 65.56 82.59
B3 SOCIAL & COMMUNITY SERVICES 43.48 54.82 85.98 144.76 182.01
Education 18.53 23.36 35.92 60.48 76.80
Health 15.03 18.95 29.20 49.17 62.37
Others 9.92 12.51 20.86 35.12 42.84
B4 TRANSFERS 12.36 15.59 24.17 40.69 51.60
Financial Obligations - - - - -
Capital Repayments - - - - -
Domestic - - - - -
Foreign - - - - -
External Obligations - - - - -
Contingencies - - - - -
Capital Supplementation 9.31 11.73 18.23 30.70 38.89
Net Lending to States/L.G.s/Parast. - - - - -
Grants to States - - - - -
Others 3.05 3.85 5.94 9.99 12.71
C. STATUTORY TRANSFERS 112.33 285.67 322.33 228.23 230.16
NDDC 7.71 20.53 10.23 0.00 0.00
NJC 39.71 35.00 10.83 0.00 0.00
UBE 10.30 38.56 15.41 0.00 0.00
Others 54.61 191.59 285.86 228.23 230.16
Sources: Federal Ministry of Finance, Office of the Accountant-General of the Federation and Central Bank of Nigeria
1/ Revised
2/ Provisional

Table 32
Summary of Statutory & VAT Revenue Allocation to State Governments
(Naira Billion)
Gross Stat. Alloc. Deductions 13% DerivationTotal Net Stat.
Alloc.
Excess Oil
Revenue 2/Exchange Gain VAT Total Gross Alloc. Total Net Alloc. Gross Stat. Alloc. Deductions 13% Derivation
Total Net Stat.
Alloc.
Excess Non-Oil
Revenue
Excess Oil
Revenue 2/Exchange Gain VAT Total Gross Alloc. Total Net Alloc. Gross Stat. Alloc. Deductions 13% Derivation
Total Net Stat.
Alloc.
Excess Oil
Revenue 2/Exchange Gain VAT Total Gross Alloc. Total Net Alloc.
1 Abia 12.92 0.77 2.25 14.41 0.22 1.52 3.98 20.90 20.13 9.21 2.09 1.15 8.28 0.01 0.19 0.13 3.84 14.54 12.45 9.58 1.63 1.46 9.41 1.22 2.24 4.58 19.07 17.44
2 Adamawa 13.75 0.93 - 12.82 0.19 1.29 4.15 19.37 18.44 9.80 2.10 - 7.70 0.01 0.21 0.12 4.02 14.15 12.05 10.20 1.52 - 8.68 1.02 1.95 4.79 17.95 16.43
3 Akwa Ibom 13.88 0.70 60.83 74.01 1.41 9.46 4.68 90.25 89.55 9.89 7.51 40.22 42.60 0.01 0.21 0.82 4.30 55.45 47.94 10.29 4.35 38.58 44.52 6.69 12.79 5.12 73.48 69.13
4 Anambra 13.72 0.23 - 13.49 0.18 1.28 4.55 19.74 19.50 9.78 0.87 - 8.91 0.01 0.21 0.12 4.44 14.56 13.69 10.18 0.59 - 9.58 1.02 1.94 5.37 18.50 17.91
5 Bauchi 16.51 3.47 13.03 0.22 1.54 4.75 23.02 19.55 11.77 3.31 - 8.45 0.01 0.25 0.14 4.60 16.77 13.45 12.24 3.60 - 8.64 1.22 2.34 5.47 21.27 17.66
6 Bayelsa 12.21 9.62 40.21 42.81 0.90 6.28 3.49 63.09 53.47 8.70 17.40 21.06 12.37 0.01 0.18 0.46 3.39 33.81 16.41 9.06 5.90 26.85 30.01 5.38 8.70 4.36 54.34 48.44
7 Benue 15.48 3.09 - 12.38 0.21 1.45 4.47 21.60 18.51 11.03 5.13 - 5.90 0.01 0.23 0.13 4.43 15.84 10.71 11.48 2.42 - 9.06 1.15 2.19 5.24 20.06 17.64
8 Borno 17.15 0.09 - 17.06 0.23 1.60 4.42 23.40 23.31 12.22 2.02 - 10.21 0.01 0.26 0.15 4.35 16.99 14.98 12.72 1.37 - 11.35 1.27 2.43 5.19 21.60 20.24
9 Cross River 13.88 3.52 - 10.36 0.19 1.30 4.13 19.49 15.97 9.89 8.67 - 1.23 0.01 0.21 0.12 3.85 14.08 5.42 10.29 6.09 - 4.20 1.03 1.96 4.66 17.94 11.86
10 Delta 14.01 8.40 49.94 55.55 1.10 7.93 4.90 77.88 69.48 9.99 14.45 30.03 25.56 0.01 0.21 0.64 4.78 45.66 31.21 10.39 9.37 24.48 25.50 5.45 8.78 5.47 54.58 45.20
11 Ebonyi 12.35 4.45 - 7.90 0.17 1.15 3.68 17.34 12.90 8.80 0.89 - 7.91 0.01 0.19 0.11 3.57 12.67 11.79 9.16 0.64 - 8.52 0.91 1.75 4.34 16.16 15.52
12 Edo 12.90 4.73 6.06 14.24 0.29 1.99 4.26 25.49 20.77 9.20 6.31 3.04 5.93 0.01 0.19 0.16 4.30 16.91 10.60 9.57 3.97 1.25 6.85 1.14 2.10 5.04 19.11 15.13
13 Ekiti 12.34 3.45 - 8.89 0.17 1.15 3.72 17.38 13.93 8.80 6.12 - 2.67 0.01 0.19 0.11 3.67 12.76 6.64 9.15 4.07 - 5.08 0.91 1.75 4.35 16.16 12.08
14 Enugu 13.88 0.98 - 12.90 0.19 1.30 4.39 19.75 18.77 9.89 1.42 - 8.48 0.01 0.21 0.12 4.21 14.44 13.03 10.29 1.65 - 8.65 1.03 1.96 5.05 18.33 16.68
15 Gombe 13.00 4.02 - 8.98 0.18 1.22 3.77 18.16 14.15 9.27 4.86 - 4.41 0.01 0.20 0.11 3.68 13.27 8.41 9.64 2.71 - 6.93 0.96 1.84 4.36 16.81 14.10
16 Imo 14.35 2.74 2.14 13.74 0.23 1.62 4.38 22.72 19.98 10.23 4.38 1.13 6.97 0.01 0.22 0.14 4.30 16.03 11.65 10.64 3.51 1.53 8.66 1.38 2.43 5.15 21.13 17.62
17 Jigawa 15.43 0.13 - 15.30 0.21 1.44 4.65 21.74 21.60 11.00 0.72 - 10.28 0.01 0.23 0.13 4.48 15.86 15.13 11.45 0.47 - 10.97 1.14 2.18 5.41 20.18 19.71
18 Kaduna 18.08 3.21 - 14.88 0.24 1.69 5.40 25.41 22.21 12.89 2.36 - 10.53 0.01 0.27 0.16 5.30 18.63 16.27 13.41 1.69 - 11.72 1.34 2.56 6.59 23.89 22.20
19 Kano 21.89 0.42 - 21.47 0.29 2.05 7.26 31.49 31.07 15.60 2.09 - 13.51 0.02 0.33 0.19 7.16 23.30 21.20 16.23 2.14 - 14.09 1.62 3.10 10.42 31.37 29.23
20 Katsina 16.96 0.71 - 16.25 0.23 1.59 5.35 24.13 23.42 12.09 1.55 - 10.54 0.01 0.25 0.15 5.25 17.76 16.21 12.58 1.38 - 11.20 1.26 2.40 6.04 22.28 20.90
21 Kebbi 14.57 0.22 - 14.35 0.20 1.36 4.11 20.24 20.02 10.39 1.68 - 8.71 0.01 0.22 0.13 3.99 14.73 13.05 10.81 1.27 - 9.54 1.08 2.06 4.76 18.70 17.44
22 Kogi 15.25 1.62 - 13.64 0.21 1.43 4.11 21.00 19.38 10.87 1.92 - 8.95 0.01 0.23 0.13 4.02 15.26 13.35 11.31 1.85 - 9.46 1.13 2.16 4.81 19.41 17.56
23 Kwara 12.29 0.70 - 11.59 0.17 1.15 3.76 17.36 16.66 8.76 2.62 - 6.14 0.01 0.18 0.11 3.68 12.74 10.12 9.11 1.50 - 7.61 0.91 1.74 4.38 16.14 14.64
24 Lagos 18.49 13.93 - 4.56 0.25 1.73 36.74 57.21 43.27 13.18 14.22 - (1.04) 0.01 0.28 0.16 36.48 50.11 35.90 13.71 8.83 - 4.88 1.37 2.62 38.29 55.99 47.15
25 Nasarawa 12.73 0.87 - 11.85 0.17 1.19 3.53 17.62 16.74 9.07 1.28 - 7.79 0.01 0.19 0.11 3.41 12.80 11.51 9.44 1.01 - 8.43 0.94 1.80 4.16 16.34 15.33
26 Niger 16.35 3.20 - 13.14 0.22 1.53 4.40 22.49 19.29 11.65 4.06 - 7.59 0.01 0.25 0.14 4.35 16.40 12.34 12.12 1.87 - 10.26 1.21 2.31 5.14 20.79 18.92
27 Ogun 12.82 0.99 - 11.83 0.17 1.20 4.49 18.68 17.70 9.14 7.47 - 1.67 0.01 0.19 0.11 4.26 13.71 6.24 9.51 4.85 - 4.66 0.95 1.81 5.17 17.44 12.59
28 Ondo 12.85 6.36 7.39 13.88 0.31 2.18 4.20 26.94 20.58 9.16 7.22 5.59 7.53 0.01 0.19 0.21 4.11 19.27 12.06 9.53 4.31 6.45 11.67 2.12 3.68 4.89 26.66 22.35
29 Osun 12.59 6.75 - 5.84 0.17 1.18 4.17 18.10 11.36 8.97 14.39 - (5.42) 0.01 0.19 0.11 4.09 13.37 (1.02) 9.33 6.01 - 3.32 0.93 1.78 4.86 16.90 10.89
30 Oyo 15.48 1.69 - 13.79 0.21 1.45 5.60 22.73 21.04 11.03 3.82 - 7.21 0.01 0.23 0.13 5.86 17.27 13.45 11.48 2.67 - 8.81 1.15 2.19 7.67 22.48 19.81
31 Plateau 14.41 2.80 - 11.62 0.19 1.35 4.24 20.19 17.40 10.27 7.36 - 2.92 0.01 0.22 0.12 4.05 14.68 7.32 10.69 4.75 - 5.94 1.07 2.04 4.83 18.63 13.88
32 Rivers 14.88 8.36 39.07 45.60 0.94 6.46 5.90 67.26 58.90 10.61 11.64 22.87 21.84 0.01 0.22 0.52 6.05 40.28 28.64 11.04 7.39 26.98 30.62 6.27 9.22 8.95 62.45 55.07
33 Sokoto 15.21 0.25 - 14.96 0.20 1.42 4.27 21.11 20.86 10.84 1.23 - 9.61 0.01 0.23 0.13 4.23 15.44 14.21 11.28 0.87 - 10.41 1.13 2.15 4.96 19.52 18.65
34 Taraba 13.29 1.11 - 12.18 0.18 1.24 3.75 18.46 17.35 9.48 2.19 - 7.29 0.01 0.20 0.11 3.62 13.42 11.23 9.86 2.14 - 7.72 0.98 1.88 4.36 17.09 14.95
35 Yobe 13.70 0.11 - 13.59 0.18 1.28 3.68 18.85 18.74 9.77 0.79 - 8.98 0.01 0.21 0.12 3.63 13.73 12.94 10.16 0.50 - 9.66 1.01 1.94 4.35 17.47 16.96
36 Zamfara 13.73 2.41 - 11.32 0.18 1.28 4.10 19.30 16.89 9.79 5.58 - 4.21 0.01 0.21 0.12 4.01 14.14 8.56 10.18 4.02 - 6.16 1.02 1.94 4.74 17.88 13.86
37 Disputed Deriv.
Rivers/Akwa Disputed Fund
523.34 107.06 207.89 624.17 10.99 76.27 191.44 1,009.93 902.88 373.00 181.69 125.10 316.41 0.42 7.86 6.69 187.77 700.83 519.14 388.10 112.92 127.59 402.77 60.38 108.69 223.35 908.11 795.19
1/ Provisional
2/ Includes the share of oil-producing states from the excess crude.
Total
First Half 2016 First Half 2017
Source: Federation Account Allocation, Federal Ministry of Finance.
S/N States
First Half 2015

Table 32 Contd.
Summary of Statutory & VAT Revenue Allocation to State Governments
(Naira Billion)
Gross Stat. Alloc. Deductions 13% DerivationTotal Net Stat.
Alloc.
Excess Non-Oil
Revenue
Excess Oil
Revenue 2/Exchange Gain VAT Total Gross Alloc. Total Net Alloc. Gross Stat. Alloc. Deductions 13% Derivation
Total Net Stat.
Alloc.
Excess Oil
Revenue 2/Exchange Gain
Excess Non-Oil
RevenueVAT Total Gross Alloc. Total Net Alloc.
1 Abia 19.11 2.38 4.04 20.77 0.02 0.31 0.47 5.31 29.27 26.89 17.85 2.83 3.31 18.34 0.58 0.37 0.08 5.86 28.06 25.23
2 Adamawa 20.33 2.77 - 17.57 0.02 0.26 0.38 5.49 26.48 23.71 18.99 2.97 0.00 16.02 0.48 0.30 0.09 6.07 25.93 22.96
3 Akwa Ibom 20.52 6.98 76.46 90.01 0.02 1.70 2.47 6.00 107.17 100.20 19.17 6.59 60.45 73.02 2.87 1.83 0.09 6.59 90.99 84.39
4 Anambra 20.29 0.76 - 19.53 0.02 0.26 0.38 6.23 27.18 26.42 18.96 0.85 0.00 18.10 0.48 0.30 0.09 6.89 26.71 25.86
5 Bauchi 24.41 5.82 - 18.59 0.02 0.31 0.46 6.21 31.41 25.59 22.80 5.65 0.00 17.16 0.57 0.36 0.10 6.95 30.79 25.14
6 Bayelsa 18.06 9.86 61.01 69.21 0.02 1.23 1.89 4.78 86.99 77.13 16.87 9.28 47.82 55.41 2.20 1.39 0.08 5.27 73.63 64.35
7 Benue 22.89 3.29 - 19.60 0.02 0.29 0.43 5.97 29.60 26.30 21.38 3.32 0.00 18.06 0.54 0.34 0.10 6.67 29.02 25.70
8 Borno 25.36 2.04 - 23.32 0.02 0.32 0.48 5.89 32.07 30.03 23.69 2.05 0.00 21.64 0.59 0.38 0.11 6.62 31.38 29.33
9 Cross River 20.52 9.34 0.00 11.19 0.02 0.26 0.39 5.27 26.46 17.12 19.17 8.97 0.00 10.20 0.48 0.30 0.09 5.85 25.90 16.93
10 Delta 20.72 13.81 83.38 90.30 0.02 1.82 2.65 6.40 114.99 101.18 19.36 7.12 80.55 92.78 3.81 2.33 0.09 7.38 113.50 106.38
11 Ebonyi 18.26 2.19 - 16.07 0.02 0.23 0.34 4.94 23.79 21.60 17.06 2.31 0.00 14.75 0.43 0.27 0.08 5.58 23.41 21.10
12 Edo 19.08 3.79 10.64 25.93 0.02 0.41 0.63 5.90 36.67 32.88 17.83 3.49 9.12 23.45 0.79 0.49 0.08 6.55 34.86 31.37
13 Ekiti 18.25 5.92 - 12.33 0.02 0.23 0.34 5.00 23.84 17.91 17.05 3.74 0.00 13.31 0.43 0.27 0.08 5.61 23.44 19.70
14 Enugu 20.53 1.68 - 18.84 0.02 0.26 0.39 5.55 26.74 25.06 19.17 1.64 0.00 17.54 0.48 0.30 0.09 6.30 26.34 24.71
15 Gombe 19.23 4.15 - 15.08 0.02 0.24 0.36 4.94 24.78 20.63 17.96 4.89 0.00 13.07 0.45 0.29 0.08 5.53 24.30 19.42
16 Imo 21.22 5.22 2.67 18.67 0.02 0.31 0.48 5.90 30.60 25.38 19.82 5.59 4.34 18.58 0.67 0.42 0.09 6.69 32.03 26.45
17 Jigawa 22.83 1.14 - 21.69 0.02 0.29 0.43 6.32 29.88 28.75 21.32 1.15 0.00 20.17 0.54 0.34 0.10 7.06 29.34 28.20
18 Kaduna 26.74 2.34 - 24.41 0.02 0.34 0.50 7.59 35.19 32.86 24.98 2.51 0.00 22.47 0.63 0.40 0.11 8.37 34.48 31.97
19 Kano 32.37 3.21 - 29.16 0.03 0.41 0.61 9.67 43.09 39.88 30.24 2.99 0.00 27.25 0.76 0.48 0.14 10.87 42.48 39.49
20 Katsina 25.09 4.43 - 20.66 0.02 0.32 0.47 6.92 32.82 28.39 23.43 1.92 0.00 21.51 0.59 0.37 0.11 7.64 32.14 30.22
21 Kebbi 21.55 1.82 - 19.74 0.02 0.27 0.40 5.48 27.73 25.92 20.13 1.85 0.00 18.28 0.51 0.32 0.09 6.09 27.14 25.29
22 Kogi 22.56 3.62 - 18.94 0.02 0.28 0.42 5.51 28.79 25.17 21.07 3.52 0.00 17.55 0.53 0.33 0.09 6.13 28.15 24.64
23 Kwara 18.17 2.43 - 15.74 0.02 0.23 0.34 5.06 23.82 21.39 16.97 2.98 0.00 13.99 0.43 0.27 0.08 5.55 23.30 20.32
24 Lagos 27.34 17.04 - 10.30 0.02 0.35 0.51 48.20 76.43 59.38 25.54 17.66 0.00 7.88 0.64 0.41 0.11 54.64 81.34 63.68
25 Nasarawa 18.82 1.53 - 17.30 0.02 0.24 0.35 4.73 24.16 22.63 17.58 2.18 0.00 15.41 0.44 0.28 0.08 5.33 23.71 21.53
26 Niger 24.18 3.61 - 20.57 0.02 0.31 0.45 5.89 30.84 27.23 22.58 3.59 0.00 18.99 0.57 0.36 0.10 6.65 30.26 26.67
27 Ogun 18.96 7.22 - 11.74 0.02 0.24 0.36 6.44 26.01 18.79 17.71 7.26 0.00 10.46 0.44 0.28 0.08 6.95 25.46 18.21
28 Ondo 19.00 4.00 9.29 24.29 0.02 0.43 0.63 5.58 34.95 30.95 17.75 4.13 6.62 20.24 0.69 0.45 0.08 6.30 31.90 27.77
29 Osun 18.61 14.52 - 4.09 0.02 0.24 0.35 5.55 24.77 10.24 17.39 14.53 0.00 2.86 0.44 0.28 0.08 6.16 24.34 9.81
30 Oyo 22.89 3.73 - 19.16 0.02 0.29 0.43 8.25 31.88 28.16 21.38 4.44 0.00 16.94 0.54 0.34 0.10 9.86 32.22 27.78
31 Plateau 21.31 6.90 - 14.42 0.02 0.27 0.40 5.49 27.49 20.60 19.91 5.87 0.00 14.04 0.50 0.32 0.09 6.11 26.92 21.05
32 Rivers 22.01 7.93 58.86 72.94 0.02 1.28 1.89 8.88 92.94 85.01 20.56 5.41 46.50 61.65 2.28 1.39 0.09 8.96 79.78 74.37
33 Sokoto 22.49 3.65 - 18.84 0.02 0.28 0.42 5.65 28.87 25.22 21.01 1.88 0.00 19.13 0.53 0.33 0.09 6.38 28.35 26.47
34 Taraba 19.66 2.75 - 16.91 0.02 0.25 0.37 4.95 25.25 22.49 18.36 2.52 0.00 15.85 0.46 0.29 0.08 5.46 24.66 22.14
35 Yobe 20.27 0.74 - 19.53 0.02 0.26 0.38 5.00 25.92 25.18 18.93 0.74 0.00 18.19 0.48 0.30 0.08 5.67 25.46 24.72
36 Zamfara 20.31 7.75 - 12.57 0.02 0.26 0.38 5.42 26.39 18.64 18.97 6.20 0.00 12.77 0.48 0.30 0.09 6.04 25.87 19.67
37 Disputed Deriv. -
Rivers/Akwa Disputed Fund -
773.98 180.36 306.35 899.97 0.69 15.24 22.66 256.35 1,375.28 1,194.92 722.94 164.59 258.71 817.06 28.30 17.79 3.24 286.61 1,317.59 1,153.01 Total
First Half 2018 First Half 2019 1/
S/N States
Table 33

Allocation to Local Governments from the Federation and VAT Pools Accounts 1/
(Naira Billion)
S/N State Fed. Acct. Excess Crude Exchange GainAdditional
RevenueVAT Total Fed. Acct.
Excess Non-
Oil RevenueExchange Gain NLNG Dividend VAT Total Fed. Acct. Excess Crude Exchange Gain VAT Total
1 Abia 8.37 0.06 0.78 0.05 2.36 11.63 5.97 0.01 0.07 0.13 2.3 8.5 6.21 0.62 1.18 2.73 10.74
2 Adamawa 10.56 0.07 0.99 0.07 2.82 14.52 7.53 0.01 0.09 0.16 2.7 10.5 7.83 0.78 1.49 3.27 13.38
3 Akwa-Ibom 14.07 0.10 1.32 0.09 4.02 19.59 10.03 0.01 0.12 0.21 3.8 14.2 10.43 1.04 1.99 4.52 17.98
4 Anambra 10.62 0.07 0.99 0.07 3.10 14.86 7.57 0.01 0.09 0.16 3.0 10.9 7.88 0.79 1.50 3.66 13.82
5 Bauchi 12.06 0.08 1.13 0.08 3.15 16.50 8.59 0.01 0.10 0.18 3.1 11.9 8.94 0.89 1.71 3.64 15.18
6 Bayelsa 4.91 0.03 0.46 0.03 1.25 6.68 3.50 0.00 0.04 0.07 1.2 4.8 3.64 0.36 0.69 1.62 6.32
7 Benue 13.12 0.09 1.23 0.09 3.24 17.76 9.35 0.01 0.11 0.20 3.2 12.9 9.73 0.97 1.86 3.79 16.35
8 Borno 14.24 0.10 1.33 0.09 3.55 19.32 10.15 0.01 0.12 0.21 3.5 14.0 10.56 1.05 2.02 4.17 17.80
9 Cross-River 9.18 0.06 0.86 0.06 2.53 12.70 6.54 0.01 0.08 0.14 2.4 9.1 6.81 0.68 1.30 2.88 11.67
10 Delta 11.77 0.08 1.10 0.08 3.63 16.66 8.39 0.01 0.10 0.18 3.6 12.2 8.73 0.87 1.66 4.12 15.38
11 Ebonyi 6.79 0.05 0.63 0.04 1.81 9.33 4.84 0.01 0.06 0.10 1.8 6.8 5.04 0.50 0.96 2.15 8.65
12 Edo 9.00 0.06 0.84 0.06 2.62 12.59 6.42 0.01 0.08 0.14 2.6 9.3 6.68 0.67 1.27 3.11 11.73
13 Ekiti 7.15 0.05 0.67 0.05 2.11 10.02 5.09 0.01 0.06 0.11 2.1 7.4 5.30 0.53 1.01 2.47 9.31
14 Enugu 9.15 0.06 0.85 0.06 2.61 12.73 6.52 0.01 0.08 0.14 2.5 9.3 6.78 0.68 1.29 3.01 11.77
15 Gombe 6.27 0.04 0.59 0.04 1.70 8.64 4.47 0.01 0.05 0.09 1.7 6.3 4.65 0.46 0.89 1.97 7.97
16 Imo 12.26 0.09 1.15 0.08 3.52 17.09 8.74 0.01 0.11 0.18 3.5 12.5 9.09 0.91 1.73 4.13 15.86
17 Jigawa 12.88 0.09 1.20 0.08 3.69 17.94 9.18 0.01 0.11 0.19 3.6 13.1 9.55 0.95 1.82 4.30 16.62
18 Kaduna 14.48 0.10 1.35 0.09 3.85 19.89 10.32 0.01 0.13 0.22 3.8 14.5 10.74 1.07 2.05 4.66 18.53
19 Kano 23.06 0.16 2.16 0.15 6.89 32.41 16.43 0.02 0.20 0.35 6.8 23.8 17.10 1.71 3.26 9.14 31.21
20 Katsina 17.55 0.12 1.64 0.11 4.76 24.20 12.51 0.01 0.15 0.26 4.7 17.6 13.02 1.30 2.48 5.45 22.25
21 Kebbi 11.08 0.08 1.04 0.07 2.81 15.07 7.90 0.01 0.10 0.17 2.7 10.9 8.22 0.82 1.57 3.26 13.86
22 Kogi 11.45 0.08 1.07 0.07 2.81 15.49 8.16 0.01 0.10 0.17 2.8 11.2 8.49 0.85 1.62 3.29 14.25
23 Kwara 8.10 0.06 0.76 0.05 2.13 11.10 5.78 0.01 0.07 0.12 2.1 8.1 6.01 0.60 1.15 2.48 10.24
24 Lagos 13.80 0.10 1.29 0.09 20.58 35.86 9.84 0.01 0.12 0.21 21.1 31.2 10.24 1.02 1.95 22.26 35.47
25 Nassarawa 7.23 0.05 0.68 0.05 1.71 9.71 5.15 0.01 0.06 0.11 1.7 7.0 5.36 0.53 1.02 2.03 8.95
26 Niger 13.38 0.09 1.25 0.09 3.35 18.17 9.54 0.01 0.12 0.20 3.3 13.2 9.92 0.99 1.89 3.92 16.73
27 Ogun 9.55 0.07 0.89 0.06 2.96 13.52 6.80 0.01 0.08 0.14 2.8 9.9 7.08 0.71 1.35 3.42 12.55
28 Ondo 9.12 0.06 0.85 0.06 2.61 12.70 6.50 0.01 0.08 0.14 2.6 9.3 6.76 0.67 1.29 3.04 11.77
29 Osun 12.35 0.09 1.15 0.08 3.63 17.30 8.80 0.01 0.11 0.19 3.6 12.7 9.16 0.91 1.75 4.23 16.05
30 Oyo 15.58 0.11 1.46 0.10 4.80 22.04 11.10 0.01 0.13 0.23 4.9 16.4 11.55 1.15 2.20 6.24 21.15
31 Plateau 9.76 0.07 0.91 0.06 2.53 13.34 6.96 0.01 0.08 0.15 2.4 9.6 7.24 0.72 1.38 2.89 12.24
32 Rivers 12.10 0.08 1.13 0.08 4.07 17.47 8.63 0.01 0.10 0.18 4.1 13.1 8.98 0.90 1.71 5.92 17.51
33 Sokoto 12.19 0.08 1.14 0.08 3.10 16.59 8.69 0.01 0.11 0.18 3.1 12.0 9.04 0.90 1.72 3.60 15.27
34 Taraba 9.14 0.06 0.85 0.06 2.12 12.23 6.51 0.01 0.08 0.14 2.0 8.8 6.78 0.68 1.29 2.47 11.21
35 Yobe 9.19 0.06 0.86 0.06 2.17 12.34 6.55 0.01 0.08 0.14 2.1 8.9 6.81 0.68 1.30 2.56 11.36
36 Zamfara 8.30 0.06 0.78 0.05 2.20 11.38 5.92 0.01 0.07 0.12 2.2 8.3 6.16 0.61 1.17 2.54 10.48
37 FCT Abuja 3.67 0.03 0.34 0.02 7.20 11.26 2.61 0.00 0.03 0.06 6.3 9.0 2.72 0.27 0.52 7.40 10.91
403.48 2.80 37.71 2.63 134.01 580.63 287.57 0.33 3.48 6.06 131.44 428.87 299.21 29.85 57.08 156.35 542.49
Source: Federation Account Allocation, Federal Ministry of Finance (FMF)
1/ Revised
2/ Provisional
TOTAL
1st Half 2015 1st Half 2016 1st Half 2017

Table 33 Contd.
Allocation to Local Governments from the Federation and VAT Pools Accounts 1/
(Naira Billion)
S/N State Fed. Acct. Excess CrudeExcess Non-Oil
Revenue
Budget
Augmentation 1/Exchange Gain VAT Total Fed. Acct.
Excess Oil
Revenue
Excess Non-Oil
RevenueExchange Gain VAT Total
1 Abia 12.39 0.11 0.01 0.04 0.23 3.2 15.9 11.57 0.29 0.05 0.18 3.49 15.59
2 Adamawa 15.62 0.14 0.01 0.05 0.29 3.7 19.9 14.59 0.37 0.07 0.23 4.15 19.41
3 Akwa-Ibom 20.81 0.19 0.02 0.07 0.39 5.2 26.7 19.44 0.49 0.09 0.31 5.80 26.12
4 Anambra 15.71 0.15 0.01 0.05 0.29 4.2 20.5 14.67 0.37 0.07 0.23 4.70 20.03
5 Bauchi 17.83 0.16 0.02 0.06 0.33 4.1 22.6 16.65 0.42 0.07 0.26 4.64 22.05
6 Bayelsa 7.26 0.07 0.01 0.02 0.14 1.7 9.2 6.78 0.17 0.03 0.11 1.90 8.98
7 Benue 19.40 0.18 0.02 0.07 0.36 4.3 24.4 18.12 0.46 0.08 0.29 4.83 23.78
8 Borno 21.06 0.19 0.02 0.07 0.40 4.7 26.5 19.68 0.49 0.09 0.31 5.32 25.89
9 Cross-River 13.58 0.13 0.01 0.05 0.26 3.3 17.3 12.68 0.32 0.06 0.20 3.62 16.88
10 Delta 17.40 0.16 0.02 0.06 0.33 4.8 22.7 16.25 0.41 0.07 0.26 5.47 22.47
11 Ebonyi 10.05 0.09 0.01 0.03 0.19 2.4 12.8 9.38 0.24 0.04 0.15 2.75 12.56
12 Edo 13.31 0.12 0.01 0.05 0.25 3.6 17.4 12.44 0.31 0.06 0.20 4.03 17.03
13 Ekiti 10.57 0.10 0.01 0.04 0.20 2.8 13.7 9.87 0.25 0.04 0.16 3.18 13.51
14 Enugu 13.53 0.13 0.01 0.05 0.25 3.3 17.3 12.63 0.32 0.06 0.20 3.77 16.97
15 Gombe 9.27 0.09 0.01 0.03 0.17 2.2 11.8 8.66 0.22 0.04 0.14 2.49 11.54
16 Imo 18.13 0.17 0.02 0.06 0.34 4.7 23.4 16.93 0.43 0.08 0.27 5.34 23.04
17 Jigawa 19.05 0.18 0.02 0.06 0.36 5.0 24.7 17.79 0.45 0.08 0.28 5.57 24.17
18 Kaduna 21.42 0.20 0.02 0.07 0.40 5.4 27.5 20.01 0.50 0.09 0.32 5.93 26.84
19 Kano 34.10 0.32 0.03 0.12 0.64 9.2 44.4 31.85 0.80 0.14 0.51 10.32 43.62
20 Katsina 25.96 0.24 0.02 0.09 0.49 6.3 33.1 24.25 0.61 0.11 0.38 6.93 32.29
21 Kebbi 16.38 0.15 0.01 0.06 0.31 3.7 20.7 15.30 0.38 0.07 0.24 4.17 20.17
22 Kogi 16.94 0.16 0.02 0.06 0.32 3.8 21.2 15.82 0.40 0.07 0.25 4.19 20.73
23 Kwara 11.98 0.11 0.01 0.04 0.23 2.9 15.2 11.19 0.28 0.05 0.18 3.15 14.85
24 Lagos 20.41 0.19 0.02 0.07 0.38 27.8 48.9 19.07 0.48 0.09 0.30 31.18 51.11
25 Nassarawa 10.69 0.10 0.01 0.04 0.20 2.3 13.3 9.99 0.25 0.04 0.16 2.59 13.03
26 Niger 19.79 0.18 0.02 0.07 0.37 4.5 24.9 18.48 0.46 0.08 0.29 5.06 24.38
27 Ogun 14.12 0.13 0.01 0.05 0.27 4.2 18.8 13.19 0.33 0.06 0.21 4.55 18.34
28 Ondo 13.48 0.12 0.01 0.05 0.25 3.5 17.4 12.59 0.32 0.06 0.20 3.91 17.08
29 Osun 18.26 0.17 0.02 0.06 0.34 4.8 23.7 17.06 0.43 0.08 0.27 5.39 23.23
30 Oyo 23.04 0.21 0.02 0.08 0.43 6.9 30.6 21.52 0.54 0.10 0.34 8.01 30.50
31 Plateau 14.44 0.13 0.01 0.05 0.27 3.3 18.2 13.49 0.34 0.06 0.21 3.65 17.76
32 Rivers 17.90 0.17 0.02 0.06 0.34 6.0 24.5 16.72 0.42 0.08 0.27 6.18 23.66
33 Sokoto 18.03 0.17 0.02 0.06 0.34 4.1 22.7 16.84 0.42 0.08 0.27 4.63 22.24
34 Taraba 13.51 0.12 0.01 0.05 0.25 2.8 16.8 12.62 0.32 0.06 0.20 3.09 16.29
35 Yobe 13.59 0.13 0.01 0.05 0.26 2.9 17.0 12.69 0.32 0.06 0.20 3.34 16.60
36 Zamfara 12.28 0.11 0.01 0.04 0.23 2.9 15.6 11.47 0.29 0.05 0.18 3.23 15.22
37 FCT Abuja 5.42 0.05 0.00 0.02 0.10 8.7 14.3 5.06 0.13 0.02 0.08 10.07 15.37
596.71 5.51 0.53 2.02 11.21 179.53 795.51 557.36 13.99 2.50 8.85 200.63 783.33
Source: Federation Account Allocation, Federal Ministry of Finance (FMF)
1/ Revised
2/ Provisional
1st Half 2019 2/
TOTAL
1st Half 2018

174
Table 34
Domestic Debt of the Federal Government
(Naira Billion)
First Half 2015 First Half 2016 First Half 2017 1/ First Half 2018 2/ Second Half 2018 2/ First Half 2019 2/
1. Composition of Debt
i Treasury Bills 2,824.95 2,901.81 3,702.83 2,953.58 2,735.97 2,651.51
ii Treasury Bonds 271.22 230.99 190.99 150.99 150.99 125.99
iii Development Stocks - - - - - -
iv FGN Bonds 5,300.42 7,473.54 8,134.88 8,927.66 9,334.74 9,691.42
v Promissory Note - - - - 331.27 707.76
vi FGN Savings Bond 4.75 8.52 10.75 10.43
vii FGN Sukuk 100.00 200.00 200.00
viii FGN Green Bond 10.69 10.69 25.69
Total 8,396.59 10,606.33 12,033.45 12,151.44 12,774.41 13,412.80
2. Holders
i Banking System 6,040.09 6,927.25 6,272.76 6,356.03 5,774.03 7,025.40
a. Central Bank 948.97 689.42 1,677.41 1,823.13 2,005.44 1,947.35
b. Deposit Money Banks /3 5,091.12 6,237.83 4,595.35 4,532.90 3,768.59 5,078.05
ii Non-Bank Public 1,961.60 3,407.33 5,634.35 5,694.86 6,905.30 6,302.44
iii Sinking Fund 394.90 271.75 126.34 100.55 95.08 84.95
Total Debt Outstanding 8,396.59 10,606.33 12,033.45 12,151.44 12,774.41 13,412.80
Source: Debt Management Office
1/ Revised
2/ Provisional
3/ Includes holdings of Discount Houses

175
Table 35
Domestic Debt Service Payment of the Federal Government by Instrument
(Naira Billion)
1st Half 2015 1st Half 2016 1st Half 2017 2nd Half 2017 1st Half 2018 2nd Half 2018 1st Half 2019 1/
i Treasury Bills 191.04 219.93 201.57 243.56 379.51 261.18 166.63
ii Treasury Bonds 43.75 40.63 34.62 13.37 9.38 12.62 6.87
iii Development Stocks - - - - - - -
iv FGN Bonds 293.74 381.13 473.19 509.47 542.73 573.48 609.84
v FGN Savings Bond 0.07 0.37 0.50 0.60 0.66
vi FGN Sukuk 8.17 8.30 16.02
vii FGN Green Bond 0.72 0.72 0.72
Total 528.54 641.68 709.45 766.77 941.00 856.90 800.73
Source: Debt Management Office
Note: Debt Service excludes sinking fund charges
₦638.90 Bill ion of Treasury Bills were redeemed during the first half of 2018.
1/ Provisional

Table 36
External Public Debt Outstanding
End-June
2014
End-June
2015
End-June
2016
End-June
2017
End-December
2017
End-June
2018
End-December
2018
End-June
2019 1/
End-June
2014
End-June
2015
End-June
2016
End-June
2017
End-
December
2017
End-June
2018
End-
December
2018
End-June
2019 1/
MULTILATERAL 6,730.45 7,232.86 7,991.00 9,673.99 10,241.44 10,883.70 11,014.34 1,048.13 1,424.51 2,261.45 2,959.27 3,133.88 3,327.15
IBRD - - 7.25 124.18 124.18 124.18 124.18 - - 2.05 37.99 38.00 37.96
IDA 5,772.77 6,091.45 6,844.97 7,596.11 7,905.62 8,348.92 8,550.11 898.99 1,199.71 1,937.13 2,323.65 2,419.12 2,552.26
IFAD 91.57 94.80 103.01 121.21 148.26 159.44 169.45 14.26 18.67 29.15 37.08 45.37 48.74
ADB Group 748.24 946.53 938.91 1,740.70 1,971.05 2,163.40 2,170.60 - 116.52 186.42 265.71 532.48 603.14 661.35
ADB 150.00 350.00 400.73 1,002.33 1,186.60 1,319.93 1,264.61 23.36 68.93 113.41 306.61 363.10 403.50
ADF 598.24 596.53 538.18 738.37 784.45 843.47 822.73 93.16 117.49 152.30 225.87 240.04 257.85
Others 2/ 117.87 100.08 96.86 91.79 92.33 87.76 83.26 18.36 19.71 27.41 28.08 28.25 26.83
BILATERAL 1,140.79 1,583.95 1,770.90 2,073.02 2,372.00 2,399.74 3,091.68 - 177.66 311.96 501.16 634.14 725.83 733.60
Exim Bank of China 1,031.84 1,388.87 1,495.85 1,768.95 1,930.98 1,913.07 2,485.08 160.69 273.54 423.33 541.12 590.88 584.83
French Devt. Agency (AFD) 108.95 140.25 182.95 218.25 274.98 274.98 344.63 16.97 27.62 51.77 66.76 84.14 84.06
Others 3/ - 54.83 92.10 85.82 166.04 211.69 261.97 - 10.80 26.06 26.25 50.81 64.71
COMMERCIAL 1,505.88 1,500.00 1,500.00 3,300.00 6,300.00 8,800.00 11,168.35 - 234.51 295.43 424.50 1,009.47 1,927.80 2,690.16
Euro Bond 1,500.00 1,500.00 1,500.00 3,000.00 6,000.00 8,500.00 10,868.35 233.60 295.43 424.50 917.70 1,836.00 2,598.45
Diaspora Bond 300.00 300.00 300.00 300 91.77 91.80 91.71
Other 4/ 5.88 0.92 - - - - -
Total Debt Outstanding 9,377.12 10,316.81 11,261.90 15,047.01 18,913.44 22,083.44 25,274.37 1,460.30 2,031.90 3,187.12 4,602.88 5,787.51 6,750.91
Source: Debt Management Office
1/ Provisional
2/ Includes BADEA, IDB and EDF
3/ Japan (JICA), India (Exim Bank of India), Gernamy (KfW), Exim Bank of Korea and Nig. ICT Infrast. Backbone Project.
4/ Includes Papalanto & Omotosho, ZTE, Arcatel and SBI Holdings.
Holder
US$ Million Naira Billion

Table 37
External Debt Service Payments
1st Half 2014 1st Half 2015 1st Half 2016 1st Half 20172nd Half
2017
1st Half
2018
2nd Half
2018
1st Half
2019 1/1st Half 2014 1st Half 2015 1st Half 2016 1st Half 2017
2nd Half
2017
1st Half
2018
2nd Half
2018
1st Half
2019 1/
MULTILATERAL 82.43 63.39 77.01 85.64 106.08 111.15 12.97 12.00 15.62 26.18 32.45 33.99
IBRD 0.00 0.00 0.00 0.00 0.00 0.00 0.00 0.00 0.00 0.00 0.00 0.00
IDA 0.06 0.05 0.06 0.07 0.08 0.08 0.01 0.01 0.01 0.02 0.03 0.03
IFAD 0.00 0.00 0.00 0.00 0.00 0.00 0.00 0.00 0.00 0.00 0.00 0.00
ADB Group 18.75 7.60 8.59 11.34 17.33 19.96 2.95 1.44 1.74 3.47 5.30 6.10
ADB 0.01 0.00 0.00 0.00 0.01 0.01 0.00 0.00 0.00 0.00 0.00 0.00
ADF 0.01 0.01 0.01 0.01 0.01 0.01 0.00 0.00 0.00 0.00 0.00 0.00
Others 2/ 0.00 0.00 0.00 0.00 0.00 0.00 0.00 0.00 0.00 0.00 0.00 0.00
BILATERAL 23.17 29.43 30.75 34.02 37.81 76.53 3.64 5.57 6.24 10.40 11.57 23.40
Exim Bank of China 0.02 0.03 0.03 0.03 0.03 0.07 0.00 0.01 0.01 0.01 0.01 0.02
French Devt. Agency (AFD) 0.00 0.00 0.00 0.00 0.00 0.00 0.00 0.00 0.00 0.00 0.00 0.00
Others 3/ 0.00 0.00 0.00 0.00 0.00 0.00 0.00 0.00 0.00 0.00 0.00 0.00
COMMERCIAL 72.58 66.49 57.89 66.51 133.99 239.94 11.42 12.59 11.74 20.33 40.98 73.37
Eurobonds 0.05 0.05 0.05 0.05 0.10 0.15 0.01 0.01 0.01 0.01 0.03 0.05
Diaspora Bond 0.01 0.07 0.00 0.02
Others 4/ 0.03 0.02 0.01 0.02 0.02 0.02 0.00 0.00 0.00 0.01 0.01 0.01
Total Debt Service Payments 178.18 159.31 165.66 186.16 277.89 427.63 28.03 30.17 33.59 56.91 85.00 130.76
Source: Debt Management Office, The Presidency, Abuja.
1/ Provisional
2/ Includes AGTF, ABEDA, IDB and EDF
3/ Japan (JICA), India (Exim Bank of India), Gernamy (KfW), Exim Bank of Korea and Nigeria ICT Infrastructure Backbone Project.
4/ Includes ZTE & CMCE, Oil Warrants and Agency Fees
Holder
Naira BillionUS$ Million
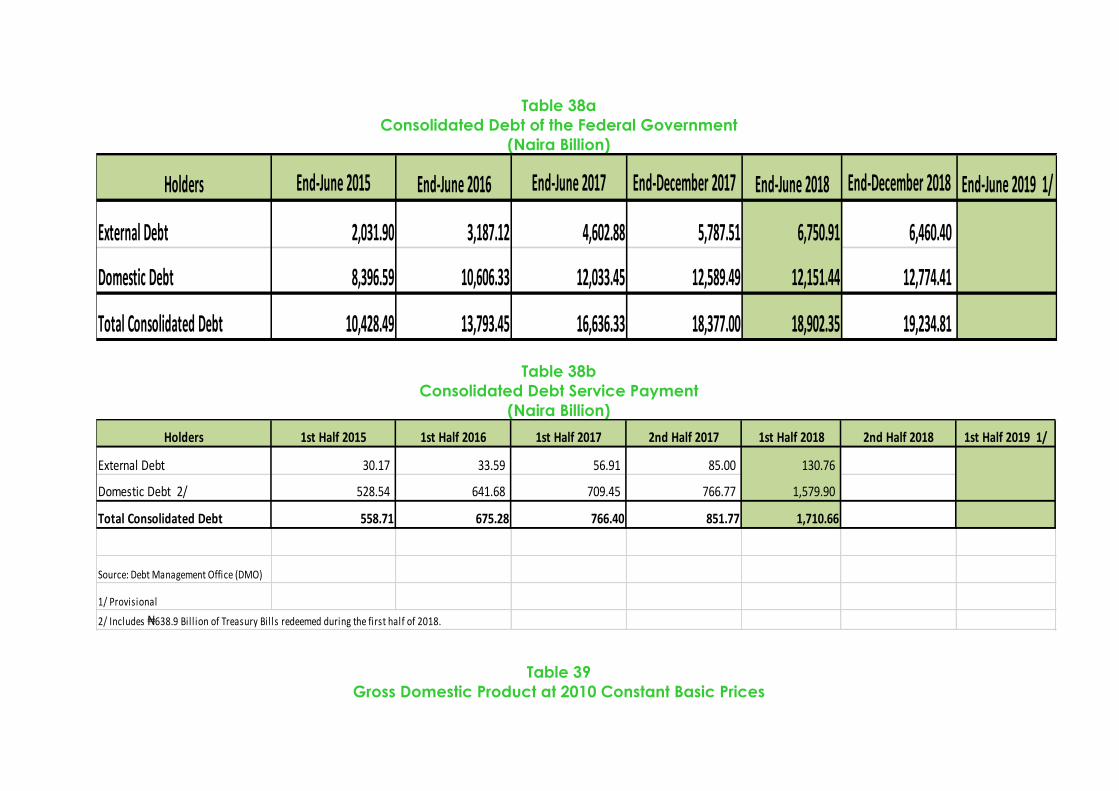
Table 38a
Consolidated Debt of the Federal Government
(Naira Billion)
Holders End-June 2015 End-June 2016 End-June 2017 End-December 2017 End-June 2018 End-December 2018 End-June 2019 1/
External Debt 2,031.90 3,187.12 4,602.88 5,787.51 6,750.91 6,460.40
Domestic Debt 8,396.59 10,606.33 12,033.45 12,589.49 12,151.44 12,774.41
Total Consolidated Debt 10,428.49 13,793.45 16,636.33 18,377.00 18,902.35 19,234.81
Table 38b
Consolidated Debt Service Payment
(Naira Billion)
Holders 1st Half 2015 1st Half 2016 1st Half 2017 2nd Half 2017 1st Half 2018 2nd Half 2018 1st Half 2019 1/
External Debt 30.17 33.59 56.91 85.00 130.76
Domestic Debt 2/ 528.54 641.68 709.45 766.77 1,579.90
Total Consolidated Debt 558.71 675.28 766.40 851.77 1,710.66
Source: Debt Management Office (DMO)
1/ Provisional
2/ Includes ₦638.9 Bill ion of Treasury Bills redeemed during the first half of 2018.
Table 39
Gross Domestic Product at 2010 Constant Basic Prices

(Naira Billion unless otherwise stated)
1st Half 2015 2nd Half 2015 1st Half 2016 2nd Half 2016 1st Half 2017 2nd Half 2017 1st Half 2018 1/ 2nd Half 2018 2/ 1st Half 2019 2/
1. Agriculture 6,654.44 9,297.78 6,910.26 9,697.08 7,130.69 10,048.80 7,277.03 10,267.11 7,455.62 20.47 25.47 21.49 27.11 22.19 27.64 22.27 27.66 22.36
(a) Crop Production 5,840.32 8,434.61 6,068.95 8,825.50 6,272.02 9,165.03 6,423.19 9,363.24 6,588.20 17.96 23.10 18.87 24.67 19.52 25.21 19.66 25.22 19.76
(b) Livestock 547.96 603.37 575.65 609.47 587.13 617.08 575.96 632.16 578.53 1.69 1.65 1.79 1.70 1.83 1.70 1.76 1.70 1.74
(c) Forestry 81.09 86.17 83.61 88.03 86.36 90.97 89.37 93.38 91.83 0.25 0.24 0.26 0.25 0.27 0.25 0.27 0.25 0.28
(d) Fishing 185.08 173.62 182.05 174.08 185.18 175.73 188.51 178.33 197.07 0.57 0.48 0.57 0.49 0.58 0.48 0.58 0.48 0.59
2. Industry 6,550.29 6,768.84 6,096.27 5,965.78 5,930.51 6,384.17 6,127.05 6,386.02 6,189.15 20.15 18.54 18.95 16.68 18.46 17.56 18.75 17.20 18.57
(a) Crude Petroleum & Natural Gas 3,291.61 3,338.36 3,023.25 2,648.96 2,824.38 3,113.66 2,955.11 3,040.76 3,005.77 10.12 9.14 9.40 7.41 8.79 8.56 9.04 8.19 9.02
(b) Solid Minerals 49.28 53.26 31.09 56.52 33.77 53.97 36.81 59.79 37.39 0.15 0.15 0.10 0.16 0.11 0.15 0.11 0.16 0.11
(c) Manufacturing 3,209.41 3,377.21 3,041.94 3,260.30 3,072.36 3,216.54 3,135.13 3,285.46 3,145.98 9.87 9.25 9.46 9.11 9.56 8.85 9.59 8.85 9.44
3. Construction 1,437.57 1,242.65 1,353.69 1,167.16 1,355.54 1,190.45 1,398.63 1,206.66 1,424.28 4.42 3.40 4.21 3.26 4.22 3.27 4.28 3.25 4.27
4. Trade 5,686.39 6,011.20 5,742.90 5,926.17 5,607.42 5,939.03 5,475.30 5,998.49 5,491.77 17.49 16.46 17.86 16.57 17.45 16.33 16.76 16.16 16.47
5. Services 12,185.25 13,189.53 12,059.14 13,012.80 12,108.52 12,795.85 12,399.16 13,264.49 12,776.49 37.48 36.13 37.49 36.38 37.68 35.19 37.94 35.73 38.32
(a) Transport 366.48 438.98 380.31 428.29 388.74 451.11 457.89 498.76 522.34 1.13 1.20 1.18 1.20 1.21 1.24 1.40 1.34 1.57
(b) Information and Communication 3,857.96 3,850.16 3,960.18 3,898.51 3,989.00 3,787.90 4,258.77 4,268.89 4,651.92 11.87 10.55 12.31 10.90 12.41 10.42 13.03 11.50 13.95
(c) Utilities 165.58 201.74 138.01 197.23 159.16 218.45 172.83 232.24 181.92 0.51 0.55 0.43 0.55 0.50 0.60 0.53 0.63 0.55
(d) Accommodation and Food Services 312.49 341.72 290.49 328.93 278.89 330.57 281.90 338.29 292.31 0.96 0.94 0.90 0.92 0.87 0.91 0.86 0.91 0.88
(e) Finance & Insurance 1,115.13 1,008.77 991.88 1,035.63 1,046.58 1,006.42 1,120.57 974.11 1,064.90 3.43 2.76 3.08 2.90 3.26 2.77 3.43 2.62 3.19
(f) Real Estate 2,373.28 2,891.42 2,254.40 2,649.21 2,179.27 2,515.12 2,039.36 2,432.50 2,004.33 7.30 7.92 7.01 7.41 6.78 6.92 6.24 6.55 6.01
(g) Professional, Scientific & Technical Services 1,162.07 1,354.00 1,162.99 1,373.30 1,161.22 1,368.46 1,159.66 1,384.47 1,176.64 3.57 3.71 3.62 3.84 3.61 3.76 3.55 3.73 3.53
(h) Administrative and Support Services
Bussiness Services 6.96 7.51 6.78 7.59 6.77 7.70 6.63 7.81 6.75 0.02 0.02 0.02 0.02 0.02 0.02 0.02 0.02 0.02
(i) Public Administration 809.79 834.99 766.92 802.59 765.66 797.96 738.50 793.08 674.66 2.49 2.29 2.38 2.24 2.38 2.19 2.26 2.14 2.02
(j) Education 623.37 875.33 644.44 874.49 643.30 864.68 642.83 864.73 646.33 1.92 2.40 2.00 2.44 2.00 2.38 1.97 2.33 1.94
(k) Human Health & Social Services 234.00 250.33 231.37 244.32 231.41 242.83 231.48 241.23 232.63 0.72 0.69 0.72 0.68 0.72 0.67 0.71 0.65 0.70
(l) Arts, Entertainment & Recreation 75.47 65.86 79.39 67.19 84.07 68.56 85.50 70.98 89.17 0.23 0.18 0.25 0.19 0.26 0.19 0.26 0.19 0.27
(m) Other Services 1,082.67 1,068.71 1,151.96 1,105.51 1,174.46 1,136.08 1,203.23 1,157.41 1,232.59 3.33 2.93 3.58 3.09 3.66 3.12 3.68 3.12 3.70
TOTAL (GDP) 32,513.94 36,509.99 32,162.26 35,768.98 32,132.69 36,358.30 32,677.16 37,122.78 33,337.31 100.00 100.00 100.00 100.00 100.00 100.00 100.00 100.00 100.00
NON-OIL (GDP) 29,222.34 33,171.63 29,139.01 33,120.02 29,308.30 33,244.63 29,722.05 34,082.02 30,331.54 89.88 90.86 90.60 92.59 91.21 91.44 90.96 91.81 90.98
NET INDIRECT TAXES ON PRODUCTS 312.91 443.85 274.26 446.93 264.40 450.31 276.42 459.99 279.85
TOTAL GDP AT 2010 CONSTANT MARKET PRICES 32,826.86 36,953.84 32,436.52 36,215.91 32,397.08 36,808.61 32,953.58 37,582.77 33,617.16
TOTAL GDP GROWTH RATE (%) 3.14 2.47 (1.08) (2.03) (0.09) 1.65 1.69 2.10 2.02
OIL GDP GROWTH RATE (%) (7.49) (3.34) (8.15) (20.65) (6.58) 17.54 4.63 (2.34) 1.71
NON-OIL GDP GROWTH RATE (%) 4.50 3.10 (0.29) (0.16) 0.58 0.38 1.41 2.52 2.05
Growth in Total GDP
Agriculture (%) 4.07 3.47 3.84 4.29 3.19 3.63 2.05 2.17 2.45
Industry (%) (4.88) (1.97) (6.93) (11.86) (2.72) 7.01 3.31 0.03 1.01
Construction (%) 8.67 (0.24) (5.83) (6.07) 0.14 2.00 3.18 1.36 1.83
Trade (%) 5.77 4.55 0.99 (1.41) (2.36) 0.22 (2.36) 1.00 0.30
Services (%) 5.56 3.50 (1.04) (1.34) 0.41 (1.67) 2.40 3.66 3.04
Source: National Bureau of Statistics1/ Revised
2/ Provisional
Activity Sector 1st Half 2015 2nd Half 2015 1st Half 2016 2nd Half 2016 1st Half 2017 2nd Half 2018 2/ 1st Half 2019 2/2nd Half 2017 1st Half 2018 1/Share of Total GDP (Per Cent)

Table 40
Gross Domestic Product at Current Basic Prices
(Naira Billion unless otherwise stated)
1st Half 2015 2nd Half 2015 1st Half 2016 2nd Half 2016 1st Half 2017 2nd Half 2017 1st Half 2018 1/ 2nd Half 2018 2/ 1st Half 2019 2/
1. Agriculture 7,827.50 11,809.47 8,897.75 12,625.76 9,896.37 14,056.19 10,722.44 16,648.86 12,865.80 17.83 23.50 19.43 22.66 18.65 23.17 18.13 24.27 19.27
(a) Crop Production 6,652.62 10,537.35 7,601.06 11,282.02 8,499.64 12,596.46 9,241.70 14,966.10 11,121.85 15.15 20.97 16.60 20.25 16.02 20.77 15.63 21.82 16.66
(b) Livestock 821.92 926.11 902.80 972.99 962.08 1,012.36 961.73 1,086.87 1,015.61 1.87 1.84 1.97 1.75 1.81 1.67 1.63 1.58 1.52
(c) Forestry 108.16 114.67 113.28 122.98 125.22 131.99 130.03 142.76 143.84 0.25 0.23 0.25 0.22 0.24 0.22 0.22 0.21 0.22
(d) Fishing 244.80 231.34 280.61 247.78 309.42 315.38 388.98 453.13 584.50 0.56 0.46 0.61 0.44 0.58 0.52 0.66 0.66 0.88
2. Industry 7,455.57 7,618.21 6,061.42 8,311.37 9,470.47 11,055.99 13,272.62 12,831.57 13,881.07 16.98 15.16 13.24 14.92 17.85 18.23 22.44 18.71 20.79
(a) Crude Petroleum & Natural Gas 3,137.49 2,852.92 1,847.05 3,520.27 4,562.32 5,793.63 7,650.28 5,773.60 6,150.29 7.15 5.68 4.03 6.32 8.60 9.55 12.94 8.42 9.21
(b) Solid Minerals 52.68 56.91 34.45 67.77 47.05 78.97 69.01 155.78 114.37 0.12 0.11 0.08 0.12 0.09 0.13 0.12 0.23 0.17
(c) Manufacturing 4,265.40 4,708.38 4,179.91 4,723.33 4,861.09 5,183.39 5,553.33 6,902.20 7,616.41 9.72 9.37 9.13 8.48 9.16 8.55 9.39 10.06 11.41
3. Construction 1,835.19 1,637.06 1,881.22 1,725.34 2,244.43 2,037.34 2,855.29 3,175.77 4,361.48 4.18 3.26 4.11 3.10 4.23 3.36 4.83 4.63 6.53
4. Trade 8,538.49 9,490.41 9,766.09 10,909.77 10,465.20 11,108.52 10,353.22 11,565.23 10,758.67 19.45 18.89 21.33 19.58 19.72 18.31 17.51 16.86 16.11
5. Services 18,244.10 19,688.96 19,176.31 22,134.47 20,982.13 22,394.99 21,934.60 24,377.23 24,901.47 41.56 39.19 41.89 39.73 39.55 36.92 37.09 35.54 37.30
(a) Transport 614.58 746.49 716.31 857.21 822.20 965.29 1,051.30 1,277.07 1,450.75 1.40 1.49 1.56 1.54 1.55 1.59 1.78 1.86 2.17
(b) Information and Communication 5,685.01 5,096.07 5,691.91 5,787.59 6,017.28 5,700.28 6,471.17 6,508.70 8,213.68 12.95 10.14 12.43 10.39 11.34 9.40 10.94 9.49 12.30
(c) Utilities 284.54 358.00 259.47 402.36 336.77 494.90 411.26 671.82 562.79 0.65 0.71 0.57 0.72 0.63 0.82 0.70 0.98 0.84
(d) Accommodation and Food Services 424.48 469.19 426.75 498.32 446.58 537.62 484.74 659.62 612.00 0.97 0.93 0.93 0.89 0.84 0.89 0.82 0.96 0.92
(e) Finance & Insurance 1,674.24 1,586.26 1,686.93 1,906.40 1,953.33 1,882.44 2,118.55 1,878.20 2,086.43 3.81 3.16 3.68 3.42 3.68 3.10 3.58 2.74 3.12
(f) Real Estate 3,626.21 4,561.34 3,678.47 4,661.96 3,977.91 4,613.63 3,847.40 4,785.42 4,064.46 8.26 9.08 8.03 8.37 7.50 7.61 6.51 6.98 6.09
(g) Professional, Scientific & Technical Services 1,799.16 2,128.14 1,979.74 2,528.02 2,167.22 2,559.58 2,193.42 2,669.07 2,305.58 4.10 4.24 4.32 4.54 4.08 4.22 3.71 3.89 3.45
(h) Administrative and Support Services
Bussiness Services 10.46 11.79 11.55 13.97 12.63 14.40 12.54 15.05 13.22 0.02 0.02 0.03 0.03 0.02 0.02 0.02 0.02 0.02
(i) Public Administration 1,216.61 1,335.84 1,305.88 1,477.95 1,429.03 1,492.55 1,396.87 1,529.23 1,322.53 2.77 2.66 2.85 2.65 2.69 2.46 2.36 2.23 1.98
(j) Education 853.49 1,262.85 989.74 1,456.21 1,101.79 1,489.07 1,134.45 1,600.08 1,251.62 1.94 2.51 2.16 2.61 2.08 2.46 1.92 2.33 1.87
(k) Human Health & Social Services 322.11 360.58 351.50 394.08 382.00 402.80 393.76 427.93 442.38 0.73 0.72 0.77 0.71 0.72 0.66 0.67 0.62 0.66
(l) Arts, Entertainment & Recreation 109.93 100.49 126.39 112.99 143.77 117.32 146.67 122.41 163.16 0.25 0.20 0.28 0.20 0.27 0.19 0.25 0.18 0.24
(m) Other Services 1,623.27 1,671.93 1,951.68 2,037.41 2,191.62 2,125.09 2,272.47 2,232.64 2,412.86 3.70 3.33 4.26 3.66 4.13 3.50 3.84 3.25 3.61
TOTAL (GDP) 43,900.85 50,244.11 45,782.78 55,706.71 53,058.61 60,653.03 59,138.17 68,598.66 66,768.50 100.00 100.00 100.00 100.00 100.00 100.00 100.00 100.00 100.00
NON-OIL (GDP) 40,763.36 47,391.18 43,935.73 52,186.44 48,496.29 54,859.40 51,487.89 62,825.06 60,618.21 92.85 94.32 95.97 93.68 91.40 90.45 87.06 91.58 90.79
NET INDIRECT TAXES ON PRODUCTS 422.60 610.18 389.98 695.95 436.64 750.98 500.07 850.01 560.85
TOTAL GDP AT CURRENT MARKET PRICES 44,323.45 50,854.28 46,172.76 56,402.66 53,495.25 61,404.00 59,638.24 69,448.66 67,329.35
TOTAL GDP GROWTH RATE (%) 4.76 6.59 4.29 10.87 15.89 8.88 11.46 13.10 12.90
OIL GDP GROWTH RATE (%) (40.19) (34.73) (41.13) 23.39 147.01 64.58 67.68 (0.35) (19.61)
NON-OIL GDP GROWTH RATE (%) 11.20 10.81 7.78 10.12 10.38 5.12 6.17 14.52 17.73
Growth in Total GDP
Agriculture (%) 8.34 9.41 13.67 6.91 11.22 11.33 8.35 18.45 19.99
Industry (%) (21.77) (14.13) (18.70) 9.10 56.24 33.02 40.15 16.06 4.58
Construction (%) 12.92 4.70 2.51 5.39 19.31 18.08 27.22 55.88 52.75
Trade (%) 14.90 14.72 14.38 14.96 7.16 1.82 (1.07) 4.11 3.92
Services (%) 13.37 11.63 5.11 12.42 9.42 1.18 4.54 8.85 13.53
Source: National Bureau of Statistics1/ Revised
2/ Provisional
Activity Sector 1st Half 2015 2nd Half 2015 1st Half 2016 2nd Half 2016 1st Half 2017 2nd Half 2018 2/ 1st Half 2019 2/2nd Half 2017 1st Half 2018 1/Share of Total GDP (Per Cent)

181
Table 41
Selected Real Sector Indicators 1/
(Per cent, except otherwise indicated)
2015 2016 2017 2018 2019 /2
First Half First Half First Half First Half First Half
Agricultural Production Index (2010 = 100)
Aggregate 122.7 127.4 131.5 134.3 137.6
Crops 120.7 125.4 129.6 132.8 136.3
Staples 121.0 125.7 130.0 133.1 134.5
Other Crops 128.6 132.8 137.2 141.5 143.7
Livestock 134.6 141.4 144.2 141.5 142.1
Fishery 137.0 134.8 136.6 138.6 144.3
Forestry 132.9 137.0 141.5 146.4 150.3
Indices of Average World Prices of Nigeria's Major Agricultural
Export Commodities (2010 = 100) (Dollar Based)
All Commodities 100.3 86.9 79.0 78.6 74.5
Cocoa 97.8 99.4 66.6 77.7 74.7
Cotton 42.1 41.2 51.1 55.2 48.9
Coffee 68.0 62.1 64.9 54.7 49.8
Wheat 74.2 52.5 47.5 66.5 67.4
Rubber 37.1 30.8 47.9 35.8 36.4
Groundnut 132.9 121.0 122.0 88.6 86.3
Palm oil 50.0 50.3 54.2 54.4 47.0
Soya beans 65.7 65.0 65.9 77.5 66.8
Sorghum 99.5 73.5 70.6 80.2 74.6
Indices of Average World Prices of Nigeria's Major Agricultural
Export Commodities (2010 = 100) (Naira Based)
All Commodities 127.5 115.6 158.3 157.5 149.3
Cocoa 124.4 132.1 133.4 155.7 150.3
Cotton 53.5 54.8 102.4 110.6 98.4
Coffee 86.3 82.7 130.0 109.6 101.7
Wheat 94.2 69.7 95.1 133.3 135.6
Rubber 47.2 41.0 95.9 71.6 73.3
Groundnut 169.0 160.8 244.3 177.5 173.7
Palm oil 63.5 66.8 108.6 108.9 94.6
Soya beans 83.5 86.8 132.1 155.3 134.3
Sorghum 126.6 97.8 141.5 160.7 150.0
GROWTH RATE OVER THE PRECEDING PERIOD (%)
Agricultural Production Index (2010 = 100)
Aggregate 4.1 3.8 3.2 2.1 2.5
Crops 3.8 3.9 3.4 2.5 2.6
Staples 3.8 3.9 3.4 2.4 1.0
Other Crops 3.6 3.3 3.3 3.1 1.6
Livestock 6.3 5.1 2.0 -1.9 0.4
Fishery 4.2 -1.6 1.4 1.4 4.1
Forestry 6.3 3.1 3.2 3.4 2.7
Indices of Average World Prices of Nigeria's Major Agricultural
Export Commodities (2010 = 100) (Dollar Based)
All Commodities 8.6 -13.3 -9.1 -0.5 -5.3
Cocoa -0.9 1.6 -33.0 16.7 -3.8
Cotton -24.3 -2.1 24.2 7.9 -11.3
Coffee -12.5 -8.6 4.4 -15.7 -9.0
Wheat -26.5 -29.3 -9.6 40.1 1.3
Rubber -18.7 -16.9 55.3 -25.3 1.9
Groundnut 58.3 -9.0 0.8 -27.4 -2.6
Palm oil -31.7 0.6 7.9 0.2 -13.5
Soya beans -32.8 -1.0 1.4 17.5 -13.9
Sorghum 0.0 -26.1 -3.9 13.5 -7.0
Indices of Average World Prices of Nigeria's Major Agricultural
Export Commodities (2010 = 100) (Naira Based)
All Commodities 24.3 -9.4 36.9 -0.5 -5.2
Cocoa 13.6 6.2 1.0 16.7 -3.5
Cotton -13.3 2.4 86.8 8.0 -11.0
Coffee 0.1 -4.1 57.1 -15.7 -7.2
Wheat -16.0 -26.0 36.5 40.2 1.7
Rubber -6.9 -13.2 134.0 -25.3 2.3
Groundnut 81.2 -4.9 51.9 -27.3 -2.2
Palm oil -21.9 5.2 62.6 0.3 -13.1
Soya beans -23.2 4.0 52.1 17.6 -13.5
Sorghum 14.5 -22.8 44.7 13.6 -6.6
Industrial Production Index (2010 = 100)
Industrial Production Index 114.2 105.7 103.8 107.0 108.5
Manufacturing Production Index 182.8 173.7 175.5 178.5 179.7
Mining Production Index 84.7 77.1 73.2 76.1 77.9
Electricity Production Index 138.7 95.6 115.0 132.3 126.2
Capacity Utilization Rate (%) 55.5 51.7 53.1
Inflation Rate (12-Month Moving Average; End-Period) 8.4 11.4 17.6 14.4 11.3
Inflation Rate (Year-on-Year; End-Period) 9.2 16.5 16.1 11.2 11.2
Food Inflation Rate (Year-on-Year; End-Period) 10.0 15.3 19.9 13.0 13.6
Non-Food Inflation Rate (Year-on-Year; End-Period) 8.4 16.2 12.5 10.4 8.8
Source: National Bureau of Statistics, Central Bank of Nigeria and Index Mundi.
1/Revised
2/Provisional
Item

182
Table 41 cont’d
Selected Real Sector Indicators
(Per cent, except otherwise indicated)
2019 2/
First Half Second Half First Half Second Half First Half
(1) (2) (3) (3) & (1) (3) & (2) (3) & (1) (3) & (2)
World Crude Oil Production
million barrels per day (mbd)
OPEC 38.40 38.85 36.44 36.81 35.02 -1.42 -1.79 -3.90 -4.86
Crudes 32.20 32.60 31.70 32.02 30.21 -1.49 -1.81 -4.70 -5.65
NGLs and condensates 6.20 6.25 4.74 4.79 4.81 0.07 0.02 1.48 0.42
Total non-OPEC 57.60 58.15 61.37 63.35 63.72 2.35 0.37 3.83 0.58
Total World Supply 96.00 97.00 97.81 100.16 98.74 0.93 -1.42 0.95 -1.42
Demand
OECD 47.05 47.80 47.5 48.18 47.55 0.05 -0.63 0.11 -1.31
Non-OECD 49.05 50.45 50.46 51.32 51.45 0.99 0.13 1.96 0.25
Total World Demand 96.10 98.25 97.96 99.50 99.00 1.04 -0.50 1.06 -0.50
Nigeria
Output 1.63 1.82 1.90 1.85 1.85 -0.05 0.00 -2.63 0.00
Exports 1.18 1.37 1.45 1.40 1.40 -0.05 0.00 -3.45 0.00
Domestic Consumption 0.45 0.45 0.45 0.45 0.45 0.00 0.00 0.00 0.00
Average Spot Price of Selected Crude Oil
at the International Oil Market (US$)
UK Brent 51.23 57.02 70.79 71.54 66.28 -4.51 -5.26 -6.37 -7.35
West Texas Intermediate (WTI) 49.43 51.43 61.40 54.28 55.53 -5.87 1.25 -9.56 2.30
Bonny Light 52.20 57.63 71.99 73.05 67.90 -4.09 -5.15 -5.68 -7.05
Forcados 51.74 57.77 72.03 73.11 68.01 -4.02 -5.10 -5.58 -6.98
OPEC Basket 50.21 54.63 68.40 70.81 65.47 -2.93 -5.34 -4.28 -7.54
Gas Activities
(MMm3)
Gas Produced 32,472.43
Total Gas Utilised 28,009.65
Gas Utilised as % of Gas Produced 86.26
Gas Flared 4,462.79
Gas Flared as % Gas Produced 13.74
Sources: OPEC, NNPC, Reuters & CBN Estimates
1/ Revised
2/ Provisional
Item
Change
Between
Percentage
Change Between
2017 1/ 2018 1/

183
Table 42
Composite Consumer Price Index
(November 2009=100)
Monthly
Index
Inflation
y-o-y (%)
12-Month
Average
Index
Inflation
12-Month
Average (%)
Monthly
Index
Inflation
y-o-y (%)
Inflation
12-Month
Average (%)
Monthly
Index
Inflation
y-o-y (%)
Inflation
12-Month
Average (%)
2015
January 165.8 8.2 159.9 8.1 163.7 6.8 6.9 169.8 9.2 9.5
February 166.9 8.4 160.9 8.1 164.8 7.0 6.9 171.1 9.4 9.5
March 168.4 8.5 162.0 8.2 166.2 7.5 6.9 172.8 9.4 9.5
April 169.7 8.7 163.2 8.2 167.2 7.7 6.9 174.4 9.5 9.5
May 171.6 9.0 164.3 8.3 169.2 8.3 7.0 176.3 9.8 9.5
June 173.2 9.2 165.5 8.4 170.6 8.4 7.0 178.1 10.0 9.5
July 174.4 9.2 166.8 8.5 171.6 8.8 7.2 179.5 10.0 9.6
August 175.4 9.3 168.0 8.6 172.7 9.0 7.4 180.6 10.1 9.6
September 176.5 9.4 169.3 8.7 173.7 8.9 7.6 181.8 10.2 9.6
October 177.2 9.3 170.5 8.8 174.4 8.7 7.8 182.6 10.1 9.7
November 178.4 9.4 171.8 8.9 175.3 8.7 8.0 184.1 10.3 9.8
December 180.1 9.6 173.1 9.0 176.7 8.7 8.2 186.2 10.6 9.9
2016
January 181.7 9.6 174.5 9.1 178.2 8.8 8.4 187.9 10.6 10.0
February 185.9 11.4 176.0 9.4 183.0 11.0 8.7 190.5 11.3 10.2
March 189.9 12.8 177.8 9.8 186.4 12.2 9.1 194.9 12.7 10.5
April 193.0 13.7 179.8 10.2 189.5 13.4 9.6 197.4 13.2 10.8
May 198.3 15.6 182.0 10.7 194.7 15.1 10.2 202.5 14.9 11.2
June 201.7 16.5 184.4 11.4 198.3 16.2 10.9 205.4 15.3 11.7
July 204.2 17.1 186.9 12.0 200.7 16.9 11.6 207.9 15.8 12.2
August 206.3 17.6 189.4 12.7 202.4 17.2 12.2 210.3 16.4 12.7
September 208.0 17.9 192.1 13.5 204.3 17.7 13.0 212.0 16.6 13.2
October 209.7 18.3 194.8 14.2 205.9 18.1 13.8 213.8 17.1 13.8
November 211.3 18.5 197.5 15.0 207.3 18.2 14.5 215.7 17.2 14.4
December 213.6 18.5 200.3 15.7 208.6 18.1 15.3 218.6 17.4 14.9
2017
January 215.7 18.7 203.1 16.4 210.0 17.9 16.0 221.4 17.8 15.5
February 218.9 17.8 205.9 17.0 212.3 16.0 16.4 225.8 18.5 16.1
March 222.7 17.3 208.6 17.3 215.1 15.4 16.7 230.8 18.4 16.6
April 226.3 17.2 211.4 17.6 217.5 14.8 16.8 235.5 19.3 17.1
May 230.5 16.3 214.1 17.6 220.0 13.0 16.6 241.5 19.3 17.5
June 234.2 16.1 216.8 17.6 223.0 12.5 16.2 246.3 19.9 17.9
July 237.0 16.1 219.5 17.5 225.2 12.2 15.8 250.0 20.3 18.2
August 239.3 16.0 222.3 17.3 227.3 12.3 15.4 252.9 20.3 18.6
September 241.2 16.0 225.0 17.2 229.1 12.1 14.9 255.1 20.3 18.9
October 243.0 15.9 227.8 17.0 230.9 12.1 14.4 257.2 20.3 19.1
November 244.9 15.9 230.6 16.8 232.6 12.2 13.9 259.5 20.3 19.4
December 246.4 15.4 233.4 16.5 233.8 12.1 13.5 261.0 19.4 19.5
2018
January 248.4 15.1 236.1 16.2 235.4 12.1 13.0 263.3 18.9 19.6
February 250.3 14.3 238.7 15.9 237.2 11.7 12.7 265.5 17.6 19.5
March 252.4 13.3 241.2 15.6 239.2 11.2 12.3 267.9 16.1 19.3
April 254.5 12.5 243.5 15.2 241.3 10.9 12.0 270.4 14.8 18.9
May 257.3 11.6 245.7 14.8 243.6 10.7 11.8 273.9 13.4 18.4
June 260.5 11.2 247.9 14.4 246.1 10.4 11.7 278.2 13.0 17.7
July 263.4 11.1 250.1 13.9 248.1 10.2 11.5 282.2 12.8 17.1
August 266.2 11.2 252.4 13.5 250.1 10.0 11.3 286.2 13.2 16.5
September 268.4 11.3 254.6 13.2 251.7 9.8 11.1 289.0 13.3 15.9
October 270.4 11.3 256.9 12.8 253.7 9.9 10.9 291.4 13.3 15.4
November 272.6 11.3 259.2 12.4 255.4 9.8 10.7 294.0 13.3 14.8
December 274.6 11.4 261.6 12.1 256.7 9.8 10.5 296.4 13.6 14.3
2019
January 276.6 11.4 263.9 11.8 258.8 9.9 10.3 298.9 13.5 13.9
February 278.6 11.3 266.3 11.6 260.4 9.8 10.2 301.3 13.5 13.6
March 280.8 11.3 268.7 11.4 261.8 9.5 10.0 303.9 13.5 13.4
April 283.5 11.4 271.1 11.3 263.7 9.3 9.9 307.4 13.7 13.3
May 286.6 11.4 273.5 11.3 265.6 9.0 9.8 311.7 13.8 13.4
June 289.7 11.2 275.9 11.3 267.9 8.8 9.6 316.0 13.6 13.4
Source: National Bureau of Statistics (NBS)
Year
&
Month
All Item (Headline) All Items less Farm Produce (Core) Food

184
Table 43
Urban and Rural Consumer Price Index
(November 2009=100)
All Items
(Headline)
Monthly Index
Headline
Inflation
y-o-y(%)
All Items less Farm
Produce (Core)
Monthly Index
Core
Inflation
y-o-y(%)
Food
Monthly
Index
Food
Inflation
y-o-y(%)
All Items
(Headline)
Monthly Index
Headline
Inflation
y-o-y(%)
All Items less Farm
Produce (Core)
Monthly Index
Core
Inflation
y-o-y(%)
Food
Monthly
Index
Food
Inflation
y-o-y(%)
2015
January 164.7 8.2 161.2 7.0 166.9 9.6 166.9 8.09 165.8 6.6 172.7 8.9
February 165.9 8.4 162.4 7.1 168.2 9.8 168.0 8.29 166.9 6.9 173.9 9.0
March 167.4 8.6 163.7 7.6 169.9 9.8 169.5 8.40 168.3 7.3 175.6 9.0
April 168.7 8.7 164.7 7.9 171.6 9.9 170.8 8.56 169.3 7.4 177.1 9.1
May 170.6 9.1 166.8 8.6 173.5 10.3 172.6 8.90 171.2 8.0 178.9 9.4
June 172.2 9.2 168.2 8.8 175.4 10.5 174.2 9.10 172.6 8.1 180.8 9.7
July 173.3 9.2 169.2 9.0 176.7 10.4 175.5 9.24 173.7 8.7 182.2 9.8
August 174.3 9.2 170.2 9.0 177.8 10.4 176.6 9.38 174.8 9.0 183.3 9.9
September 175.5 9.5 171.3 9.2 179.2 10.6 177.5 9.30 175.7 8.7 184.3 9.8
October 176.2 9.4 172.0 8.9 180.1 10.7 178.2 9.16 176.4 8.6 185.1 9.7
November 177.4 9.4 172.8 8.8 181.5 10.8 179.4 9.26 177.4 8.7 186.5 9.9
December 179.2 9.7 174.3 8.9 183.8 11.1 181.1 9.41 178.7 8.6 188.6 10.1
2016
January 180.8 9.7 175.8 9.1 185.5 11.1 182.7 9.48 180.2 8.7 190.3 10.2
February 186.2 12.3 181.2 11.6 187.8 11.7 186.0 10.69 184.6 10.6 193.2 11.1
March 190.0 13.5 184.6 12.8 192.1 13.1 189.9 12.04 188.0 11.7 197.5 12.5
April 194.1 15.1 188.0 14.1 194.3 13.2 192.6 12.77 190.8 12.7 200.3 13.1
May 199.8 17.1 193.3 15.9 199.8 15.2 197.4 14.35 195.9 14.4 205.0 14.5
June 203.4 18.1 197.0 17.1 203.0 15.8 200.5 15.09 199.3 15.5 207.6 14.9
July 206.1 18.9 199.7 18.1 205.7 16.4 202.8 15.5 201.5 16.0 209.9 15.2
August 208.0 19.3 201.4 18.4 207.7 16.8 205.0 16.1 203.2 16.3 212.7 16.0
September 209.6 19.5 203.6 18.9 209.4 16.9 206.7 16.4 205.0 16.7 214.4 16.3
October 211.3 19.9 205.1 19.3 211.3 17.3 208.4 16.9 206.5 17.1 216.2 16.8
November 213.0 20.1 206.7 19.6 213.2 17.4 210.1 17.1 207.8 17.1 218.0 16.9
December 215.3 20.1 208.5 19.6 216.2 17.6 212.2 17.2 208.7 16.8 220.8 17.1
2017
January 217.5 20.3 210.0 19.5 219.1 18.1 214.4 17.3 210.0 16.6 223.6 17.5
February 220.8 18.6 212.7 17.4 223.6 19.0 217.5 17.0 212.1 14.9 228.0 18.0
March 224.7 18.3 215.7 16.9 228.8 19.1 221.2 16.5 214.6 14.2 232.8 17.8
April 228.3 17.6 217.9 15.9 233.6 20.2 224.7 16.7 217.1 13.8 237.4 18.5
May 232.5 16.3 220.5 14.1 239.7 19.9 229.0 16.0 219.7 12.1 243.3 18.7
June 236.2 16.2 223.7 13.6 244.6 20.5 232.6 16.0 222.4 11.5 248.0 19.4
July 239.2 16.0 225.9 13.1 248.5 20.8 235.4 16.1 224.6 11.5 251.6 19.8
August 241.5 16.1 228.1 13.2 251.5 21.1 237.6 15.9 226.6 11.5 254.3 19.6
September 243.5 16.2 230.2 13.1 253.9 21.3 239.4 15.8 228.2 11.3 256.4 19.6
October 245.5 16.2 232.1 13.2 256.2 21.3 241.1 15.7 229.8 11.3 258.4 19.5
November 247.6 16.3 234.3 13.3 258.7 21.3 242.8 15.6 231.3 11.3 260.5 19.5
December 249.3 15.8 235.8 13.1 260.3 20.4 244.1 15.0 232.2 11.3 261.9 18.6
2018
January 251.3 15.6 237.3 13.0 262.7 19.9 246.0 14.8 233.8 11.3 264.1 18.1
February 253.4 14.8 239.3 12.5 265.0 18.5 247.9 14.0 235.4 11.0 266.3 16.8
March 255.6 13.7 241.3 11.9 267.5 16.9 249.9 13.0 237.4 10.6 268.6 15.4
April 257.7 12.9 243.3 11.6 270.0 15.5 252.0 12.1 239.6 10.3 271.0 14.2
May 260.6 12.1 245.4 11.3 273.7 14.2 254.7 11.2 242.1 10.2 274.4 12.8
June 263.8 11.7 247.9 10.8 278.1 13.7 257.8 10.8 244.6 10.0 278.6 12.3
July 267.0 11.7 250.1 10.7 282.6 13.7 260.9 10.8 246.6 9.8 282.7 12.4
August 269.7 11.7 252.0 10.5 286.5 13.9 263.4 10.8 248.5 9.6 286.2 12.5
September 272.0 11.7 253.5 10.1 289.5 14.0 265.5 10.9 250.1 9.6 288.9 12.7
October 274.1 11.6 255.9 10.2 292.0 14.0 267.4 10.9 251.8 9.6 291.2 12.7
November 276.4 11.6 257.9 10.1 294.7 13.9 269.5 11.0 253.4 9.6 293.7 12.8
December 278.5 11.7 259.5 10.1 297.2 14.2 271.4 11.2 254.3 9.5 296.0 13.0
2019
January 280.6 11.7 261.4 10.2 299.8 14.2 273.4 11.1 256.5 9.7 298.3 13.0
February 282.8 11.6 263.3 10.0 302.4 14.1 275.3 11.0 258.0 9.6 300.7 12.9
March 285.0 11.5 265.1 9.9 305.2 14.1 277.4 11.0 259.1 9.1 303.2 12.9
April 287.9 11.7 267.1 9.8 309.0 14.5 279.9 11.1 260.8 8.8 306.4 13.1
May 291.2 11.8 269.3 9.7 313.7 14.6 282.9 11.1 262.5 8.4 310.4 13.1
June 294.4 11.6 271.8 9.6 318.2 14.4 285.9 10.9 264.6 8.2 314.5 12.9
Source: National Bureau of Statistics (NBS)
Year
&
Month
Urban Rural

185
Table 44
Balance of Payments Analytic Presentation
(US$ Million) 1st Half 2018 1/ 2nd Half 2018 2/ 1st Half 2019 2/
CURRENT ACCOUNT 5,774.28 -439.83 -5,677.83
Goods 11,783.06 10,553.48 3,253.02
Exports (fob) 30,235.40 32,854.84 31,274.03
Oil and Gas 27,475.07 30,920.89 27,026.19
Non-oil 2,760.33 1,933.95 4,247.84
Imports (fob) -18,452.34 -22,301.36 -28,021.01
Oil -6,038.13 -5,528.24 -4,293.84
Non-oil -12,414.21 -16,773.12 -23,727.16
Unrecorded(TPAdj) - - -
Services(net) -10,665.55 -15,400.34 -16,226.50
Credit 1,916.89 2,900.88 2,724.87
Transportation 653.29 677.68 920.27
Travel 456.54 1,505.82 1,038.23
Insurance Services 194.51 30.23 108.55
Communication Services 121.66 108.91 108.34
Construction Services 0.00 0.00 0.00
Financial Services 223.74 315.74 296.97
Computer & information Services - - -
Royalties and License Fees - - -
Government Services 235.59 231.13 228.59
Personal, cultural & recreational services - - -
Other Bussiness Services 31.55 31.37 23.92
Debit -12,582.44 -18,301.22 -18,951.37
Transportation -3,381.34 -2,969.46 -3,372.83
Travel -3,596.73 -5,972.10 -6,801.59
Insurance Services -281.05 -275.08 -352.74
Communication Services -93.75 -74.80 -75.41
Construction Services -0.29 -59.99 -7.37
Financial Services -184.53 -472.38 -148.73
Computer & information Services -115.19 -147.03 -69.50
Royalties and License Fees -126.42 -126.42 -126.42
Government Services -129.14 -129.34 -129.27
Personal, cultural & recreational services -3.91 -36.56 -46.27
Other Bussiness Services -4,670.10 -8,038.05 -7,821.24
Income(net) -7,194.70 -7,875.60 -6,177.15
Credit 967.53 1,105.31 1,282.93
Investment Income 845.61 977.85 1,153.24
Compensation of employees 121.92 127.46 129.69
Debit -8,162.22 -8,980.91 -7,460.07
Investment Income -8,158.92 -8,968.66 -7,443.68
Compensation of employees -3.30 -12.25 -16.39
Current transfers(net) 11,851.46 12,282.63 13,472.80
Credit 12,025.45 12,500.21 13,723.80
General Government 188.81 225.81 225.77
Other Sectors 11,836.64 12,274.40 13,498.03
Workers Remittance 11,792.61 12,269.04 11,792.61
Debit -173.99 -217.58 -251.00
General Government - - -
Other Sectors -173.99 -217.58 -251.00
Workers Remittance -25.53 -26.59 -22.94
CAPITAL AND FINANCIAL ACCOUNT -1,380.48 2,287.26 -7,993.57
Capital account(net) - - -
Credit - - -
Capital Transfers(Debt Forgiveness) - - -
Debit - - -
Capital Transfers - - -
Financial account(net) -1,380.48 2,287.26 -7,993.57
Assets -19,545.27 -1,405.94 -20,384.37
Direct investment (Abroad) -690.27 -690.59 -744.48
Portfolio investment -0.61 -0.12 -11.70
Other investment -11,028.47 -5,254.50 -17,474.95
Change in Reserve -7,825.93 4,539.28 -2,153.23
Liabilities 18,164.79 3,693.20 12,390.80
Direct Invesment in reporting economy 1,244.21 753.28 2,060.05
Portfolio Investment 9,375.33 3,173.23 11,606.72
Other investment liabilities 7,545.26 -233.30 -1,275.97
NET ERRORS AND OMISSIONS -4,393.80 -1,847.43 13,671.40
Memorandum Items: 1st Half 2018 1/ 2nd Half 2018 2/ 1st Half 2019 2/
Current Account Balance as % of G.D.P 2.96 -0.19 -2.58
Capital and Financial Account Balance as % of G.D.P -0.71 1.00 -3.64
Overall Balance as % of G.D.P 4.01 -2.00 0.98
External Reserves - Stock (US $ million) 47,157.90 42,594.84 44,747.02
Number of Months of Imports Equivalent 15.33 11.46 9.58
External Debt Stock (US$ million) 22,083.44 21,591.68 25,609.63
Debt Service Due as % of Exports of Goods Non Factor Services - - -
Effective Central Exchange Rate (N/$) 305.29 305.88 306.40
Average Exchange Rate (N/$) 305.79 306.38 306.90
End-Period Exchange Rate (N/$) 305.25 306.50 306.40
Source: Central Bank of Nigeria
1/ Revised2/ Provisional

186
Table 45
Balance of Payments Analytic Presentation
(N’ Million) 1st Half 2018 1/ 2nd Half 2018 2/ 1st Half 2019 2/
CURRENT ACCOUNT 1,762,752.03 -133,687.23 -1,739,692.23
Goods 3,597,142.79 3,228,872.72 996,816.93
Exports (fob) 9,230,401.71 10,049,194.20 9,582,436.07
Oil and Gas 8,387,727.30 9,457,630.07 8,280,912.35
Non-oil 842,674.41 591,564.12 1,301,523.71
Imports (fob) -5,633,258.91 -6,820,321.47 -8,585,619.14
Oil -1,843,382.47 -1,690,650.29 -1,315,644.97
Non-oil -3,789,876.44 -5,129,671.18 -7,269,974.17
Unrecorded(TPAdj) - - -
Services(net) -3,256,039.80 -4,710,754.31 -4,971,809.37
Credit 585,192.98 887,222.04 834,902.54
Transportation 199,440.11 207,291.51 281,975.54
Travel 139,370.29 460,496.06 318,100.78
Insurance Services 59,382.52 9,248.80 33,264.45
Communication Services 37,140.41 33,311.65 33,194.66
Construction Services - - -
Financial Services 68,305.91 96,585.98 90,997.24
Computer & information Services - - -
Royalties and License Fees - - -
Government Services 71,923.11 70,693.39 70,040.04
Personal, cultural & recreational services - - -
Other Bussiness Services 9,630.65 9,594.64 7,329.84
Debit -3,841,232.78 -5,597,976.35 -5,806,711.91
Transportation -1,032,288.74 -908,104.60 -1,033,439.17
Travel -1,098,016.92 -1,826,737.16 -2,083,984.92
Insurance Services -85,801.60 -84,131.00 -108,079.51
Communication Services -28,619.25 -22,877.80 -23,105.16
Construction Services -88.54 -18,363.17 -2,258.56
Financial Services -56,333.54 -144,542.37 -45,573.11
Computer & information Services -35,164.04 -44,949.09 -21,295.49
Royalties and License Fees -38,594.17 -38,667.09 -38,735.15
Government Services -39,424.92 -39,559.72 -39,609.16
Personal, cultural & recreational services -1,193.43 -11,176.00 -14,179.58
Other Bussiness Services -1,425,707.63 -2,458,868.35 -2,396,452.10
Income(net) -2,196,425.31 -2,408,706.46 -1,892,685.87
Credit 295,371.01 338,084.68 393,092.33
Investment Income 258,152.12 299,100.27 353,356.58
Compensation of employees 37,218.89 38,984.41 39,735.75
Debit -2,491,796.32 -2,746,791.14 -2,285,778.20
Investment Income -2,490,787.64 -2,743,041.03 -2,280,754.93
Compensation of employees -1,008.69 -3,750.11 -5,023.27
Current transfers(net) 3,618,074.35 3,756,900.82 4,127,986.09
Credit 3,671,191.30 3,823,435.24 4,204,893.48
General Government 57,639.54 69,067.49 69,175.17
Other Sectors 3,613,551.76 3,754,367.76 4,135,718.31
Workers Remittance 3,600,109.55 3,752,729.84 3,613,264.18
Debit -53,116.95 -66,534.42 -76,907.39
General Government - - -
Other Sectors -53,116.95 -66,534.42 -76,907.39
Workers Remittance -7,794.63 -8,132.90 -7,028.57
CAPITAL AND FINANCIAL ACCOUNT -421,434.13 697,381.45 -2,449,159.48
Capital account(net) - - -
Credit - - -
Capital Transfers(Debt Forgiveness) - - -
Debit - - -
Capital Transfers - - -
Financial account(net) -421,434.13 697,381.45 -2,449,159.48
Assets -5,967,037.33 -433,037.60 -6,245,544.13
Direct investment (Abroad) -210,727.97 -211,226.20 -228,111.10
Portfolio investment -186.60 -36.60 -3,585.89
Other investment -3,366,864.67 -1,608,723.51 -5,354,215.10
Change in Reserve -2,389,258.08 1,386,948.71 -659,632.04
Liabilities 5,545,603.20 1,130,419.05 3,796,384.66
Direct Invesment in reporting economy 379,844.51 230,359.74 631,187.10
Portfolio Investment 2,862,166.04 970,440.73 3,556,162.39
Other investment liabilities 2,303,592.66 -70,381.42 -390,964.83
NET ERRORS AND OMISSIONS -1,341,317.91 -563,694.22 4,188,851.70
Memorandum Items: 1st Half 2018 1/ 2nd Half 2018 2/ 1st Half 2019 2/
Current Account Balance as % of G.D.P 2.96 -0.19 -2.58
Capital and Financial Account Balance as % of G.D.P -0.71 1.00 -3.64
Overall Balance as % of G.D.P 4.01 -2.00 0.98
External Reserves - Stock (US $ million) 47,157.90 42,594.84 44,747.02
Number of Months of Imports Equivalent 15.33 11.46 9.58
External Debt Stock (US$ million) 22,083.44 21,591.68 25,609.63
Debt Service Due as % of Exports of Goods Non Factor Services - - -
Effective Central Exchange Rate (N/$) 305.29 305.88 306.40
Average Exchange Rate (N/$) 305.79 306.38 306.90
End-Period Exchange Rate (N/$) 305.25 306.50 306.40
Source: Central Bank of Nigeria
1/ Revised2/ Provisional

187
Table 46
Foreign Exchange Flows Through the Economy
(US$ Million) 1st Half 1st Half 1st Half 1st Half 2nd Half 1st Half
CATEGORY 2015 2016 2017 2018 /2 2018 /3 2019 /3
INFLOW 52,124.57 29,154.54 34,781.07 65,042.93 57,921.50 68,971.57
A. Through the Central Bank 15,283.04 8,713.12 15,835.15 30,511.67 28,910.42 30,819.73
1. Oil 9,237.67 4,613.69 4,299.49 7,102.33 8,125.22 7,964.80
2.Non-oil 6,045.36 4,099.43 11,535.66 23,409.34 20,785.20 22,854.93
(i) Drawings on Loans/Grants - - - - - -
(ii) RDAS/WDAS Purchases 645.04 30.00 1,163.81 7,161.60 1,613.87 9,276.50
(iii) Swaps 4,060.00 1,850.00 1,567.00 3,328.89 3,002.95 1,725.00
(iv) Interest on Reserves & Investments 70.41 120.19 102.97 310.94 443.99 572.12
(v) Interest Repatriated from Overseas 0.24 0.15 - - - -
(vi) Refund on World Bank/IBRD/IMF Loans/SDR Allocation - - - - - -
(vii) Cash Swap IRO BDC Sales - 10.00 1,548.29 3,947.76 4,720.10
(vii) Eurobond Proceeds - Fixed Income Securities 1.34 0.00 - - - -
(viii) Returned Payments [Wired/Cash] 10.56 194.71 753.67 910.21 591.28 642.50
(ix) Unutilised funds from DAS 94.00 49.97 644.73 1,029.53 1,030.52 1,125.30
(x) Recovered Funds - - - - -
(xi) Other Official Receipts 1,163.78 1,854.40 864.88 1,616.68 1,991.99 2,124.32
(xii) CBN Interbank Transactions - - - - -
(xiiii) Return of Unutilised IMTO Funds - 310.09 810.28 713.53 703.93
(xv) TSA and Third Party Funds 1,498.09 4,192.93 4,580.96 1,965.16
(xvi) Others (FGN Loans) 4,620.42 2,500.00 2,868.35 -
B. Through Autonomous Sources 36,841.53 20,441.42 18,945.92 34,531.26 29,011.08 38,151.84
1. Non-Oil Exports 2,431.21 1,592.34 1,910.83 1,395.41 840.55 702.00
2. Capital Inflow 41.17 58.78 33.80 21.65 19.63 100.49
3. Invisibles 34,369.15 18,790.30 17,001.29 33,114.21 28,150.91 37,349.35
(a) Ordinary Domiciliary Accounts 11,959.46 9,994.31 9,554.10 9,575.93 7,998.14
(b) Total OTC Purchases 6,830.83 7,006.99 23,560.11 18,574.97 29,351.21
(i) Oil Companies 3,328.12 897.39 42.42 2,084.31 726.64
(ii) Capital Importations 1,738.94 2,817.11 11,696.02 5,512.89 15,585.21
(iii) Home Remittances 152.73 389.50 912.09 825.42 2,231.79
(iv) Other OTC Purchases 1,611.04 2,902.98 10,909.58 10,152.35 10,807.58
OUTFLOW 21,837.26 11,880.58 13,879.61 24,929.42 35,985.95 30,759.51
A. Through the Central Bank 21,070.35 10,742.85 12,775.68 22,942.34 33,388.79 28,846.76
1. RDAS/Forex Intervention & Utilisation 18,273.40 7,805.33 9,835.84 15,472.02 22,669.50 18,037.93
(i) RDAS Sales 3,184.55 - -
(ii) RDAS Forward/Inter-Bank FWD 1,339.82 - 4,426.20 6,774.11 6,126.62 1,473.78
(iii) BDC Sales 1,825.41 15.49 1,198.98 3,166.47 5,660.34 6,861.69
(iv) Inter-bank Sales 9,673.62 5,599.84 4,011.98 3,202.48 2,700.68 805.34
(v) Swaps 2,250.00 2,190.00 198.68 2,328.96 2,251.64 2,068.10
(vi) Importer & Exporter FX Sales - - - - 5,930.23 1,076.48
(vii) SMIS - - 3,215.30
(viii) Wholesale Forward Intervention - - 1,907.24
(iX) SME - - 629.99
2. Drawings on L/C 142.62 57.13 184.66 187.59 223.48 394.54
3. External Debt Service 207.16 166.11 189.83 405.66 1,044.47 624.21
(i) Principal 90.99 84.45 - - - -
(ii) Interest - - - - - -
(iii) Others 1/ 116.17 81.67 189.83 405.66 1,044.47 624.21
4. Professional Fees/Commission - - - - - -
5. Govt and Int'l Grants / Contributions, Grants & Equity Investments
(AFC Equity Participation) - - 29.99 - - -
6. National Independent Priority Projects (Niger-Delta Payments) 91.00 21.58 0.61 12.92 0.16 0.55
7. Forex Special Payment (NSA) (Cash Swap/FX Advance/To MDAs) - 57.48 209.42 53.88 75.42
8. Other Official Payments 1,847.36 1,699.91 1,473.57 4,131.80 5,986.28 7,475.96
(i) Int'l Organisations & Embassies /4 290.44 118.19 - - - -
(ii) Estacode 522.96 38.56 29.55 135.70 45.73 25.63
(iii) Parastatals (Public Sector Uses) 120.20 278.77 581.35 2,617.17 4,614.56 5,387.57
(iv) NNPC/JVC (JVC) Cash Calls 892.52 1,155.09 862.67 1,378.93 1,325.99 2,062.76
(v) Miscellaneous (CBN Uses) 21.24 109.30 - - - -
9. Bank Charges 0.04 0.09 4.72 10.39 23.78 1.75
10. NSIA Transfer - - - - - -
11. Funds Returned to Remitters 45.96 10.04 23.38 252.38 156.97 6.77
12. 3rd Party MDA Transfer 462.79 982.65 975.60 2,260.15 3,230.27 2,229.64
B. Through Autonomous Sources 766.92 1,137.74 1,103.93 1,987.09 2,597.16 1,912.75
1. Imports 385.05 326.18 319.12 200.69 733.28 585.71
2. Invisibles 381.87 811.56 784.81 1,786.40 1,863.88 1,327.04
NETFLOW THROUGH THE CBN (5,787.31) (2,029.72) 3,059.47 7,569.33 (4,478.37) 1,972.97
NETFLOW 30,287.31 17,273.96 20,901.46 40,113.51 21,935.55 38,212.06
Source: Central Bank of Nigeria
1/ Includes penalty and service charges
2/ Revised
3/ Provisional
4/ Includes IMF (SDR charges)

Table 47
Nigeria’s Gross External Reserves
(US$ Million)
Month 2015 2016 2017 2018 2019
January 32,385.71 27,607.85 28,592.98 41,150.28 42,515.66
February 29,566.99 27,811.82 29,990.36 45,276.58 42,328.96
March 29,357.21 27,336.38 29,996.38 46,730.54 44,793.08
April 29,829.75 26,614.81 30,749.28 47,438.22 44,474.29
May 28,566.54 26,594.39 29,811.85 46,923.01 44,898.42
June 28,335.21 26,505.50 30,340.96 47,157.90 44,747.02
July 31,222.81 25,581.58 30,898.96 45,814.20
August 30,637.17 25,031.93 31,278.95 44,606.79
September 29,880.21 23,806.51 33,159.73 42,608.95
October 30,336.36 23,689.87 34,332.58 40,651.23
November 29,263.02 25,081.22 38,207.96 43,348.25
December 28,284.82 26,990.58 39,353.49 42,594.84
Source: Central Bank of Nigeria

189
Table 48
Nigeria’s Foreign Exchange Cross Rates
Naira per Unit of Foreign Currency (Monthly Average) 2015 Pounds Euro CFAFr US$ (RDAS/IFEM) US$ (BDC)
Jan 254.39 194.85 0.30 169.68 196.13
Feb 274.79 204.78 0.31 178.54 213.03
Mar 295.20 213.64 0.32 197.07 222.93
Apr 294.73 212.54 0.32 197.00 210.70
May 304.79 219.85 0.34 197.00 219.55
Jun 306.37 220.74 0.34 196.92 218.98
1st Half Average 288.38 211.07 0.32 189.37 213.55
Jul 306.41 216.87 0.33 196.97 237.15
Aug 307.21 219.33 0.33 197.00 216.64
Sep 302.55 221.22 0.34 197.00 222.68
Oct 302.26 221.45 0.34 196.99 224.98
Nov 299.38 211.53 0.32 196.99 232.40
Dec 295.39 214.00 0.32 196.99 258.30
2nd Half Average 302.20 217.40 0.33 196.99 232.02
2016 Pounds Euro CFAFr US$ (IFEM) US$ (BDC)
Jan 283.62 214.09 0.33 197.00 289.78
Feb 281.79 218.55 0.33 197.00 329.83
Mar 280.40 218.89 0.33 197.00 320.93
Apr 282.07 223.46 0.34 197.00 320.71
May 286.33 222.85 0.34 197.00 336.93
Jun 328.53 260.03 0.38 231.76 351.82
1st Half Average 290.46 226.31 0.34 202.79 325.00
Jul 388.37 325.90 0.49 294.57 364.47
Aug 406.13 347.33 0.53 309.73 396.15
Sep 401.08 342.17 0.52 305.23 431.10
Oct 375.71 336.21 0.51 305.21 462.03
Nov 379.49 329.83 0.50 305.18 415.36
Dec 381.39 322.13 0.47 305.22 455.26
2nd Half Average 388.70 333.93 0.50 304.19 420.73
2017 Pounds Euro CFAFr US$ (IFEM) US$ (BDC)
Jan 376.32 324.37 0.49 305.20 493.29
Feb 381.17 324.95 0.50 305.31 494.70
Mar 378.13 327.35 0.50 306.40 429.48
Apr 386.92 328.15 0.50 306.05 392.89
May 395.04 337.72 0.51 305.54 384.48
Jun 391.57 343.24 0.52 305.72 366.25
1st Half Average 384.86 330.96 0.50 305.70 426.85
Jul 397.36 352.13 0.54 305.86 365.38
Aug 396.08 360.93 0.55 305.67 365.57
Sep 408.57 364.53 0.56 305.89 365.55
Oct 403.25 359.34 0.55 305.62 362.21
Nov 404.45 359.07 0.54 305.90 362.41
Dec 410.48 362.36 0.55 306.31 362.83
2nd Half Average 403.37 359.73 0.55 305.88 363.99
2018 Pounds Euro CFAFr US$ (IFEM) US$ (BDC)
Jan 422.35 373.00 0.57 305.78 363.20
Feb 427.40 377.84 0.58 305.90 362.48
Mar 427.26 377.19 0.57 305.74 362.07
Apr 428.38 374.22 0.57 305.61 362.25
May 412.23 361.67 0.55 305.83 362.86
Jun 406.64 357.48 0.54 305.87 360.66
1st Half Average 420.71 370.23 0.56 305.79 362.25
Jul 402.76 357.40 0.54 305.81 359.36
Aug 394.24 353.54 0.54 306.06 359.00
Sep 399.86 357.14 0.54 306.27 359.25
Oct 398.86 351.87 0.54 306.51 360.81
Nov 395.87 348.61 0.53 306.71 362.82
Dec 389.40 349.53 0.53 306.92 363.46
2nd Half Average 396.83 353.02 0.54 306.38 360.78
2019 Pounds Euro CFAFr US$ (IFEM) US$ (BDC)
Jan 395.53 350.45 0.53 306.85 360.94
Feb 399.02 348.31 0.53 306.77 359.76
Mar 404.28 347.06 0.53 306.92 359.24
Apr 400.18 344.95 0.53 306.96 359.00
May 393.98 343.34 0.52 306.95 359.75
Jun 388.93 346.91 0.53 306.95 359.94
1st Half Average 396.99 346.84 0.53 306.90 359.77
Source: Central Bank of Nigeria
Note: The Interbank exchange rate became the reference official rate on February 18, 2015 when the RDAS segment of the FOREX market was closed by the CBN.

190
Table 49
Monthly Average Exchange Rate Movements
(N/US$ 1.00)
2015 RDAS Interbank BDC
Jan 169.68 181.78 196.13
Feb 169.68 194.48 213.03
Mar Closed 197.07 222.93
Apr Closed 197.00 210.70
May Closed 197.00 219.55
Jun Closed 196.92 218.98
1st Half Closed 194.04 213.55
End-Period Closed 196.95 225.50
Jul Closed 196.97 237.15
Aug Closed 197.00 216.64
Sep Closed 197.00 222.68
Oct Closed 196.99 224.98
Nov Closed 196.99 232.40
Dec Closed 196.99 258.30
2nd Half Closed 196.99 232.02
End-Period Closed 197.00 267.00
2016 RDAS Interbank BDC
Jan Closed 197.00 289.78
Feb Closed 197.00 329.83
Mar Closed 197.00 320.93
Apr Closed 197.00 320.71
May Closed 197.00 336.93
Jun Closed 231.76 351.82
1st Half Closed 202.79 325.00
End-Period Closed 283.00 348.00
Jul Closed 294.57 364.47
Aug Closed 309.73 396.15
Sep Closed 305.23 431.10
Oct Closed 305.21 462.03
Nov Closed 305.18 415.36
Dec Closed 305.22 455.26
2nd Half Closed 304.19 420.73
End-Period Closed 305.00 490.00
2017 RDAS Interbank BDC
Jan Closed 305.20 493.29
Feb Closed 305.31 494.70
Mar Closed 306.40 429.48
Apr Closed 306.05 392.89
May Closed 305.54 384.48
Jun Closed 305.72 366.25
1st Half Closed 305.70 426.85
End-Period Closed 305.90 366.00
Jul Closed 305.86 365.38
Aug Closed 305.67 365.57
Sep Closed 305.89 365.55
Oct Closed 305.62 362.21
Nov Closed 305.90 362.41
Dec Closed 306.31 362.83
2nd Half Closed 305.88 363.99
End-Period Closed 306.00 363.00
2018 RDAS Interbank BDC
Jan Closed 305.78 363.20
Feb Closed 305.90 362.48
Mar Closed 305.74 362.07
Apr Closed 305.61 362.25
May Closed 305.83 362.86
Jun Closed 305.87 360.66
1st Half Closed 305.79 362.25
End-Period Closed 305.75 360.50
Jul Closed 305.81 359.36
Aug Closed 306.06 359.00
Sep Closed 306.27 359.25
Oct Closed 306.51 360.81
Nov Closed 306.71 362.82
Dec Closed 306.92 363.46
2nd Half Closed 306.38 360.78
End-Period Closed 307.00 361.00
2019 RDAS Interbank BDC
Jan Closed 306.85 360.94
Feb Closed 306.77 359.76
Mar Closed 306.92 359.24
Apr Closed 306.96 359.00
May Closed 306.95 359.75
Jun Closed 306.95 359.94
1st Half Closed 306.90 359.77
End-Period Closed 306.90 360.00
Source: Central Bank of Nigeria
CBN closed the RDAS segment of the FOREX market on February 18, 2015.

Table 50
Supply of Foreign Exchange
(US$ Million)
Year/Month
January 417.20 301.95 495.24 925.92 1,110.93 117.31 2,025.43 807.07 262.65 1,296.59 483.89 679.60 1,441.67 - 76.50 3,561.30
February 345.90 209.58 405.13 891.36 1,161.11 55.16 1,830.98 564.75 101.40 1,138.54 1,174.36 1,368.21 32.11 313.27 588.16 3,347.85
March 412.00 170.70 452.38 888.93 1,040.96 370.71 2,034.75 563.06 135.04 1,187.80 978.07 596.72 - 388.60 1,059.38 3,748.89
April 533.86 202.66 515.76 842.09 1,313.76 170.83 2,203.01 620.67 95.90 986.60 957.52 623.35 - 381.90 10.80 2,432.73
May 634.19 1,302.70 499.29 758.54 1,223.46 515.55 3,541.01 610.73 127.12 1,212.68 665.11 844.32 - 417.11 46.40 2,468.42
June 1,152.50 1,014.88 798.67 1,004.25 923.89 1,099.40 3,836.84 567.68 83.23 1,039.48 662.82 513.09 - 406.35 286.84 2,478.73
First Half 3,495.64 3,202.48 3,166.47 5,311.10 6,774.11 2,328.96 15,472.02 3,733.95 805.34 6,861.69 4,921.78 4,625.29 1,473.78 1,907.24 2,068.10 18,037.92
July 1,292.28 1,102.07 893.28 874.60 966.38 1,060.88 4,022.61
August 2,050.39 603.27 797.04 806.80 1,163.25 304.16 2,867.72
September 2,509.55 250.12 828.20 802.15 859.33 33.35 1,971.00
October 1,590.46 289.62 968.62 1,018.08 1,121.19 24.93 2,404.35
November 1,250.21 263.33 995.71 1,420.28 1,010.76 67.40 2,337.20
December 1,729.03 192.27 1,177.49 821.52 1,005.70 760.93 3,136.38
Second Half 10,421.92 2,700.68 5,660.34 5,743.42 6,126.62 2,251.64 16,739.27
Source: Central Bank of NigeriaTotal supply comprises all cash-backed spot and forward sales at the different FOREX market segments, wholesale forward and swaps.
CBN closed the RDAS segment of the FOREX market on February 18, 2015.
Total
Supply
Interbank Sales
(Cash-Backed)
Sales to
BDCs
Interbank
Forward
Sales (Cash-
Backed)
Swaps
Interbank
Forward
Sales (Cash-
Backed)
Swaps
Interbank
Sales
(Auction)
Total
Supply
First Half 2019
Interbank Sales
(Auction) Including
Spot, Invisible, SME
and I&E.
2018
Sales to
BDCs
Interbank
Forward
Sales
(Auction)
Interbank
Sales (Cash-
Backed)
Interbank
Forward
Sales
(Auction)
Invisible,
SME and I&E
(Cash-
Backed)
Wholesale
Forward

Table 51
Sectoral Utilization of Foreign Exchange
(US Dollar)
A. Imports 15,215,575,071.71 8,852,611,269.25 7,364,998,409.50 7,592,888,839.72 8,280,131,109.28 7,039,853,146.43
Industrial Sector 4,493,151,505.19 2,946,712,931.16 3,266,078,241.66 3,323,954,022.71 3,915,769,945.31 3,139,302,633.82
Food Products 2,388,706,799.43 1,003,229,417.58 635,679,458.20 1,059,535,106.86 1,245,648,429.31 1,018,251,139.32
Manufactured Products 2,345,876,977.09 1,542,644,777.06 1,037,599,371.48 1,865,029,181.65 1,656,774,564.79 1,488,983,746.55
Transport Sector 551,500,023.46 257,479,536.32 202,690,647.57 250,742,192.84 219,381,568.51 293,963,929.31
Agricultural Sector 134,476,199.54 101,522,957.10 119,692,811.00 130,066,818.52 156,768,254.63 114,976,977.61
Minerals 272,719,634.74 43,160,449.27 43,125,418.58 66,892,514.57 91,519,915.06 153,458,244.79
Oil Sector 5,029,143,932.26 2,957,861,200.76 2,060,132,461.01 896,669,002.57 994,268,431.67 830,916,475.03
B. Invisibles 10,527,665,789.29 4,256,388,912.77 4,695,483,165.42 10,048,463,297.27 14,888,023,767.93 11,359,418,643.12
Business Services 848,445,662.91 283,899,866.62 558,819,878.91 993,332,583.66 2,370,775,244.80 902,582,176.35
Communication Services 349,419,890.87 63,726,178.74 139,275,231.58 89,503,224.42 117,664,396.48 138,547,161.80
Construction and Engineering 49,253,638.79 257,282.43 - 291,455.44 390,560.00 7,371,547.48
Distribution Services 29,288,273.16 11,933,333.38 4,916,699.05 7,907,612.12 4,113,092.63 23,723,409.37
Educational Services 244,053,566.86 316,150,957.37 235,831,630.79 288,772,761.38 258,004,595.30 90,961,393.76
Environmental Services - - - 0.00 6,166.20 24,677.80
Financial Services 8,257,543,710.34 3,264,410,451.02 3,122,109,272.19 7,832,799,309.30 11,375,613,510.80 9,661,733,358.51
Health Related and Social Services 858,801.93 3,287,760.74 1,553,904.69 942,172.46 269,621.40 268,210.50
Tourism and Travel Related Services 131,694,368.56 9,187,235.78 39,394,273.87 3,908,888.48 36,526,293.38 45,642,669.39
Recreational, Cultural and Sporting Services - 12,758.55 - 0.00 20,000.00 600,000.00
Transport Services 451,772,572.86 241,964,311.63 274,136,611.37 713,040,276.03 428,853,334.69 411,894,209.86
Other Services not Included Elsewhere 165,375,303.01 61,558,776.51 319,445,662.97 117,965,013.98 295,786,952.25 76,069,828.30
TOTAL (A+B) 25,743,210,861.00 13,109,000,182.02 12,060,481,574.92 17,641,352,136.99 23,168,154,877.21 18,399,271,789.55
Source: Central Bank of Nigeria
1/ Provisional
1st Half 2016SECTORS 1st Half 2015 1st Half 2017 1st Half 2019 1/2nd Half 20181st Half 2018 1/

1
Table 52
Total External Assets of Financial Institutions
(Naira Million)
End-June 2015 End-June 2016 End-June 2017 End-June 2018 End-December 2018 End-June 2019 1/
1. Monetary Authorities 7,646,654.46 8,022,108.88 9,449,922.16 18,204,739.37 18,182,232.15 17,658,803.81
Foreign Assets 7,646,654.46 8,022,108.88 9,449,922.16 18,204,739.37 18,182,232.15 17,658,803.81
Gold 19.01 19.01 19.01 19.01 19.01 19.01
IMF Reserve Tranche 22.62 22.62 22.62 22.62 22.62 22.62
Foreign Currencies 50,119.83 80,286.35 152,856.43 316,146.16 131,940.87 75,515.69
Demand Deposits at Foreign Banks 7,132,975.63 7,348,315.40 6,390,693.98 14,344,501.76 14,210,073.64 13,267,507.44
of which: Domicilliary Accounts 216,467.10 1,934,552.48 2,079,248.89 3,306,474.42 4,232,411.64 3,398,210.83
Securities of Foreign Governments 702.76 828.21 2,205,283.74 2,874,408.07 3,091,125.44 3,456,181.24
SDR Holdings 462,814.61 592,637.30 631,681.32 650,823.78 639,069.95 743,882.83
Foreign Equity - 744.55 744.55 744.55 744.55
FX Swap/Forward/Futures 68,620.51 18,073.42 109,236.06 114,930.43
Regional Monetary Cooperation Funds
Other Foreign Assets
2. Semi Official Institutions - - - - - -
i) BOI - - - - - -
ii) Others - - - - - -
3. Deposit Money Banks 1,748,403.66 2,379,967.15 2,447,082.43 2,970,213.50 2,986,601.56 4,014,049.37
Total Assets 9,395,058.12 10,402,076.02 11,897,004.59 21,174,952.87 21,168,833.71 21,672,853.18
Total Assets (US$' Million) 47,702.76 36,756.45 38,891.81 69,255.77 68,953.86 70,618.62
Exchange Rate (End-period) 196.95 283.00 305.90 305.75 307.00 306.90
Source: Central Bank of Nigeria
1/ Provisional