Center for Turbulence Research Annual Research Briefs … · ow in a three-dimensional di user:...
10
Center for Turbulence Research Annual Research Briefs 2006 31 Separated flow in a three-dimensional diffuser: preliminary validation By E. M. Cherry, G. Iaccarino, C. J. Elkins AND J. K. Eaton 1. Motivation and objectives In gas turbine engines, the final stage of air compression occurs within the annular diffuser just upstream of the combustor. This component must satisfy conflicting goals of recovering kinetic energy exiting the compressor while supplying reasonably uniform flow and consistent mass splits into the various sections of the combustor. The key challenge in designing the diffuser is to make it as short as possible while avoiding any possibility of massive flow separation. Pressure losses due to the separated flow reduce engine per- formance while unsteadiness and recirculating flow associated with separation can cause catastrophic engine failure. An optimal design probably operates very near separation for some part of the engine’s operating envelope. Accurate design analysis tools are needed to find the optimum and to avoid unexpected failures during prototype testing. Previous experimental investigations (Obi et al. 1993; Buice & Eaton 2000) considered a planar geometry and provided a large amount of measurements both in terms of mean velocity and turbulent quantities. In order to guarantee the two-dimensionality of the flow, a very high aspect ratio duct was considered. Durbin (1995) and Iaccarino (2001) performed Reynolds-Averaged Navier-Stokes (RANS) simulations of the diffuser and con- cluded that good overall agreement with the experiments was obtained using the V2F turbulence model; discrepancies were observed in the recovery region (after the flow reat- tachment). Additional numerical studies carried out using Large-Eddy Simulations (LES) were conducted by Kalthenbach et al. (1999) and later by Wu et al. (2006); the agreement was again satisfactory although in the region downstream of the separation proved to be the most difficult to reproduce numerically. It was hypothesized that the flow in this region is characterized by long-time unsteadiness and potential flow three-dimensionality. The difficulty in exactly defining the flow conditions in the direction perpendicular to the diffuser plane might prevent reproduction of the experimental configuration in the simulations. The objective of the present work is to complement the above mentioned study by per- forming experiments and simulations of a truly 3-D diffuser with simple and well-specified boundary conditions. The experimental setup is designed to provide a challenging test case for numerical models: it involves a well-defined 3-D recirculation region, and a con- siderable amount of data are collected at realistic Reynolds numbers. In addition, the effect of a small change in the expansion ratio is used to evaluate the ability of the numerical methods to predict trends and sensitivity to the geometry. Current measure- ments are obtained using Magnetic Resonance Velocimetry (MRV) (Elkins et al. 2003). Simulations are based on a novel unstructured-grid method developed for high-fidelity LES (Mahesh et al. 2004; Ham & Iaccarino 2004). Predictions using RANS turbulence models are also considered to identify the limitations of conventional turbulence models. An additional objective of this work is to develop a procedure to objectively validate the numerical predictions in a case where detailed volumetric measurements exist. In
Transcript of Center for Turbulence Research Annual Research Briefs … · ow in a three-dimensional di user:...

Center for Turbulence ResearchAnnual Research Briefs 2006
31
Separated flow in a three-dimensional diffuser:preliminary validation
By E. M. Cherry, G. Iaccarino, C. J. Elkins AND J. K. Eaton
1. Motivation and objectives
In gas turbine engines, the final stage of air compression occurs within the annulardiffuser just upstream of the combustor. This component must satisfy conflicting goals ofrecovering kinetic energy exiting the compressor while supplying reasonably uniform flowand consistent mass splits into the various sections of the combustor. The key challengein designing the diffuser is to make it as short as possible while avoiding any possibilityof massive flow separation. Pressure losses due to the separated flow reduce engine per-formance while unsteadiness and recirculating flow associated with separation can causecatastrophic engine failure. An optimal design probably operates very near separation forsome part of the engine’s operating envelope. Accurate design analysis tools are neededto find the optimum and to avoid unexpected failures during prototype testing.
Previous experimental investigations (Obi et al. 1993; Buice & Eaton 2000) considereda planar geometry and provided a large amount of measurements both in terms of meanvelocity and turbulent quantities. In order to guarantee the two-dimensionality of theflow, a very high aspect ratio duct was considered. Durbin (1995) and Iaccarino (2001)performed Reynolds-Averaged Navier-Stokes (RANS) simulations of the diffuser and con-cluded that good overall agreement with the experiments was obtained using the V2Fturbulence model; discrepancies were observed in the recovery region (after the flow reat-tachment). Additional numerical studies carried out using Large-Eddy Simulations (LES)were conducted by Kalthenbach et al. (1999) and later by Wu et al. (2006); the agreementwas again satisfactory although in the region downstream of the separation proved tobe the most difficult to reproduce numerically. It was hypothesized that the flow in thisregion is characterized by long-time unsteadiness and potential flow three-dimensionality.The difficulty in exactly defining the flow conditions in the direction perpendicular tothe diffuser plane might prevent reproduction of the experimental configuration in thesimulations.
The objective of the present work is to complement the above mentioned study by per-forming experiments and simulations of a truly 3-D diffuser with simple and well-specifiedboundary conditions. The experimental setup is designed to provide a challenging testcase for numerical models: it involves a well-defined 3-D recirculation region, and a con-siderable amount of data are collected at realistic Reynolds numbers. In addition, theeffect of a small change in the expansion ratio is used to evaluate the ability of thenumerical methods to predict trends and sensitivity to the geometry. Current measure-ments are obtained using Magnetic Resonance Velocimetry (MRV) (Elkins et al. 2003).Simulations are based on a novel unstructured-grid method developed for high-fidelityLES (Mahesh et al. 2004; Ham & Iaccarino 2004). Predictions using RANS turbulencemodels are also considered to identify the limitations of conventional turbulence models.
An additional objective of this work is to develop a procedure to objectively validatethe numerical predictions in a case where detailed volumetric measurements exist. In
32 E. M. Cherry et al.
Figure 1. Sketch of the experimental setup.
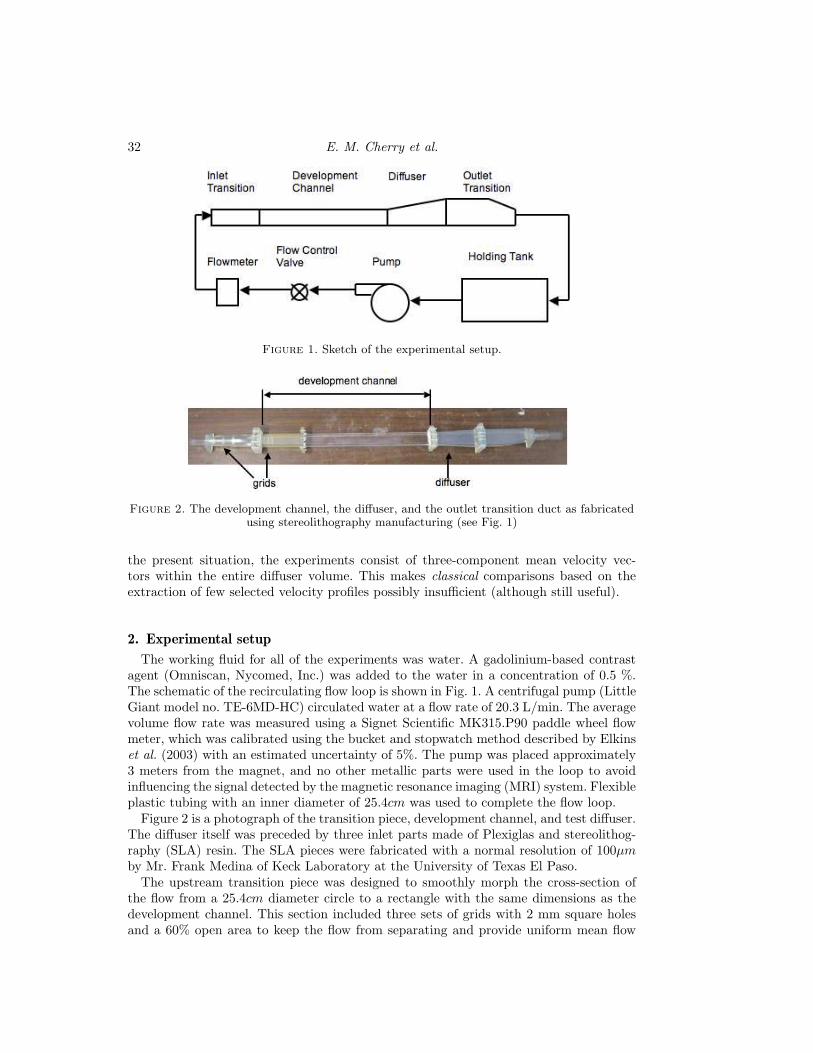
Figure 2. The development channel, the diffuser, and the outlet transition duct as fabricatedusing stereolithography manufacturing (see Fig. 1)
the present situation, the experiments consist of three-component mean velocity vec-tors within the entire diffuser volume. This makes classical comparisons based on theextraction of few selected velocity profiles possibly insufficient (although still useful).
2. Experimental setup
The working fluid for all of the experiments was water. A gadolinium-based contrastagent (Omniscan, Nycomed, Inc.) was added to the water in a concentration of 0.5 %.The schematic of the recirculating flow loop is shown in Fig. 1. A centrifugal pump (LittleGiant model no. TE-6MD-HC) circulated water at a flow rate of 20.3 L/min. The averagevolume flow rate was measured using a Signet Scientific MK315.P90 paddle wheel flowmeter, which was calibrated using the bucket and stopwatch method described by Elkinset al. (2003) with an estimated uncertainty of 5%. The pump was placed approximately3 meters from the magnet, and no other metallic parts were used in the loop to avoidinfluencing the signal detected by the magnetic resonance imaging (MRI) system. Flexibleplastic tubing with an inner diameter of 25.4cm was used to complete the flow loop.
Figure 2 is a photograph of the transition piece, development channel, and test diffuser.The diffuser itself was preceded by three inlet parts made of Plexiglas and stereolithog-raphy (SLA) resin. The SLA pieces were fabricated with a normal resolution of 100µmby Mr. Frank Medina of Keck Laboratory at the University of Texas El Paso.
The upstream transition piece was designed to smoothly morph the cross-section ofthe flow from a 25.4cm diameter circle to a rectangle with the same dimensions as thedevelopment channel. This section included three sets of grids with 2 mm square holesand a 60% open area to keep the flow from separating and provide uniform mean flow

3D separated flow 33
Figure 3. Geometrical details of the two diffuser configurations used in the present study.
and turbulence at the development section inlet. The 60-cm-long development channelhad a constant rectangular cross section of height 1 cm and aspect ratio 1:3.33. Threegrids were included at the upstream end of the development section to achieve a greaterflow uniformity. Velocity data a few centimeters upstream of the diffuser inlet showedthat the flow was fully developed by the end of this channel.
The test diffuser is attached directly to the development channel exit. Diffuser 1 has arectangular inlet of height 1 cm and aspect ratio 1:3.33 and a 4 cm square outlet, givingan area expansion ratio of 4.8. The diffuser is 15 cm long. One side wall expands at anangle of 2.56o degrees, and the top wall expands at an angle of 11.3o degrees. The othertwo walls are straight. Diffuser 2 is also 15 cm long and has the same inlet as Diffuser1, but its outlet is 4.51 cm x 3.37 cm, giving an area expansion ratio of 4.56. The topwall of Diffuser 2 expands at an agle of 9o degrees and its side wall expands at an angleof 4o degrees. The Reynolds number in both diffusers based on the height of the inletchannel is set to approximately 10,000. Different outlet transition sections are used forthe two diffusers because it is necessary to match the dimensions of the diffuser outlet.Both outlet transitions have 10 cm of constant-cross-section channel and then a 10-cmcontraction into a circular outlet 25.4cm diameter.
Velocity data are collected using the method of magnetic resonance velocimetry (MRV)described by MRV uses magnetic resonance imaging to measure the three-componentmean velocity vectors in a three-dimensional volume.
All experiments were performed at the Richard M. Lucas Center for Magnetic Reso-nance Spectroscopy and Imaging at Stanford University. A 1.5-T MR system (GE SignaCV/I, Gmax = 40mT/m, rise time = 268s), with a single channel, head receive coil wasused. Data were collected with a sagittal slab 74mm thick in the spanwise direction and afield-of-view (FOV) of 24cm in the streamwise and cross stream directions. The imagingmatrix was 74× 256× 256 yielding 1mm resolution in the spanwise direction and 0.9mm
34 E. M. Cherry et al.
in the streamwise and cross stream directions. A total of 16 complete scans of the flowwere averaged to produce the final velocity field.
The mean velocity uncertainty was estimated to be less than 10% following the analysisof Elkins et al. (2003) and Elkins et al. (2004).
Velocity field data were processed using Matlab. The coordinate system was rotatedand translated to match the coordinate system of the Solidworks model of each diffuser.The data were then averaged in the streamwise direction using a five-point Gaussianfilter.
3. Numerical setup
As discussed in the previous section, the diffuser geometry was designed to be easilydefined; the presence of planar surfaces and simple rectangular inlet and outlet ductsfacilitates the construction of a very high-quality hexahedral-only mesh. The grid isclustered at the walls to provide good resolution of the near-wall region. In Fig. 4 severalcross-sections are reported in the region of the diffuser. The computational domain alsoincludes the development duct and the outlet region (as defined earlier). Most of thecalculations reported herein are obtained on a mesh consisting of 1.8 million grid cells(referred to as the coarse grid); an additional mesh (fine grid) consisting of 14 millions cellsis also considered for the LES simulations. This is obtained by splitting each hexahedralin the coarse grid into eight elements.
Boundary conditions are simple no-slip walls, velocity inlet and outflow. At the inletplane, a constant velocity matching the experimental mass flow rate is specified. Nofluctuations are added, as the inflow plane is far from the diffuser region. The outlet istreated as a classical convective outlet.
The numerical simulations using LES are performed using CDP, a parallel, unstruc-tured code for accurate flow simulations (Mahesh et al 2004; Ham & Iaccarino 2004).The incompressible Navier-Stokes equations are solved on general polyhedral meshes us-ing a fractional-step procedure. Second-order symmetric discretization in time and spaceis used. This results in an algorithm that conserves kinetic energy, and introduces no nu-merical dissipation. The subgrid scale Reynolds stresses are modeled using the dynamicSmagorinsky closure.
In addition to the LES, computations using a commercial software (Fluent) are consid-ered to evaluate the predictive abilities of conventional RANS turbulence models. Severalmodels have been tested, but only the results using the k-ω SST model (Menter 1994)are presented herein. Results obtained with other eddy-viscosity models are comparable.
The LES computations are performed using unity CFL; this results in a timestepapproximately equal to 0.00015 seconds on the coarse mesh. The simulation has beenrun for approximately 25, 000 timesteps to achieve statistical convergence. Afterward theflowfield has been averaged for about 2.5 seconds (or equivalently 15, 000 timesteps). Onthe other hand, the computations on the fine grid have been averaged only for about8, 000 timesteps and have not achieved sufficient convergence of the velocity statistics.The preliminary results are presented in the following section although the computationsare ongoing. Calculations on the two grids have been carried out using 128 processors ofthe ALC Linux cluster at Lawrence Livermore National Laboratory.
Fluent computations are carried out solving the steady RANS equations using 16processors and have been completed only on the mesh consisting on 1.8 million gridelements.

3D separated flow 35
Figure 4. Cross-section of the computational grid consisting of 1.8 million hexahedrals. Themesh is clustered toward the no-slip walls. The computational domain includes the developmentchannel, the diffuser, and the outlet region.
4. Quantitative comparisons
Comparisons between numerical predictions and measurements are reported in Figs.5 and 6. The development of the flow in the diffuser 1 is illustrated in Fig. 5 in terms ofstreamwise velocity isocontours in axial cross-sections. The experiments show the pres-ence of a 3D separation that originates in the top-right corner and then propagates tobecome almost 2D in the upper part of the diffuser. The RANS simulations stronglyoverpredict the strength of the separation and result in a flow that is recirculating wellin the outlet region. In addition, the flow is separated on the right side of the diffuseras opposed to the measurements that show a recirculation area on the top wall. Massconservation implies strong acceleration in the left part of the diffuser, resulting in verydifferent velocity distributions in the cross-sections. On the other hand, the LES compu-tations show a much better agreement with the data, especially for the fine grid, althoughthe temporal averages are not converged. In Fig. 6, the streamwise velocity in a longitu-dinal plane at the mid-span of the development channel cross-section is reported. Thisplot can be compared directly to the results presented in the 2D diffuser simulated inIaccarino (2001). The results confirm that the RANS predictions severely over-estimatethe strength of the recirculation, while the LES (especially on the fine grid) appear tobe in reasonable agreement with the experiments.
In order to provide a more quantitative analysis of the predictions and measurements,six velocity profiles are extracted from the longitudinal plane reported in Fig. 5. Thecomparisons are reported in Fig. 7. The experiments clearly show a large separated regionon the top wall of the diffuser, but the detachment point is approximately located atx = 8mm downstream of the diffuser inlet. This is in strong contrast with the predictionsof both RANS and LES, which result in a separation occurring almost immediately atthe diffuser inlet. The LES predictions on the fine grid, however, appear to be in muchbetter agreement with the measurements. All of the numerical simulations predict athinner boundary layer on the bottom wall compared to the measurements.

36 E. M. Cherry et al.
Experiments
RANSRANS
LES
LES - Fine grid
-0.1 0.1 0.3 0.6 0.8 1.0 1.2 [m/s]
Figure 5. Streamwise velocity isolevels in four cross-sections along the diffuser 1. The columnsrepresent sections at x = 4mm, 8mm, 12mm, and 16mm from left to right (the origin of thex-coordinate is fixed at the diffuser inlet).
5. Ongoing and future work
The experimental and numerical results presented in this report have been collectedduring the first part of this research activity. Current experimental work is focused on thecharacterization of the second diffuser geometry. On the numerical side, the predictionsobtained on the fine grid are considered to be preliminary because the flow statisticshave not been averaged for sufficient time. The simulation is ongoing. The computationalgrid for the second diffuser has been generated but the flow computations have not yetstarted. In addition to completing these simulations, we intend to perform simulationsusing a Reynolds stress model to evaluate the limitations introduced by the eddy viscosityapproximation.

3D separated flow 37
RANS
LES
LES - Fine Grid
Experiments
-0.1 0.1 0.3 0.6 0.8 1.0 1.2 [m/s]
Figure 6. Streamwise velocity isolevels in a longitudinal section midspan in the diffuser 1.
Another important aspect of the present joint experimental and numerical study isthe development of objective measures of the agreement between the datasets. The avail-ability of massive amounts of measurements (in the present case about 400, 000 velocityvectors in the diffuser region) makes conventional comparisons such as the one presentedin Fig. 7 limited and potentially misleading, as they only focus on a limited region of thedomain. In particular, the last profile in Fig. 7 seems to suggest a potential differencein the overall mass flux through the diffuser. In practice, the overall mass flow has beenverified to be conserved and in close agreement between experiments and simulations.Each velocity profile in Fig. 7 is a 1D sample of a strongly 2D flow in the correspondingcross-section; mass conservation, on the other hand, is a scalar measure of the flow char-acteristic in the cross-section. In an attempt to capture the entire flow as a 3D entity,the probability density functions of the velocity vectors are reported in Fig. 8; this rep-resents a global measure of proximity between measurements and numerical predictionsalthough it is only qualitative because by construction it includes a scaling (the integralof the PDF is unity). Figure 8 shows the mean velocity statistics in the recirculatingregion and the much better agreement of the LES predictions as compared to the RANS

38 E. M. Cherry et al.
Streamwise velocity
yx = 0 x = 4 x = 8 x = 12 x = 16 x = 20 [cm]
3
2
1
0
4[cm]
0 10 10 1
0 1 0 10 1
Figure 7. Streamwise velocity profiles in a longitudinal section midspan in the diffuser 1.Symbols are experiments; dotted lines are the RANS predictions; dashed and solid lines are theLES predictions on the coarse and fine grid, respectively.
one (although only the coarse grid results are reported here for the LES). In addition,the PDF of the vertical velocity illustrates a strong asymmetry, while the cross-flow ve-locity is nearly Gaussian. Future work will focus on ways to compare quantitatively thepredictions based on distribution functions and as well as determine local comparisonmetrics.
Another important component of the validation process is the determination of theuncertainties. Although the experimental characterization has been performed (followingwhat was done earlier in Elkins et al., 2003), we have not included uncertainty bars inthe present data as they are not yetavailable for the computational results. Future workwill address this aspect of the numerical simulations.
Acknowledgments
This work is supported by the ONR and the Department of Energy within the Ad-vanced Simulation and Computing Program.
REFERENCES
Ashjaee, J. & Johnson, J.P. 1980. Subsonic Turbulent Flow in Plane Wall Diffusers:Peak Pressure Recovery and Transitory Stall. Journal of Fluids Engineering 102(3),275–282.

3D separated flow 39
x-velocity-0.2 0 0.2 0.4 0.6 0.8 1 1.2
y-velocity-0.15 -0.1 -0.05 0 0.05 0.1 0.15
z-velocity-0.15 -0.1 -0.05 0 0.05 0.1 0.15
Figure 8. Probability density function of the three velocity components within the diffuserregion. Solid lines are the experimental data, dotted and dashed lines are the RANS and theLES predictions respectively (on the coarse mesh).

40 E. M. Cherry et al.
Buice, C.U. & Eaton, J.K. 2000. Experimental Investigation of Flow through anAsymmetric Plane Diffuser. Journal of Fluids Engineering 122(2),.433–435
Durbin, P. 1995. Separated Flow Computations with the k-ε-v2 Model. AIAA J. 33,659–664.
Elkins, C.J. Markl, M., Pelc, N. & Eaton, J.K., 2004. Full-Field Velocity andTemperature Measurements Using Magnetic Resonance Imaging in Turbulent Com-plex Internal Flows. International Journal of Heat and Fluid Flow 25 702–710.
Elkins, C.J., Markl, M., Pelc, N. & Eaton, J.K., 2003. 4D magnetic resonancevelocimetry for mean flow measurements in complex turbulent flows. Exp. Fluids 34,494–503.
Ham, F. & Iaccarino, G. 2004. Energy Conservation in Colocated DiscretizationSchemes on Unstructured Meshes. Annual Research Briefs, Center for TurbulenceResearch 3–14.
Iaccarino, G. 2001. .Prediction of a turbulent separated flow using commercial CFDcodes. J. Fluids Engng. 123, 819–828.
Johnson, J.P. 1998. Review: Diffuser Design and Performance Analysis by a UnifiedIntegral Method. Journal of Fluids Engineering 120(1), 6–18.
Kaltenbach, H. J., Fatica, M., Mittal, R., Lund, T. S. & Moin, P. 1999. Studyof flow in a planar asymmetric diffuser using large eddy simulation. J. Fluid Mech.390, 151185.
Mahesh, K., Constantinescu, G. & Moin, P. 2004 A numerical method for largeeddy simulation in complex geometries. J. Comput. Phys. 197, 215240.
Menter, F. R. 1994 Two equation eddy viscosity turbulence models for engineeringapplications. AIAA J. 32, 1598–1605.
Obi, S., Aoki, K., & Masuda, S. 1993 Experimental and Computational Study ofSeparating Flow in an Asymmetric Plane Diffuser. 9th Symposium on TurbulentShear Flows, Kyoto, Japan, August 16-18, 305-1-305-4
Simpson, R.L. 1981. Review of Some Phenomena in Turbulent Flow Separation. Journalof Fluids Engineering 103(4), 520–532.
Song, S. & Eaton, J.K. 2004. Reynolds Number Effects on a Turbulent BoundaryLayer with Separation, Reattachment, and Recovery, Experiments in Fluids 36, 246–258.
Stock, H.W., Leicher, S., & Seibert, W. 1988. Investigation of Flow Separation ina 3D Diffuser Using a Coupled Euler and Boundary Layer Method. Zeitschrift FurFlugwissen Schaften und Weltraumf Orshung 12(5-6), 347–357.
Tsui, Y.Y. & Wang, C.K. 1995. Calculation of Laminar Separated Flow in Symmetric2D Diffusers. Journal of Fluids Engineering, 117(4), 612–616.
Xu, D., Leschziner, M.A., Khoo, B.C., & Shu, C. 1997. Numerical Predictionof Separation and Reattachment of Turbulent Flow in an Axisymmetric Diffuser.Computers and Fluids. 26, no. 4, pp(4), 417–423.
Wu, X., Schluter, J., Moin, P., Pitsch, H., Iaccarino, G., & Ham, F. 2006.Computational study on the internal layer in a diffuser. J. Fluid Mech. (550) 391–412.