CENTER FOR SOCIAL SERVICES RESEARCH School of Social Welfare, UC Berkeley Making the Most of Your...
31
CENTER FOR SOCIAL SERVICES RESEARCH School of Social Welfare, UC Berkeley Making the Most of Your Composite Computational Spreadsheet: Tools from California Linda Hockman Debbie Williams California Department of Social Services William Dawson Barbara Needell Daniel Webster Center for Social Services Research, UC Berkeley The Performance Indicators Project is a collaboration of the California Department of Social Services and the University of California at Berkeley, and is supported by the California Department of Social Services and the Stuart Foundation
-
date post
21-Dec-2015 -
Category
Documents
-
view
213 -
download
0
Transcript of CENTER FOR SOCIAL SERVICES RESEARCH School of Social Welfare, UC Berkeley Making the Most of Your...

CENTER FOR SOCIAL SERVICES RESEARCH School of Social Welfare, UC Berkeley
Making the Most of Your Composite Computational Spreadsheet:
Tools from CaliforniaLinda HockmanDebbie Williams
California Department of Social Services
William DawsonBarbara NeedellDaniel Webster
Center for Social Services Research, UC Berkeley
The Performance Indicators Project is a collaboration of the California Department of Social Services and the University of
California at Berkeley, and is supported by the California Department of Social Services and
the Stuart Foundation

http://www.nrccwdt.org/resources/cfsr/data_tools.html

Safety
S1.1 (%)
S2.1 (%)
Permanency
Composite 1:
Reunification
Composite 2: Adoption
Composite 3: Long-
Term
Composite 4: Stability
C1.1 (%) C1.2 (m) C1.3 (%) C1.4 (%) C2.1 (%)
C2.2 (m) C2.3 (%) C2.4 (%) C2.5
(%) C3.1 (%) C3.2 (%) C3.3 (%)
C4.1 (%) C4.2 (%) C4.3 (%)
Component A
Component B
Component A
Component B
Component CComponent A
Component B
To calculate county-level performance for a given year, the inputs are county-level performance for the 17 federal measures
The denominator provides the count of children in care during the year (at the county level)

Composite Calculations
• In our presentation of state and county composite estimates, we have automated the process to allow us to calculate estimates across all available time periods and to update and extend the estimates as new data become available each quarter.
• Based on the Excel tool, there are six steps in the calculation of the composites at the state level. – Calculations are made at the county level to determine the
state composite scores. – The screen captures use C1 Alameda County as an
example. – Cells with dashed borders contain calculation under
discussion.

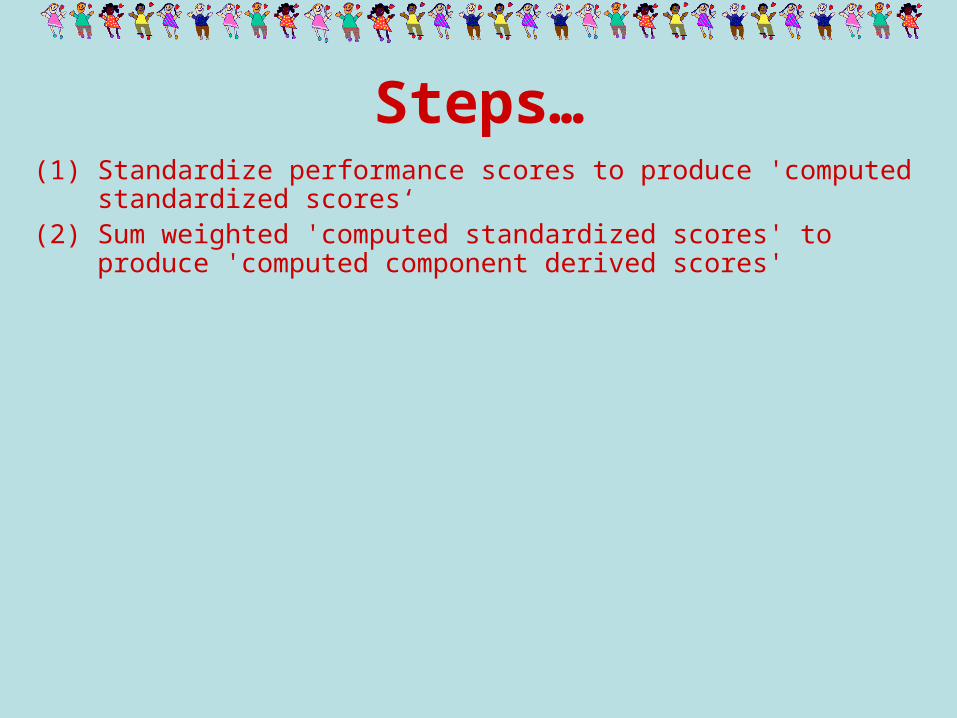
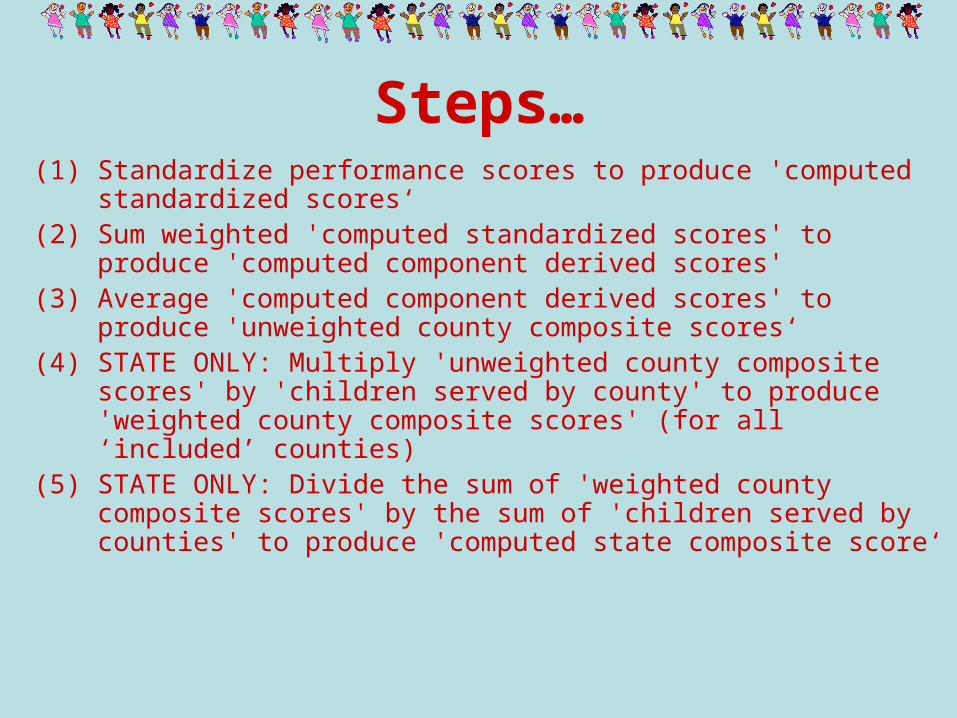
Steps…(1) Standardize performance scores to produce 'computed
standardized scores‘

(1) Standardize performance scores to produce 'computed standardized scores'
Steps…(1) Standardize performance scores to produce 'computed
standardized scores‘(2) Sum weighted 'computed standardized scores' to produce
'computed component derived scores'
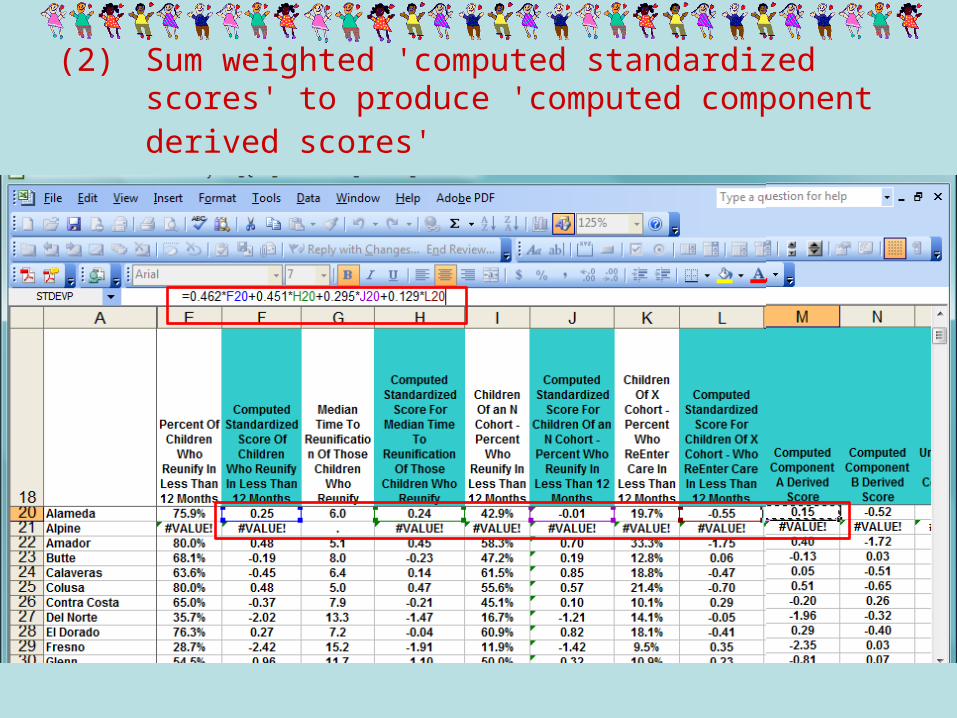
(2) Sum weighted 'computed standardized scores' to produce 'computed component derived scores'

Steps…(1) Standardize performance scores to produce 'computed
standardized scores‘(2) Sum weighted 'computed standardized scores' to produce
'computed component derived scores' (3) Average 'computed component derived scores' to produce
'unweighted county composite scores‘

(3) Average 'computed component derived scores' to produce 'unweighted county composite scores'

Steps…(1) Standardize performance scores to produce 'computed
standardized scores‘(2) Sum weighted 'computed standardized scores' to produce
'computed component derived scores' (3) Average 'computed component derived scores' to produce
'unweighted county composite scores‘(4) STATE ONLY: Multiply 'unweighted county composite scores' by
'children served by county' to produce 'weighted county composite scores' (for all ‘included’ counties)
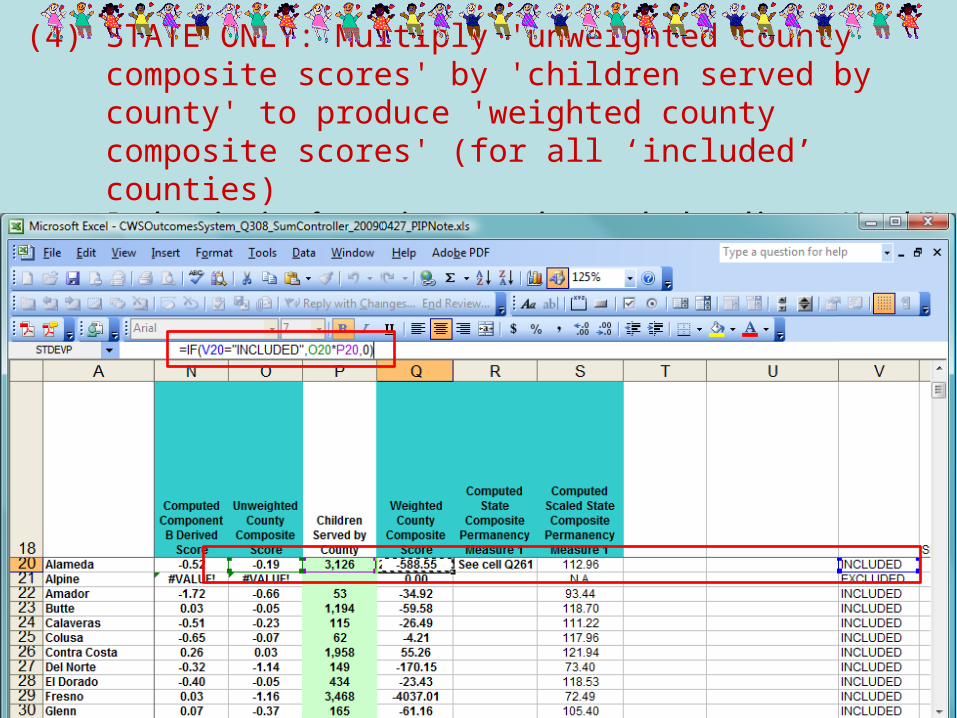
(4) STATE ONLY: Multiply 'unweighted county composite scores' by 'children served by county' to produce 'weighted county composite scores' (for all ‘included’ counties)For the estimation of composite scores at the county level, we skip steps (4) and (5).
Steps…(1) Standardize performance scores to produce 'computed
standardized scores‘(2) Sum weighted 'computed standardized scores' to produce
'computed component derived scores' (3) Average 'computed component derived scores' to produce
'unweighted county composite scores‘(4) STATE ONLY: Multiply 'unweighted county composite scores' by
'children served by county' to produce 'weighted county composite scores' (for all ‘included’ counties)
(5) STATE ONLY: Divide the sum of 'weighted county composite scores' by the sum of 'children served by counties' to produce 'computed state composite score‘

(5) STATE ONLY: Divide the sum of 'weighted county composite scores' by the sum of 'children served by counties' to produce 'computed state composite score'

Steps…(1) Standardize performance scores to produce 'computed
standardized scores‘(2) Sum weighted 'computed standardized scores' to produce
'computed component derived scores' (3) Average 'computed component derived scores' to produce
'unweighted county composite scores‘(4) STATE ONLY: Multiply 'unweighted county composite scores' by
'children served by county' to produce 'weighted county composite scores' (for all ‘included’ counties)
(5) STATE ONLY: Divide the sum of 'weighted county composite scores' by the sum of 'children served by counties' to produce 'computed state composite score‘
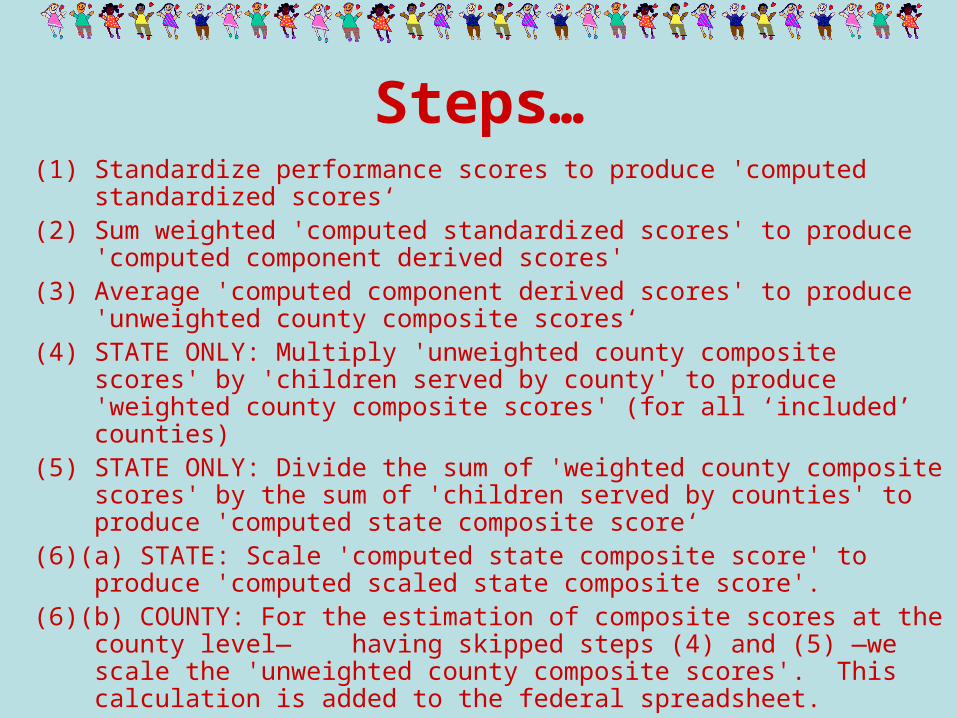
(6)(a) STATE: Scale 'computed state composite score' to produce 'computed scaled state composite score'.

(6)(a) STATE: Scale 'computed state composite score' to produce 'computed scaled state composite score'.
Steps…(1) Standardize performance scores to produce 'computed
standardized scores‘(2) Sum weighted 'computed standardized scores' to produce
'computed component derived scores' (3) Average 'computed component derived scores' to produce
'unweighted county composite scores‘(4) STATE ONLY: Multiply 'unweighted county composite scores' by
'children served by county' to produce 'weighted county composite scores' (for all ‘included’ counties)
(5) STATE ONLY: Divide the sum of 'weighted county composite scores' by the sum of 'children served by counties' to produce 'computed state composite score‘
(6)(a) STATE: Scale 'computed state composite score' to produce 'computed scaled state composite score'.
(6)(b) COUNTY: For the estimation of composite scores at the county level— having skipped steps (4) and (5) —we scale the 'unweighted county composite scores'. This calculation is added to the federal spreadsheet.

(6)(b) COUNTY: For the estimation of composite scores at the county level—having skipped steps (4) and (5) —we scale the 'unweighted county composite scores'. This calculation is added to the federal spreadsheet.
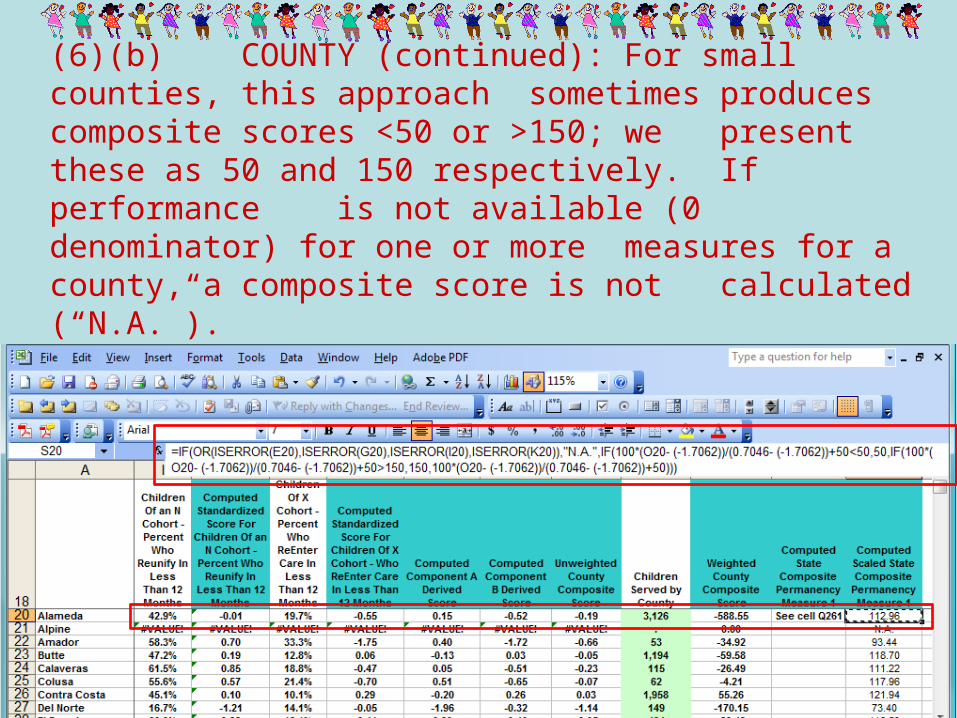
(6)(b) COUNTY (continued): For small counties, this approach sometimes produces composite scores <50 or >150; we present these as 50 and 150 respectively. If performance is not available (0 denominator) for one or more measures for a county, a composite score is not calculated (“N.A.”).
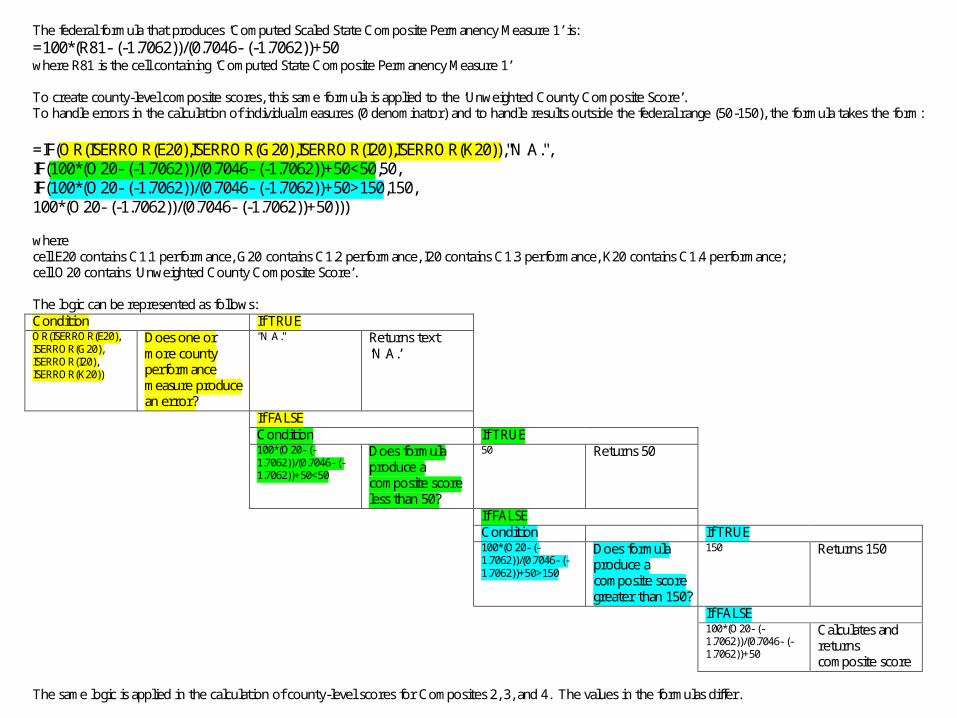
The federal formula that produces ‘Computed Scaled State Composite Permanency Measure 1’ is: =100*(R81- (-1.7062))/(0.7046- (-1.7062))+50 where R81 is the cell containing ‘Computed State Composite Permanency Measure 1’ To create county-level composite scores, this same formula is applied to the ‘Unweighted County Composite Score’. To handle errors in the calculation of individual measures (0 denominator) and to handle results outside the federal range (50-150), the formula takes the form: =IF(OR(ISERROR(E20),ISERROR(G20),ISERROR(I20),ISERROR(K20)),"N.A.", IF(100*(O20- (-1.7062))/(0.7046- (-1.7062))+50<50,50, IF(100*(O20- (-1.7062))/(0.7046- (-1.7062))+50>150,150, 100*(O20- (-1.7062))/(0.7046- (-1.7062))+50))) where cell E20 contains C1.1 performance, G20 contains C1.2 performance, I20 contains C1.3 performance, K20 contains C1.4 performance; cell O20 contains ‘Unweighted County Composite Score’. The logic can be represented as follows: Condition If TRUE OR(ISERROR(E20), ISERROR(G20), ISERROR(I20), ISERROR(K20))
Does one or more county performance measure produce an error?
"N.A." Returns text ‘N.A.’
If FALSE Condition If TRUE 100*(O20- (-
1.7062))/(0.7046- (-1.7062))+50<50
Does formula produce a composite score less than 50?
50 Returns 50
If FALSE Condition If TRUE 100*(O20- (-
1.7062))/(0.7046- (-1.7062))+50>150
Does formula produce a composite score greater than 150?
150 Returns 150
If FALSE 100*(O20- (-
1.7062))/(0.7046- (-1.7062))+50
Calculates and returns composite score
The same logic is applied in the calculation of county-level scores for Composites 2, 3, and 4. The values in the formulas differ.

Measure Contributions The weights presented in the Composite Planner are arrived at by averaging (where applicable) and then presenting as proportions the weights applied to each measure in the calculation of the 'computed component derived scores' (step 2 in Federal Computational Spreadsheet). The presentation of these average weights is intended to assist in understanding how changes in performance on individual measures affect the composite scores. For example, a large average weight explains why a small improvement on that measure produces a relatively large increase in the associated composite.
Component A Component B Component C Average Weight Contribution
C1.1 0.462 0.085 0.2735 22%
C1.2 0.451 0.070 0.2605 21%
C1.3 0.295 -0.005 0.1450 12%
C1.4 0.129 1.025 0.5770 46%
100%
C2.1 0.533 -0.032 -0.026 0.1583 15%
C2.2 0.551 0.106 -0.032 0.2083 19%
C2.3 -0.087 0.526 0.255 0.2313 22%
C2.4 0.140 0.699 -0.256 0.1943 18%
C2.5 -0.030 -0.059 0.930 0.2803 26%
100%
C3.1 0.545 0.137 0.3410 33%
C3.2 0.746 -0.220 0.2630 25%
C3.3 -0.108 0.979 0.4355 42%
100%
C4.1 0.398 0.3980 33%
C4.2 0.417 0.4170 34%
C4.3 0.400 0.4000 33%
100%

Measure Contributions to Composites
C1.1 (22%)
C1.2 (21%)
C1.3 (12%)
C1.4 (46%)
0%
20%
40%
60%
80%
100%
Composite 1
Reunification Within 12 Months (Exit Cohort)
Median Time To Reunification (Exit Cohort)
Reentry Following Reunification (Exit Cohort)
Reunification Within 12 Months (Entry Cohort)
Note: Measures may not sum to exactly 100% due to rounding.
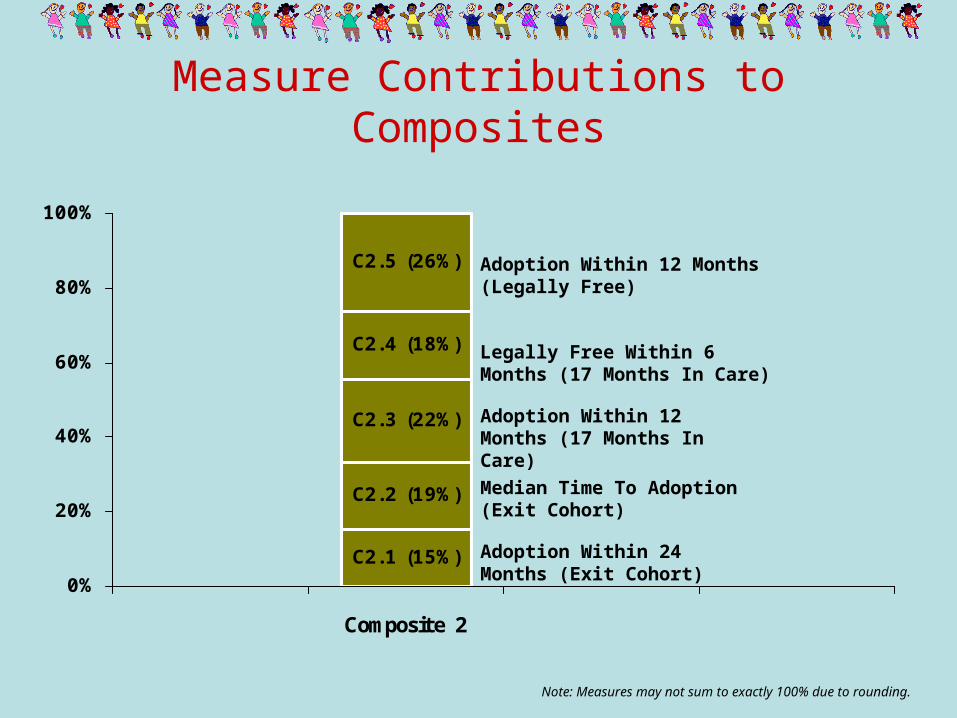
Measure Contributions to Composites
C2.1 (15%)
C2.2 (19%)
C2.3 (22%)
C2.4 (18%)
C2.5 (26%)
0%
20%
40%
60%
80%
100%
Composite 2
Adoption Within 24 Months (Exit Cohort)
Median Time To Adoption (Exit Cohort)
Adoption Within 12 Months (17 Months In Care)
Legally Free Within 6 Months (17 Months In Care)
Adoption Within 12 Months (Legally Free)
Note: Measures may not sum to exactly 100% due to rounding.

Measure Contributions to Composites
C3.1 (33%)
C3.2 (25%)
C3.3 (42%)
0%
20%
40%
60%
80%
100%
Composite 3
Exits to Permanency (24 Months In Care)
Exits to Permanency
(Legally Free At Exit)
In Care 3 Years Or Longer
(Emancipated/Age 18)
Note: Measures may not sum to exactly 100% due to rounding.

Measure Contributions to Composites
C4.1 (33%)
C4.2 (34%)
C4.3 (33%)
0%
20%
40%
60%
80%
100%
Composite 4
Placement Stability (8 Days To 12 Months In
Care)
Placement Stability (12 To 24 Months In Care)
Placement Stability (At Least 24 Months In Care)
Note: Measures may not sum to exactly 100% due to rounding.

Measure Contributions to Composites
C4.1 (33%)C3.1 (33%)
C2.1 (15%)C1.1 (22%)
C4.2 (34%)C3.2 (25%)
C2.2 (19%)
C1.2 (21%)
C4.3 (33%)C3.3 (42%)
C2.3 (22%)C1.3 (12%)
C2.4 (18%)
C1.4 (46%)
C2.5 (26%)
0%
20%
40%
60%
80%
100%
Composite 1 Composite 2 Composite 3 Composite 4
Note: Measures may not sum to exactly 100% due to rounding.

Estimate of statewide composite scores in the composite planner
In the ‘Most Recent’ column, county contributions to the state composite score are weighted, as per federal instructions, by the total number of children served in care in the county during the year.
In the ‘Target’ column, statewide composite scores use statewide performance as if California was one large county. The result is then adjusted. [Adjustment]=[Most recent time period score (using county-level weighting)] / [Most recent time period score (no county-level weighting)] As an example, the basic Q3 08 ‘Target’ composite score calculations are adjusted as follows: C1 98.77% C2 100.81% C3 100.38% C4 99.85% These adjustments are not applicable to the estimate of county composite scores.

Additional Documentation
Measure Contributions
Microsoft Word Document
Estimate of Statewide
Composites
Microsoft Office Word Document
Microsoft Office Word Document
County Composite Formula

Composite Viewer (Alameda)

Composite Planner (Alameda)

CSSR.BERKELEY.EDU/UCB_CHILDWELFARENeedell, B., Webster, D., Armijo, M., Lee, S., Dawson, W., Magruder, J., Exel, M., Glasser, T., Williams, D., Zimmerman, K., Simon, V., Putnam-Hornstein, E., Frerer, K., Cuccaro-Alamin, S., Winn, A., Lou, C., & Peng, C. (2009). Child Welfare Services Reports for California. Retrieved April 1, 2009, from University of California at Berkeley Center for Social Services Research website. URL: <http://cssr.berkeley.edu/ucb_childwelfare>
Barbara [email protected]
510-290-6334
Slides developed by Emily Putnam-Hornstein