Center for Research in Higher Education Policies · CIPES – Center for Research in Higher...
50
CIPES – Center for Research in Higher Education Policies A N S E E S Creating Excellence in European Higher Education: From Student Satisfaction to Student Retention Maria de Lourdes Maria de Lourdes Machado Machado - - Taylor Taylor , , CIPES, Porto, PORTUGAL, CIPES, Porto, PORTUGAL, R R esearcher and Professor . esearcher and Professor . Rui Brites Rui Brites , ISCTE/ , ISCTE/ Business Business School School , Lisbon, PORTUGAL , Lisbon, PORTUGAL Researcher and Professor of Quantitative and Qualitative Methods Researcher and Professor of Quantitative and Qualitative Methods in Social Sciences. in Social Sciences. Ant Ant ó ó nio nio Magalhães Magalhães , Porto University and CIPES, PORTUGAL, , Porto University and CIPES, PORTUGAL, Researcher and Professor Researcher and Professor Retention 2008 S. Diego, May 28 – 30
Transcript of Center for Research in Higher Education Policies · CIPES – Center for Research in Higher...
CIPES – Center for Research in Higher Education Policies
A
N
S
E
E
S
Creating Excellence in European Higher Education:
From Student Satisfaction to Student Retention
Maria de Lourdes Maria de Lourdes MachadoMachado--TaylorTaylor, , CIPES, Porto, PORTUGAL,CIPES, Porto, PORTUGAL,
RResearcher and Professor .esearcher and Professor .
Rui BritesRui Brites, ISCTE/, ISCTE/BusinessBusiness SchoolSchool, Lisbon, PORTUGAL, Lisbon, PORTUGAL
Researcher and Professor of Quantitative and Qualitative MethodsResearcher and Professor of Quantitative and Qualitative Methods in Social Sciences.in Social Sciences.
AntAntóónionio MagalhãesMagalhães, Porto University and CIPES, PORTUGAL,, Porto University and CIPES, PORTUGAL,
Researcher and ProfessorResearcher and Professor
Retention
2008
S. Diego, May 28 – 30
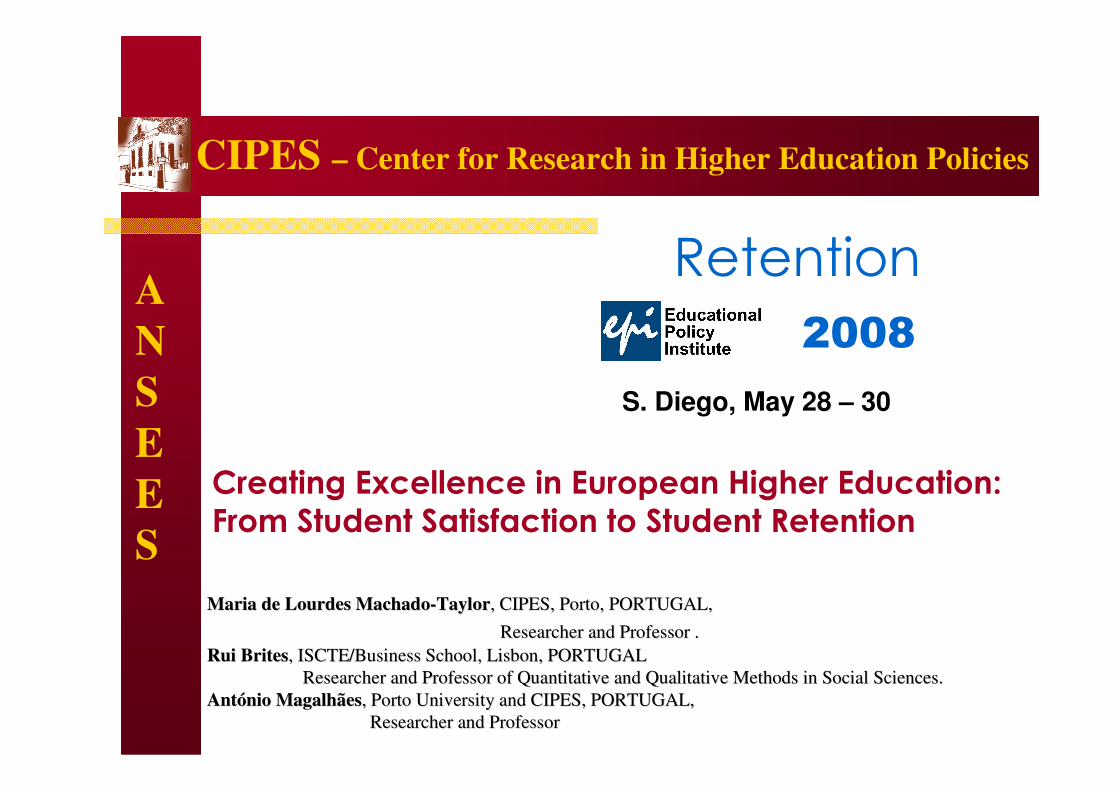
RESEARCH TEAM:James S. Taylor (Team Coordinator), CIPES & Aveiro University ††António Magalhães (Team Coordinator), CIPES & Porto University
Maria de Lourdes Machado, CIPES & Polytechnic Institute of Bragança
Rui Brites, CIPES & ISCTE
Minoo Farhangmehr, CIPES & Minho University
José Brites Ferreira, CIPES & Polytechnic Institute of Leiria
Cláudia Sarrico, CIPES & Aveiro University
Fernanda Correia, CIPES
Orlanda Tavares, CIPES
Maria José Sá, CIPES
D. Bruce Johnstone, SUNY Buffalo, USA (Consultant)
CIPES
A
N
S
E
E
S
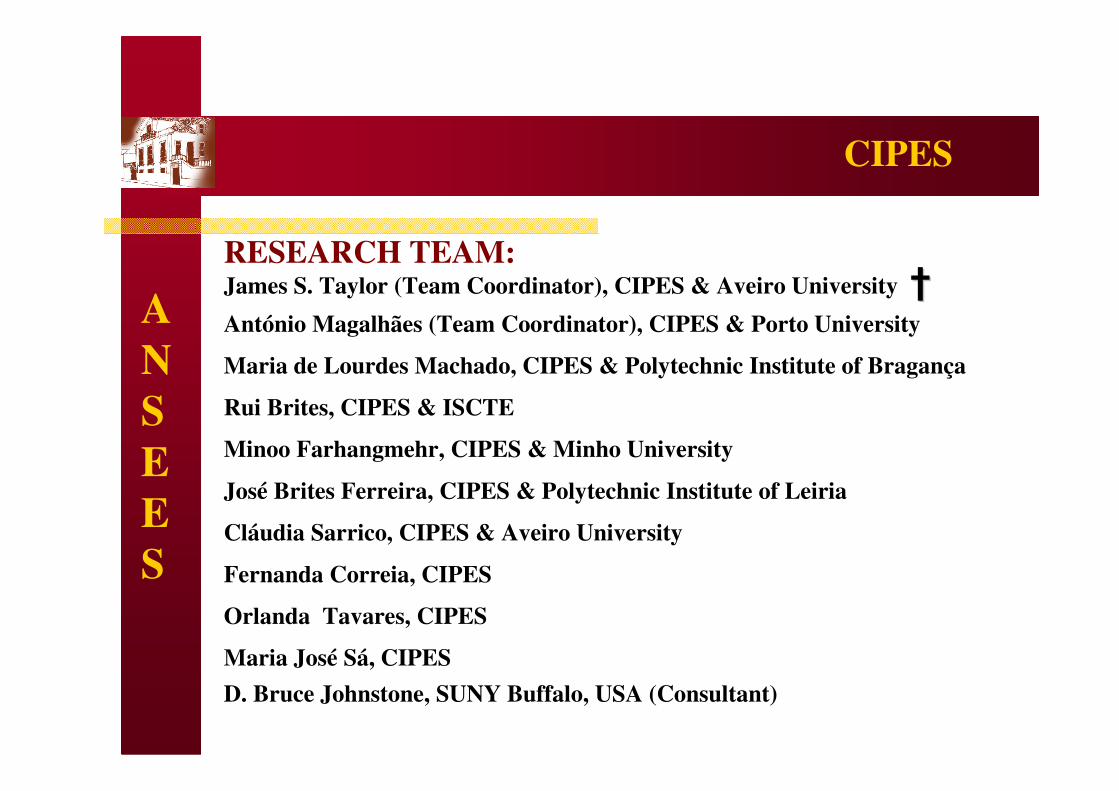
OUTLINE
� Introduction
� European Perspectives
� Satisfaction/Retention (US/European Perspectives)
� Methodology of the study
� Portuguese Higher Education
� Findings and Analysis
� Final thoughts/Questions and Discussion
CIPES
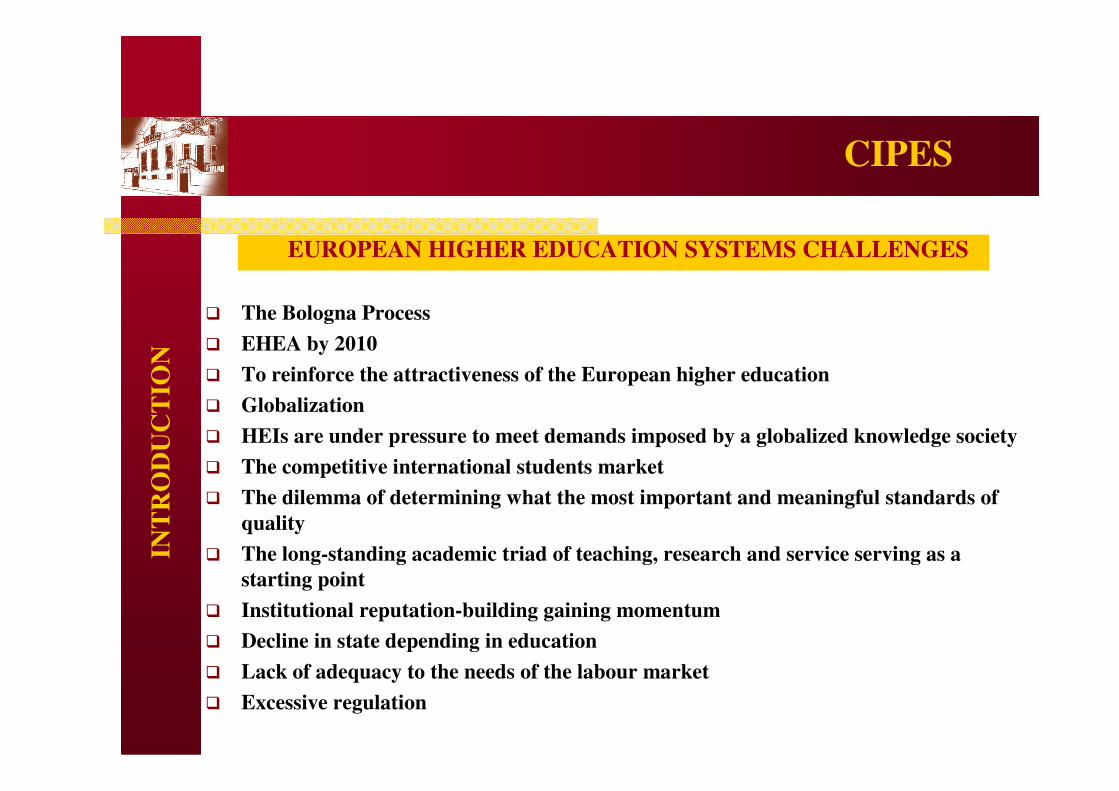
� The Bologna Process
� EHEA by 2010
� To reinforce the attractiveness of the European higher education
� Globalization
� HEIs are under pressure to meet demands imposed by a globalized knowledge society
� The competitive international students market
� The dilemma of determining what the most important and meaningful standards of
quality
� The long-standing academic triad of teaching, research and service serving as a
starting point
� Institutional reputation-building gaining momentum
� Decline in state depending in education
� Lack of adequacy to the needs of the labour market
� Excessive regulation
CIPES IN
TR
OD
UC
TIO
N
EUROPEAN HIGHER EDUCATION SYSTEMS CHALLENGES
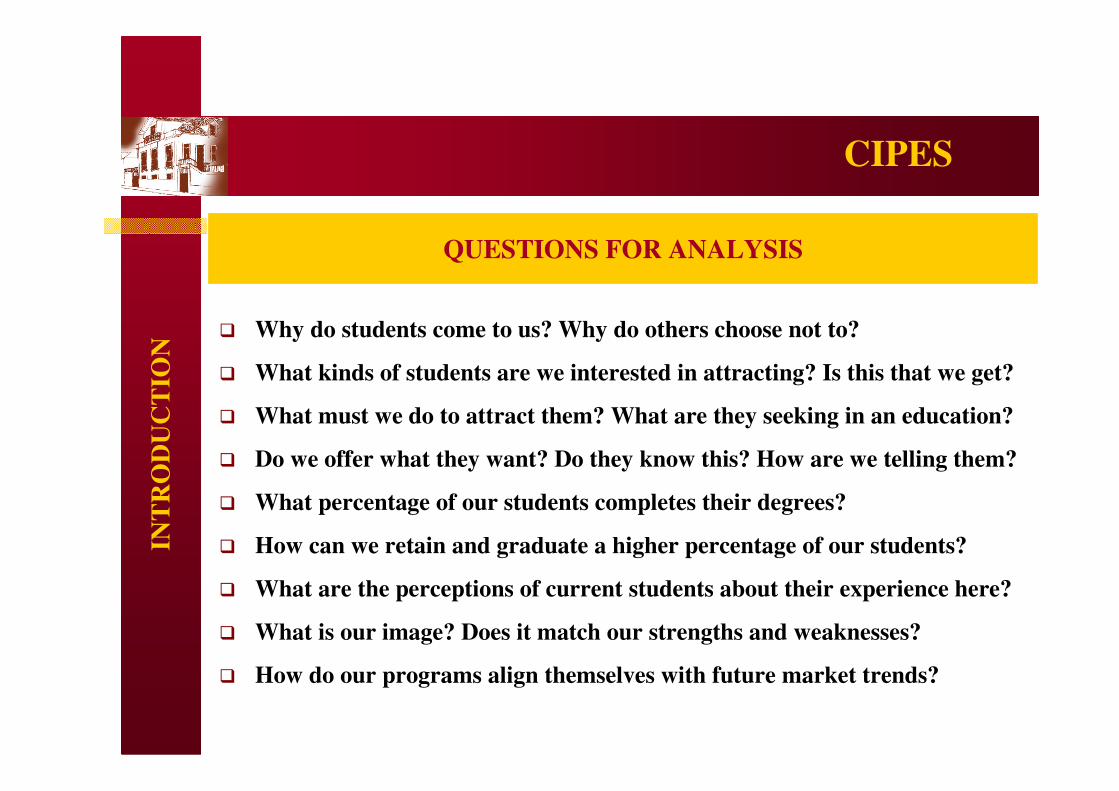
� Why do students come to us? Why do others choose not to?
� What kinds of students are we interested in attracting? Is this that we get?
� What must we do to attract them? What are they seeking in an education?
� Do we offer what they want? Do they know this? How are we telling them?
� What percentage of our students completes their degrees?
� How can we retain and graduate a higher percentage of our students?
� What are the perceptions of current students about their experience here?
� What is our image? Does it match our strengths and weaknesses?
� How do our programs align themselves with future market trends?
CIPES IN
TR
OD
UC
TIO
N
QUESTIONS FOR ANALYSIS
Achieving the pinnacle of student success is extremely
challenging;
Student retention and student success is a costly and
problematic issue.
CIPES IN
TR
OD
UC
TIO
N
PROBLEM
“…making quality higher education equally accessible
to all.”
“…appropriate conditions (to) complete their studies
without obstacles.”
CIPES
The Bologna Process(Bergen Communiqué)
EU
RO
PE
AN
PE
RS
PE
CT
IVE
S
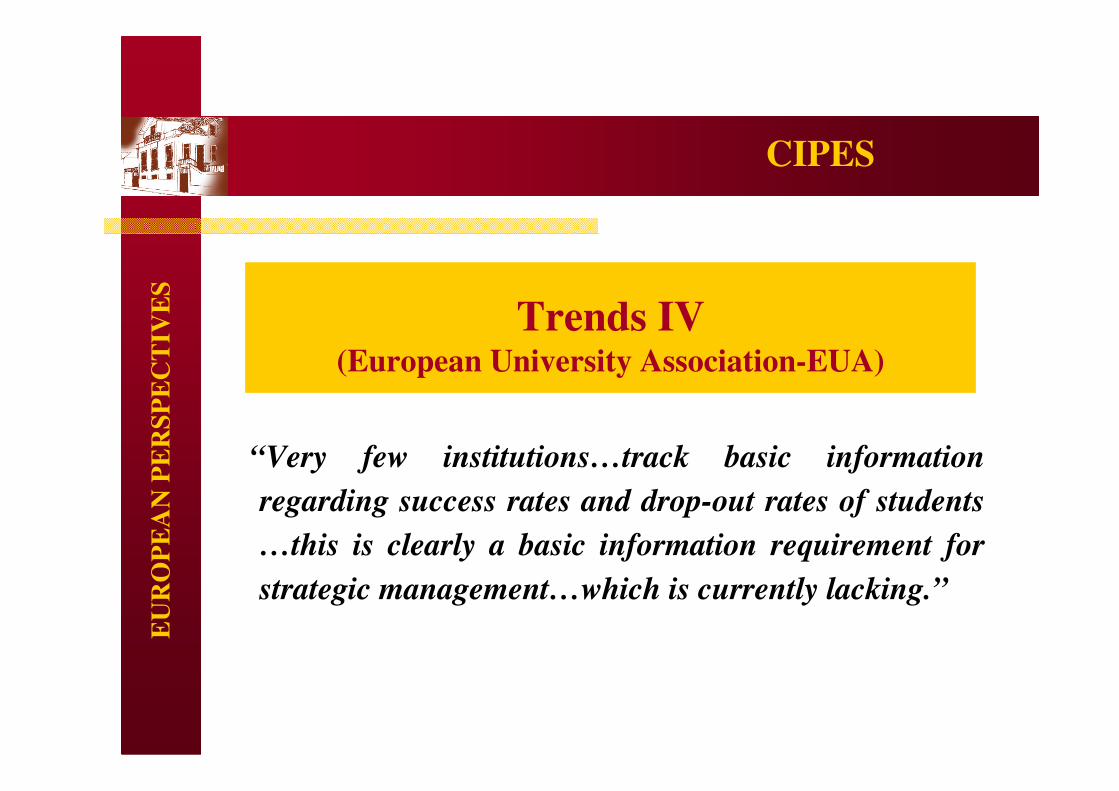
“Very few institutions…track basic information
regarding success rates and drop-out rates of students
…this is clearly a basic information requirement for
strategic management…which is currently lacking.”
CIPES
Trends IV(European University Association-EUA)
EU
RO
PE
AN
PE
RS
PE
CT
IVE
S
CIPES
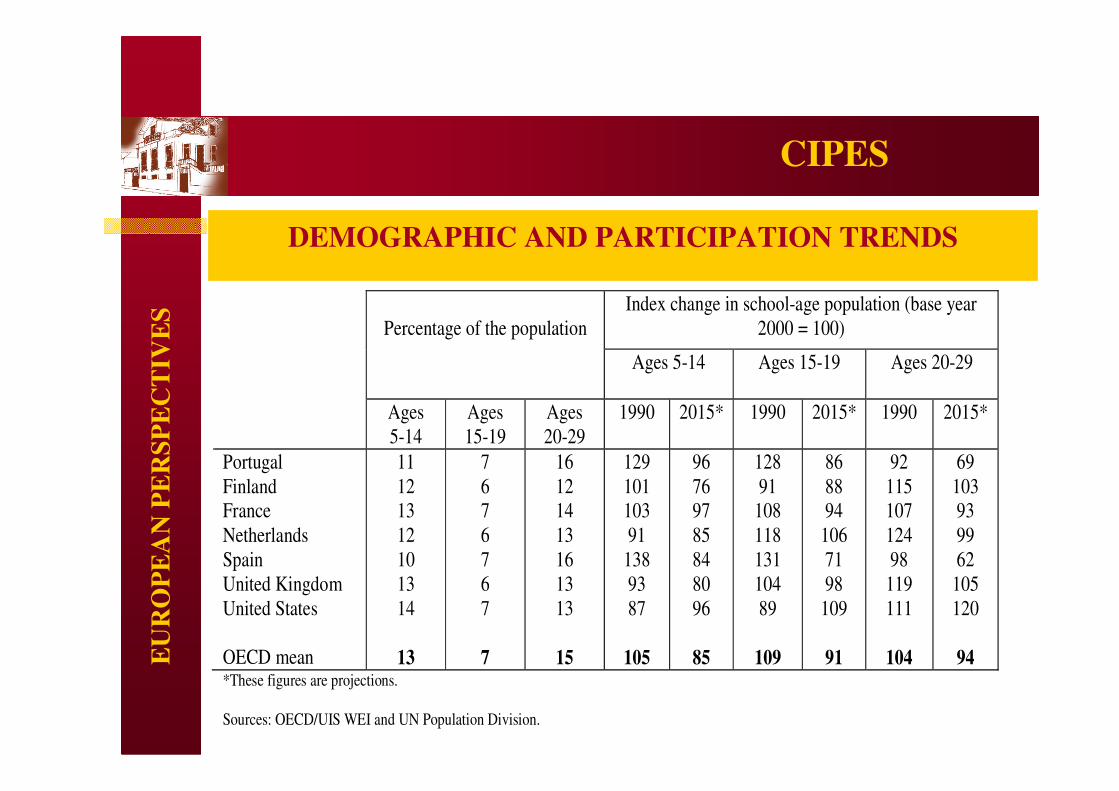
Index change in school-age population (base year
2000 = 100)
Percentage of the population
Ages 5-14
Ages 15-19 Ages 20-29
Ages
5-14
Ages
15-19
Ages
20-29
1990 2015* 1990 2015* 1990 2015*
Portugal
Finland
France
Netherlands
Spain
United Kingdom
United States
OECD mean
11
12
13
12
10
13
14
13
7
6
7
6
7
6
7
7
16
12
14
13
16
13
13
15
129
101
103
91
138
93
87
105
96
76
97
85
84
80
96
85
128
91
108
118
131
104
89
109
86
88
94
106
71
98
109
91
92
115
107
124
98
119
111
104
69
103
93
99
62
105
120
94 *These figures are projections.
Sources: OECD/UIS WEI and UN Population Division.
DEMOGRAPHIC AND PARTICIPATION TRENDS
EU
RO
PE
AN
PE
RS
PE
CT
IVE
S
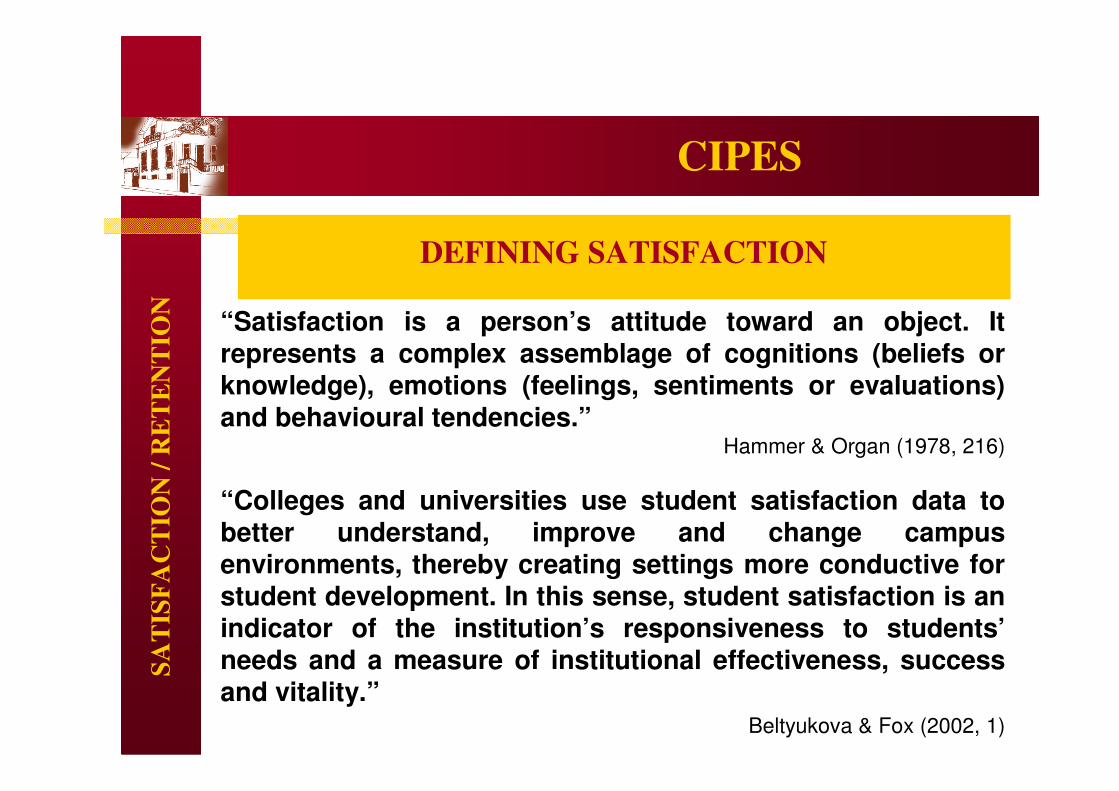
DEFINING SATISFACTION
“Satisfaction is a person’s attitude toward an object. It represents a complex assemblage of cognitions (beliefs or knowledge), emotions (feelings, sentiments or evaluations) and behavioural tendencies.”
Hammer & Organ (1978, 216)
“Colleges and universities use student satisfaction data to better understand, improve and change campus environments, thereby creating settings more conductive for student development. In this sense, student satisfaction is an indicator of the institution’s responsiveness to students’needs and a measure of institutional effectiveness, success and vitality.”
Beltyukova & Fox (2002, 1)
CIPESS
AT
ISF
AC
TIO
N /
RE
TE
NT
ION

DEFINING RETENTION
Retention can be viewed as a helping process in which relationship building is linked to individual strategies the parties use to achieve a desired educational outcome. Some of the key elements of the helping process are: reaching out to students who need support; forming strong, personal working relationship withthose faculty and students that help them identify and achieve their aspirations; assessing what is going on; involving key stakeholders in actions steps and strategies; keeping the door open through follow-up; and assisting students to transition in their educational careers and endeavours.
(Moxley, Najor-Durack and Dumbridge, 2001)
CIPESS
AT
ISF
AC
TIO
N /
RE
TE
NT
ION
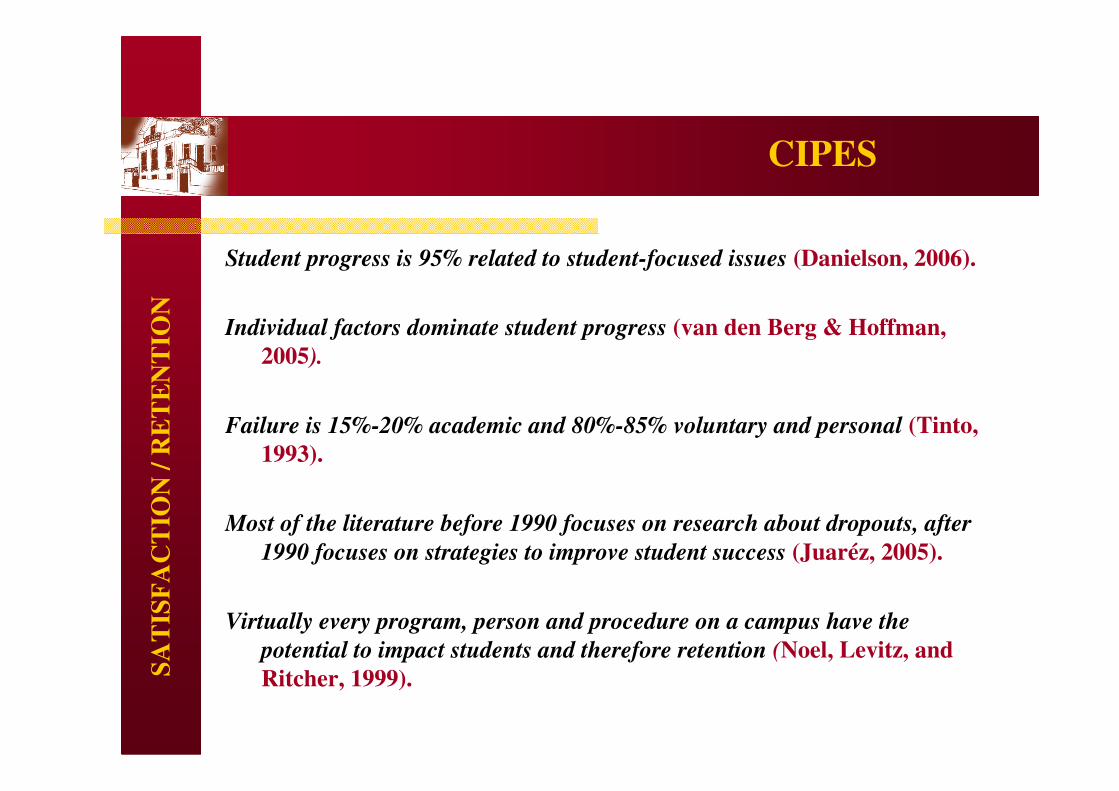
Student progress is 95% related to student-focused issues (Danielson, 2006).
Individual factors dominate student progress (van den Berg & Hoffman,
2005).
Failure is 15%-20% academic and 80%-85% voluntary and personal (Tinto,
1993).
Most of the literature before 1990 focuses on research about dropouts, after
1990 focuses on strategies to improve student success (Juaréz, 2005).
Virtually every program, person and procedure on a campus have the
potential to impact students and therefore retention (Noel, Levitz, and
Ritcher, 1999).
CIPESS
AT
ISF
AC
TIO
N /
RE
TE
NT
ION
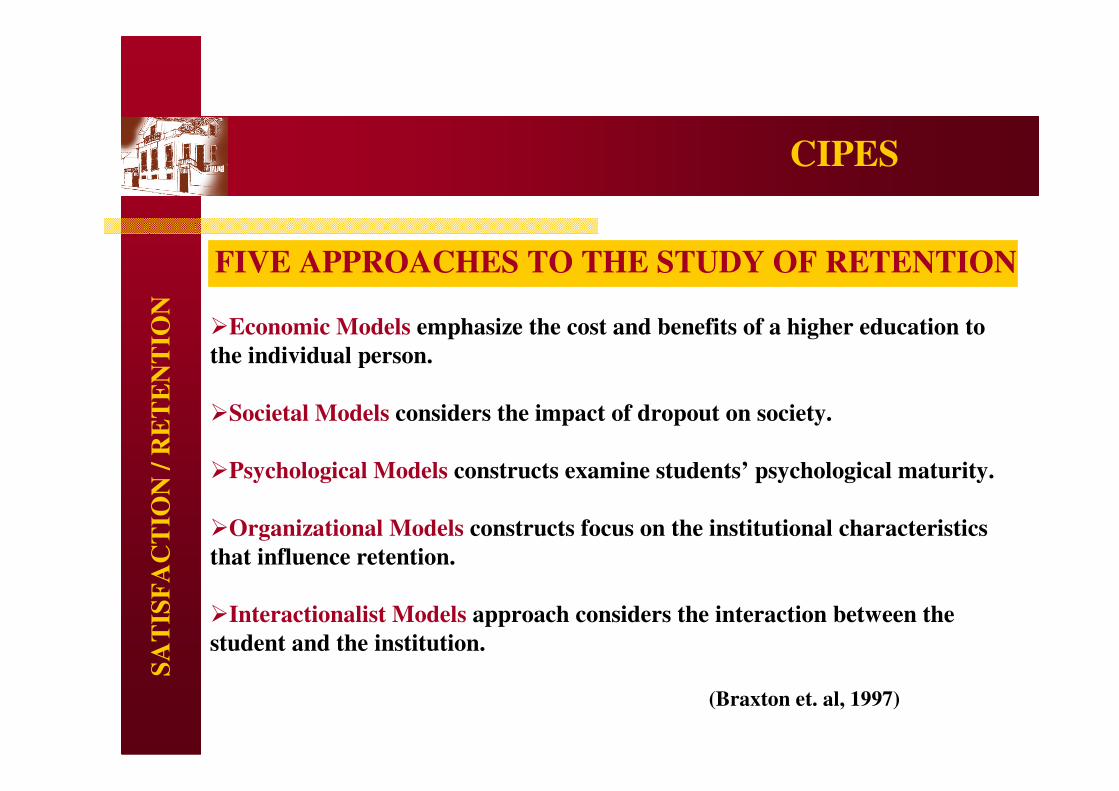
�Economic Models emphasize the cost and benefits of a higher education to
the individual person.
�Societal Models considers the impact of dropout on society.
�Psychological Models constructs examine students’ psychological maturity.
�Organizational Models constructs focus on the institutional characteristics
that influence retention.
�Interactionalist Models approach considers the interaction between the
student and the institution.
(Braxton et. al, 1997)
CIPES
FIVE APPROACHES TO THE STUDY OF RETENTION
SA
TIS
FA
CT
ION
/ R
ET
EN
TIO
N
CIPESS
AT
ISF
AC
TIO
N /
RE
TE
NT
ION
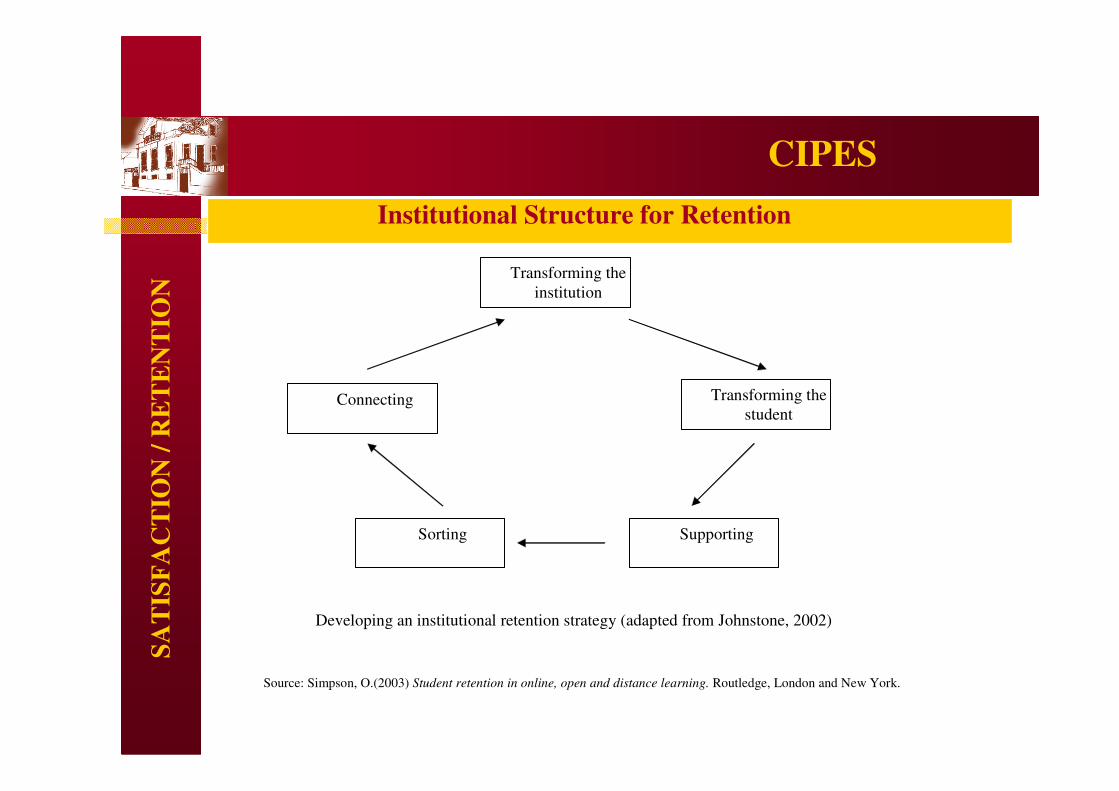
Institutional Structure for Retention
Transforming the
institution
Sorting Supporting
Transforming the
student Connecting
Developing an institutional retention strategy (adapted from Johnstone, 2002)
Source: Simpson, O.(2003) Student retention in online, open and distance learning. Routledge, London and New York.
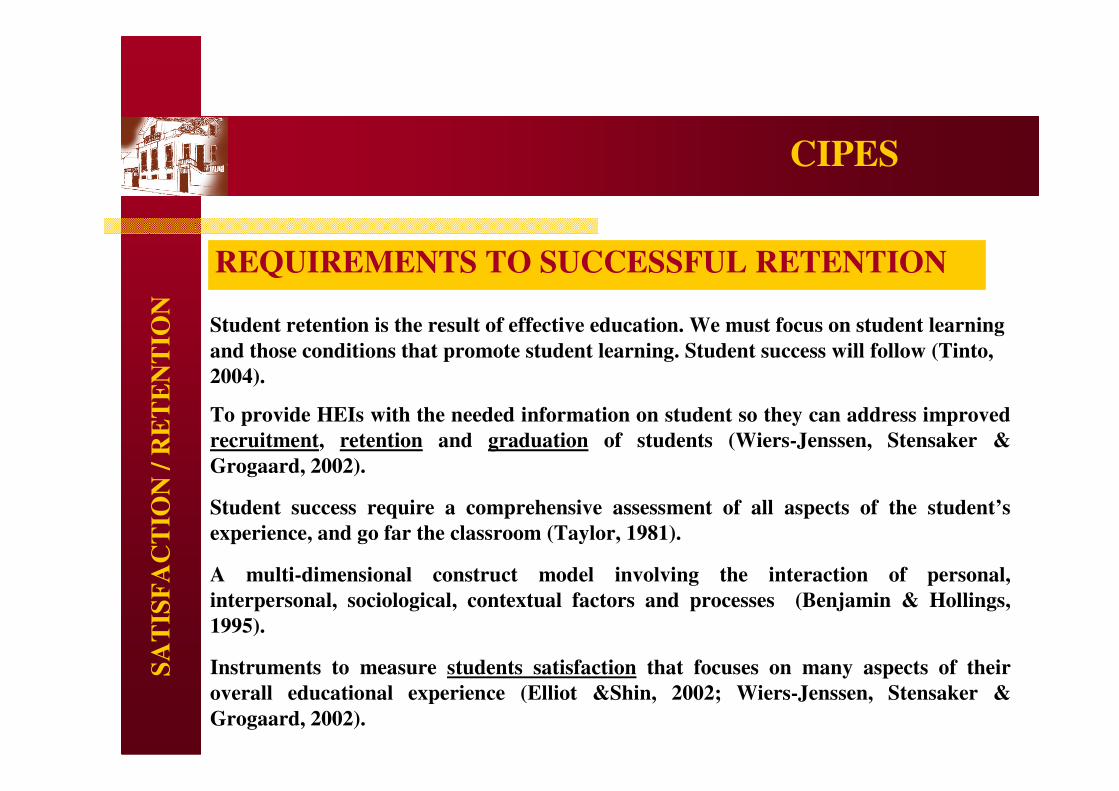
Student retention is the result of effective education. We must focus on student learning
and those conditions that promote student learning. Student success will follow (Tinto,
2004).
To provide HEIs with the needed information on student so they can address improved
recruitment, retention and graduation of students (Wiers-Jenssen, Stensaker &
Grogaard, 2002).
Student success require a comprehensive assessment of all aspects of the student’s
experience, and go far the classroom (Taylor, 1981).
A multi-dimensional construct model involving the interaction of personal,
interpersonal, sociological, contextual factors and processes (Benjamin & Hollings,
1995).
Instruments to measure students satisfaction that focuses on many aspects of their
overall educational experience (Elliot &Shin, 2002; Wiers-Jenssen, Stensaker &
Grogaard, 2002).
CIPES
REQUIREMENTS TO SUCCESSFUL RETENTION
SA
TIS
FA
CT
ION
/ R
ET
EN
TIO
N
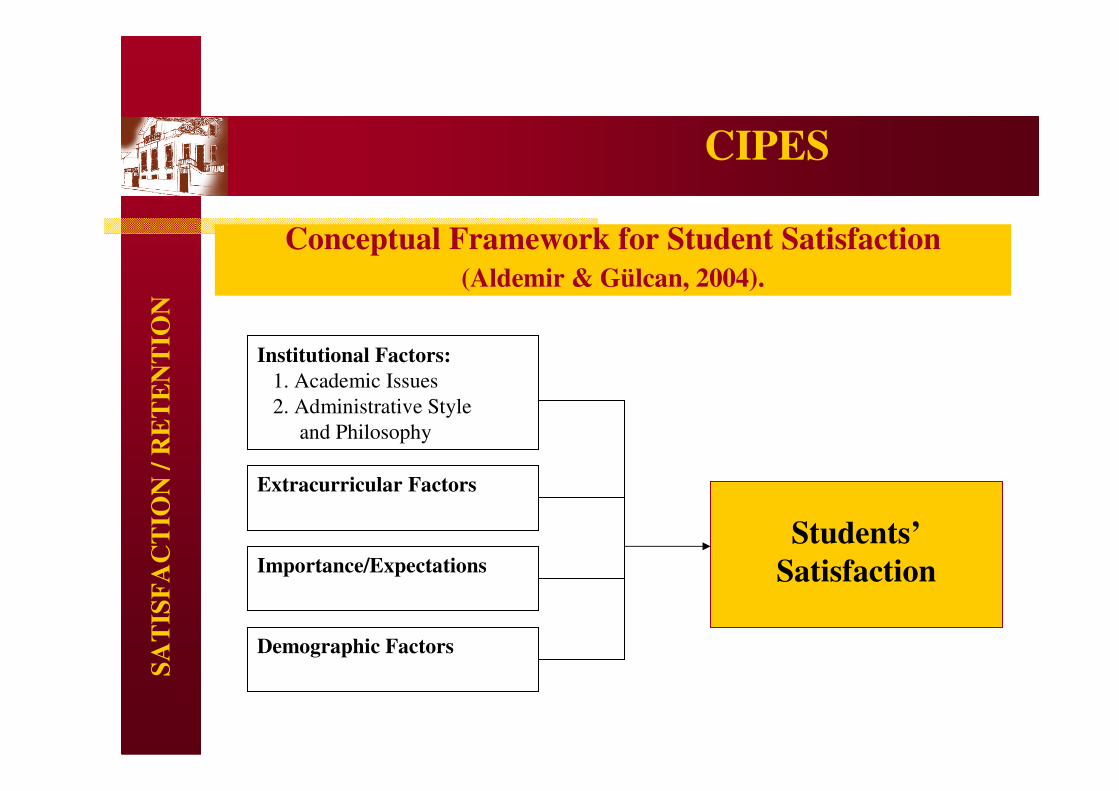
Conceptual Framework for Student Satisfaction
(Aldemir & Gülcan, 2004).
Institutional Factors:
1. Academic Issues
2. Administrative Style
and Philosophy
Extracurricular Factors
Importance/Expectations
Demographic Factors
Students’
Satisfaction
CIPESS
AT
ISF
AC
TIO
N /
RE
TE
NT
ION
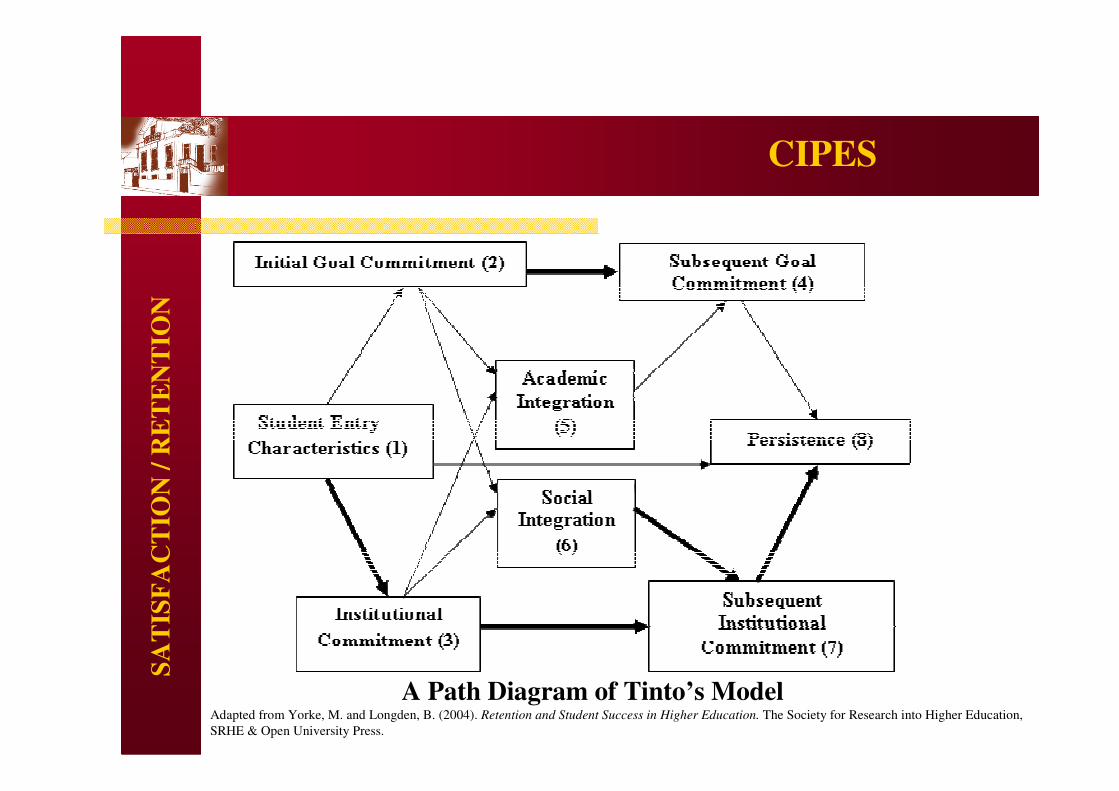
CIPES
A Path Diagram of Tinto’s ModelAdapted from Yorke, M. and Longden, B. (2004). Retention and Student Success in Higher Education. The Society for Research into Higher Education,
SRHE & Open University Press.
SA
TIS
FA
CT
ION
/ R
ET
EN
TIO
N
CIPESS
AT
ISF
AC
TIO
N /
RE
TE
NT
ION
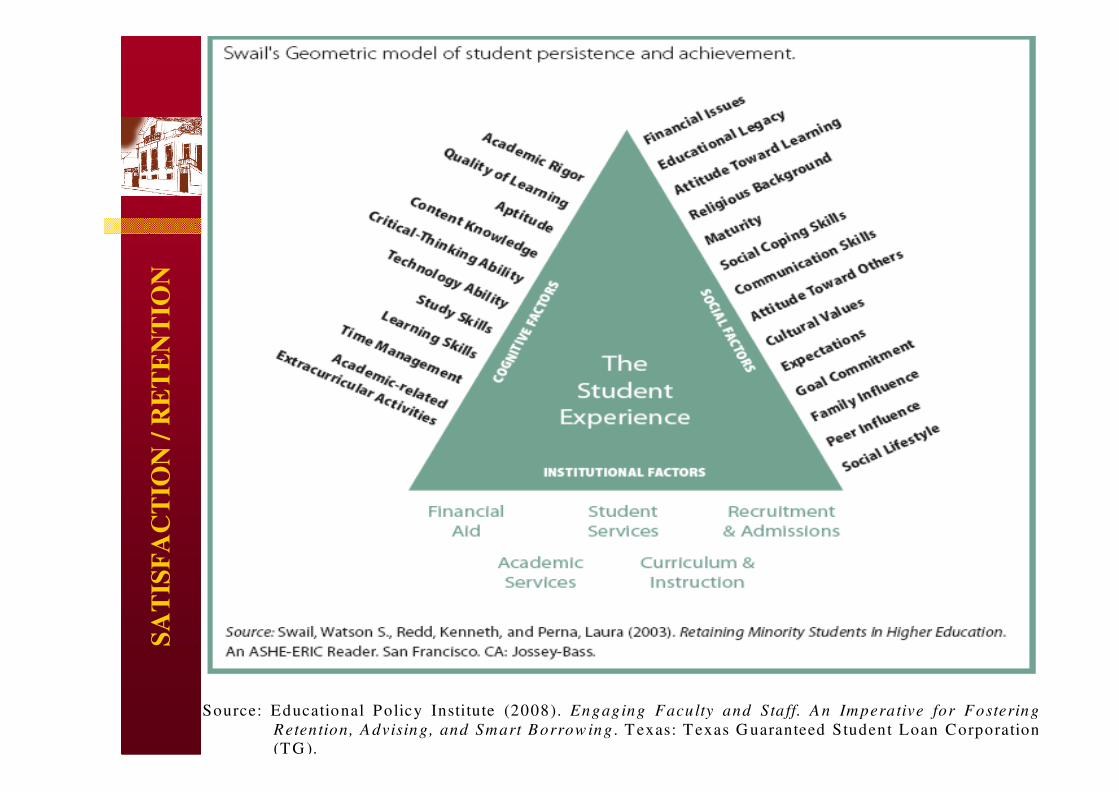
Swail’s Geometric model of student persistence and achievement
Source: Educational Policy Institute (2008). Engaging Faculty and Sta ff. An Im perative for Fostering
Retention, Advising, and Smart Borrow ing . T exas: T exas G uaranteed Student Loan Corporation
(T G ).
Student retention is the result of effective education.
We must focus on student learning and those
conditions that promote student learning. Student
success will follow (Tinto, 2004).
CIPESS
AT
ISF
AC
TIO
N /
RE
TE
NT
ION
CIPES
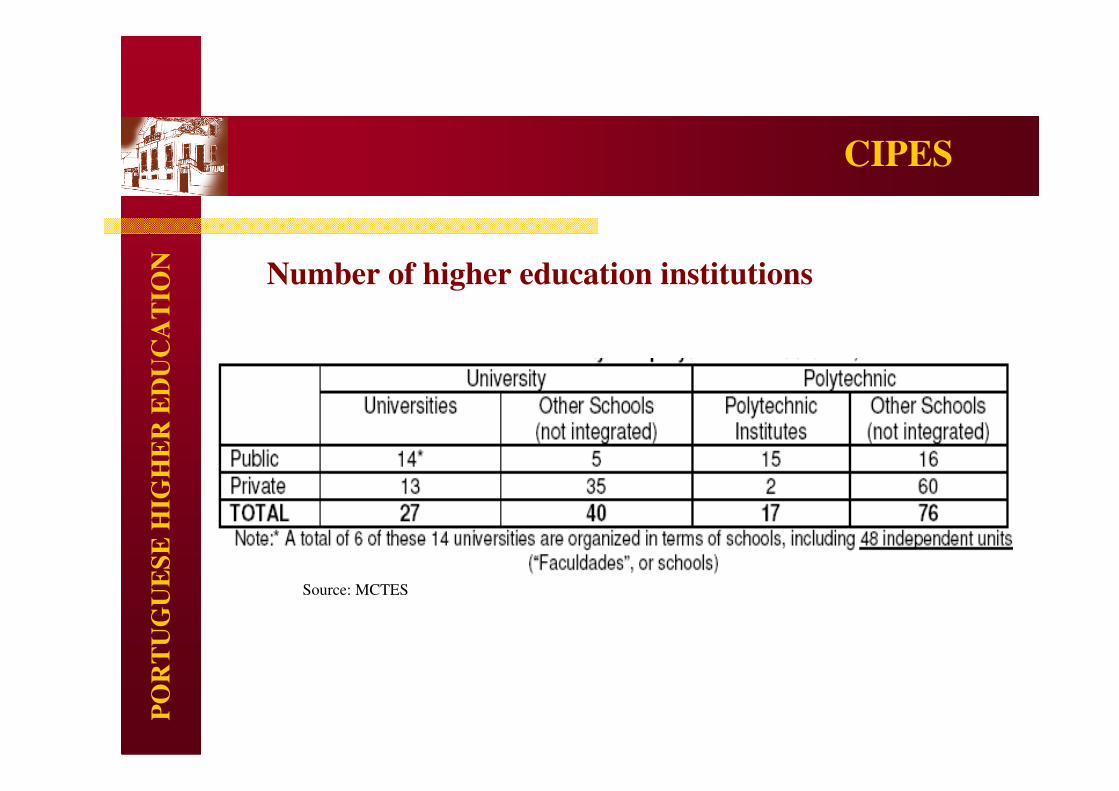
Number of higher education institutions
Source: MCTES
PO
RT
UG
UE
SE
HIG
HE
R E
DU
CA
TIO
N
CIPES
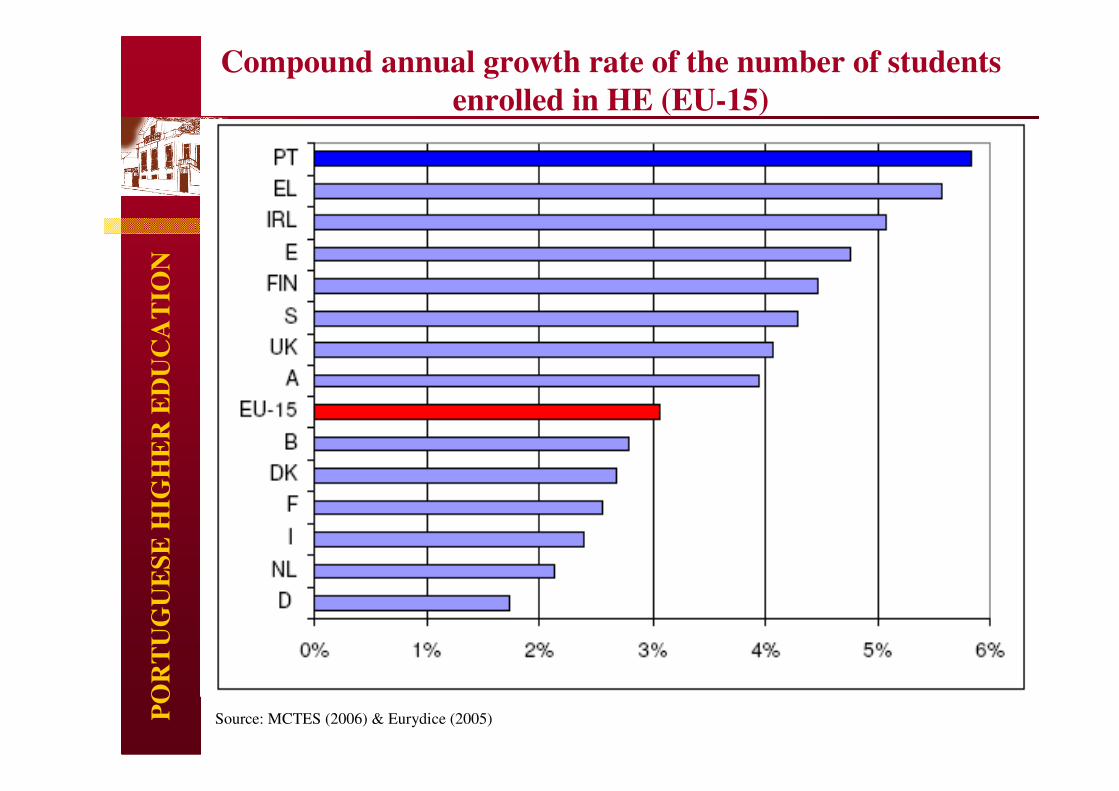
Compound annual growth rate of the number of students
enrolled in HE (EU-15)
Source: MCTES (2006) & Eurydice (2005)PO
RT
UG
UE
SE
HIG
HE
R E
DU
CA
TIO
N

CIPES
Evolution of the overall number of students
Source: MCTES (2006) & Eurydice (2005
PO
RT
UG
UE
SE
HIG
HE
R E
DU
CA
TIO
N
Of 31 developed countries around the world, Portugal
has the lowest average amount of education in the adult
population with 8+ years. No improvement is projected
through 2014 (OECD, 2006).
Only 1 in 10 Portuguese have a higher education
(MCTES, 2006).
Total enrollments have declined 3.8%. In the private
sector it is 7.7% (OECD, 2006).
In Portugal, 32% of all first-cycle students never
graduate (OECD, 2006).
CIPESP
OR
TU
GU
ES
E H
IGH
ER
ED
UC
AT
ION
(1) Which institutional and student factors affect
student success in Portuguese higher education
institutions?
(2) What is the relative level of satisfaction and
importance of these factors for clarifying student
success?
CIPES
Research Questions
ME
TH
OD
OL
OG
Y
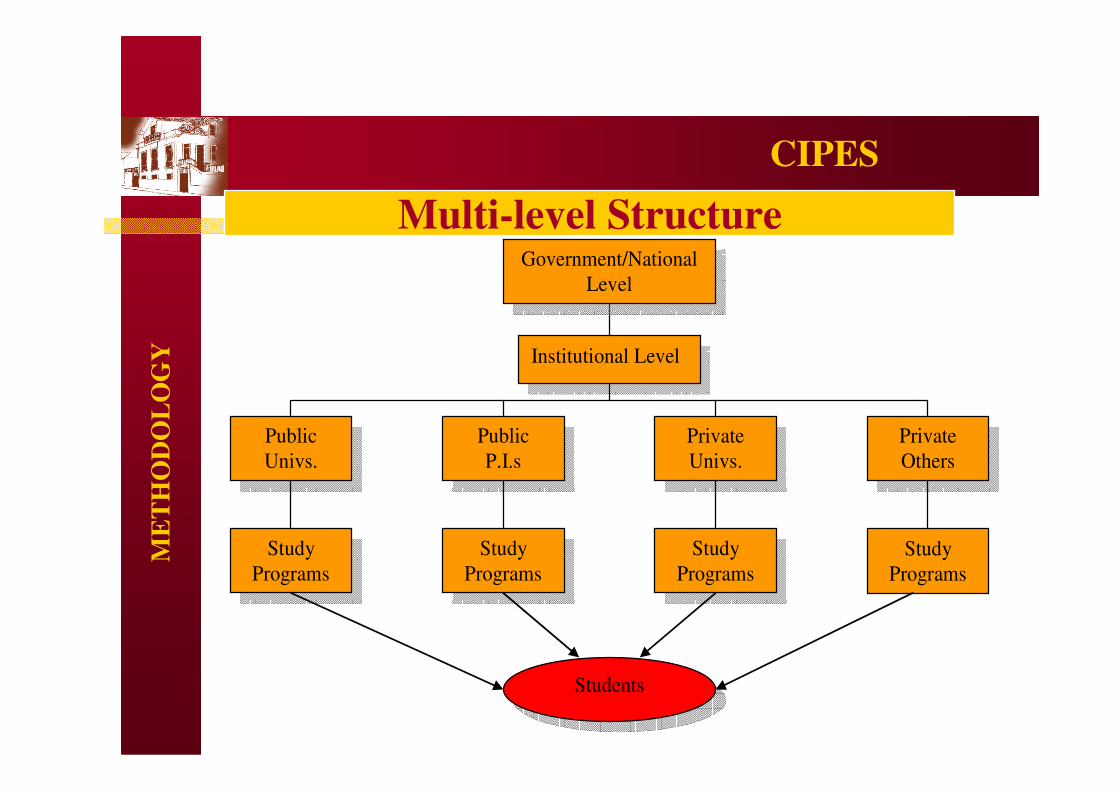
CIPES
Study
Programs
Institutional Level
Public
Univs.
Public
P.I.s
Private
Univs.
Study
Programs
Study
Programs
Study
Programs
Students
Private
Others
Government/National
Level
ME
TH
OD
OL
OG
Y
Multi-level Structure
CIPES
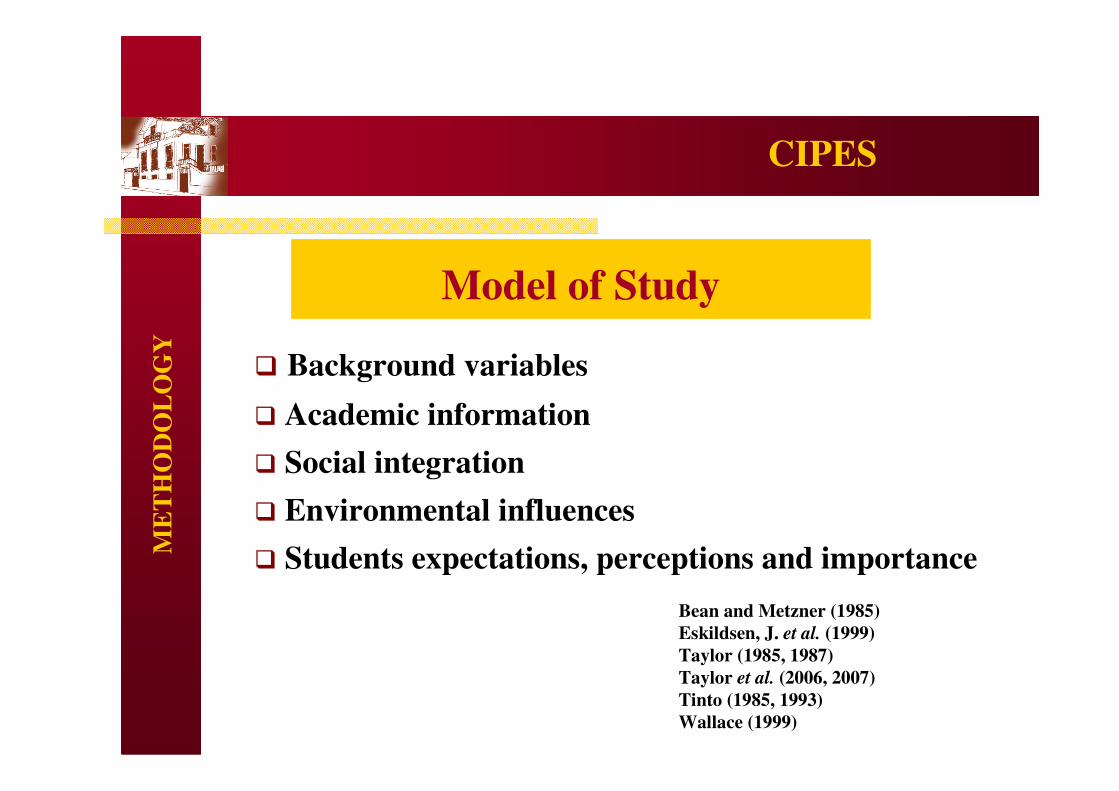
Model of Study
� Background variables
� Academic information
� Social integration
� Environmental influences
� Students expectations, perceptions and importance
Bean and Metzner (1985)
Eskildsen, J. et al. (1999)
Taylor (1985, 1987)
Taylor et al. (2006, 2007)
Tinto (1985, 1993)
Wallace (1999)
ME
TH
OD
OL
OG
Y
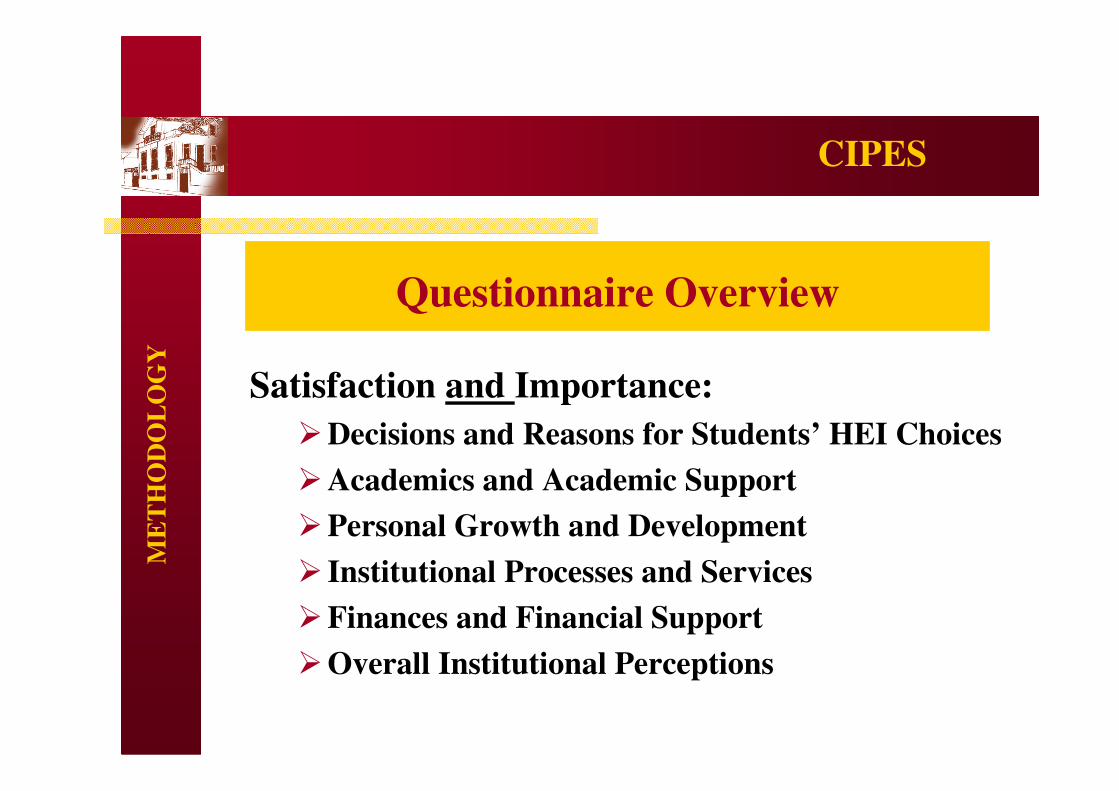
Satisfaction and Importance:
�Decisions and Reasons for Students’ HEI Choices
�Academics and Academic Support
�Personal Growth and Development
� Institutional Processes and Services
�Finances and Financial Support
�Overall Institutional Perceptions
CIPES
Questionnaire Overview
ME
TH
OD
OL
OG
Y
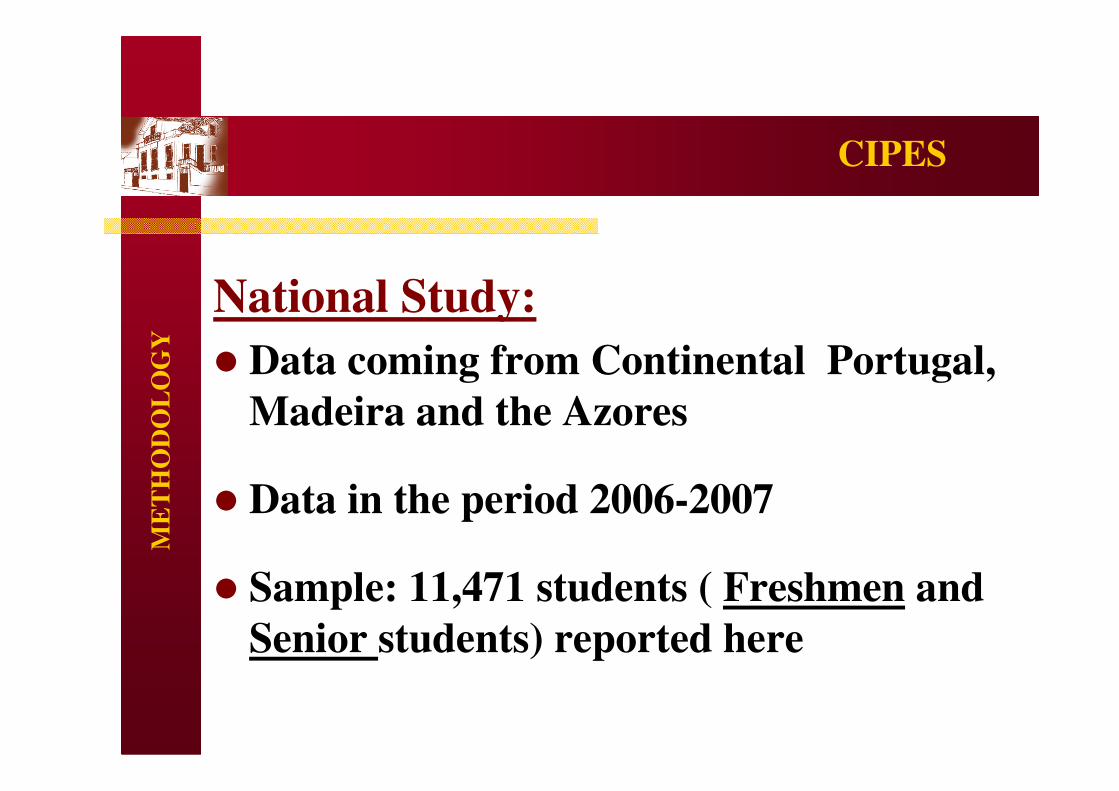
National Study:
� Data coming from Continental Portugal,
Madeira and the Azores
� Data in the period 2006-2007
� Sample: 11,471 students ( Freshmen and
Senior students) reported here
CIPESM
ET
HO
DO
LO
GY
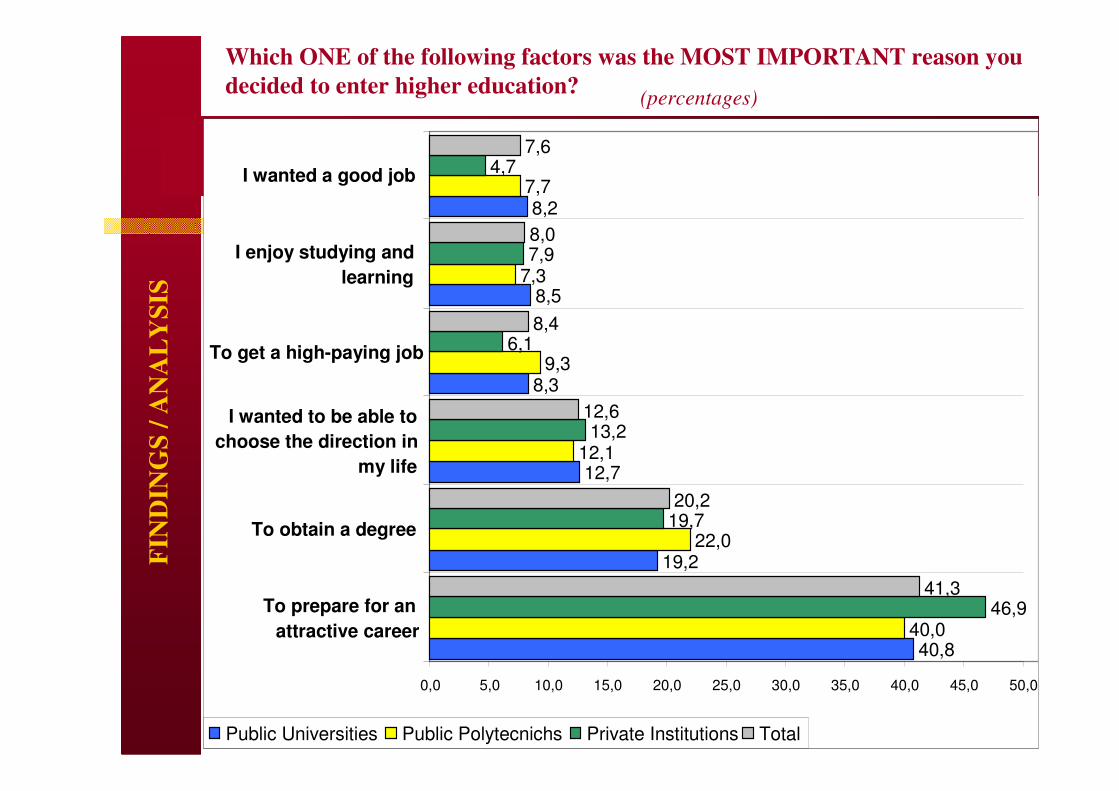
Which ONE of the following factors was the MOST IMPORTANT reason you
decided to enter higher education?(percentages)
FIN
DIN
GS
/ A
NA
LY
SIS
40,8
19,2
12,7
8,3
8,5
8,2
40,0
22,0
12,1
9,3
7,3
7,7
46,9
19,7
13,2
6,1
7,9
4,7
41,3
20,2
12,6
8,4
8,0
7,6
0,0 5,0 10,0 15,0 20,0 25,0 30,0 35,0 40,0 45,0 50,0
To prepare for an
attractive career
To obtain a degree
I wanted to be able to
choose the direction in
my life
To get a high-paying job
I enjoy studying and
learning
I wanted a good job
Public Universities Public Polytecnichs Private Institutions Total
CIPES
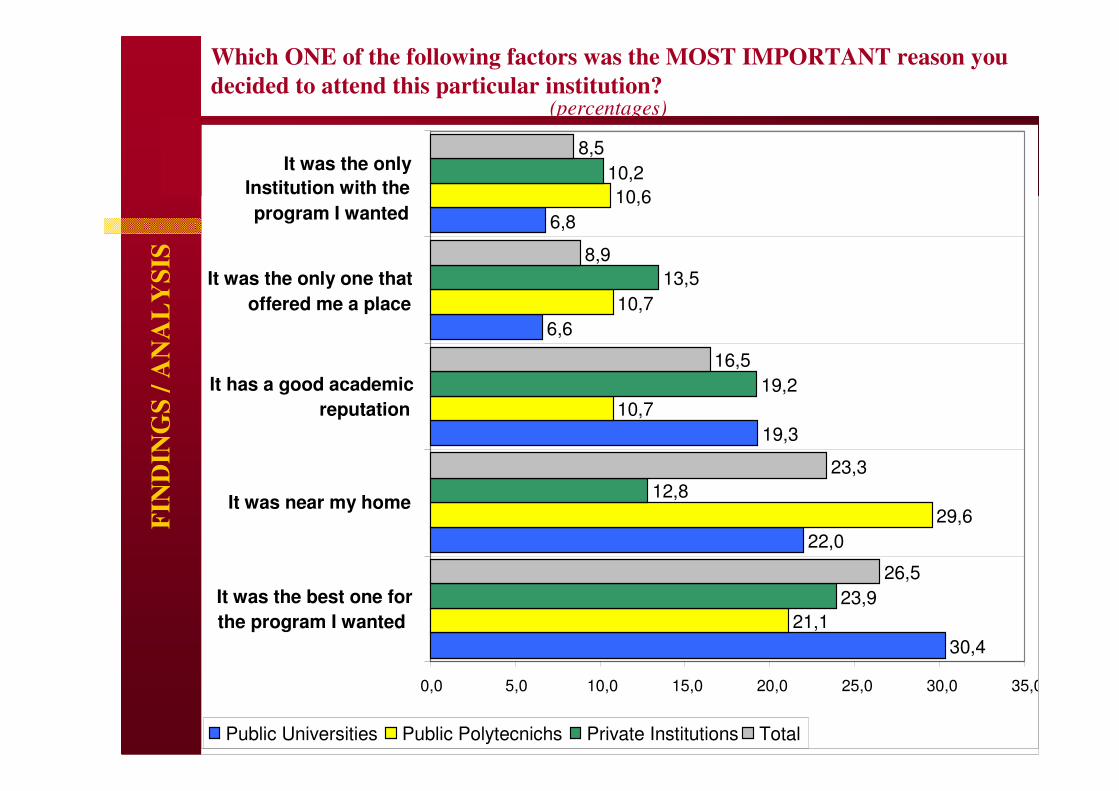
Which ONE of the following factors was the MOST IMPORTANT reason you
decided to attend this particular institution?(percentages)
FIN
DIN
GS
/ A
NA
LY
SIS
CIPES
30,4
22,0
19,3
6,6
6,8
21,1
29,6
10,7
10,7
10,6
23,9
12,8
19,2
13,5
10,2
26,5
23,3
16,5
8,9
8,5
0,0 5,0 10,0 15,0 20,0 25,0 30,0 35,0
It was the best one for
the program I wanted
It was near my home
It has a good academic
reputation
It was the only one that
offered me a place
Public Universities Public Polytecnichs Private Institutions Total
It was the only
Institution with the
program I wanted
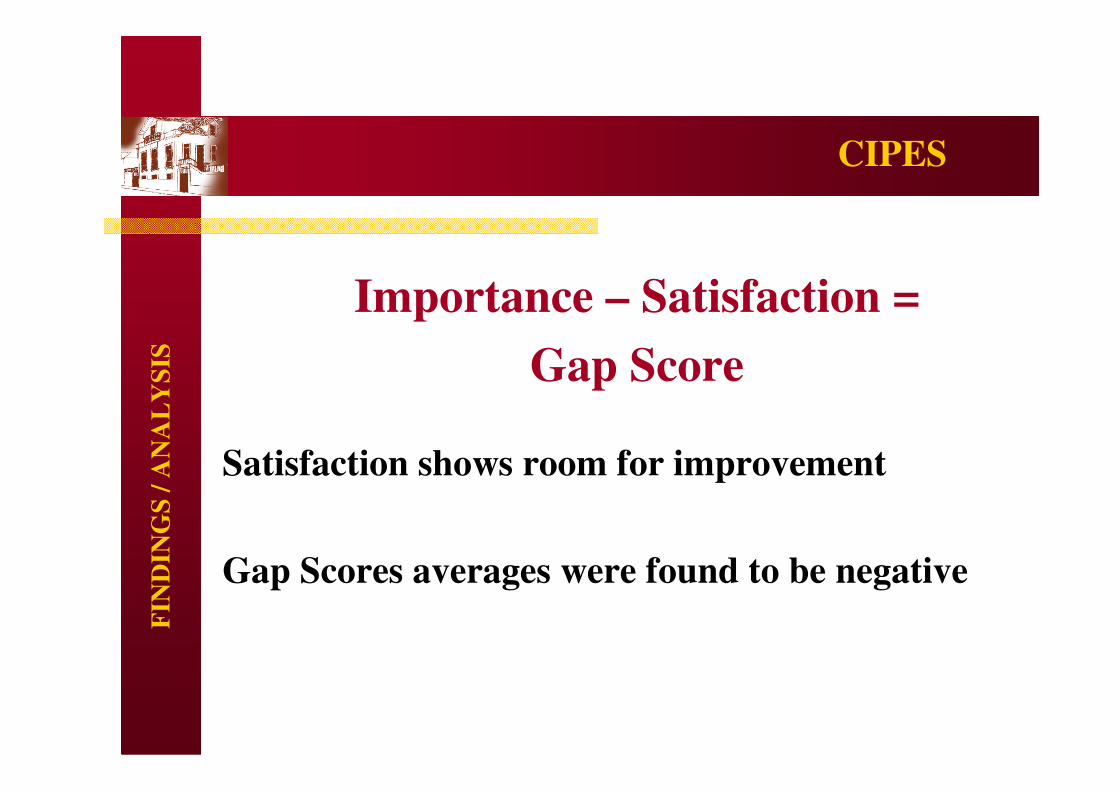
Importance – Satisfaction =
Gap Score
Satisfaction shows room for improvement
Gap Scores averages were found to be negative
CIPESF
IND
ING
S /
AN
AL
YS
IS

FIN
DIN
GS
/ A
NA
LY
SIS
(means)
Public Universities
0
1
2
3
4
5
6
7
8
9
10
Quality of
teaching
Quality of
courses
taken
Knowledge
gained from
courses
Relevance
of courses
Quality of
academic
advising
Variety of
optional
courses
Interactions
with faculty
out of class
Knowledge
assessment
Importance: 0=Not important at all; 10=Extremely important
Satisfaction: 0=Extremely unsatisfied; 10=Extremely satisfied
Importance Satisfaction Centre of scale
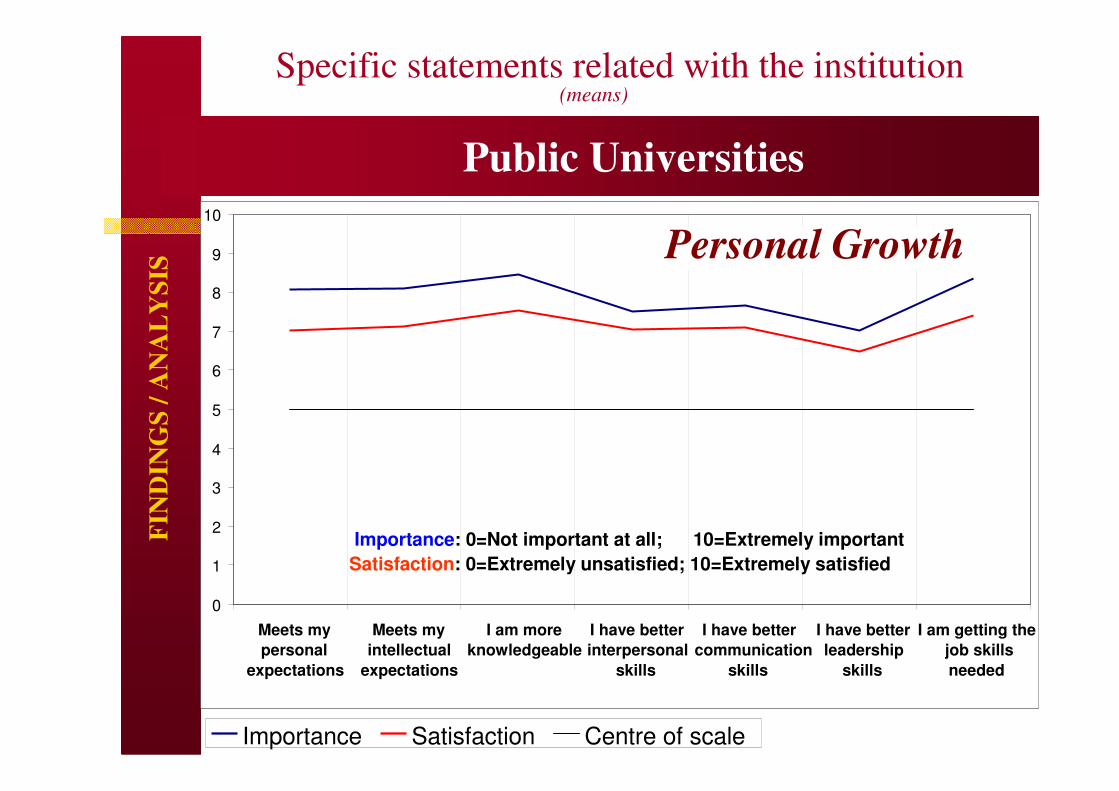
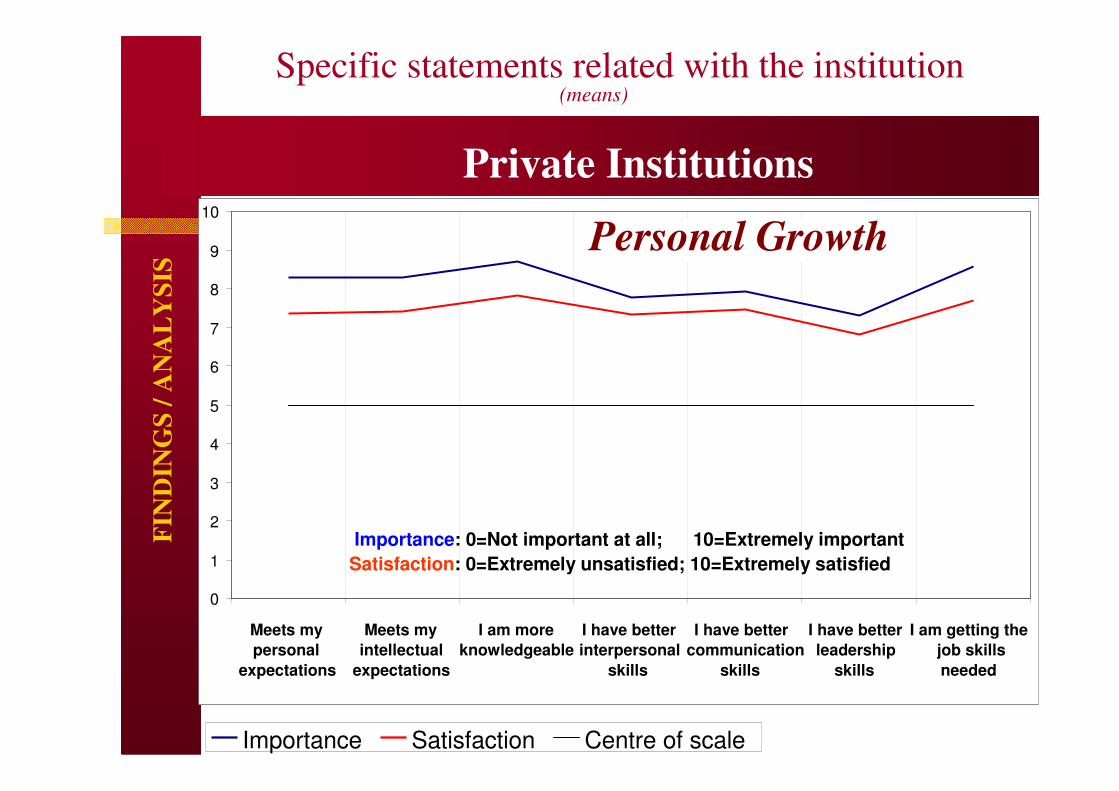
Specific statements related with the institution
Academics

FIN
DIN
GS
/ A
NA
LY
SIS
(means)
Public Polytechnics
0
1
2
3
4
5
6
7
8
9
10
Importance Satisfaction Centre of scale
Quality of
teaching
Quality of
courses
taken
Knowledge
gained from
courses
Relevance
of courses
Quality of
academic
advising
Variety of
optional
courses
Interactions
with faculty
out of class
Knowledge
assessment
Importance: 0=Not important at all; 10=Extremely important
Satisfaction: 0=Extremely unsatisfied; 10=Extremely satisfied
Specific statements related with the institution
Academics

FIN
DIN
GS
/ A
NA
LY
SIS
(means)
Private Institutions
0
1
2
3
4
5
6
7
8
9
10
offered
Quality of
teaching
Quality of
courses
taken
Knowledge
gained from
courses
Relevance
of courses
Quality of
academic
advising
Variety of
optional
courses
Interactions
with faculty
out of class
Knowledge
assessment
Importance Satisfaction Centre of scale
Importance: 0=Not important at all; 10=Extremely important
Satisfaction: 0=Extremely unsatisfied; 10=Extremely satisfied
Specific statements related with the institution
Academics
FIN
DIN
GS
/ A
NA
LY
SIS
Specific statements related with the institution
Public Universities
Importance Satisfaction Centre of scale
(means)
0
1
2
3
4
5
6
7
8
9
10
Meets my
personal
expectations
Meets my
intellectual
expectations
I am more
knowledgeable
I have better
interpersonal
skills
I have better
communication
skills
I have better
leadership
skills
I am getting the
job skills
needed
Importance: 0=Not important at all; 10=Extremely important
Satisfaction: 0=Extremely unsatisfied; 10=Extremely satisfied
Personal Growth

FIN
DIN
GS
/ A
NA
LY
SIS
Specific statements related with the institution
Importance Satisfaction Centre of scale
Public Polytechnics
(means)
0
1
2
3
4
5
6
7
8
9
10
Meets my
personal
expectations
Meets my
intellectual
expectations
I am more
knowledgeable
I have better
interpersonal
skills
I have better
communication
skills
I have better
leadership
skills
I am getting the
job skills
needed
Importance: 0=Not important at all; 10=Extremely important
Satisfaction: 0=Extremely unsatisfied; 10=Extremely satisfied
Personal Growth
FIN
DIN
GS
/ A
NA
LY
SIS
Specific statements related with the institution
Importance Satisfaction Centre of scale
Private Institutions
(means)
0
1
2
3
4
5
6
7
8
9
10
Meets my
personal
expectations
Meets my
intellectual
expectations
I am more
knowledgeable
I have better
interpersonal
skills
I have better
communication
skills
I have better
leadership
skills
I am getting the
job skills
needed
Importance: 0=Not important at all; 10=Extremely important
Satisfaction: 0=Extremely unsatisfied; 10=Extremely satisfied
Personal Growth

How important do you regard and what is your degree of satisfaction with the following factors (averages)
FIN
DIN
GS
/ A
NA
LY
SIS
Public Universities
0
1
2
3
4
5
6
7
8
9
10
Your course of study Your institution The employability ofYour course of study
The social prestige ofyour course of study
Importance: 0=Not important at all; 10=Extremely important
Satisfaction: 0=Extremely unsatisfied; 10=Extremely satisfied
Importance Satisfaction Centre of scale
FIN
DIN
GS
/ A
NA
LY
SIS
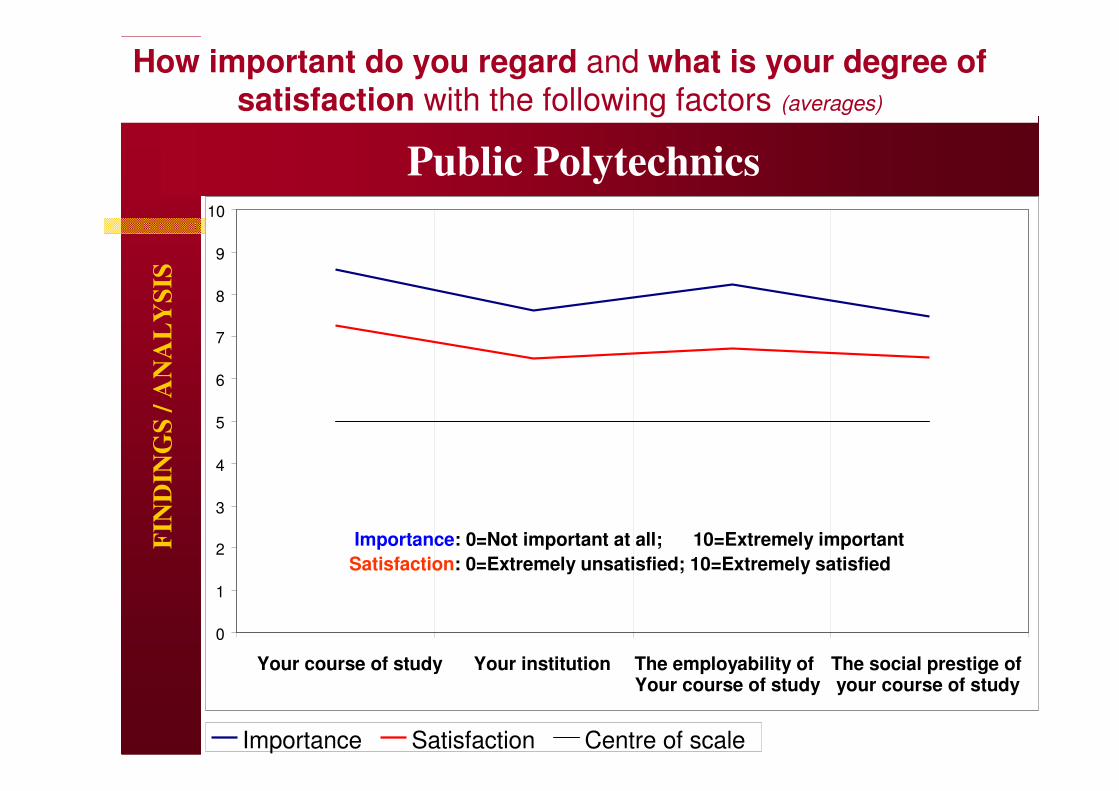
Importance Satisfaction Centre of scale
Public Polytechnics
0
1
2
3
4
5
6
7
8
9
10
Your course of study Your institution The employability ofYour course of study
The social prestige ofyour course of study
Importance: 0=Not important at all; 10=Extremely important
Satisfaction: 0=Extremely unsatisfied; 10=Extremely satisfied
How important do you regard and what is your degree of satisfaction with the following factors (averages)

FIN
DIN
GS
/ A
NA
LY
SIS
Importance Satisfaction Centre of scale
Private Institutions
0
1
2
3
4
5
6
7
8
9
10
Your course of study Your institution The employability ofYour course of study
The social prestige ofyour course of study
Importance: 0=Not important at all; 10=Extremely important
Satisfaction: 0=Extremely unsatisfied; 10=Extremely satisfied
How important do you regard and what is your degree of satisfaction with the following factors (averages)
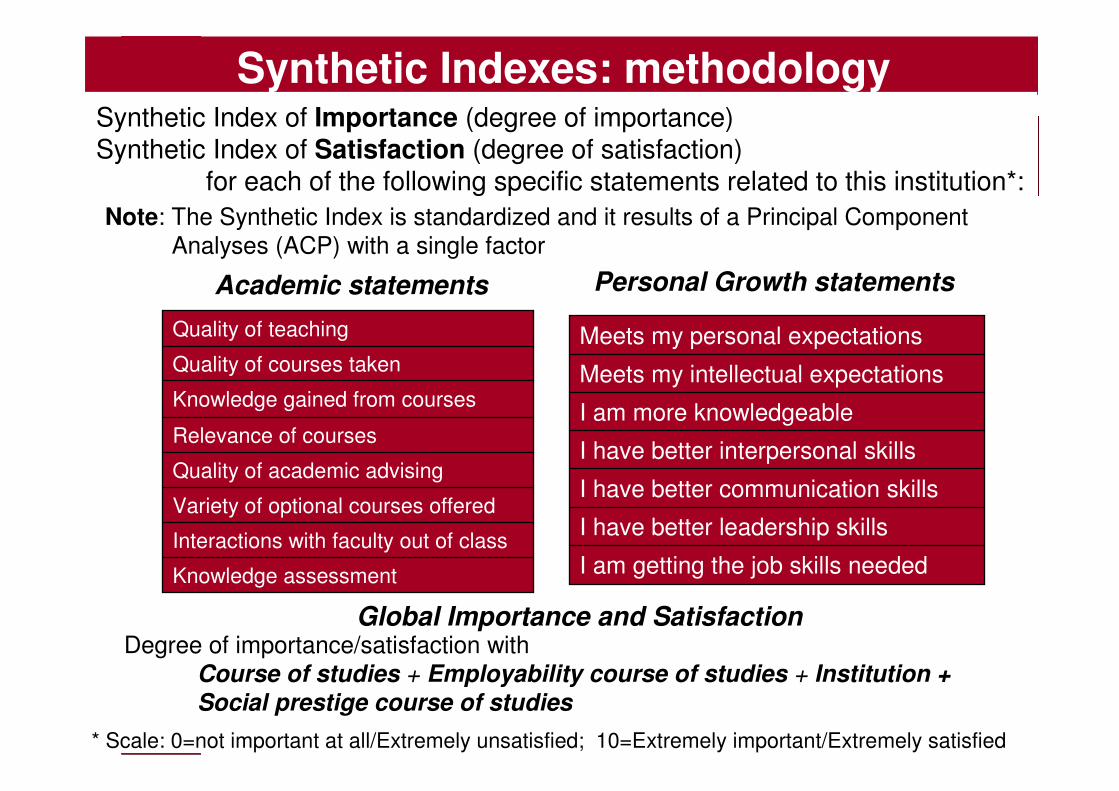
Synthetic Indexes: methodology
Academic statements
Knowledge assessment
Interactions with faculty out of class
Variety of optional courses offered
Quality of academic advising
Relevance of courses
Knowledge gained from courses
Quality of courses taken
Quality of teaching
Personal Growth statements
I am getting the job skills needed
I have better leadership skills
I have better communication skills
I have better interpersonal skills
I am more knowledgeable
Meets my intellectual expectations
Meets my personal expectations
Global Importance and SatisfactionDegree of importance/satisfaction with
Course of studies + Employability course of studies + Institution +Social prestige course of studies
Synthetic Index of Importance (degree of importance)Synthetic Index of Satisfaction (degree of satisfaction)
for each of the following specific statements related to this institution*:
* Scale: 0=not important at all/Extremely unsatisfied; 10=Extremely important/Extremely satisfied
Note: The Synthetic Index is standardized and it results of a Principal Component
Analyses (ACP) with a single factor

CIPES(averages of standardized values)
* Cronbach’s Alpha: 0,88; Explained variance: 58,2% ** Cronbach’s Alpha: 0,90; Explained variance: 61,9%
FIN
DIN
GS
/ A
NA
LY
SIS
Synthetic Index of Importance* and Satisfaction**with Academic statements
-0,10
-0,08
-0,05
-0,03
0,00
0,03
0,05
0,08
0,10
0,13
0,15
Average
Education
Sciences
Arts and
Humanities
Social
Sciences,
Commerce
and Law
Sciences,
Mathematics
and
Informatics
Engineering,
Transforming
Industries
and
Construction
Agriculture Health and
Social
Protection
Services
Synthetic Index of Importance Synthetic Index of Satisfaction
r=0,542;p=0,000
CIPES(averages of standardized values)
* Cronbach’s Alpha: 0,90; Explained variance: 63,6% ** Cronbach’s Alpha: 0,93; Explained variance: 72,1%
FIN
DIN
GS
/ A
NA
LY
SIS
Synthetic Index of Importance* and Satisfaction**with Personal Growth statements
-0,18
-0,15
-0,13
-0,10
-0,08
-0,05
-0,03
0,00
0,03
0,05
0,08
0,10
0,13
0,15
Average
Education
Sciences
Arts and
Humanities
Social
Sciences,
Commerce
and Law
Sciences,
Mathematics
and
Informatics
Engineering,
Transforming
Industries
and
Construction
Agriculture Health and
Social
Protection
Services
Synthetic Index of Importance Synthetic Index of Satisfaction
r=0,522;p=0,000
CIPES
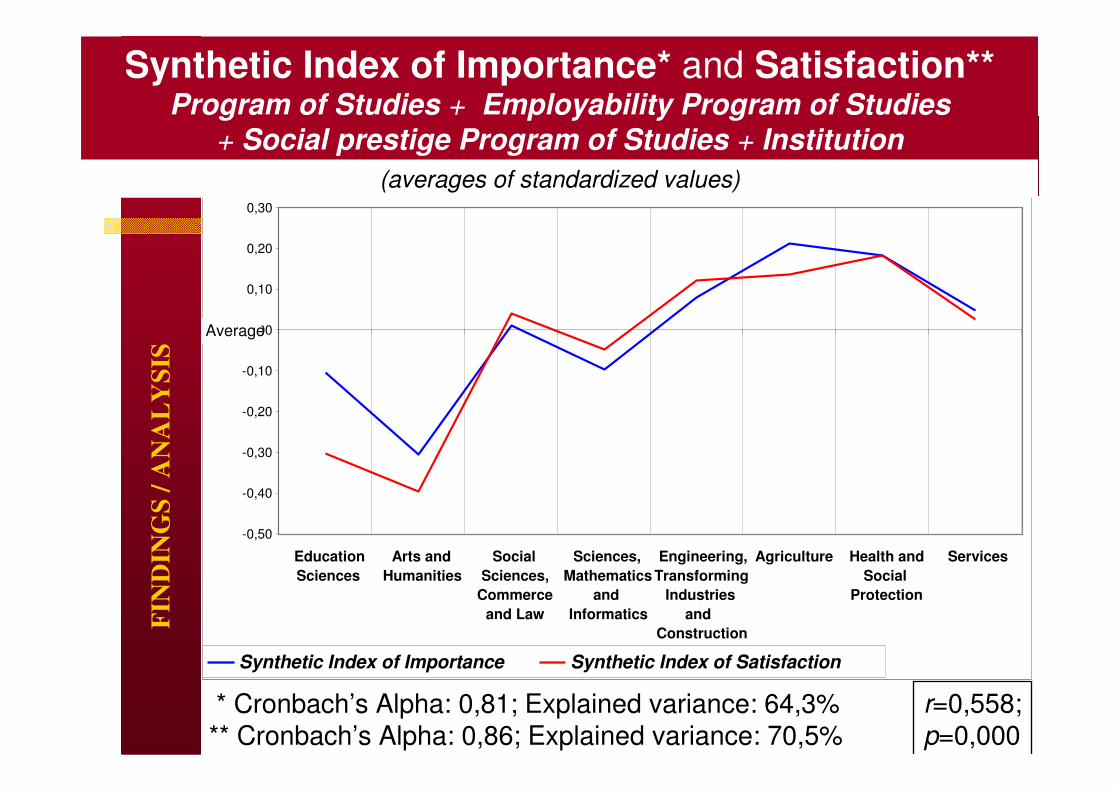
Synthetic Index of Importance* and Satisfaction**Program of Studies + Employability Program of Studies
+ Social prestige Program of Studies + Institution
* Cronbach’s Alpha: 0,81; Explained variance: 64,3% ** Cronbach’s Alpha: 0,86; Explained variance: 70,5%
FIN
DIN
GS
/ A
NA
LY
SIS
-0,50
-0,40
-0,30
-0,20
-0,10
0,00
0,10
0,20
0,30
Education
Sciences
Arts and
Humanities
Social
Sciences,
Commerce
and Law
Sciences,
Mathematics
and
Informatics
Engineering,
Transforming
Industries
and
Construction
Agriculture Health and
Social
Protection
Services
Synthetic Index of Importance Synthetic Index of Satisfaction
Average
(averages of standardized values)
r=0,558;p=0,000
(averages of standardized values)
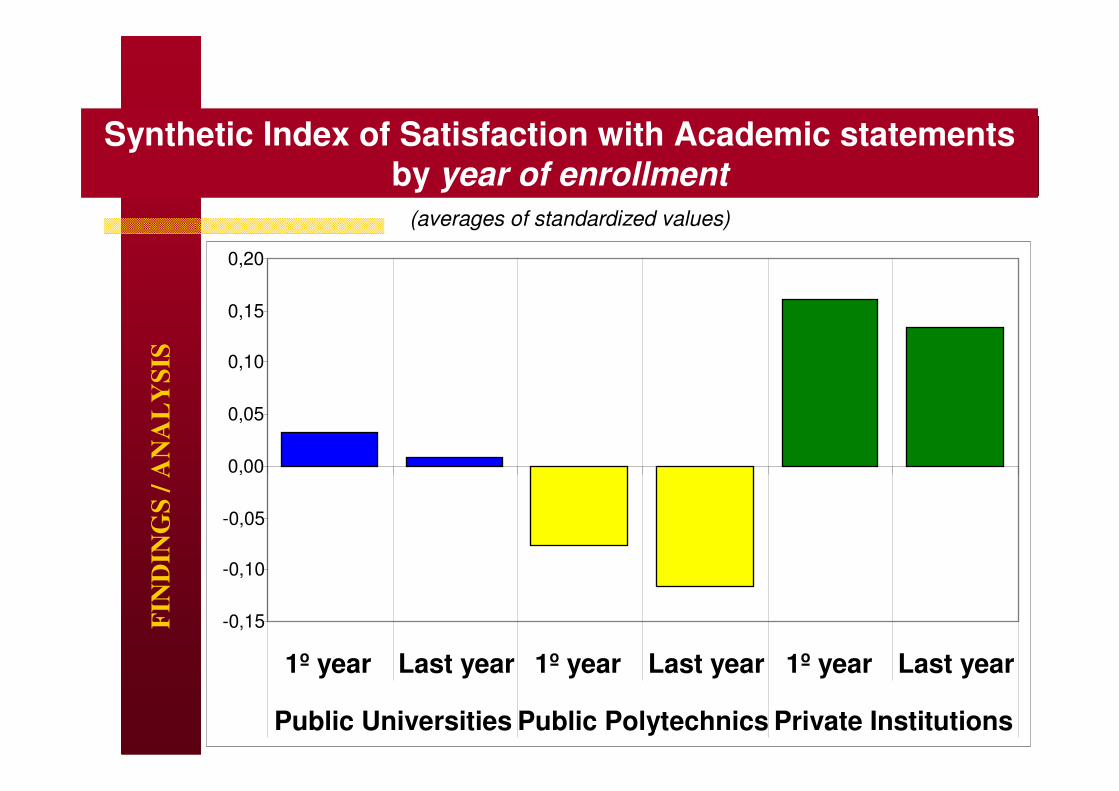
Synthetic Index of Satisfaction with Academic statements
by year of enrollmentF
IND
ING
S /
AN
AL
YS
IS
-0,15
-0,10
-0,05
0,00
0,05
0,10
0,15
0,20
1º year Last year 1º year Last year 1º year Last year
Public Universities Public Polytechnics Private Institutions
(averages of standardized values)
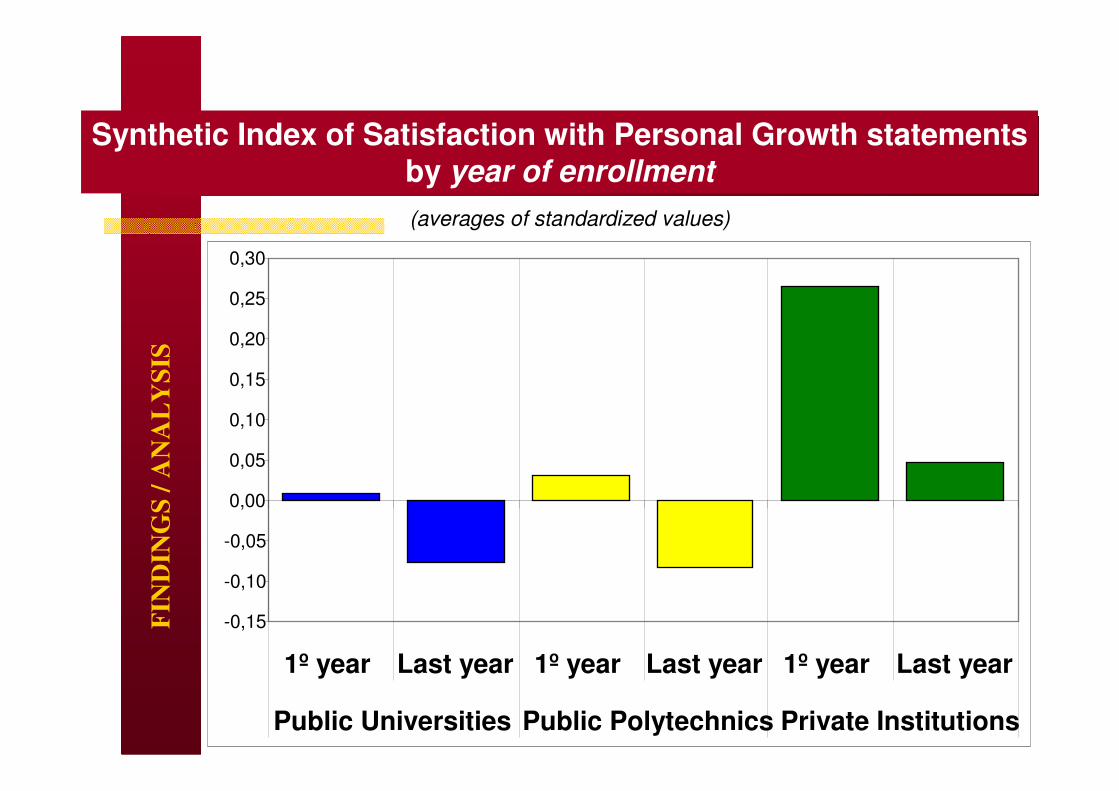
Synthetic Index of Satisfaction with Personal Growth statementsby year of enrollment
FIN
DIN
GS
/ A
NA
LY
SIS
-0,15
-0,10
-0,05
0,00
0,05
0,10
0,15
0,20
0,25
0,30
1º year Last year 1º year Last year 1º year Last year
Public Universities Public Polytechnics Private Institutions
(averages of standardized values)
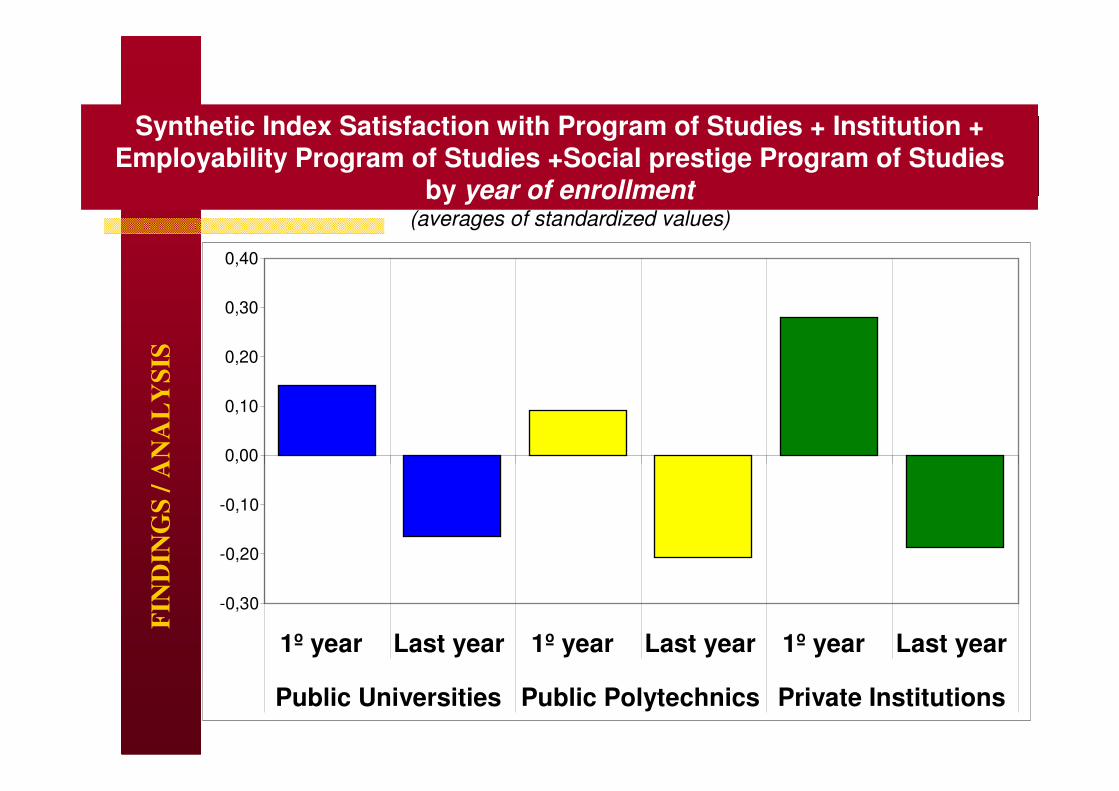
Synthetic Index Satisfaction with Program of Studies + Institution +Employability Program of Studies +Social prestige Program of Studies
by year of enrollmentF
IND
ING
S /
AN
AL
YS
IS
-0,30
-0,20
-0,10
0,00
0,10
0,20
0,30
0,40
1º year Last year 1º year Last year 1º year Last year
Public Universities Public Polytechnics Private Institutions
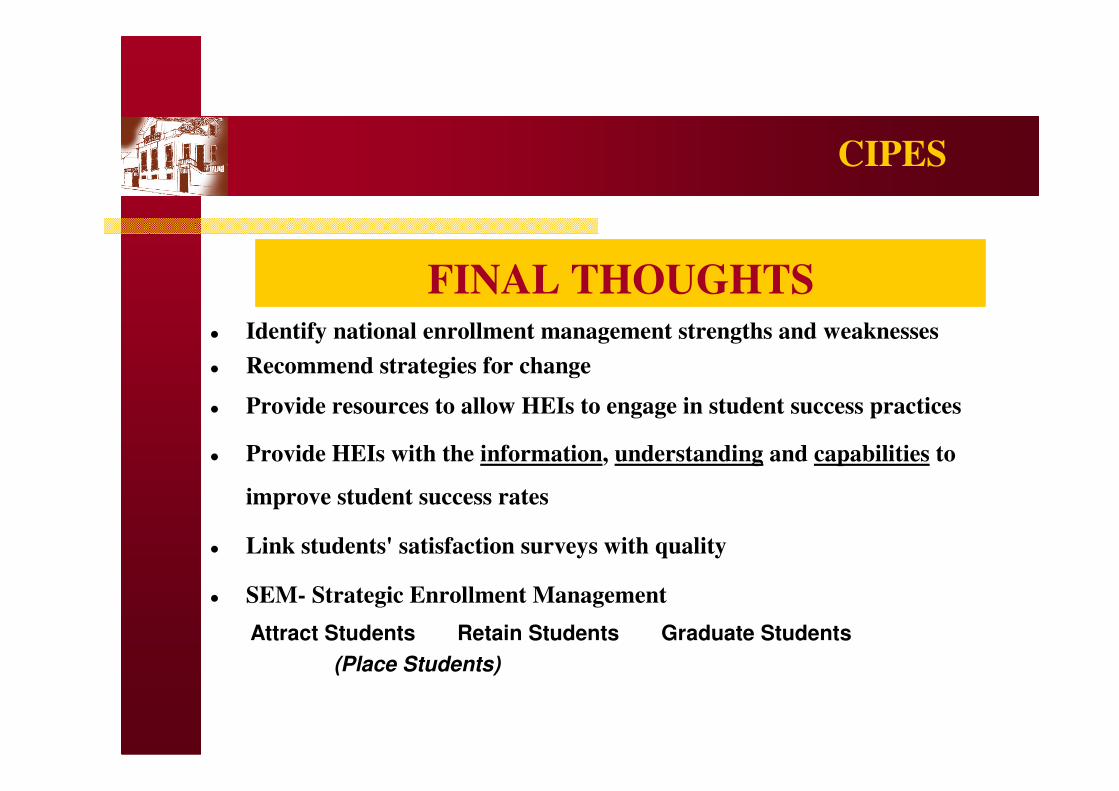
� Identify national enrollment management strengths and weaknesses
� Recommend strategies for change
� Provide resources to allow HEIs to engage in student success practices
� Provide HEIs with the information, understanding and capabilities to
improve student success rates
� Link students' satisfaction surveys with quality
� SEM- Strategic Enrollment Management
Attract Students Retain Students Graduate Students
(Place Students)
CIPES
FINAL THOUGHTS

CIPES
QUESTIONS
AND
DISCUSSIONS
CIPES
A
N
S
E
E
S
THANK YOU
Maria de Lourdes Maria de Lourdes MachadoMachado--TaylorTaylor, , CIPES (CIPES (CenterCenter for Research in Higher Education Policies), for Research in Higher Education Policies),
PORTUGAL PORTUGAL
Rui BritesRui Brites, ISCTE , ISCTE –– BusinessBusiness SchoolSchool, PORTUGAL, PORTUGAL
AntAntóónionio MagalhãesMagalhães, Porto University and CIPES (, Porto University and CIPES (CenterCenter for Research in Higher Education Policies), for Research in Higher Education Policies),
PORTUGALPORTUGAL