Center for Latin American Social Policy - rand.org · A RAND LABOR AND POPULATION CENTER Center for...
39
A RAND LABOR AND POPULATION CENTER Center for Latin American Social Policy For More Information Visit RAND at www.rand.org Explore RAND Center for Latin American Social Policy View document details Support RAND Browse Reports & Bookstore Make a charitable contribution Limited Electronic Distribution Rights is document and trademark(s) contained herein are protected by law as indicated in a notice appearing later in this work. is electronic representation of RAND intellectual property is provided for non- commercial use only. Unauthorized posting of RAND electronic documents to a non-RAND website is prohibited. RAND electronic documents are protected under copyright law. Permission is required from RAND to reproduce, or reuse in another form, any of our research documents for commercial use. For information on reprint and linking permissions, please see RAND Permissions. Skip all front matter: Jump to Page 16 e RAND Corporation is a nonprofit institution that helps improve policy and decisionmaking through research and analysis. is electronic document was made available from www.rand.org as a public service of the RAND Corporation. CHILDREN AND FAMILIES EDUCATION AND THE ARTS ENERGY AND ENVIRONMENT HEALTH AND HEALTH CARE INFRASTRUCTURE AND TRANSPORTATION INTERNATIONAL AFFAIRS LAW AND BUSINESS NATIONAL SECURITY POPULATION AND AGING PUBLIC SAFETY SCIENCE AND TECHNOLOGY TERRORISM AND HOMELAND SECURITY
Transcript of Center for Latin American Social Policy - rand.org · A RAND LABOR AND POPULATION CENTER Center for...
A RAND LABOR AND POPULATION CENTER
Center for Latin American Social Policy
For More InformationVisit RAND at www.rand.org
Explore RAND Center for Latin American Social Policy
View document details
Support RANDBrowse Reports & Bookstore
Make a charitable contribution
Limited Electronic Distribution RightsThis document and trademark(s) contained herein are protected by law as indicated in a notice appearing later in this work. This electronic representation of RAND intellectual property is provided for non-commercial use only. Unauthorized posting of RAND electronic documents to a non-RAND website is prohibited. RAND electronic documents are protected under copyright law. Permission is required from RAND to reproduce, or reuse in another form, any of our research documents for commercial use. For information on reprint and linking permissions, please see RAND Permissions.
Skip all front matter: Jump to Page 16
The RAND Corporation is a nonprofit institution that helps improve policy and decisionmaking through research and analysis.
This electronic document was made available from www.rand.org as a public service of the RAND Corporation.
CHILDREN AND FAMILIES
EDUCATION AND THE ARTS
ENERGY AND ENVIRONMENT
HEALTH AND HEALTH CARE
INFRASTRUCTURE AND TRANSPORTATION
INTERNATIONAL AFFAIRS
LAW AND BUSINESS
NATIONAL SECURITY
POPULATION AND AGING
PUBLIC SAFETY
SCIENCE AND TECHNOLOGY
TERRORISM AND HOMELAND SECURITY
This product is part of the RAND Corporation technical report series. Reports may include research findings on a specific topic that is limited in scope; present discussions of the methodology employed in research; provide literature reviews, survey instru-ments, modeling exercises, guidelines for practitioners and research professionals, and supporting documentation; or deliver preliminary findings. All RAND reports un-dergo rigorous peer review to ensure that they meet high standards for research quality and objectivity.
A RAND LABOR AND POPULATION CENTER
Center for Latin American Social Policy
TECHNICAL REPORT
Geographic Targeting in Urban Areas: A Social Welfare Program for Older People in Mexico
Emma Aguila • Arie Kapteyn • Nelly Mejia • Rosalba Robles • Oscar Vargas • Beverly A. Weidmer
Sponsored by the Government of the State of Yucatan and the National Institute on Aging
The RAND Corporation is a nonprofit institution that helps improve policy and decisionmaking through research and analysis. RAND’s publications do not necessarily reflect the opinions of its research clients and sponsors.
R® is a registered trademark.
© Copyright 2014 RAND Corporation
Permission is given to duplicate this document for personal use only, as long as it is unaltered and complete. Copies may not be duplicated for commercial purposes. Unauthorized posting of RAND documents to a non-RAND website is prohibited. RAND documents are protected under copyright law. For information on reprint and linking permissions, please visit the RAND permissions page (http://www.rand.org/publications/ permissions.html).
Published 2013 by the RAND Corporation1776 Main Street, P.O. Box 2138, Santa Monica, CA 90407-2138
1200 South Hayes Street, Arlington, VA 22202-50504570 Fifth Avenue, Suite 600, Pittsburgh, PA 15213-2665
RAND URL: http://www.rand.org/To order RAND documents or to obtain additional information, contact
Distribution Services: Telephone: (310) 451-7002; Fax: (310) 451-6915; Email: [email protected]
Title page photo courtesy of Mariana Musi.
The research described in this report was made possible with funding from the government of the state of Yucatan, the U.S. National Institute on Aging (NIA) (through grants R01AG035008, P01AG022481, and R21AG033312), the RAND Center for the Study of Aging (with grant P30AG012815 from NIA), RAND Labor and Population, and the RAND Center for Latin American Social Policy (CLASP).
iii
Preface
In 2007, the government of Yucatan, Mexico, and the RAND Corporation established a collaborative agreement to design and implement a noncontributory pension program and simultaneously evaluate it through a longitudinal study, Escuchar. The noncontributory pen-sions were given to adults age 70 and older who met eligibility criteria (including age, place of residence, and lack of other pension or government support). The work was developed in phases. Phases I and II, Reconocer Rural, included 26 localities of fewer than 20,000 inhabit-ants each. Phase III, Reconocer Urbano, expanded the program to two cities with more than 20,000 inhabitants each. The first of the two cities, Valladolid, began the program in late 2008; the second, Merida, began it in 2009. Further information about these programs and their evaluation is available in Aguila, Kapteyn, et al. (forthcoming) and Aguila, Borges, et al. (forthcoming).
In this report, we describe the administration and results of two surveys in Merida, a social observation and a local observation designed to measure socioeconomic characteristics by geographic unit. In particular, we discuss application of observation instruments in May and June 2009 to 112 blocks for 22 basic geostatistical areas (áreas geoestadística básica, or AGEBs) to create a social-gap index. Our goal is to compare the results of the social-gap index based on local and social observations at the block level with other marginalization and social-gap rates used to target social welfare programs in Mexico and to assess the feasibility of target-ing delivery of noncontributory pensions for older persons who live in urban areas.
This research was conducted by the RAND Center for Latin American Social Policy (CLASP) and made possible with funds from the government of the state of Yucatan; the National Institute on Aging (NIA) (through grants R01AG035008, P01AG022481, and R21AG033312); the RAND Center for the Study of Aging (with grant P30AG012815 from NIA); RAND Labor and Population; and CLASP. Four Mexican institutions are collaborat-ing on the program: the National Institute for Statistics and Geography (Instituto Nacional de Estadística y Geografía), National Population Council (Consejo Nacional de Población), the Yucatan State Population Council (Consejo Estatal de Población de Yucatán, or COESPO), and the Mexican National Council for Evaluation of Social Development Policies (Consejo Nacional de Evaluación de la Política de Desarrollo Social). The project is also supported by an international advisory board of experts affiliated with the Autonomous University of Yucatan (Universidad Autónoma de Yucatán), Center of Investigation and Advanced Studies of the National Polytechnic Institute (Centro de Investigación y de Estudios Avanzados del Insti-tuto Politécnico Nacional) Merida Unit, University College London, Yale University, and the RAND Corporation.

iv Geographic Targeting in Urban Areas: A Social Welfare Program for Older People in Mexico
RAND Labor and Population has built an international reputation for conducting objective, high-quality, empirical research to support and improve policies and organizations around the world. Its work focuses on children and families, demographic behavior, education and training, labor markets, social welfare policy, immigration, international development, financial decisionmaking, and issues related to aging and retirement, with a common aim of understanding how policy and social and economic forces affect individual decisionmaking and human well-being.
CLASP, part of RAND Labor and Population, unites a distinguished collective of inter-national researchers addressing the most-pressing challenges and finding unique solutions that can contribute to a path of sustainable development for Latin Americans at home, in the United States, and around the world.
For questions and comments regarding CLASP, please contact Lucrecia Santibanez, director, CLASP, at 310-393-0411 x6310, or by email at [email protected].
For questions and comments regarding this report, please contact the project leader, Emma Aguila, at 310-393-0411 x6682; by email at [email protected]; or at the Uni-versity of Southern California, Sol Price School of Public Policy, 213-821-0702, or [email protected].
Materials related to this survey project, including the list of appendix materials and the list of technical reports and research papers, are available at http://www.rand.org/labor/centers/clasp/research/projects/social-security-program.html.
v
Contents
Preface . . . . . . . . . . . . . . . . . . . . . . . . . . . . . . . . . . . . . . . . . . . . . . . . . . . . . . . . . . . . . . . . . . . . . . . . . . . . . . . . . . . . . . . . . . . . . . . . . . . . . . . . . . . iiiFigure and Tables . . . . . . . . . . . . . . . . . . . . . . . . . . . . . . . . . . . . . . . . . . . . . . . . . . . . . . . . . . . . . . . . . . . . . . . . . . . . . . . . . . . . . . . . . . . . . . viiSummary . . . . . . . . . . . . . . . . . . . . . . . . . . . . . . . . . . . . . . . . . . . . . . . . . . . . . . . . . . . . . . . . . . . . . . . . . . . . . . . . . . . . . . . . . . . . . . . . . . . . . . . . ixAcknowledgments . . . . . . . . . . . . . . . . . . . . . . . . . . . . . . . . . . . . . . . . . . . . . . . . . . . . . . . . . . . . . . . . . . . . . . . . . . . . . . . . . . . . . . . . . . . . . xiAbbreviations . . . . . . . . . . . . . . . . . . . . . . . . . . . . . . . . . . . . . . . . . . . . . . . . . . . . . . . . . . . . . . . . . . . . . . . . . . . . . . . . . . . . . . . . . . . . . . . . . . xiii
ChAPTer One
Goals of the research and Overview of the noncontributory Pension Program . . . . . . . . . . . . . . . . . . . 1Targeting for Reconocer Urbano . . . . . . . . . . . . . . . . . . . . . . . . . . . . . . . . . . . . . . . . . . . . . . . . . . . . . . . . . . . . . . . . . . . . . . . . . . . . . . . 1Obtaining Accurate Measures of Characteristics by Geographic Area . . . . . . . . . . . . . . . . . . . . . . . . . . . . . . . . . . . . 3Organization of This Report . . . . . . . . . . . . . . . . . . . . . . . . . . . . . . . . . . . . . . . . . . . . . . . . . . . . . . . . . . . . . . . . . . . . . . . . . . . . . . . . . . . . 4
ChAPTer TwO
Using Characteristics of Geographic Areas to Target Social Programs . . . . . . . . . . . . . . . . . . . . . . . . . . . . . . 5Previous Research on Geographic Targeting . . . . . . . . . . . . . . . . . . . . . . . . . . . . . . . . . . . . . . . . . . . . . . . . . . . . . . . . . . . . . . . . . 5Geographic Targeting Indicators: The Mexican Case . . . . . . . . . . . . . . . . . . . . . . . . . . . . . . . . . . . . . . . . . . . . . . . . . . . . . . . 7
ChAPTer Three
Development of the Marginalization and Social-Gap Indexes . . . . . . . . . . . . . . . . . . . . . . . . . . . . . . . . . . . . . . . . . 9An Alternative Method of Measuring Social Deprivation . . . . . . . . . . . . . . . . . . . . . . . . . . . . . . . . . . . . . . . . . . . . . . . . . 12The Social-Gap Index at the Block Level . . . . . . . . . . . . . . . . . . . . . . . . . . . . . . . . . . . . . . . . . . . . . . . . . . . . . . . . . . . . . . . . . . . . . 14
ChAPTer FOUr
Findings . . . . . . . . . . . . . . . . . . . . . . . . . . . . . . . . . . . . . . . . . . . . . . . . . . . . . . . . . . . . . . . . . . . . . . . . . . . . . . . . . . . . . . . . . . . . . . . . . . . . . . . . . 15
ChAPTer FIve
Conclusions . . . . . . . . . . . . . . . . . . . . . . . . . . . . . . . . . . . . . . . . . . . . . . . . . . . . . . . . . . . . . . . . . . . . . . . . . . . . . . . . . . . . . . . . . . . . . . . . . . . . . 19
references . . . . . . . . . . . . . . . . . . . . . . . . . . . . . . . . . . . . . . . . . . . . . . . . . . . . . . . . . . . . . . . . . . . . . . . . . . . . . . . . . . . . . . . . . . . . . . . . . . . . . . . 21

vii
Figure and Tables
Figure
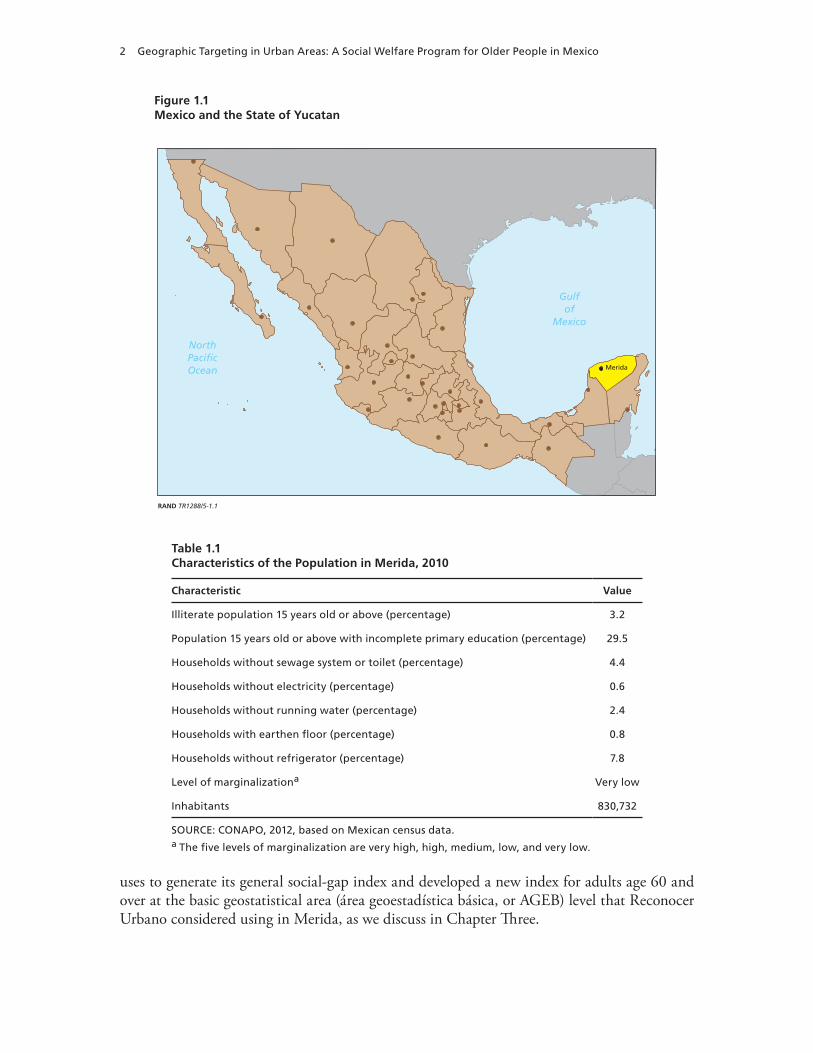
1.1. Mexico and the State of Yucatan . . . . . . . . . . . . . . . . . . . . . . . . . . . . . . . . . . . . . . . . . . . . . . . . . . . . . . . . . . . . . . . . . . 2
Tables
1.1. Characteristics of the Population in Merida, 2010 . . . . . . . . . . . . . . . . . . . . . . . . . . . . . . . . . . . . . . . . . . . . . 2 3.1. Comparison of Indicators Included in the Social-Gap and Marginalization Indexes . . . . . 10 3.2. Summary of the 33 Divergent Basic Geostatistical Areas . . . . . . . . . . . . . . . . . . . . . . . . . . . . . . . . . . . . . 12 3.3. Sample of Divergent Basic Statistical Areas . . . . . . . . . . . . . . . . . . . . . . . . . . . . . . . . . . . . . . . . . . . . . . . . . . . . 13 3.4. Sample of Comparison Group of Basic Statistical Areas . . . . . . . . . . . . . . . . . . . . . . . . . . . . . . . . . . . . . . 14 3.5. Number of Blocks, by Social-Gap Level . . . . . . . . . . . . . . . . . . . . . . . . . . . . . . . . . . . . . . . . . . . . . . . . . . . . . . . . 14 4.1. Hierarchical Modeling of Block-Level Social Gap: Score and Coefficient . . . . . . . . . . . . . . . . . . 16 4.2. Hierarchical Modeling of Social Gap: Variance and Covariance, by Block and Basic
Geostatistical Area . . . . . . . . . . . . . . . . . . . . . . . . . . . . . . . . . . . . . . . . . . . . . . . . . . . . . . . . . . . . . . . . . . . . . . . . . . . . . . . . . 16 4.3. Basic Geostatistical Areas According to the Marginalization and Social-Gap
Indexes of the Observed Blocks, by Block-Level Social-Gap Index: Comparison Group . . . . . . . . . . . . . . . . . . . . . . . . . . . . . . . . . . . . . . . . . . . . . . . . . . . . . . . . . . . . . . . . . . . . . . . . . . . . . . . . . . . . . . . . . . . . . . . 17
4.4. Basic Geostatistical Areas According to the Marginalization and Social-Gap Indexes of the Observed Blocks, by Block-Level Social-Gap Index: Group of Divergent Basic Geostatistical Areas . . . . . . . . . . . . . . . . . . . . . . . . . . . . . . . . . . . . . . . . . . . . . . . . . . . . . . . . . . . . . . . . . . . . . . . . . . . . . . . . 17


ix
Summary
As the government of Yucatan expanded its noncontributory pension program to urban areas, particularly the city of Merida, it faced the challenge of matching insufficient resources for a large elderly population. Policymakers confronting limited resources but great need may seek to target social welfare programs. Such targeting may consider individual income or wealth, household characteristics or assets, or characteristics of small geographic areas.
Geographic targeting of public policies is relatively recent in Mexico. The federal gov-ernment started targeting in the 1990s with its transfer program, Oportunidades, in order to direct resources to those most in need.1
As the research team worked with the government of Yucatan to implement the pension program in Merida, we consulted the information available from the National Population Council (Consejo Nacional de Población, or CONAPO) and the Mexican National Council for Evaluation of Social Development Policies (Consejo Nacional de Evaluación de la Política de Desarrollo Social, or CONEVAL) (Mexico’s statistical agencies on population, poverty, and social program evaluation) on rates of marginalization and social gap in basic geostatistical areas (áreas geoestadística básica, or AGEB). The CONEVAL social-gap index compiles four social-deprivation indexes—those on education, access to health care services, access to basic services, and home quality and spaces—into a single index that can be used to rank states, municipalities, and localities at a given time (CONEVAL, 2010). The CONAPO marginal-ization index includes ten socioeconomic indicators obtained from census data to differenti-ate urban AGEBs by the impact of the deprivations that their populations face (CONAPO, 2012). The CONAPO and CONEVAL indexes reported different rates of social deprivation for Merida AGEBs, a fact that hindered the Yucatan government’s efforts to target delivery of noncontributory pensions.
The research team therefore conducted two surveys to create a block-level social-gap index to determine whether the CONEVAL or CONAPO index could be used to target the pension program. We conducted the surveys, a social observation and a neighborhood observation at the block level for 22 AGEBs, in May and June 2009. Our results showed inconsistencies and disparities across blocks within AGEBs, which demonstrated the difficulties of trying to target public programs in large cities, where there are disparities and inequalities across blocks even within relatively small areas, such as AGEBs. Large inequalities across blocks make targeting of social programs more complex than it would be in a more homogeneous area, and they pre-
1 Oportunidades gives a bimonthly cash transfer to the female heads of household in poverty provided that their children between eight and 22 years old reach an attendance rate of 80 percent and all members of the family receive periodic pre-ventive health care services.

x Geographic Targeting in Urban Areas: A Social Welfare Program for Older People in Mexico
vent accurately locating individuals with the greatest need. For this reason, Reconocer Urbano ultimately administered the program to all persons at least 70 years of age within a randomly selected statistical sample of city blocks.
From the results of the project, we believe that the georeference tools for identification of marginalization at the block level need to be further refined before they are used for targeting social programs in large cities. Use of better tools can help ensure that program benefits are distributed equitably and fairly.
Our project heavily emphasized the construction of a geographical-marginality index with greater disaggregation levels than previous indexes. A team working on the design and evalu-ation of public policies should attend to addressing these three main challenges in targeting:
• Countries that, like Mexico, have rapidly aging populations need to develop specific socioeconomic indicators for the elderly.
• Public and private agencies involved in design of public policies need to develop better instruments for social observation and refine targeting methodologies.
• Those who would target programs should continue gathering information and develop-ing better tools to build block-level marginalization indexes. These would be useful for targeting populations with high levels of social and economic inequalities, such as those in Mexico.
For more information about the Reconocer Urbano program and the longitudinal research program, Escuchar, please consult Aguila, Kapteyn, et al. (forthcoming) and Aguila, Borges, et al. (forthcoming).
xi
Acknowledgments
We wish to thank the RAND Center for Latin American Social Policy and the government of the state of Yucatan for their collaboration and efforts in completing this study. We especially thank Ivonne Ortega Pacheco, governor of the state of Yucatan, for her ongoing support for the implementation of this project, including the two reports written to date.
In addition, we renew our thanks to the field and administrative staff in Yucatan and the RAND research team for their dedication and support in each stage of the project. We would also like to thank the institutions in Yucatan and in all of Mexico, as well as international insti-tutions, for their assistance and support in conducting this evaluation study.
This report has benefited greatly from the feedback and stories of the older adults who participated in the evaluation study. Their contributions could help improve the future of the next generations of older adults.
Other individuals we wish to acknowledge are the following:
• RAND Corporation: María Fernanda Alva, Gabriela Castro, Sloan Fader, Tania Gutsche, Norely Martínez
• Yucatan government: Abril Borges, Luis Felipe Canche, Cielo Margot Castillejos, Gabriel Huchim Xiu, Israel Iván Poot, Lilia Leonor Sansores, Sergio Tun Cutz
• academic institutions: We especially thank Enrique Minor and the team at Consejo Nacional de Evaluación de la Política de Desarrollo Social (Mexican National Council for Evaluation of Social Development Policies) for their support in building a social-gap index for the elderly population, Juan Francisco Medina and Jorge Cerón of Consejo Estatal de Población de Yucatán (Yucatan State Population Council) for their continued advice and support, and Juan Manuel Rivas of Instituto Nacional de Estadística y Geo-grafía (National Institute for Statistics and Geography) for his tireless assistance and sup-port training from the first steps of the programs Escuchar and Reconocer.

xiii
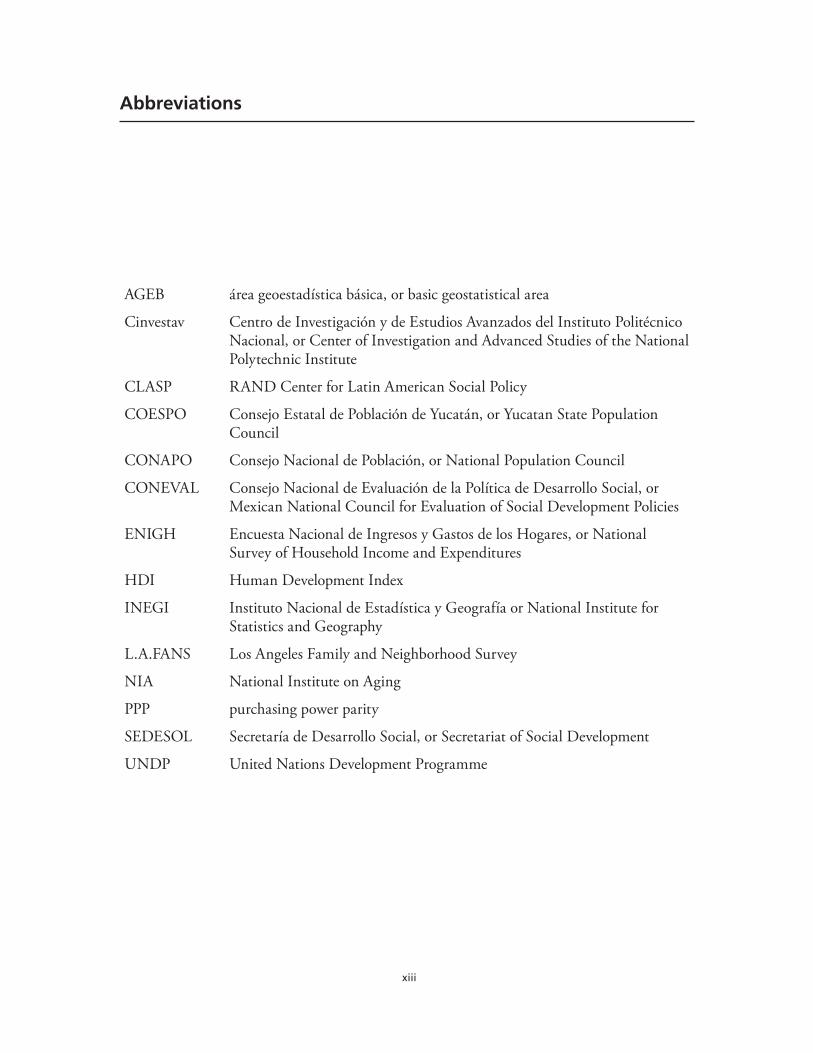
Abbreviations
AGEB área geoestadística básica, or basic geostatistical area
Cinvestav Centro de Investigación y de Estudios Avanzados del Instituto Politécnico Nacional, or Center of Investigation and Advanced Studies of the National Polytechnic Institute
CLASP RAND Center for Latin American Social Policy
COESPO Consejo Estatal de Población de Yucatán, or Yucatan State Population Council
CONAPO Consejo Nacional de Población, or National Population Council
CONEVAL Consejo Nacional de Evaluación de la Política de Desarrollo Social, or Mexican National Council for Evaluation of Social Development Policies
ENIGH Encuesta Nacional de Ingresos y Gastos de los Hogares, or National Survey of Household Income and Expenditures
HDI Human Development Index
INEGI Instituto Nacional de Estadística y Geografía or National Institute for Statistics and Geography
L.A.FANS Los Angeles Family and Neighborhood Survey
NIA National Institute on Aging
PPP purchasing power parity
SEDESOL Secretaría de Desarrollo Social, or Secretariat of Social Development
UNDP United Nations Development Programme

1
ChAPTer One
Goals of the Research and Overview of the Noncontributory Pension Program
This report describes the effort by researchers from the RAND Corporation and a team that included representatives from the government of Yucatan, Mexico, to measure characteristics of the population age 70 and older in the city of Merida, with the goal of targeting the delivery of a noncontributory pension of MXN $550 (about US$67 at 2011 purchasing power parity [PPP]) to older, impoverished adults.
Targeting social programs helps provide benefits to those who need them most. It also helps to reduce or improve efficiency of government social expenditures by increasing benefits available to disadvantaged populations by not allocating resources to those who do not need them as much (Coady, Grosh, and Hoddinott, 2004; Skoufias and Coady, 2007).
Targeting for Reconocer Urbano
The pension program we sought to target was part of a larger expansion of social policy by the state government in Yucatan. The pension program first focused on the elderly in rural localities and, later, on the elderly in urban localities of more than 20,000 inhabitants each (see Figure 1.1 for a map of Yucatan).
The expansion of the pension program to the city of Merida, with about 1 million inhab-itants and 40,000 adults age 70 and older, posed organizational, logistical, and budgetary chal-lenges. Although all adults age 70 and older with permanent residence in the city were eligible to receive the pension, financial constraints prevented the pension program from immediately providing universal support as was done in the smaller city of Valladolid. The state government therefore explored options for targeting initial beneficiaries in Merida.
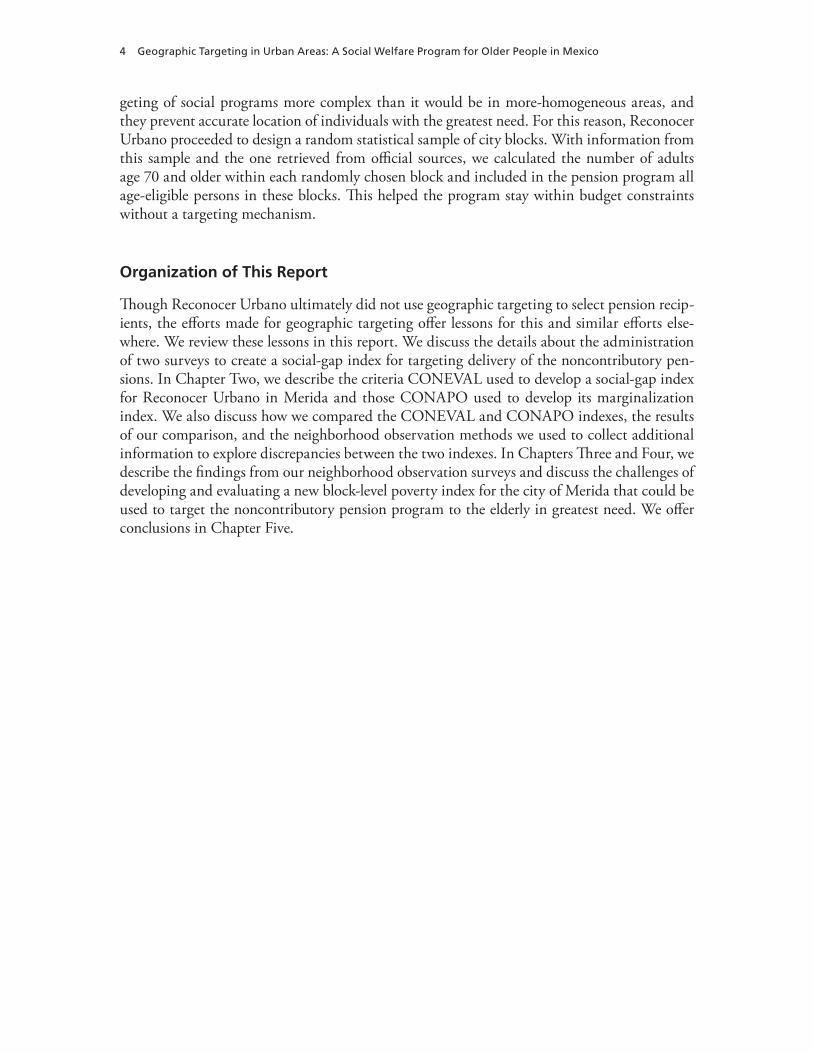
The first option it considered was targeting based on the social-gap and marginaliza-tion indexes and maps developed by the National Population Council (Consejo Nacional de Población, or CONAPO) and the Mexican National Council for Evaluation of Social Development Policies (Consejo Nacional de Evaluación de la Política de Desarrollo Social, or CONEVAL). These are based on decennial national censuses and quinquennial population counts conducted by the National Institute for Statistics and Geography (Instituto Nacional de Estadística y Geografía, or INEGI). Table 1.1 summarizes marginalization data for Merida for 2010.
There are two immediate obstacles to using these data for targeting the pension program in Merida. First, the social-deprivation indexes and maps from both councils are available to the public only at the municipality level. Second, there are no poverty indicators developed specifically for the elderly. Nevertheless, at our request, CONEVAL adjusted the indicators it
2 Geographic Targeting in Urban Areas: A Social Welfare Program for Older People in Mexico
uses to generate its general social-gap index and developed a new index for adults age 60 and over at the basic geostatistical area (área geoestadística básica, or AGEB) level that Reconocer Urbano considered using in Merida, as we discuss in Chapter Three.
Figure 1.1Mexico and the State of Yucatan
RAND TR1288/5-1.1
NorthPacificOcean
Gulfof
Mexico
Merida
Table 1.1Characteristics of the Population in Merida, 2010
Characteristic Value
Illiterate population 15 years old or above (percentage) 3.2
Population 15 years old or above with incomplete primary education (percentage) 29.5
households without sewage system or toilet (percentage) 4.4
households without electricity (percentage) 0.6
households without running water (percentage) 2.4
households with earthen floor (percentage) 0.8
households without refrigerator (percentage) 7.8
Level of marginalizationa Very low
Inhabitants 830,732
SOUrCe: COnAPO, 2012, based on Mexican census data.a The five levels of marginalization are very high, high, medium, low, and very low.

Goals of the research and Overview of the noncontributory Pension Program 3
Obtaining Accurate Measures of Characteristics by Geographic Area
Targeting social programs requires accurate data about the targeted population. One approach is based on geography. Geographic targeting uses information on the characteristics of small areas to rate each by its relative poverty or wealth. The geographic approach assumes that households within neighborhoods share similar welfare characteristics, that poor neighbor-hoods can be identified, and that this information can be used to universally benefit residents with social programs (Ravallion and Chao, 1989; Besley and Kanbur, 1990).
The implementation of the noncontributory pension program in Merida began with a comparison of social-deprivation indexes from CONAPO and CONEVAL, the Mexican agen-cies that compile statistics on population, poverty, and social program evaluation in AGEBs constructed by the agencies for planning and targeting purposes.1 Each AGEB is made up of about 20 city blocks, and each block includes about 50 people. As we worked with the govern-ment of Yucatan to implement the noncontributory pension program, we consulted the infor-mation available from the two agencies and found different reported rates of social deprivation in the AGEBs. The differences hindered the Yucatan government’s efforts to target delivery of noncontributory pensions.
One reason for these differences may be the nature of the data the councils collect. The CONEVAL social-gap index ranks states, municipalities, and localities. It summarizes four CONEVAL social-gap indexes. These indexes are on educational gap, access to health care ser-vices, access to basic services at home, and home quality and spaces.2 The CONEVAL social-gap index is not a poverty measurement because it does not include income, social security, or nutrition indicators (CONEVAL, 2010). The CONAPO marginalization index, in contrast, includes ten socioeconomic indicators from census data. It differentiates urban AGEBs by the impact of the deprivations that their populations face (CONAPO, 2012).
To create a social-gap index at the block level and assess whether noncontributory pen-sions could be targeted at the AGEB level in Merida, we conducted two surveys in May and June 2009. One was a social observation and the other a neighborhood observation. Each was done at the city-block level for 22 AGEBs.
Results from these surveys showed inconsistencies and disparities by blocks within AGEBs, demonstrating the difficulties of trying to target social programs in large cities, where there are disparities and inequalities across blocks. Large inequalities across blocks make tar-
1 We use the term social deprivation to refer to measures or indexes that include one or more features or dimensions of pov-erty. Not all are poverty measures. The definition of multidimensional poverty adopted by CONEVAL and used in this docu-ment was developed by a large body of experts and based on Amartya Sen’s capability approach. The final multidimensional poverty index includes seven dimensions: (1) educational gap, (2) access to health care services, (3) access to social security, (4) quality and size of dwelling, (5) access to services in the dwelling, (6) access to food, and (7) social cohesion (Foster, 2010; CONEVAL, 2010). The social-deprivation term refers to the three indexes used in this study: the social-gap index from CONEVAL, the marginalization index from CONAPO, and the block-level social-gap index that we developed.
AGEBs are areas of several blocks perfectly delimited by streets and avenues.2 Educational gap is the proportional gap between the years of an individual’s education and a threshold of years of educa-tion required according to his or her birthdate. The thresholds are as follows (CONEVAL, 2010):
• for people age 3 to 15, lacking any mandatory basic education and not attending a formal educational center• for people born before 1982, not meeting the minimum mandatory basic education level that prevailed at the time
they should have attended elementary school• for people born from 1982 onward, not completing the minimum current mandatory basic education requirement
(secondary school).
4 Geographic Targeting in Urban Areas: A Social Welfare Program for Older People in Mexico
geting of social programs more complex than it would be in more-homogeneous areas, and they prevent accurate location of individuals with the greatest need. For this reason, Reconocer Urbano proceeded to design a random statistical sample of city blocks. With information from this sample and the one retrieved from official sources, we calculated the number of adults age 70 and older within each randomly chosen block and included in the pension program all age-eligible persons in these blocks. This helped the program stay within budget constraints without a targeting mechanism.
Organization of This Report
Though Reconocer Urbano ultimately did not use geographic targeting to select pension recip-ients, the efforts made for geographic targeting offer lessons for this and similar efforts else-where. We review these lessons in this report. We discuss the details about the administration of two surveys to create a social-gap index for targeting delivery of the noncontributory pen-sions. In Chapter Two, we describe the criteria CONEVAL used to develop a social-gap index for Reconocer Urbano in Merida and those CONAPO used to develop its marginalization index. We also discuss how we compared the CONEVAL and CONAPO indexes, the results of our comparison, and the neighborhood observation methods we used to collect additional information to explore discrepancies between the two indexes. In Chapters Three and Four, we describe the findings from our neighborhood observation surveys and discuss the challenges of developing and evaluating a new block-level poverty index for the city of Merida that could be used to target the noncontributory pension program to the elderly in greatest need. We offer conclusions in Chapter Five.
5
ChAPTer TWO
Using Characteristics of Geographic Areas to Target Social Programs
There are three main approaches for targeting antipoverty programs. These involve collecting information on (1) income or material wealth (income, savings, and assets); (2) household char-acteristics and assets, or (3) characteristics of small geographic areas (Bigman and Srinivasan, 2002). The first approach uses secondary sources of income data (e.g., administrative registries) to identify and determine program eligibility. The second approach presumes that it is possible to establish the wealth of individuals or households by “tagging” observable characteristics, such as demographics, material conditions of housing, and durable assets (Akerlof, 1978). The third approach, as noted earlier, focuses on small geographic areas and assumes that house-holds within neighborhoods share similar characteristics.
Usually, studies on income inequality and poverty use either individualistic models or spa-tial (e.g., geographic) approaches. The individualistic approach develops human-capital models to explain the differences in income and consumption of individuals or families, supported by assumptions, such as the free flow of individuals and market equilibrium. In contrast to the individualistic approach, the geographic approach assumes that cultural, economic, and geo-graphic characteristics restrict the free flow of individuals and influence differences in income and economic development among cities, regions, and countries (Bigman and Fofack, 2000).
Each approach has strengths and weaknesses that make one more useful than the other, depending on its purpose. The use of geographic targeting in economic analysis and public policy decisions is relatively new (Bigman and Fofack, 2000). As we began to develop the non-contributory pension program and select a target population, we conducted a literature review to learn more about geographic targeting, determine whether it was appropriate for this pro-gram and the follow-up evaluation, and understand what contribution we could make through its use in our study. In the next section, we describe our findings from the literature.
Previous Research on Geographic Targeting
Geographic targeting presents significant advantages over other methods of targeting in poverty-alleviation programs in many developing countries. First, it offers clear criteria for identifying target groups, limiting the chances of selecting heterogeneous populations. Second, it involves local authorities and nongovernmental organizations in program monitoring, man-agement, and implementation. Third, it combines the criteria of geographic location with other socioeconomic characteristics of households and individuals. Finally, it can help to allocate not only social welfare benefits but also regional-development resources (Bigman and Fofack, 2000).
6 Geographic Targeting in Urban Areas: A Social Welfare Program for Older People in Mexico
For geographic targeting, demographic characteristics are more important than house-hold ones (Ravallion and Wodon, 1999). Geographic targeting also requires clear identification of geographical areas so as to avoid errors typically associated with population heterogeneity and the inclusion of individuals who do not belong to the treatment population.
Using different levels of geographic aggregation in Venezuela, Mexico, and Jamaica, Baker and Grosh (1994) found that poverty-alleviation programs using geographic targeting achieved greater reductions in poverty than universal benefit programs with similar implemen-tation costs. They also found that the level of geographic aggregation has a significant impact on outcomes and that aggregation tends to prioritize programs whose target populations are in small geographic areas.
Although there is some concern about the reliability of data used for geographic target-ing, Bedi, Coudouel, and Simler (2007) demonstrated how the creation or development of poverty maps can be essential in alleviating poverty. As part of the Millennium Development Goals Plus agenda, the Thai government seeks to reduce poverty to less than 4 percent. Pov-erty maps have played a significant role in identifying the regions with the worst poverty. The northeastern and southern regions of Thailand have a large number of poor provinces but also areas where poverty rates are less than 7.5 percent. Poverty is particularly high in remote com-munities of the south that have low population density. Construction of poverty measures at district and village levels allows comparison with those at regional and national levels. Includ-ing economic, social, and cultural data from population censuses and household surveys also helps increase coverage of the target population.
Data may sometimes be restricted, but Arias and Robles (2007) showed how to overcome data constraints to construct monetary poverty maps in small geographic areas of Bolivia. Like many other Latin American countries, Bolivia began to develop maps showing unsatis-fied basic needs almost immediately after completing its census surveys. Although the census data were very disaggregated, they did not capture information on household expenditure and income. The household surveys also only rarely provided reliable information on income and consumption for small geographic areas. Using the methodology proposed by Elbers, Lanjouw, and Lanjouw (2003), however, Arias and Robles were able to develop econometric models to construct household consumption at the municipal level.
In a developing country, such as Mexico, with extremely high levels of income inequality, geographic targeting on small areas appears to be an inexpensive way to reach the poor because there is a high correspondence between the physical (infrastructure) and social characteristics of neighborhoods and income levels of residents. This approach avoids such problems as data misreporting or monitoring, conditional on whether the characteristics of the poor are highly correlated to those of their neighborhoods—that is, “the concentration of poverty in some areas” (Bigman and Fofack, 2000, p. 134).
The geographic targeting of social programs in Mexico is a recent practice whose results are just beginning to be analyzed. Baker and Grosh (1994) studied the geographic targeting of local programs in the 1990s for the use of food stamps for tortillas and a program to supply subsidized milk (Liconsa).1 They found that, the smaller the area targeted, the greater the pro-gram impact.
1 Liconsa provides subsidized milk to the poor. For further information, see Liconsa, 2012.
Using Characteristics of Geographic Areas to Target Social Programs 7
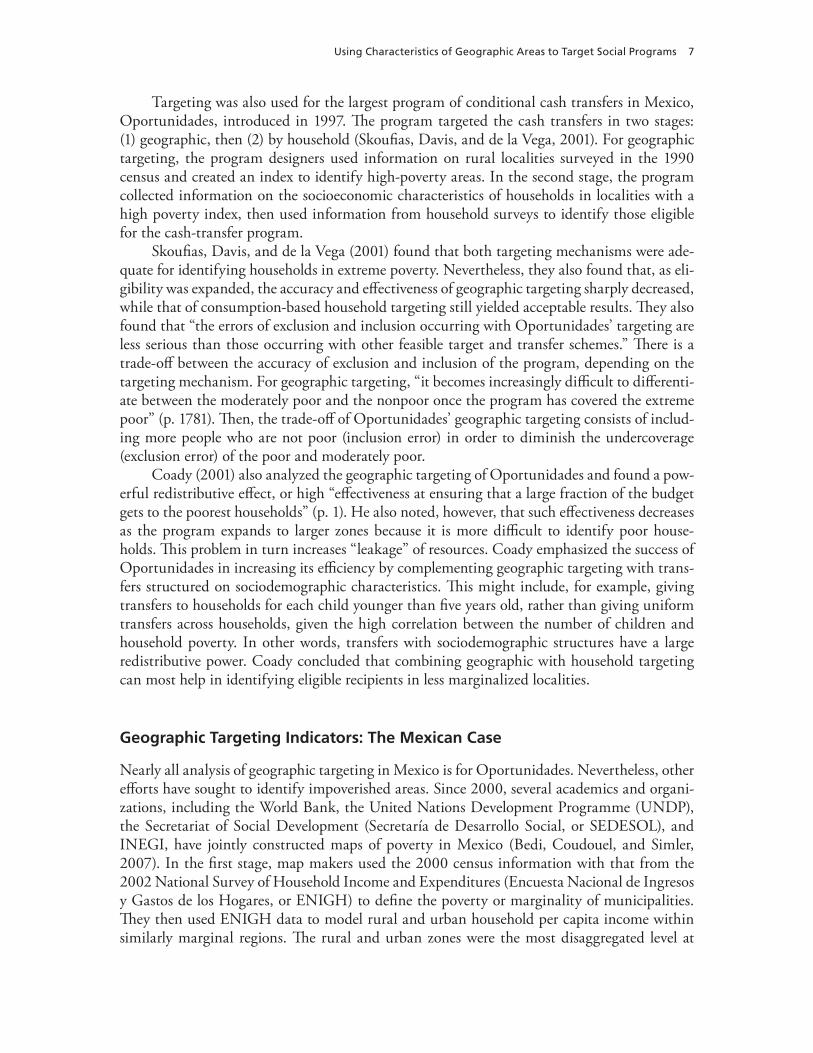
Targeting was also used for the largest program of conditional cash transfers in Mexico, Oportunidades, introduced in 1997. The program targeted the cash transfers in two stages: (1) geographic, then (2) by household (Skoufias, Davis, and de la Vega, 2001). For geographic targeting, the program designers used information on rural localities surveyed in the 1990 census and created an index to identify high-poverty areas. In the second stage, the program collected information on the socioeconomic characteristics of households in localities with a high poverty index, then used information from household surveys to identify those eligible for the cash-transfer program.
Skoufias, Davis, and de la Vega (2001) found that both targeting mechanisms were ade-quate for identifying households in extreme poverty. Nevertheless, they also found that, as eli-gibility was expanded, the accuracy and effectiveness of geographic targeting sharply decreased, while that of consumption-based household targeting still yielded acceptable results. They also found that “the errors of exclusion and inclusion occurring with Oportunidades’ targeting are less serious than those occurring with other feasible target and transfer schemes.” There is a trade-off between the accuracy of exclusion and inclusion of the program, depending on the targeting mechanism. For geographic targeting, “it becomes increasingly difficult to differenti-ate between the moderately poor and the nonpoor once the program has covered the extreme poor” (p. 1781). Then, the trade-off of Oportunidades’ geographic targeting consists of includ-ing more people who are not poor (inclusion error) in order to diminish the undercoverage (exclusion error) of the poor and moderately poor.
Coady (2001) also analyzed the geographic targeting of Oportunidades and found a pow-erful redistributive effect, or high “effectiveness at ensuring that a large fraction of the budget gets to the poorest households” (p. 1). He also noted, however, that such effectiveness decreases as the program expands to larger zones because it is more difficult to identify poor house-holds. This problem in turn increases “leakage” of resources. Coady emphasized the success of Oportunidades in increasing its efficiency by complementing geographic targeting with trans-fers structured on sociodemographic characteristics. This might include, for example, giving transfers to households for each child younger than five years old, rather than giving uniform transfers across households, given the high correlation between the number of children and household poverty. In other words, transfers with sociodemographic structures have a large redistributive power. Coady concluded that combining geographic with household targeting can most help in identifying eligible recipients in less marginalized localities.
Geographic Targeting Indicators: The Mexican Case
Nearly all analysis of geographic targeting in Mexico is for Oportunidades. Nevertheless, other efforts have sought to identify impoverished areas. Since 2000, several academics and organi-zations, including the World Bank, the United Nations Development Programme (UNDP), the Secretariat of Social Development (Secretaría de Desarrollo Social, or SEDESOL), and INEGI, have jointly constructed maps of poverty in Mexico (Bedi, Coudouel, and Simler, 2007). In the first stage, map makers used the 2000 census information with that from the 2002 National Survey of Household Income and Expenditures (Encuesta Nacional de Ingresos y Gastos de los Hogares, or ENIGH) to define the poverty or marginality of municipalities. They then used ENIGH data to model rural and urban household per capita income within similarly marginal regions. The rural and urban zones were the most disaggregated level at
8 Geographic Targeting in Urban Areas: A Social Welfare Program for Older People in Mexico
which the data were representative. Their next step was to match the observable variables of households from ENIGH to those in the census. They then used the parameters obtained in the first stage for generating incomes, simulating 100 error terms at household level for esti-mating the welfare means of each region. Researchers used the resulting maps to show relevant poverty indicators. Their final step was coordinating with policymakers, explaining the meth-odological adequacy of the resulting stratification of poverty (Bedi, Coudouel, and Simler, 2007).
Researchers for the UNDP Human Development Index (HDI) and CONAPO have cre-ated two additional maps of municipal poverty and marginalization since 2005. Since 2007, CONEVAL has also created a map of municipal social deprivation, representing the social-gap index. In Mexico, the current municipal poverty indexes help determine annual municipal budgets. They also help target SEDESOL social programs, such as Hábitat and Liconsa (Bedi, Coudouel, and Simler, 2007); determine priority strategies, such as 100 × 100; and select impoverished agricultural locations for applying “innovative breeding techniques for maize” (Akinyemi, 2010, p. 86).2
Despite advances in these indexes, their adequacy for identifying economically disadvan-taged people at lower geographical levels, such as blocks, has not been assessed. Moreover, to date, no official tool has been developed for geographic targeting below the municipality level. The INEGI website provides interactive maps with information on education and population size by neighborhood but does not provide comprehensive information on poverty by neigh-borhood, block, or AGEB.
More-disaggregated interactive maps and data could help social programs, such as Reconocer Urbano, reach the poor outside the most-impoverished municipalities.
2 Hábitat is a federal program to improve the infrastructure of marginalized or unsafe urban zones. For further informa-tion on Hábitat, see Secretaria de Desarrollo Social, 2012. La Estrategia 100 × 100 y la de Microrregiones seeks to improve living conditions and increase employment and productivity among people in the 125 municipalities with the lowest HDI scores. For further information on 100 × 100, see Dirección de Análisis Territorial, undated; Secretaria de Desarrollo Social, 2011.
9
ChAPTer Three
Development of the Marginalization and Social-Gap Indexes
The social-gap index developed by CONEVAL condenses social-deprivation indexes on educa-tion, access to health care services, basic services at home, home quality and spaces, and house-hold assets. It allows comparison of the severity of social deprivation by geography. CONEVAL, at our request, estimated this index for adults age 60 and over in the city of Merida by AGEB.
CONEVAL estimated the social-gap index by using principal component analysis. This method constructs the index as a linear combination of the indicators, in which the social-gap index is the sum of its indicators weighted by the proportion of the variance of social depriva-tion in the AGEB. The index is normalized to have zero mean and unit variance—that is, it was transformed to have an approximately normal distribution.
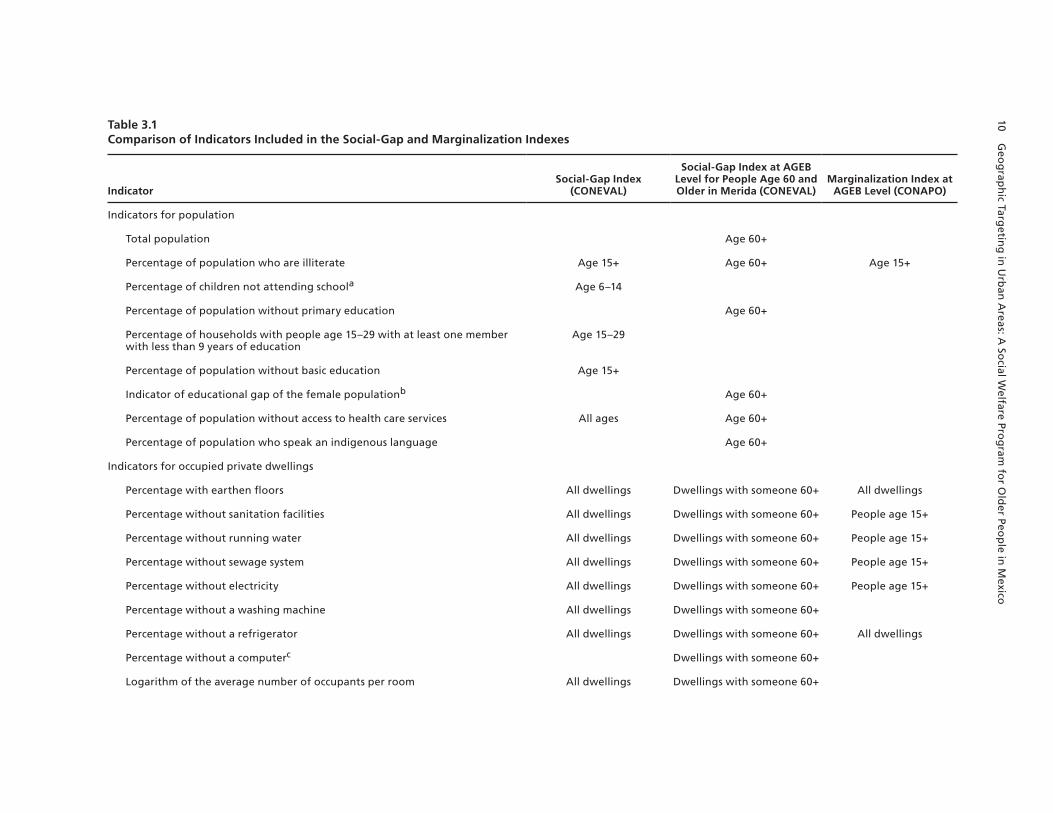
This statistical technique is the same as used by CONAPO to estimate its marginaliza-tion index. The only difference lies in the variables used. Table 3.1 presents the indicators of three indexes: the social-gap index, the social-gap index we requested for persons at least 60 years of age in Merida, and the marginalization index.
The numerical values of the index can be negative, zero, or positive, with more-severe social deprivation indicated by higher positive values. CONEVAL stratified the index into five degrees of social gap: very high, high, medium, low, and very low. This stratification, based on Dalenius and Hodges’ technique of minimum variance, allows the indicators of the AGEBs grouped in the same stratum of social gap to be as similar as possible and those between strata to be as different as possible (CONEVAL, 2007; Dalenius and Hodges, 1957, 1959). This technique determines the boundaries of each degree to minimize the coefficient of variation between AGEBs within each stratum—that is, it sets the thresholds of the ranks in such a way that the AGEBs assigned to each are very similar and have minimal variance among them.
The marginalization index from CONAPO (2012) sorts and classifies the AGEBs by the intensity of the deprivation suffered by their populations. It is made with AGEB-level informa-tion from the 2005 National Population Count and uses principal-component analysis as well. Its index values can also be negative, zero, or positive. Its categories are the same as those for the social-gap index of CONEVAL: very low, low, medium, high, and very high.
Although we use a social-gap index constructed for adults at least 60 years of age, the marginalization index we use is the conventional index estimated by CONAPO for the entire population of the AGEBs. Its indicators, as noted, are in Table 3.1.
To assess whether the indexes developed by CONEVAL and CONAPO for the AGEBs could be used to target social programs at the block level, we compared the indexes. We found that they provided a different deprivation index in 150 of 342 AGEBs (43.9 percent) in Merida, with large discrepancies of at least two social-deprivation levels in 33 of the 150 AGEBs. In these 33 AGEBs, the CONAPO index rated marginalization as high or very high, while the
10 Geo
grap
hic Targ
eting
in U
rban
Areas: A
Social W
elfare Prog
ram fo
r Old
er Peop
le in M
exico
Table 3.1Comparison of Indicators Included in the Social-Gap and Marginalization Indexes
IndicatorSocial-Gap Index
(CONEVAL)
Social-Gap Index at AGEB Level for People Age 60 and Older in Merida (CONEVAL)
Marginalization Index at AGEB Level (CONAPO)
Indicators for population
Total population Age 60+
Percentage of population who are illiterate Age 15+ Age 60+ Age 15+
Percentage of children not attending schoola Age 6–14
Percentage of population without primary education Age 60+
Percentage of households with people age 15–29 with at least one member with less than 9 years of education
Age 15–29
Percentage of population without basic education Age 15+
Indicator of educational gap of the female populationb Age 60+
Percentage of population without access to health care services All ages Age 60+
Percentage of population who speak an indigenous language Age 60+
Indicators for occupied private dwellings
Percentage with earthen floors All dwellings Dwellings with someone 60+ All dwellings
Percentage without sanitation facilities All dwellings Dwellings with someone 60+ People age 15+
Percentage without running water All dwellings Dwellings with someone 60+ People age 15+
Percentage without sewage system All dwellings Dwellings with someone 60+ People age 15+
Percentage without electricity All dwellings Dwellings with someone 60+ People age 15+
Percentage without a washing machine All dwellings Dwellings with someone 60+
Percentage without a refrigerator All dwellings Dwellings with someone 60+ All dwellings
Percentage without a computerc Dwellings with someone 60+
Logarithm of the average number of occupants per room All dwellings Dwellings with someone 60+
Develo
pm
ent o
f the M
argin
alization
and
Social-G
ap In
dexes 11
IndicatorSocial-Gap Index
(CONEVAL)
Social-Gap Index at AGEB Level for People Age 60 and Older in Merida (CONEVAL)
Marginalization Index at AGEB Level (CONAPO)
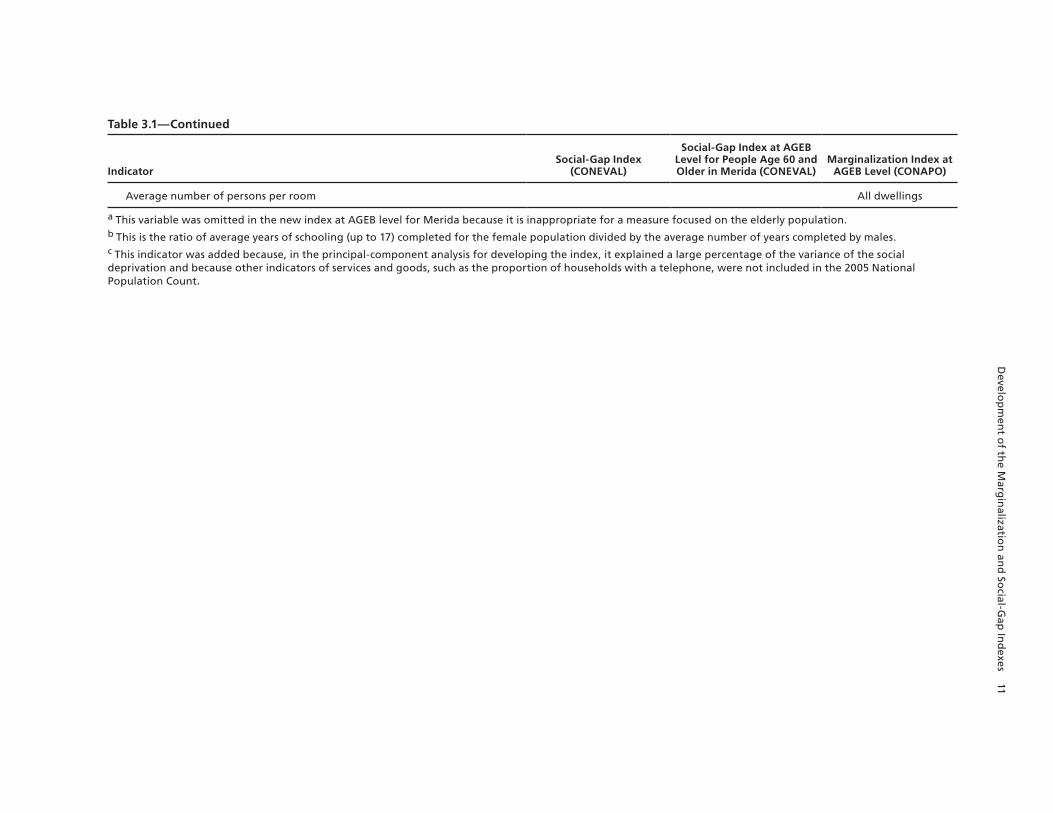
Average number of persons per room All dwellings
a This variable was omitted in the new index at AGeB level for Merida because it is inappropriate for a measure focused on the elderly population.b This is the ratio of average years of schooling (up to 17) completed for the female population divided by the average number of years completed by males.c This indicator was added because, in the principal-component analysis for developing the index, it explained a large percentage of the variance of the social deprivation and because other indicators of services and goods, such as the proportion of households with a telephone, were not included in the 2005 national Population Count.
Table 3.1—Continued
12 Geographic Targeting in Urban Areas: A Social Welfare Program for Older People in Mexico
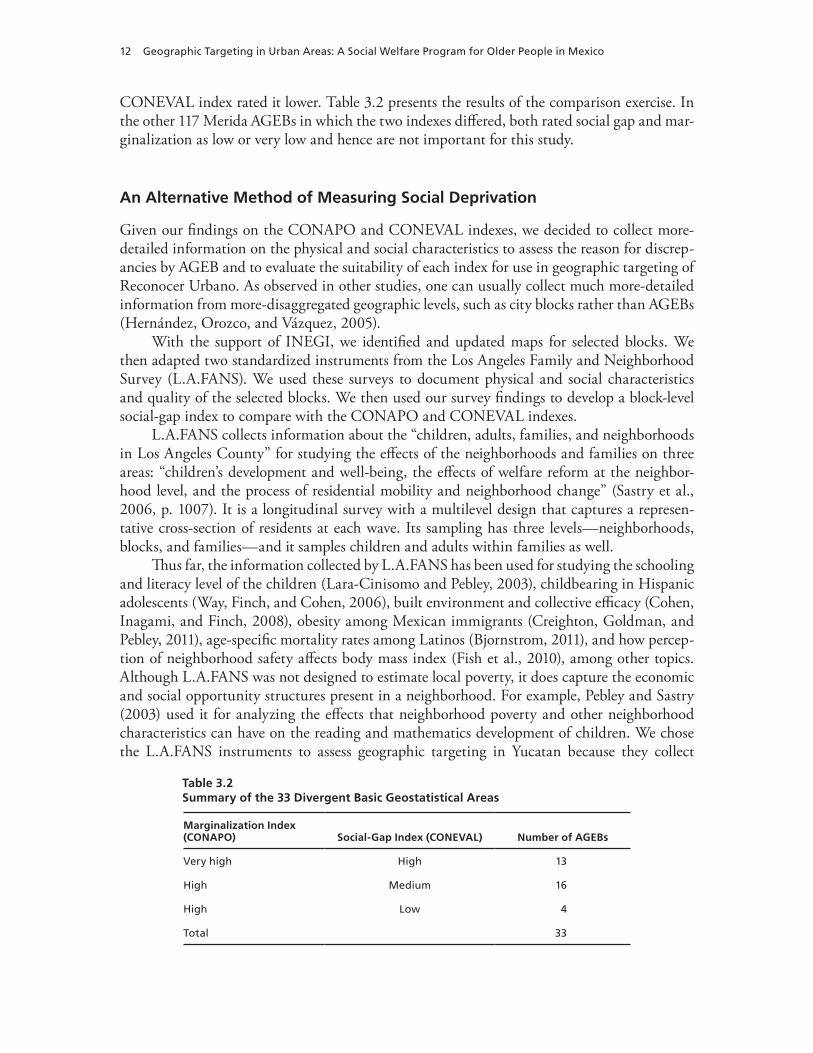
CONEVAL index rated it lower. Table 3.2 presents the results of the comparison exercise. In the other 117 Merida AGEBs in which the two indexes differed, both rated social gap and mar-ginalization as low or very low and hence are not important for this study.
An Alternative Method of Measuring Social Deprivation
Given our findings on the CONAPO and CONEVAL indexes, we decided to collect more-detailed information on the physical and social characteristics to assess the reason for discrep-ancies by AGEB and to evaluate the suitability of each index for use in geographic targeting of Reconocer Urbano. As observed in other studies, one can usually collect much more-detailed information from more-disaggregated geographic levels, such as city blocks rather than AGEBs (Hernández, Orozco, and Vázquez, 2005).
With the support of INEGI, we identified and updated maps for selected blocks. We then adapted two standardized instruments from the Los Angeles Family and Neighborhood Survey (L.A.FANS). We used these surveys to document physical and social characteristics and quality of the selected blocks. We then used our survey findings to develop a block-level social-gap index to compare with the CONAPO and CONEVAL indexes.
L.A.FANS collects information about the “children, adults, families, and neighborhoods in Los Angeles County” for studying the effects of the neighborhoods and families on three areas: “children’s development and well-being, the effects of welfare reform at the neighbor-hood level, and the process of residential mobility and neighborhood change” (Sastry et al., 2006, p. 1007). It is a longitudinal survey with a multilevel design that captures a represen-tative cross-section of residents at each wave. Its sampling has three levels—neighborhoods, blocks, and families—and it samples children and adults within families as well.
Thus far, the information collected by L.A.FANS has been used for studying the schooling and literacy level of the children (Lara-Cinisomo and Pebley, 2003), childbearing in Hispanic adolescents (Way, Finch, and Cohen, 2006), built environment and collective efficacy (Cohen, Inagami, and Finch, 2008), obesity among Mexican immigrants (Creighton, Goldman, and Pebley, 2011), age-specific mortality rates among Latinos (Bjornstrom, 2011), and how percep-tion of neighborhood safety affects body mass index (Fish et al., 2010), among other topics. Although L.A.FANS was not designed to estimate local poverty, it does capture the economic and social opportunity structures present in a neighborhood. For example, Pebley and Sastry (2003) used it for analyzing the effects that neighborhood poverty and other neighborhood characteristics can have on the reading and mathematics development of children. We chose the L.A.FANS instruments to assess geographic targeting in Yucatan because they collect
Table 3.2Summary of the 33 Divergent Basic Geostatistical Areas
Marginalization Index (CONAPO) Social-Gap Index (CONEVAL) Number of AGEBs
Very high high 13
high Medium 16
high Low 4
Total 33

Development of the Marginalization and Social-Gap Indexes 13
important economic and social information of neighborhoods that could be used for a social-gap index.1
The neighborhood observation form consists of 42 questions related to the characteristics and quality of streets, sidewalks, lighting, litter, graffiti, and housing type, as well as the con-dition of buildings, leisure facilities, commercial establishments, and institutions in the study area.
The social observation form consists of 22 questions related to the presence of security officers, children, adolescents, groups of adolescents, adults, prostitutes, homeless persons, and persons drinking alcoholic beverages on the street, as well as the reaction of people to the pres-ence of the observer.
We used modified L.A.FANS questionnaires to systematically observe the physical and social characteristics of two samples of blocks in 22 AGEBs in the city of Merida.2 The first sample was drawn from 12 AGEBs that had differing CONAPO and CONEVAL social-deprivation indexes. The second sample was drawn from a comparison group of ten AGEBs, eight of which had identical CONAPO and CONEVAL social-deprivation indexes and two of which had a CONAPO but not a CONEVAL social-deprivation index rating.3 In select-ing blocks for observation, we sought a random sample from within each AGEB. Table 3.3 shows the number of AGEBs we included, by type of divergence between CONAPO and CONEVAL indexes. Table 3.4 shows the AGEBs we included, by level of marginalization in the CONAPO or CONEVAL indexes.
Eight experienced interviewers and their field supervisors collected data. These inter-viewers and supervisors had training on the content and application of the observation forms, including question-by-question specifications, protocol for conducting the observation, stan-dardization and quality control, and completing the forms. We collected data using a paper-and-pencil instrument and subsequently entered data for analysis.
1 For more information about L.A.FANS questionnaires, see L.A.FANS, 2012.2 We modified three items (18, 30, and 39) in the neighborhood observation form to better reflect conditions in Merida. Specifically, when we conducted our neighborhood observations, there were no buildings with more than three floors in the city of Merida, so we omitted two response options from item 18: response option 7, “Mid-rise apartment or condo-minium buildings (four to six floors),” and response option 8, “High-rise apartment or condominium buildings (more than 6 floors).” For item 30, we reduced the response options from four (none, very few, some, many) to two (yes or no). Finally, for item 39, which had 46 response options, we deleted those related to food stores (e.g., bakery, butcher) because, in Merida, these services are mainly delivered by establishments included in the other options.3 This difference derives from the different policies that CONEVAL and CONAPO have about making public the eco-nomic and sociodemographic information about small AGEBs.
Table 3.3Sample of Divergent Basic Statistical Areas
Marginalization Index (CONAPO) Social-Gap Index (CONEVAL)
Number of AGEBs
Number of Blocks
Very high high 6 32
high Medium 2 8
high Low 4 18
Total 12 58
14 Geographic Targeting in Urban Areas: A Social Welfare Program for Older People in Mexico
The Social-Gap Index at the Block Level
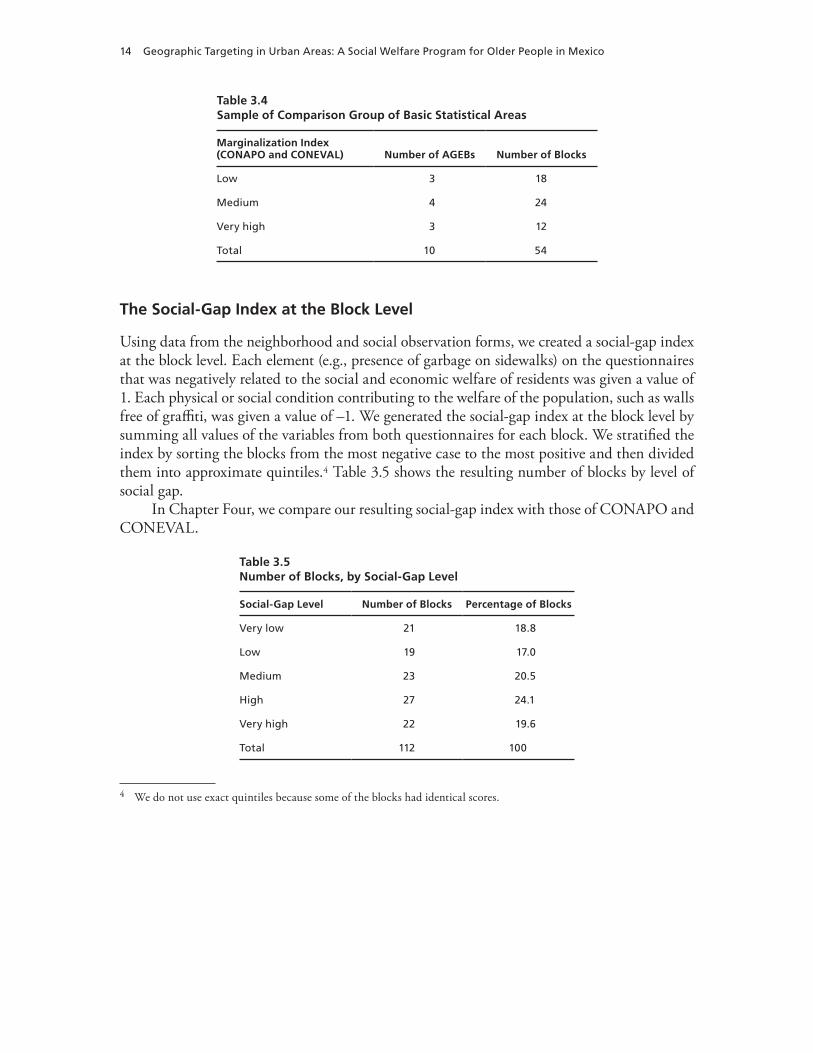
Using data from the neighborhood and social observation forms, we created a social-gap index at the block level. Each element (e.g., presence of garbage on sidewalks) on the questionnaires that was negatively related to the social and economic welfare of residents was given a value of 1. Each physical or social condition contributing to the welfare of the population, such as walls free of graffiti, was given a value of –1. We generated the social-gap index at the block level by summing all values of the variables from both questionnaires for each block. We stratified the index by sorting the blocks from the most negative case to the most positive and then divided them into approximate quintiles.4 Table 3.5 shows the resulting number of blocks by level of social gap.
In Chapter Four, we compare our resulting social-gap index with those of CONAPO and CONEVAL.
Table 3.5Number of Blocks, by Social-Gap Level
Social-Gap Level Number of Blocks Percentage of Blocks
Very low 21 18.8
Low 19 17.0
Medium 23 20.5
high 27 24.1
Very high 22 19.6
Total 112 100
4 We do not use exact quintiles because some of the blocks had identical scores.
Table 3.4Sample of Comparison Group of Basic Statistical Areas
Marginalization Index (CONAPO and CONEVAL) Number of AGEBs Number of Blocks
Low 3 18
Medium 4 24
Very high 3 12
Total 10 54
15
ChAPTer FOUr
Findings
Our final step was to compare our block-level social-gap index with the AGEB-level margin-alization and social-gap indexes produced by CONAPO and CONEVAL. Should CONAPO and CONEVAL provide good measures of poverty, then our social-gap index for individual blocks should not deviate greatly from them, particularly where the CONAPO and CONE-VAL indexes were consistent.
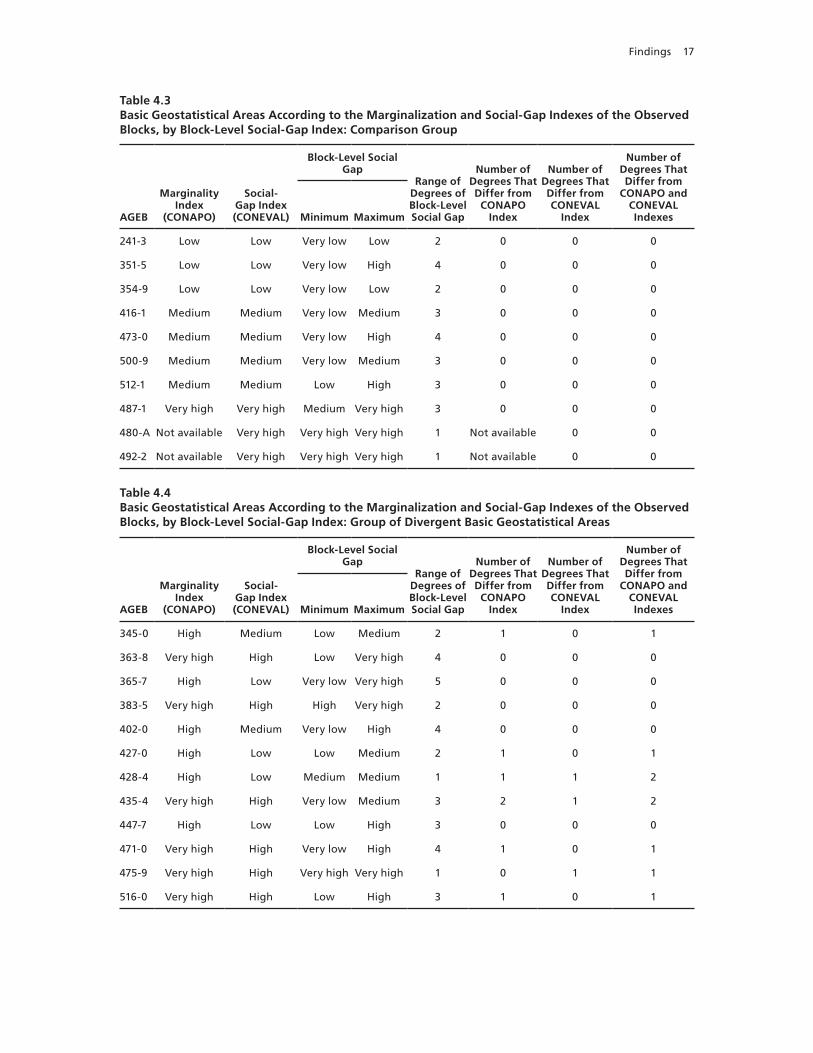
We grouped the blocks included in the neighborhood and social observation surveys by AGEB and compared them on a range of social-gap strata. We found large variation in the blocks within each AGEB. We also found, as Table 3.5 in Chapter Three shows, a very wide range of social-gap levels in these blocks. In four of the 22 AGEBs we sampled, all blocks have the same social-gap level in the index we created from our survey results. In five more, the sampled blocks all fall within two degrees of each other on the social-gap scale (e.g., very low to low). In seven AGEBs, the social-gap range lies within three degrees (e.g., very low to medium). In five AGEBs, the social-gap range lies within four degrees (either very low to high or low to very high). In one AGEB, the social-gap range encompasses all five degrees of the index.
We assessed whether the social-gap and marginality indexes of each AGEB coincided with the range of our social-gap levels by block. We defined the range of the block social gap as all the levels between the minimum and maximum social-gap levels observed by block within an AGEB. For example, in AGEB 500-9, the block-level social-gap index ranges from very low to medium, and its range encompasses three degrees (the two extremes plus low). We then compared this social-gap block range with CONAPO and CONEVAL indexes for each AGEB.
Most AGEBs in the comparison group were consistent with the social-gap rating gener-ated using the block-level social-gap index. That is, the CONEVAL and CONAPO indexes at the AGEB level indicate an average deprivation that is consistent in most cases with our block-level social-gap index for the area. For the group of AGEBs with different classifications from CONAPO and CONEVAL that do not match the rating generated by our block-level social-gap index, three AGEBs are from the CONEVAL index and eight are from in the CONAPO index do not match the rating generated by our block-level social-deprivation index.
Overall, we found that our block-level social-gap index matched the AGEB-level CONEVAL social-gap index rating in 19 of 22 AGEBs. By contrast, our block-level social-gap index matched the CONAPO index in only 14 of the 22 AGEBs.
To analyze block-level poverty both across and within AGEBs, we conducted hierarchi-cal modeling. This model allows us to assess the variability within blocks nested in the same AGEB (see Goldstein, 2011). Tables 4.1 and 4.2 show the results of the following model:
16 Geographic Targeting in Urban Areas: A Social Welfare Program for Older People in Mexico
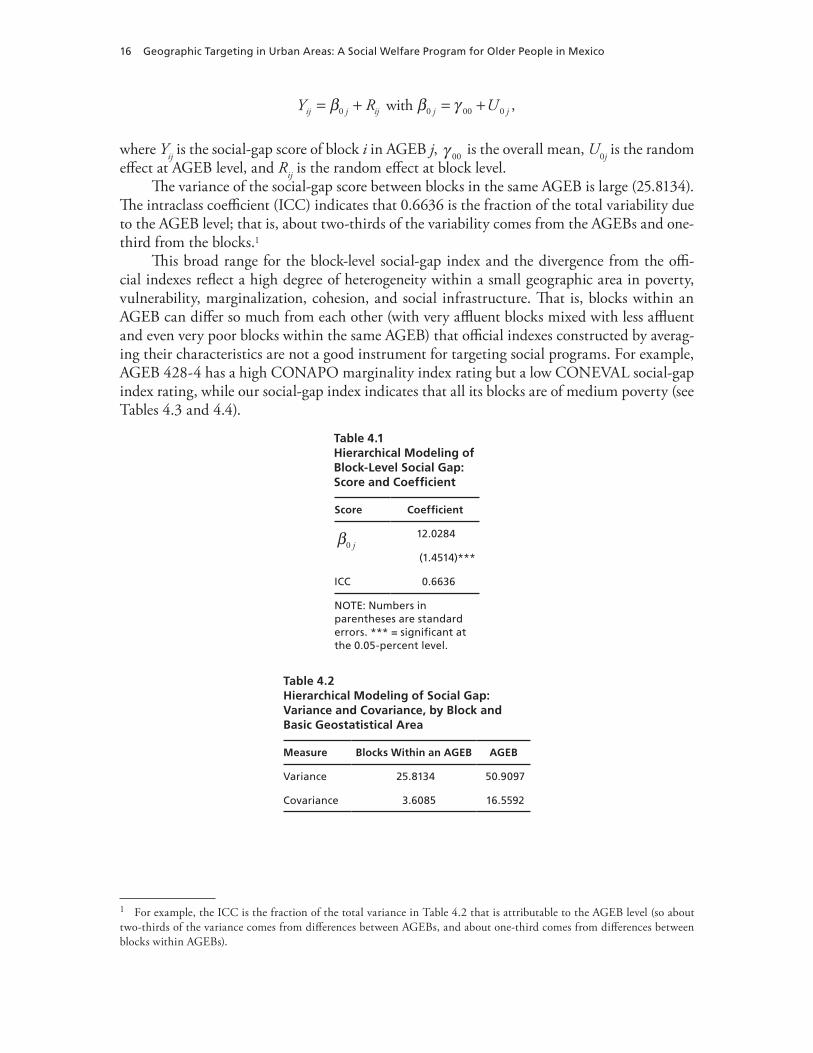
β β γ= + = +with ,0 0 00 0Y R Uij j ij j j
where Yij is the social-gap score of block i in AGEB j, γ 00 is the overall mean, U0j is the random effect at AGEB level, and Rij is the random effect at block level.
The variance of the social-gap score between blocks in the same AGEB is large (25.8134). The intraclass coefficient (ICC) indicates that 0.6636 is the fraction of the total variability due to the AGEB level; that is, about two-thirds of the variability comes from the AGEBs and one-third from the blocks.1
This broad range for the block-level social-gap index and the divergence from the offi-cial indexes reflect a high degree of heterogeneity within a small geographic area in poverty, vulnerability, marginalization, cohesion, and social infrastructure. That is, blocks within an AGEB can differ so much from each other (with very affluent blocks mixed with less affluent and even very poor blocks within the same AGEB) that official indexes constructed by averag-ing their characteristics are not a good instrument for targeting social programs. For example, AGEB 428-4 has a high CONAPO marginality index rating but a low CONEVAL social-gap index rating, while our social-gap index indicates that all its blocks are of medium poverty (see Tables 4.3 and 4.4).
1 For example, the ICC is the fraction of the total variance in Table 4.2 that is attributable to the AGEB level (so about two-thirds of the variance comes from differences between AGEBs, and about one-third comes from differences between blocks within AGEBs).
Table 4.1Hierarchical Modeling of Block-Level Social Gap: Score and Coefficient
Score Coefficient
β0 j12.0284
(1.4514)***
ICC 0.6636
nOTe: numbers in parentheses are standard errors. *** = significant at the 0.05-percent level.
Table 4.2Hierarchical Modeling of Social Gap: Variance and Covariance, by Block and Basic Geostatistical Area
Measure Blocks Within an AGEB AGEB
Variance 25.8134 50.9097
Covariance 3.6085 16.5592
Findings 17
Table 4.3Basic Geostatistical Areas According to the Marginalization and Social-Gap Indexes of the Observed Blocks, by Block-Level Social-Gap Index: Comparison Group
AGEB
Marginality Index
(CONAPO)
Social-Gap Index (CONEVAL)
Block-Level Social Gap
Range of Degrees of Block-Level Social Gap
Number of Degrees That Differ from
CONAPO Index
Number of Degrees That Differ from CONEVAL
Index
Number of Degrees That Differ from
CONAPO and CONEVAL IndexesMinimum Maximum
241-3 Low Low Very low Low 2 0 0 0
351-5 Low Low Very low high 4 0 0 0
354-9 Low Low Very low Low 2 0 0 0
416-1 Medium Medium Very low Medium 3 0 0 0
473-0 Medium Medium Very low high 4 0 0 0
500-9 Medium Medium Very low Medium 3 0 0 0
512-1 Medium Medium Low high 3 0 0 0
487-1 Very high Very high Medium Very high 3 0 0 0
480-A not available Very high Very high Very high 1 not available 0 0
492-2 not available Very high Very high Very high 1 not available 0 0
Table 4.4Basic Geostatistical Areas According to the Marginalization and Social-Gap Indexes of the Observed Blocks, by Block-Level Social-Gap Index: Group of Divergent Basic Geostatistical Areas
AGEB
Marginality Index
(CONAPO)
Social-Gap Index (CONEVAL)
Block-Level Social Gap
Range of Degrees of Block-Level Social Gap
Number of Degrees That Differ from
CONAPO Index
Number of Degrees That Differ from CONEVAL
Index
Number of Degrees That Differ from
CONAPO and CONEVAL IndexesMinimum Maximum
345-0 high Medium Low Medium 2 1 0 1
363-8 Very high high Low Very high 4 0 0 0
365-7 high Low Very low Very high 5 0 0 0
383-5 Very high high high Very high 2 0 0 0
402-0 high Medium Very low high 4 0 0 0
427-0 high Low Low Medium 2 1 0 1
428-4 high Low Medium Medium 1 1 1 2
435-4 Very high high Very low Medium 3 2 1 2
447-7 high Low Low high 3 0 0 0
471-0 Very high high Very low high 4 1 0 1
475-9 Very high high Very high Very high 1 0 1 1
516-0 Very high high Low high 3 1 0 1

18 Geographic Targeting in Urban Areas: A Social Welfare Program for Older People in Mexico
Overall, we did find that the social-gap index that CONEVAL generated for persons in Merida at least 60 years old is a better match to our block-level social-gap index than the CONAPO marginalization index.
19
ChAPTer FIVe
Conclusions
Public policy targeting remains important because resources to alleviate poverty are scarce. Targeting offers more-efficient means of delivering more resources to those most in need.
There are various techniques and methods to targeting public policies. In this report, we describe a geographic-targeting experiment conducted in Merida, Yucatan. From the results of the project, we believe that it is necessary to further refine the georeference tools for determin-ing block-level marginalization in large cities. Using better tools can help programs increase benefits and make benefit distribution reach those in greatest need.
We found discrepancies in the official classifications of marginality levels by AGEB, as well as within our own block-level index. For this reason, Reconocer Urbano was not targeted but rather implemented among all adults at least 70 years of age within a randomly selected sample of blocks (Aguila, Borges, et al., forthcoming).
Our project heavily emphasized the construction of a geographical marginality index with greater disaggregation levels than previous indexes. A team working on the design and evalu-ation of public policies should attend to addressing these three main challenges in targeting:
• Countries that, like Mexico, have rapidly aging populations, need to develop specific socioeconomic indicators for the elderly.
• Public and private agencies involved in design of public policies need to develop better instruments for social observation and refine targeting methods.
• Those who would target programs should continue gathering information and develop better tools to build block-level marginalization indexes. These would be useful for tar-geting populations with high levels of social and economic inequalities, such as those in Mexico.

21
References
Aguila, Emma, Abril Borges, Arie Kapteyn, Rosalba Robles, and Beverly A. Weidmer, A Noncontributory Pension Program for Older Persons in Yucatan, Mexico: Implementing and Designing the Evaluation of the Program in Merida, Santa Monica, Calif.: RAND Corporation, TR-1288/2-SOY/NIA, forthcoming.
Aguila, Emma, Arie Kapteyn, Rosalba Robles, Oscar Vargas, and Beverly A. Weidmer, A Noncontributory Pension Program for Older Persons in Yucatan, Mexico: Implementing and Designing the Evaluation of the Program in Valladolid, Santa Monica, Calif.: RAND Corporation, TR-1288/1-SOY/NIA, forthcoming.
Akerlof, George A., “The Economics of ‘Tagging’ as Applied to the Optimal Income Tax, Welfare Programs, and Manpower Planning,” American Economic Review, Vol. 68, No. 1, March 1978, pp. 8–19.
Akinyemi, Felicia, “A Conceptual Poverty Mapping Data Model,” Transactions in GIS, Vol. 14, No. S1, July 2010, pp. 85–100.
Arias, Omar, and Marcos Robles, “The Geography of Monetary Poverty in Bolivia: The Lessons of Poverty Maps,” in Tara Bedi, Aline Coudouel, and Kenneth Simler, eds., More Than a Pretty Picture: Using Poverty Maps to Design Better Policies and Interventions, Washington, D.C.: World Bank, 2007, pp. 67–89. As of May 29, 2013: http://siteresources.worldbank.org/INTPGI/Resources/342674-1092157888460/493860-1192739384563/ 10412-04_p067-089.pdf
Baker, Judy L., and Margaret E. Grosh, Measuring the Effects of Geographic Targeting on Poverty Reduction, Washington, D.C.: World Bank, Living Standards Measurement Study Working Paper 99, 1994.
Bedi, Tara, Aline Coudouel, and Kenneth Simler, eds., More Than a Pretty Picture: Using Poverty Maps to Design Better Policies and Interventions, Washington, D.C.: World Bank, 2007. As of May 29, 2013: http://siteresources.worldbank.org/INTPGI/Resources/342674-1092157888460/493860-1192739384563/ 10412-04_p067-089.pdf
Besley, Timothy, and Ravi Kanbur, The Principles of Targeting, Washington, D.C.: World Bank, March 31, 1990. As of May 29, 2013: http://econ.worldbank.org/external/default/main?pagePK=64165259&theSitePK=469372&piPK=64165421&menuPK=64166093&entityID=000009265_3960928225215
Bigman, David, and Hippolyte Fofack, “Geographical Targeting for Poverty Alleviation: An Introduction to the Special Issue,” World Bank Economic Review, Vol. 14, No. 1, January 2000, pp. 129–145.
Bigman, David, and P. V. Srinivasan, “Geographical Targeting of Poverty Alleviation Programs: Methodology and Applications in Rural India,” Journal of Policy Modeling, Vol. 24, No. 3, June 2002, pp. 237–255.
Bjornstrom, Eileen, “To Live and Die in L.A. County: Neighborhood Economic and Social Context and Premature Age-Specific Mortality Rates Among Latinos,” Health and Place, Vol. 17, No. 1, January 2011, pp. 230–237.
Coady, David P., An Evaluation of the Distributional Power of PROGRESA’s Cash Transfers in Mexico, Washington, D.C.: International Food Policy Research Institute, Food Consumption and Nutrition Division Discussion Paper 117, July 2001. As of May 29, 2013: http://www.ifpri.org/sites/default/files/pubs/divs/fcnd/dp/papers/fcndp117.pdf
22 Geographic Targeting in Urban Areas: A Social Welfare Program for Older People in Mexico
Coady, David P., Margaret Grosh, and John Hoddinott, Targeting of Transfers in Developing Countries: Review of Lessons and Experience, Washington, D.C.: World Bank, 2004. As of May 29, 2013: http://siteresources.worldbank.org/SAFETYNETSANDTRANSFERS/Resources/281945-1138140795625/Targeting_En.pdf
Cohen, Deborah, Sanae Inagami, and Brian Karl Finch, “The Built Environment and Collective Efficacy,” Health and Place, Vol. 14, No. 2, June 2008, pp. 198–207.
CONAPO—See Consejo Nacional de Población.
CONEVAL—See Consejo Nacional de Evaluación de la Política de Desarrollo Social.
Consejo Nacional de Evaluación de la Política de Desarrollo Social, Los mapas de Pobreza en México: Anexo técnico metodológico [Maps of poverty in Mexico: Technical methodology annex], Distrito Federal, July 2007. As of May 29, 2013: http://www.coneval.gob.mx/rw/resource/coneval/med_pobreza/1024.pdf
———, Methodology for Multidimensional Poverty Measurement in Mexico, September 3, 2010. As of May 29, 2013: http://www.coneval.gob.mx/rw/resource/coneval/med_pobreza/MPMMPingles100903.pdf
———, “Social Gap Index,” October 4, 2011.
Consejo Nacional de Población, “Índice de marginación urbana 2005,” [Index of urban marginalization 2005], last modified May 31, 2012. As of May 29, 2013: http://www.conapo.gob.mx/es/CONAPO/Indice_de_marginacion_urbana_2005
Creighton, Mathew J., Noreen Goldman, and Anne R. Pebley, “The Multiple Dimensions of Immigrant Acculturation and Obesity Among Mexican-Americans,” prepared for the Population Association of America, 2011.
Dalenius, Tore, and Joseph L. Hodges Jr., “The Choice of Stratification Points,” Scandinavian Actuarial Journal, Vol. 1957, No. 3–4, 1957, pp. 198–203.
———, “Minimum Variance Stratification,” Journal of the American Statistical Association, Vol. 54, No. 285, March 1959, pp. 88–101.
Dirección de Análisis Territorial, “La Estrategia 100x100,” undated. As of June 25, 2013: http://www.estrategia100x100.gob.mx/
Elbers, Chris, Jean O. Lanjouw, and Peter Lanjouw, “Micro-Level Estimation of Poverty and Inequality,” Econometrica, Vol. 71, No. 1, January 2003, pp. 355–364.
Fish, Jason S., Susan Ettner, Alfonso Ang, and Arleen F. Brown, “Association of Perceived Neighborhood Safety on Body Mass Index,” Vol. 100, No. 11, November 2010, pp. 2296–2303.
Foster, James E., A Report on Mexican Multidimensional Poverty Measurement, Oxford, UK: Oxford Poverty and Human Development Initiative Working Paper 40, December 2010. As of May 29, 2013: http://www.ophi.org.uk/a-report-on-mexican-multidimensional-poverty-measurement/
Fujii, Tomoki, “How Well Can We Target Aid with Rapidly Collected Data? Empirical Results for Poverty Mapping from Cambodia,” World Development, Vol. 36, No. 10, October 2008, pp. 1830–1842.
Goldstein, Harvey, Multilevel Statistical Models, Hoboken, N.J.: Wiley, 2011.
Hernández, Daniel, Mónica Orozco, and Sirenia Vázquez, La focalización como estrategia de política pública, Secretaría de Desarrollo Social, November 2005. As of May 29, 2013: http://www.2006-2012.sedesol.gob.mx/work/models/SEDESOL/Resource/2155/1/images/ Docu_25_2003.pdf
L.A.FANS—See Los Angeles Family and Neighborhood Survey.
Lara-Cinisomo, Sandraluz, and Anne R. Pebley, Los Angeles County Young Children’s Literacy Experiences, Emotional Well-Being and Skills Acquisition: Results from the Los Angeles Family and Neighborhood Survey, Santa Monica, Calif.: RAND Corporation, DRU-3041-LAFANS, 2003. As of May 29, 2013: http://www.rand.org/pubs/drafts/DRU3041.html
references 23
Liconsa, “Conoce a Liconsa,” last modified December 4, 2012. As of May 30, 2013: http://www.liconsa.gob.mx/conoce-a-liconsa/
Los Angeles Family and Neighborhood Survey, “L.A.FANS-1 Questionnaires,” last modified January 23, 2012. As of May 30, 2013: http://lasurvey.rand.org/documentation/questionnaires/
Pebley, Anne R., and Narayan Sastry, Concentrated Poverty vs. Concentrated Affluence: Effects on Neighborhood Social Environments and Children’s Outcomes, Santa Monica, Calif.: RAND Corporation, DRU-2400/10-LAFANS, 2003. As of May 29, 2013: http://www.rand.org/pubs/drafts/DRU2400z10.html
Ravallion, Martin, and Kalvin Chao, “Targeted Policies for Poverty Alleviation Under Imperfect Information: Algorithms and Applications,” Journal of Policy Modeling, Vol. 11, No. 2, Summer 1989, pp. 213–224.
Ravallion, Martin, and Quentin Wodon, “Poor Areas, or Only Poor People?” Journal of Regional Science, Vol. 39, No. 4, November 1999, pp. 689–711.
Sastry, Narayan, Bonnie Ghosh-Dastidar, John L. Adams, and Anne R. Pebley, “The Design of a Multilevel Survey of Children, Families, and Communities: The Los Angeles Family and Neighborhood Survey,” Social Science Research, Vol. 35, No. 4, December 2006, pp. 1000–1024. As of May 29, 2013: http://www.rand.org/pubs/reprints/RP1241.html
Secretaria de Desarrollo Social, “Programa Microrregiones,” last updated August 10, 2011. As of June 25, 2013: http://www.2006-2012.sedesol.gob.mx/en/SEDESOL/_Programa_Microrregiones
———, “Hábitat,” last updated December 3, 2012. As of June 25, 2013: http://www.2006-2012.sedesol.gob.mx/es/SEDESOL/Habitat_Transparencia
Skoufias, Emmanuel, and David P. Coady, “Are the Welfare Losses from Imperfect Targeting Important?” Economica, Vol. 74, No. 296, November 2007, pp. 756–776.
Skoufias, Emmanuel, B. Davis, and S. de la Vega, “Targeting the Poor in Mexico: An Evaluation of the Selection of Households into PROGRESA,” World Development, Vol. 29, No. 10, October 2001, pp. 1769–1784.
Way, Sandra, Brian K. Finch, and Deborah Cohen, “Hispanic Concentration and the Conditional Influence of Collective Efficacy on Adolescent Childbearing,” Archives of Pediatrics and Adolescent Medicine, Vol. 160, No. 9, September 2006, pp. 925–930.


![[Citibank] Latin America Training and Development Center - Basic Treasury](https://static.fdocuments.net/doc/165x107/55cf9bff550346d033a82cc1/citibank-latin-america-training-and-development-center-basic-treasury.jpg)