
Scholarship Foundation of Santa Barbara - 2014 College Scholars Academy
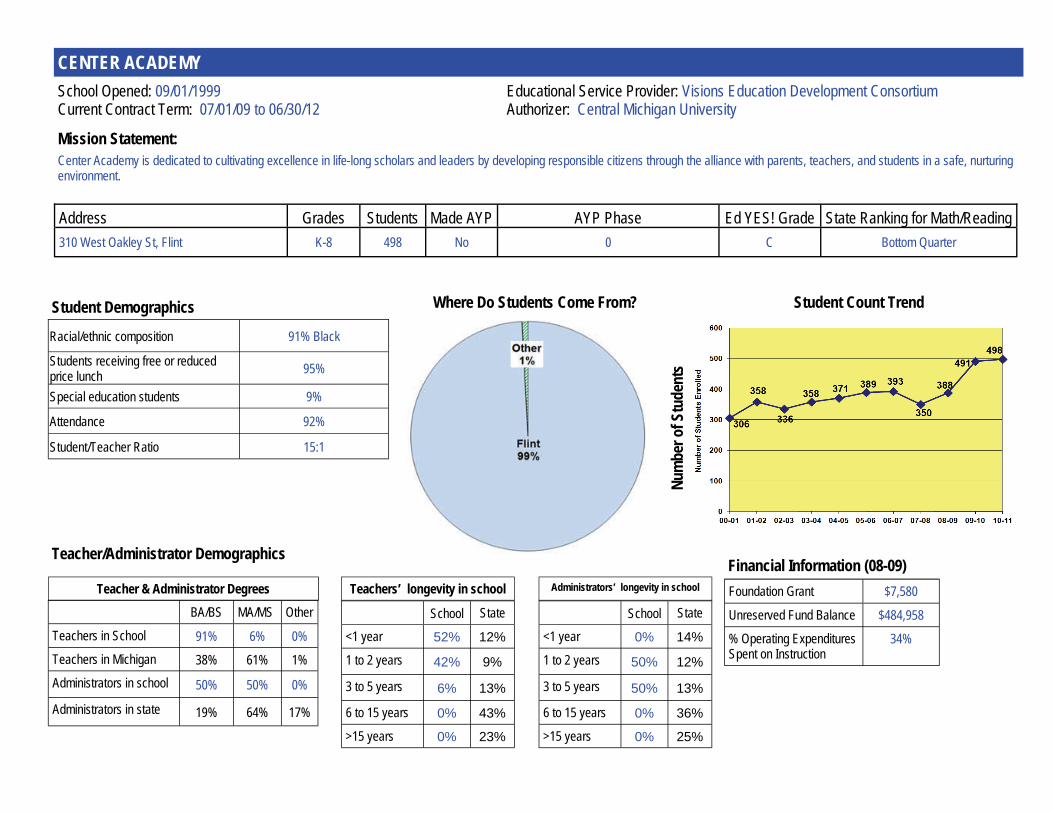
Center Academy is dedicated to cultivating excellence in life-long scholars and leaders by developing responsible citizens through the alliance with parents, teachers, and students in a safe, nurturing environment.
Mission Statement:
Num
ber o
f Stu
dent
s
Student Demographics Racial/ethnic composition 91% Black
Students receiving free or reduced price lunch 95%
Special education students 9%
Attendance 92%
Student/Teacher Ratio 15:1
Where Do Students Come From? Student Count Trend
School Opened: 09/01/1999 Current Contract Term: 07/01/09 to 06/30/12
Educational Service Provider: Visions Education Development Consortium Authorizer: Central Michigan University
Teacher/Administrator Demographics
BA/BS MA/MS Other
Teachers in School 91% 6% 0% Teachers in Michigan 38% 61% 1% Administrators in school 50% 50% 0%
Administrators in state 19% 64% 17%
Teacher & Administrator Degrees Foundation Grant $7,580
Unreserved Fund Balance $484,958
% Operating Expenditures Spent on Instruction
34%
Financial Information (08-09)
School State
<1 year 52% 12%
1 to 2 years 42% 9%
3 to 5 years 6% 13%
6 to 15 years 0% 43%
>15 years 0% 23%
Teachers’ longevity in school
School State
<1 year 0% 14%
1 to 2 years 50% 12%
3 to 5 years 50% 13%
6 to 15 years 0% 36%
>15 years 0% 25%
Administrators’ longevity in school
Address Grades Students Made AYP AYP Phase Ed YES! Grade State Ranking for Math/Reading 310 West Oakley St, Flint K-8 498 No 0 C Bottom Quarter
CENTER ACADEMY

Percentage of 5th Graders Proficient on MEAP Percentage of 8th Graders Proficient on MEAP
CENTER ACADEMY ACHIEVEMENT DATA
Student Progress from 2009 to 2010 on MEAP tests for 7th to 8th Grade Percentage of Students Proficient on MEAP
MEAP 2008
MEAP 2009
MEAP 2010
State MEAP 2010
Math 3 81 86 87 95 Math 4 78 84 81 91 Math 5 54 38 59 80 Math 6 48 65 69 84 Math 7 52 49 61 85 Math 8 49 28 54 78
Reading 3 70 73 70 87 Reading 4 70 63 66 84 Reading 5 49 62 72 85 Reading 6 61 67 51 84 Reading 7 55 53 53 79 Reading 8 69 69 64 82
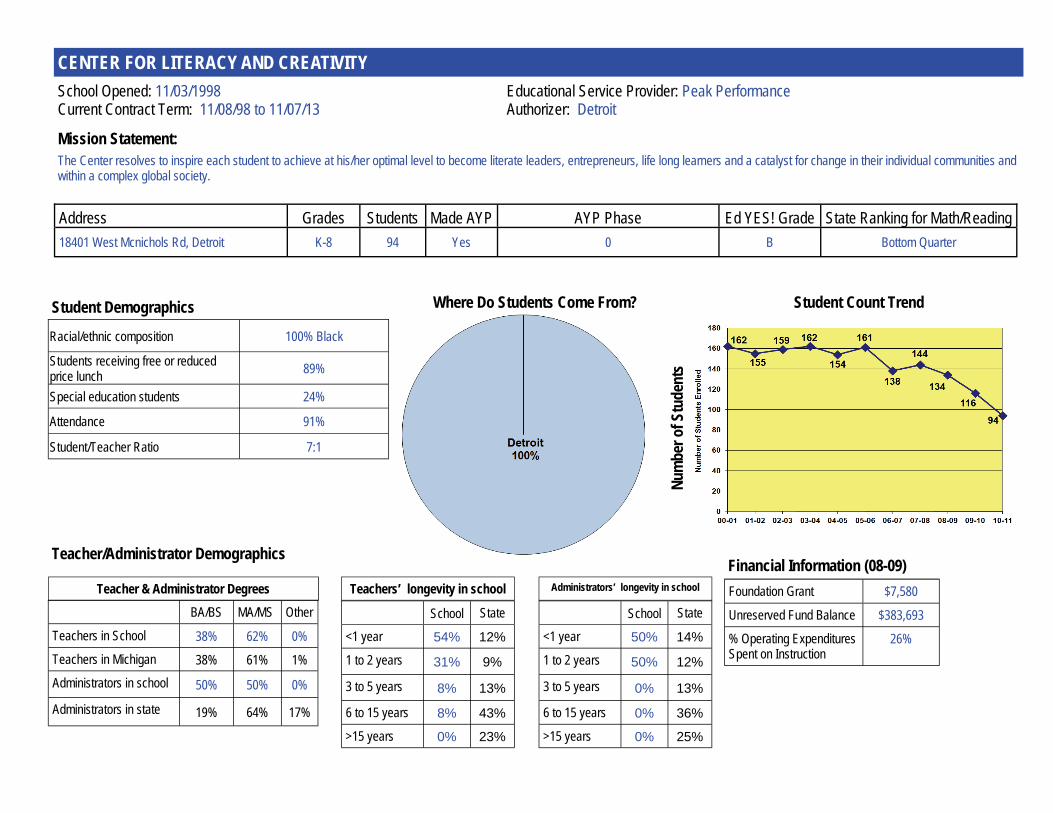
The Center resolves to inspire each student to achieve at his/her optimal level to become literate leaders, entrepreneurs, life long learners and a catalyst for change in their individual communities and within a complex global society.
Mission Statement:
Num
ber o
f Stu
dent
s
Student Demographics Racial/ethnic composition 100% Black
Students receiving free or reduced price lunch 89%
Special education students 24%
Attendance 91%
Student/Teacher Ratio 7:1
Where Do Students Come From? Student Count Trend
School Opened: 11/03/1998 Current Contract Term: 11/08/98 to 11/07/13
Educational Service Provider: Peak Performance Authorizer: Detroit
Teacher/Administrator Demographics
BA/BS MA/MS Other
Teachers in School 38% 62% 0% Teachers in Michigan 38% 61% 1% Administrators in school 50% 50% 0%
Administrators in state 19% 64% 17%
Teacher & Administrator Degrees Foundation Grant $7,580
Unreserved Fund Balance $383,693
% Operating Expenditures Spent on Instruction
26%
Financial Information (08-09)
School State
<1 year 54% 12%
1 to 2 years 31% 9%
3 to 5 years 8% 13%
6 to 15 years 8% 43%
>15 years 0% 23%
Teachers’ longevity in school
School State
<1 year 50% 14%
1 to 2 years 50% 12%
3 to 5 years 0% 13%
6 to 15 years 0% 36%
>15 years 0% 25%
Administrators’ longevity in school
Address Grades Students Made AYP AYP Phase Ed YES! Grade State Ranking for Math/Reading 18401 West Mcnichols Rd, Detroit K-8 94 Yes 0 B Bottom Quarter
CENTER FOR LITERACY AND CREATIVITY

Percentage of 5th Graders Proficient on MEAP Percentage of 8th Graders Proficient on MEAP
CENTER FOR LITERACY AND CREATIVITY ACHIEVEMENT DATA
Student Progress from 2009 to 2010 on MEAP tests for 7th to 8th Grade Percentage of Students Proficient on MEAP
MEAP 2008
MEAP 2009
MEAP 2010
State MEAP 2010
Math 3 94 91 * 95 Math 4 77 71 * 91 Math 5 87 73 39 80 Math 6 79 * * 84 Math 7 96 100 * 85 Math 8 84 100 76 78
Reading 3 88 91 * 87 Reading 4 83 71 * 84 Reading 5 87 73 62 85 Reading 6 92 * * 84 Reading 7 91 47 * 79 Reading 8 95 88 62 82
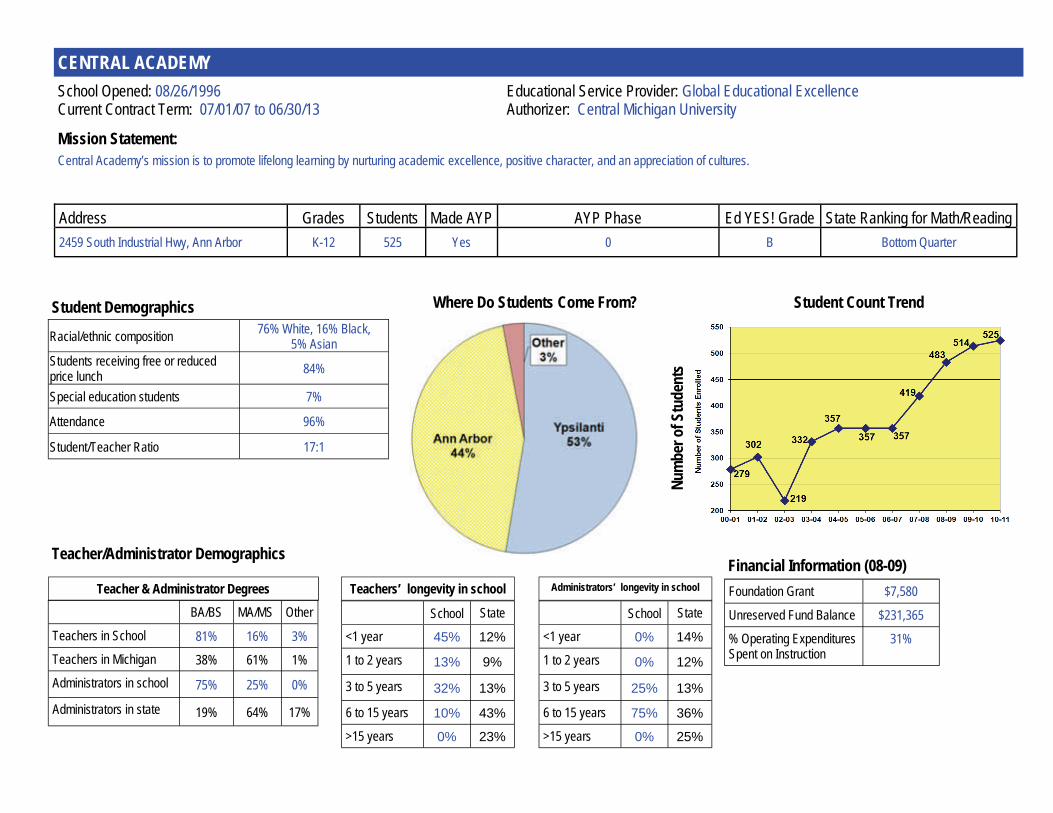
Central Academy’s mission is to promote lifelong learning by nurturing academic excellence, positive character, and an appreciation of cultures. Mission Statement:
Num
ber o
f Stu
dent
s
Student Demographics Racial/ethnic composition 76% White, 16% Black,
5% Asian Students receiving free or reduced price lunch 84%
Special education students 7%
Attendance 96%
Student/Teacher Ratio 17:1
Where Do Students Come From? Student Count Trend
School Opened: 08/26/1996 Current Contract Term: 07/01/07 to 06/30/13
Educational Service Provider: Global Educational Excellence Authorizer: Central Michigan University
Teacher/Administrator Demographics
BA/BS MA/MS Other
Teachers in School 81% 16% 3% Teachers in Michigan 38% 61% 1% Administrators in school 75% 25% 0%
Administrators in state 19% 64% 17%
Teacher & Administrator Degrees Foundation Grant $7,580
Unreserved Fund Balance $231,365
% Operating Expenditures Spent on Instruction
31%
Financial Information (08-09)
School State
<1 year 45% 12%
1 to 2 years 13% 9%
3 to 5 years 32% 13%
6 to 15 years 10% 43%
>15 years 0% 23%
Teachers’ longevity in school
School State
<1 year 0% 14%
1 to 2 years 0% 12%
3 to 5 years 25% 13%
6 to 15 years 75% 36%
>15 years 0% 25%
Administrators’ longevity in school
Address Grades Students Made AYP AYP Phase Ed YES! Grade State Ranking for Math/Reading 2459 South Industrial Hwy, Ann Arbor K-12 525 Yes 0 B Bottom Quarter
CENTRAL ACADEMY

4-Year Cohort 4-Year Graduation Rates 4-Year Dropout Rates
2008 2009 2010 2008 2009 2010 2008 2009 2010
School 19 23 22 89% 96% 100% 0% 0% 0%
State 145,097 142,322 138,003 76% 75% 76% 14% 11% 11%
4 YEAR GRADUATION AND DROPOUT REPORT
CENTRAL ACADEMY ACHIEVEMENT DATA Percentage of Students Proficient on MEAP
MEAP 2008
MEAP 2009
MEAP 2010
State MEAP 2010
Math 3 88 96 96 95 Math 4 74 80 86 91 Math 5 85 83 74 80 Math 6 56 91 76 84 Math 7 67 68 95 85 Math 8 68 41 68 78
Math MME 33 30 25 52
Reading 3 72 82 78 87 Reading 4 63 59 71 84 Reading 5 80 61 86 85 Reading 6 67 98 65 84 Reading 7 68 55 81 79 Reading 8 62 68 85 82
Reading MME 38 35 45 63
MME 2009
MME 2010
MME 2011
State MME 2011
Student Progress from 2009 to 2010 on MEAP tests for 7th to 8th Grade
COLLEGE READY REPORT Percent College Ready in…
2008 Percent Meeting or Exceeding Benchmarks
2009 Percent Meeting or Exceeding Benchmarks
2010 Percent Meeting or Exceeding Benchmarks
2011 Percent Meeting or Exceeding Benchmarks
All Subjects 0 0 5 6 English 33 33 30 44 Mathematics 17 5 25 11 Reading 22 19 15 22 Science 6 10 5 6 *ACT Definition of College and Career Readiness is defined as the percentage of students that meet the following four minimum scores on the ACT: 18 on English, 22 on math, 21 on reading and 24 on science. Research by the ACT suggests that meeting the college readiness benchmarks allows for a 50% chance of obtaining a B or higher or about a 75% chance of obtaining a C or higher in college courses of the same subject area.)

CESAR CHAVEZ ACADEMY
César Chávez Academy, in cooperation with parents and the community, will provide for the unique needs of our students through innovative experiences in a fully inclusive, safe and nurturing environment.
Mission Statement:
Num
ber o
f Stu
dent
s
Student Demographics Racial/ethnic composition 90% Hispanic, 5% White
Students receiving free or reduced price lunch 97%
Special education students 10% Attendance 91%
Student/Teacher Ratio 15:1
Where Do Students Come From? Student Count Trend
School Opened: 09/03/1996 Current Contract Term: 07/01/11 to 06/30/16
Educational Service Provider: Leona Group Authorizer: Saginaw Valley State University
Teacher/Administrator Demographics
BA/BS MA/MS Other
Teachers in School 93% 7% 0% Teachers in Michigan 38% 61% 1% Administrators in school 83% 0% 17%
Administrators in state 19% 64% 17%
Teacher & Administrator Degrees Foundation Grant $7,580
Unreserved Fund Balance $2,342,310
% Operating Expenditures Spent on Instruction
37%
Financial Information (08-09)
School State
<1 year 41% 12%
1 to 2 years 18% 9%
3 to 5 years 24% 13%
6 to 15 years 17% 43%
>15 years 0% 23%
Teachers’ longevity in school
School State
<1 year 17% 14%
1 to 2 years 8% 12%
3 to 5 years 33% 13%
6 to 15 years 42% 36%
>15 years 0% 25%
Administrators’ longevity in school
Address Grades Students Made AYP AYP Phase Ed YES! Grade 8126 West Vernor Hwy, Detroit K-2 455 Yes 0 A
4100 Martin St, Detroit 3-5 378 Yes 0 B
6782 Goldsmith St, Detroit 6-8 591 Yes 0 B
Statewide Percentile Ranking Bottom Quarter
Not Ranked
Bottom Quarter
1761 Waterman St, Detroit 9-12 721 No Identified for Restructuring - Year One C 3rd Quarter

4-Year Cohort 4-Year Graduation Rates 4-Year Dropout Rates
2008 2009 2010 2008 2009 2010 2008 2009 2010
School 117 138 114 62% 62% 77% 31% 31% 18%
State 145,097 142,322 138,003 76% 75% 76% 14% 11% 11%
4 YEAR GRADUATION AND DROPOUT REPORT
CESAR CHAVEZ ACADEMY ACHIEVEMENT DATA Percentage of Students Proficient on MEAP
MEAP 2008
MEAP 2009
MEAP 2010
State MEAP 2010
Math 3 94 99 97 95 Math 4 92 90 96 91 Math 5 69 75 73 80 Math 6 78 85 91 84 Math 7 80 79 91 85 Math 8 66 55 64 78
Math MME 26 35 42 52
Reading 3 76 86 80 87 Reading 4 82 53 81 84 Reading 5 60 68 67 85 Reading 6 54 73 67 84 Reading 7 60 55 56 79 Reading 8 61 71 65 82
Reading MME 36 52 40 63
MME 2009
MME 2010
MME 2011
State MME 2011
Student Progress from 2009 to 2010 on MEAP tests for 7th to 8th Grade
COLLEGE READY REPORT Percent College Ready in…
2008 Percent Meeting or Exceeding Benchmarks
2009 Percent Meeting or Exceeding Benchmarks
2010 Percent Meeting or Exceeding Benchmarks
2011 Percent Meeting or Exceeding Benchmarks
All Subjects 1 1 2 1 English 13 22 34 37 Mathematics 3 10 9 16 Reading 10 11 21 12 Science 2 1 5 2 *ACT Definition of College and Career Readiness is defined as the percentage of students that meet the following four minimum scores on the ACT: 18 on English, 22 on math, 21 on reading and 24 on science. Research by the ACT suggests that meeting the college readiness benchmarks allows for a 50% chance of obtaining a B or higher or about a 75% chance of obtaining a C or higher in college courses of the same subject area.)

Address Grades Students Made AYP AYP Phase Ed YES! Grade 20200 Kelly Rd, Harper Woods K-5 1003 Yes 0 B
20100 Kelly Rd, Harper Woods 6-8 638 Yes 0 C
20254 Kelly Road, Harper Woods 9-12 659 No 0 D
State Ranking for Math/Reading Bottom Quarter
Not Ranked
Bottom Quarter
Our mission is to deliver unparalleled academic excellence through character development and leadership and to prepare students and parents for education beyond high school. Mission Statement:
Num
ber o
f Stu
dent
s
Where Do Students Come From? Student Count Trend
School Opened: 06/02/1997 Current Contract Term: 12/14/01 to 06/30/12
Educational Service Provider: Varner& Associates Authorizer: Saginaw Valley State University
Teacher/Administrator Demographics
BA/BS MA/MS Other
Teachers in School 74% 25% 1% Teachers in Michigan 38% 61% 1% Administrators in school 25% 75% 0%
Administrators in state 19% 64% 17%
Teacher & Administrator Degrees Foundation Grant $7,580
Unreserved Fund Balance $4,702,516
% Operating Expenditures Spent on Instruction
44%
Financial Information (08-09)
School State
<1 year 46% 12%
1 to 2 years 33% 9%
3 to 5 years 20% 13%
6 to 15 years 2% 43%
>15 years 0% 23%
Teachers’ longevity in school
School State
<1 year 25% 14%
1 to 2 years 25% 12%
3 to 5 years 38% 13%
6 to 15 years 13% 36%
>15 years 0% 25%
Administrators’ longevity in school
CHANDLER PARK ACADEMY
Student Demographics Racial/ethnic composition 98% Black
Students receiving free or reduced price lunch 91%
Special education students 2%
Attendance 100%
Student/Teacher Ratio 20:1
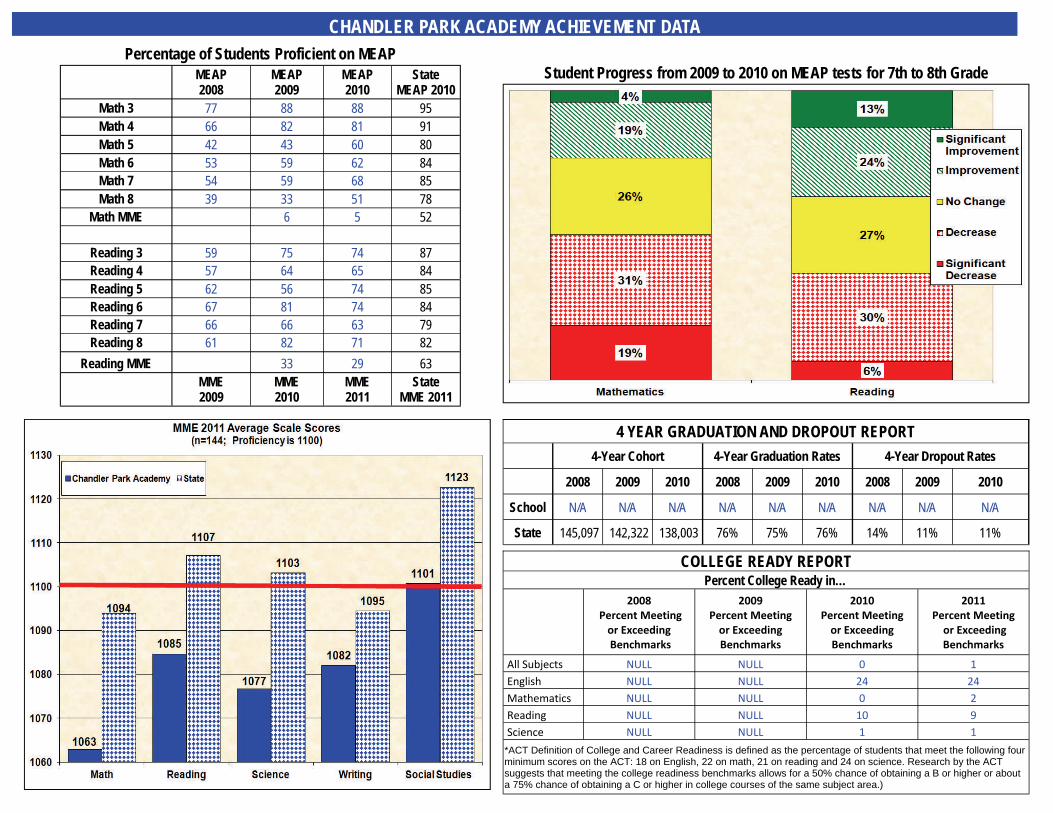
CHANDLER PARK ACADEMY ACHIEVEMENT DATA Percentage of Students Proficient on MEAP
MEAP 2008
MEAP 2009
MEAP 2010
State MEAP 2010
Math 3 77 88 88 95 Math 4 66 82 81 91 Math 5 42 43 60 80 Math 6 53 59 62 84 Math 7 54 59 68 85 Math 8 39 33 51 78
Math MME 6 5 52
Reading 3 59 75 74 87 Reading 4 57 64 65 84 Reading 5 62 56 74 85 Reading 6 67 81 74 84 Reading 7 66 66 63 79 Reading 8 61 82 71 82
Reading MME 33 29 63
MME 2009
MME 2010
MME 2011
State MME 2011
Student Progress from 2009 to 2010 on MEAP tests for 7th to 8th Grade
4-Year Cohort 4-Year Graduation Rates 4-Year Dropout Rates
2008 2009 2010 2008 2009 2010 2008 2009 2010
School N/A N/A N/A N/A N/A N/A N/A N/A N/A
State 145,097 142,322 138,003 76% 75% 76% 14% 11% 11%
4 YEAR GRADUATION AND DROPOUT REPORT
COLLEGE READY REPORT Percent College Ready in…
2008 Percent Meeting or Exceeding Benchmarks
2009 Percent Meeting or Exceeding Benchmarks
2010 Percent Meeting or Exceeding Benchmarks
2011 Percent Meeting or Exceeding Benchmarks
All Subjects NULL NULL 0 1 English NULL NULL 24 24 Mathematics NULL NULL 0 2 Reading NULL NULL 10 9 Science NULL NULL 1 1 *ACT Definition of College and Career Readiness is defined as the percentage of students that meet the following four minimum scores on the ACT: 18 on English, 22 on math, 21 on reading and 24 on science. Research by the ACT suggests that meeting the college readiness benchmarks allows for a 50% chance of obtaining a B or higher or about a 75% chance of obtaining a C or higher in college courses of the same subject area.)

Working in partnership with parents and community, the Chandler Woods Charter Academy staff will offer a challenging, character-based education Mission Statement:
Num
ber o
f Stu
dent
s
Student Demographics Racial/ethnic composition 92% White
Students receiving free or reduced price lunch 23%
Special education students 10%
Attendance 96%
Student/Teacher Ratio 14:1
Where Do Students Come From? Student Count Trend
School Opened: 09/01/1999 Current Contract Term: 08/24/09 to 06/30/16
Educational Service Provider: National Heritage Academies Authorizer: Grand Valley State University
Teacher/Administrator Demographics
BA/BS MA/MS Other
Teachers in School 67% 33% 0% Teachers in Michigan 38% 61% 1% Administrators in school 0% 100% 0%
Administrators in state 19% 64% 17%
Teacher & Administrator Degrees Foundation Grant $7,331
Unreserved Fund Balance $6,511
% Operating Expenditures Spent on Instruction
37%
Financial Information (08-09)
School State
<1 year 37% 12%
1 to 2 years 31% 9%
3 to 5 years 14% 13%
6 to 15 years 18% 43%
>15 years 0% 23%
Teachers’ longevity in school
School State
<1 year 0% 14%
1 to 2 years 100% 12%
3 to 5 years 0% 13%
6 to 15 years 0% 36%
>15 years 0% 25%
Administrators’ longevity in school
Address Grades Students Made AYP AYP Phase Ed YES! Grade State Ranking for Math/Reading 6895 Samrick Ave NE, Belmont K-8 712 Yes 0 A Top Quarter
CHANDLER WOODS CHARTER ACADEMY
Percentage of 5th Graders Proficient on MEAP Percentage of 8th Graders Proficient on MEAP
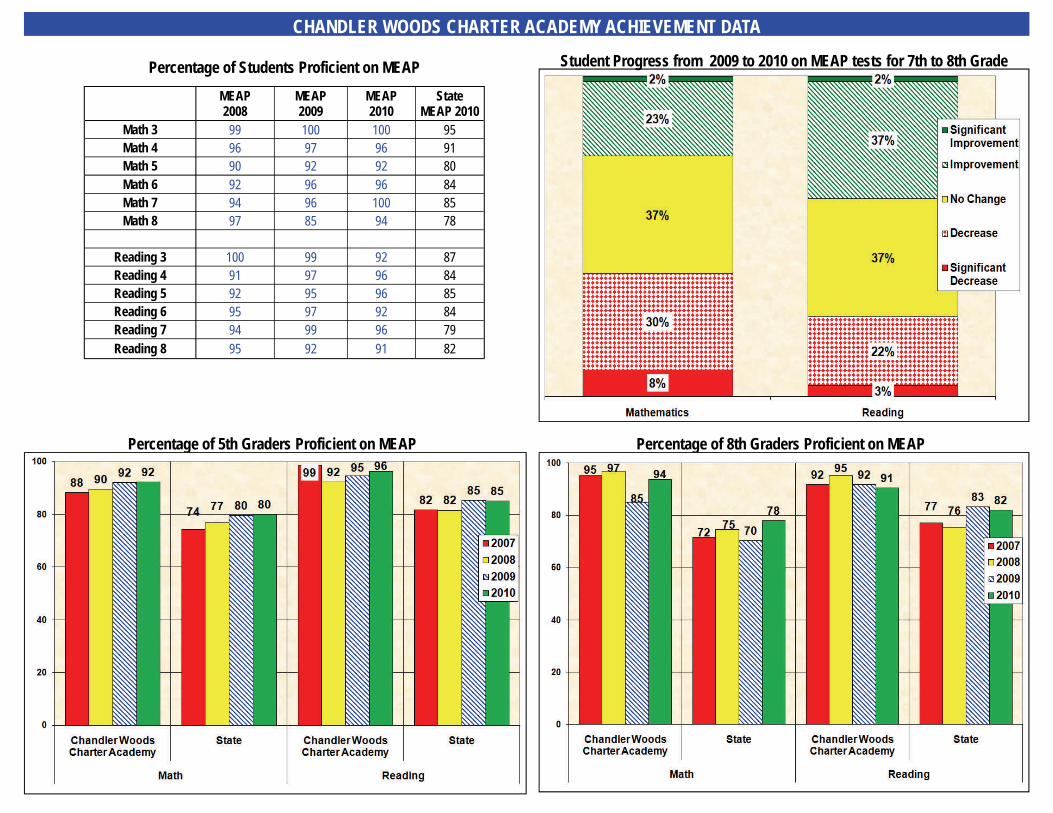
CHANDLER WOODS CHARTER ACADEMY ACHIEVEMENT DATA
Student Progress from 2009 to 2010 on MEAP tests for 7th to 8th Grade Percentage of Students Proficient on MEAP
MEAP 2008
MEAP 2009
MEAP 2010
State MEAP 2010
Math 3 99 100 100 95 Math 4 96 97 96 91 Math 5 90 92 92 80 Math 6 92 96 96 84 Math 7 94 96 100 85 Math 8 97 85 94 78
Reading 3 100 99 92 87 Reading 4 91 97 96 84 Reading 5 92 95 96 85 Reading 6 95 97 92 84 Reading 7 94 99 96 79 Reading 8 95 92 91 82
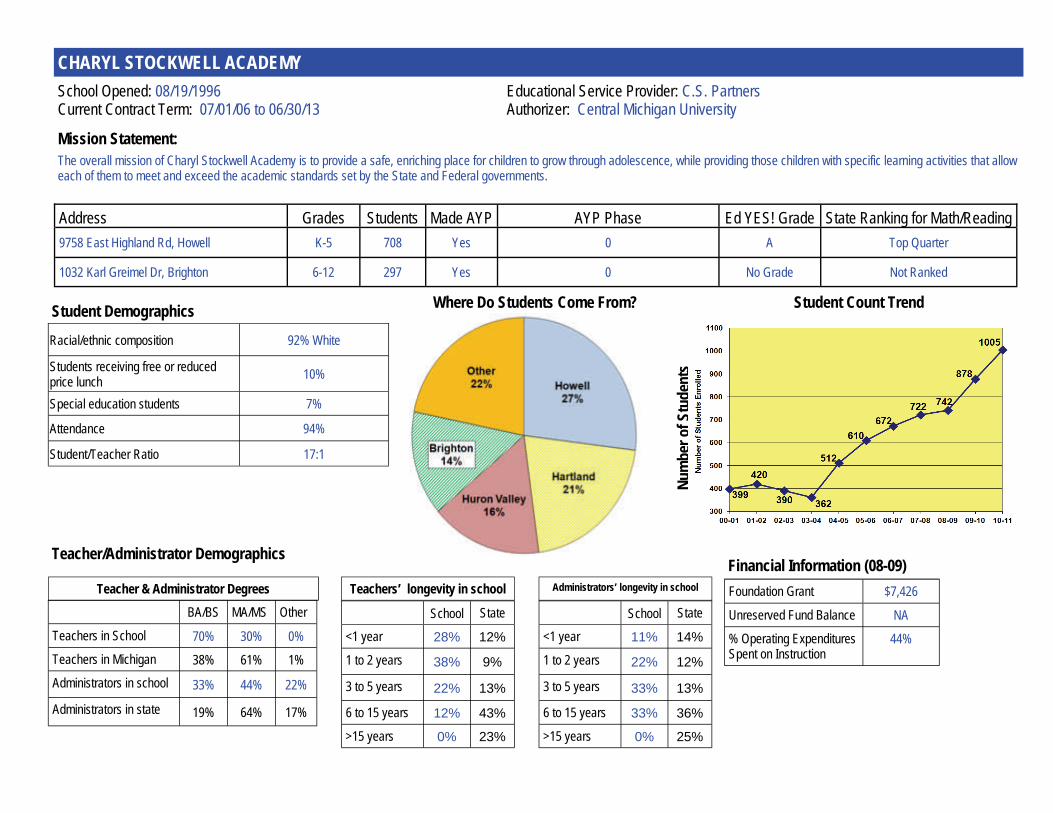
Address Grades Students Made AYP AYP Phase Ed YES! Grade State Ranking for Math/Reading 9758 East Highland Rd, Howell K-5 708 Yes 0 A Top Quarter
1032 Karl Greimel Dr, Brighton 6-12 297 Yes 0 No Grade Not Ranked
The overall mission of Charyl Stockwell Academy is to provide a safe, enriching place for children to grow through adolescence, while providing those children with specific learning activities that allow each of them to meet and exceed the academic standards set by the State and Federal governments.
Mission Statement:
Num
ber o
f Stu
dent
s
Where Do Students Come From? Student Count Trend
School Opened: 08/19/1996 Current Contract Term: 07/01/06 to 06/30/13
Educational Service Provider: C.S. Partners Authorizer: Central Michigan University
Teacher/Administrator Demographics
BA/BS MA/MS Other
Teachers in School 70% 30% 0% Teachers in Michigan 38% 61% 1% Administrators in school 33% 44% 22%
Administrators in state 19% 64% 17%
Teacher & Administrator Degrees Foundation Grant $7,426
Unreserved Fund Balance NA
% Operating Expenditures Spent on Instruction
44%
Financial Information (08-09)
School State
<1 year 28% 12%
1 to 2 years 38% 9%
3 to 5 years 22% 13%
6 to 15 years 12% 43%
>15 years 0% 23%
Teachers’ longevity in school
School State
<1 year 11% 14%
1 to 2 years 22% 12%
3 to 5 years 33% 13%
6 to 15 years 33% 36%
>15 years 0% 25%
Administrators’ longevity in school
CHARYL STOCKWELL ACADEMY
Student Demographics Racial/ethnic composition 92% White
Students receiving free or reduced price lunch 10%
Special education students 7%
Attendance 94%
Student/Teacher Ratio 17:1

CHARYL STOCKWELL ACADEMY ACHIEVEMENT DATA Percentage of Students Proficient on MEAP
MEAP 2008
MEAP 2009
MEAP 2010
State MEAP 2010
Math 3 94 99 100 95 Math 4 85 91 98 91 Math 5 85 81 80 80 Math 6 90 95 92 84 Math 7 83 98 89 85 Math 8 81 75 96 78
Math MME 64 52
Reading 3 91 92 96 87 Reading 4 83 95 96 84 Reading 5 91 92 96 85 Reading 6 90 98 91 84 Reading 7 91 95 94 79 Reading 8 88 94 94 82
Reading MME 76 63
MME 2009
MME 2010
MME 2011
State MME 2011
Student Progress from 2009 to 2010 on MEAP tests for 7th to 8th Grade
4-Year Cohort 4-Year Graduation Rates 4-Year Dropout Rates
2008 2009 2010 2008 2009 2010 2008 2009 2010
School N/A N/A N/A N/A N/A N/A N/A N/A N/A
State 145,097 142,322 138,003 76% 75% 76% 14% 11% 11%
4 YEAR GRADUATION AND DROPOUT REPORT
COLLEGE READY REPORT Percent College Ready in…
2008 Percent Meeting or Exceeding Benchmarks
2009 Percent Meeting or Exceeding Benchmarks
2010 Percent Meeting or Exceeding Benchmarks
2011 Percent Meeting or Exceeding Benchmarks
All Subjects NULL NULL NULL 28 English NULL NULL NULL 76 Mathematics NULL NULL NULL 36 Reading NULL NULL NULL 56 Science NULL NULL NULL 32 *ACT Definition of College and Career Readiness is defined as the percentage of students that meet the following four minimum scores on the ACT: 18 on English, 22 on math, 21 on reading and 24 on science. Research by the ACT suggests that meeting the college readiness benchmarks allows for a 50% chance of obtaining a B or higher or about a 75% chance of obtaining a C or higher in college courses of the same subject area.)

Chatfield School's Mission is to forge a partnership between parents and school staff to assure each child the best educational environment, the best teaching skills and acquiring the knowledge to be successful in today's world.
Mission Statement:
Num
ber o
f Stu
dent
s
Student Demographics Racial/ethnic composition 97% White
Students receiving free or reduced price lunch 19%
Special education students 7%
Attendance 96%
Student/Teacher Ratio 17:1
Where Do Students Come From? Student Count Trend
School Opened: 06/02/1997 Current Contract Term: 12/14/01 to 06/30/12
Educational Service Provider: Chatfield Management Corporation Authorizer: Saginaw Valley State University
Teacher/Administrator Demographics
BA/BS MA/MS Other
Teachers in School 77% 23% 0% Teachers in Michigan 38% 61% 1% Administrators in school 0% 100% 0%
Administrators in state 19% 64% 17%
Teacher & Administrator Degrees Foundation Grant $7,316
Unreserved Fund Balance $1,294,419
% Operating Expenditures Spent on Instruction
60%
Financial Information (08-09)
School State
<1 year 15% 12%
1 to 2 years 23% 9%
3 to 5 years 8% 13%
6 to 15 years 54% 43%
>15 years 0% 23%
Teachers’ longevity in school
School State
<1 year 0% 14%
1 to 2 years 0% 12%
3 to 5 years 0% 13%
6 to 15 years 100% 36%
>15 years 0% 25%
Administrators’ longevity in school
Address Grades Students Made AYP AYP Phase Ed YES! Grade State Ranking for Math/Reading 231 Lake Dr, Lapeer K-8 438 Yes 0 A 2nd Quarter
CHATFIELD SCHOOL
Percentage of 5th Graders Proficient on MEAP Percentage of 8th Graders Proficient on MEAP
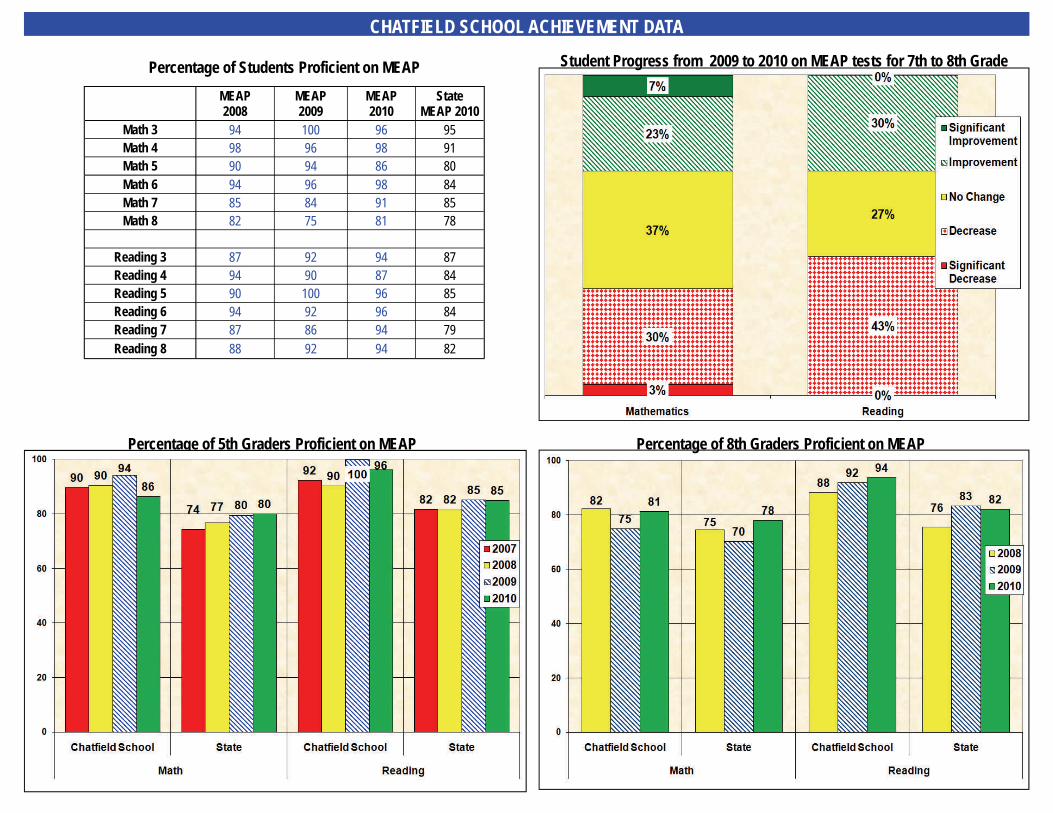
CHATFIELD SCHOOL ACHIEVEMENT DATA
Student Progress from 2009 to 2010 on MEAP tests for 7th to 8th Grade Percentage of Students Proficient on MEAP
MEAP 2008
MEAP 2009
MEAP 2010
State MEAP 2010
Math 3 94 100 96 95 Math 4 98 96 98 91 Math 5 90 94 86 80 Math 6 94 96 98 84 Math 7 85 84 91 85 Math 8 82 75 81 78
Reading 3 87 92 94 87 Reading 4 94 90 87 84 Reading 5 90 100 96 85 Reading 6 94 92 96 84 Reading 7 87 86 94 79 Reading 8 88 92 94 82

Clara B. Ford Academy's mission is to provide high risk students with quality education that will enable them to function as contributing adults. To that end, we will provide a safe and focused educational environment with accelerated learning and essential social resources for student success.
Mission Statement:
Num
ber o
f Stu
dent
s
Student Demographics Racial/ethnic composition 63% Black, 24% White,
7% Hispanic Students receiving free or reduced price lunch 99%
Special education students 18%
Attendance 0%
Student/Teacher Ratio 7:1
Where Do Students Come From? Student Count Trend
School Opened: 09/06/2007 Current Contract Term: 07/01/07 to 06/30/12
Educational Service Provider: C.S. Partners Authorizer: Ferris State University
Teacher/Administrator Demographics
BA/BS MA/MS Other
Teachers in School 72% 28% 0% Teachers in Michigan 38% 61% 1% Administrators in school 0% 100% 0%
Administrators in state 19% 64% 17%
Teacher & Administrator Degrees Foundation Grant $7,580
Unreserved Fund Balance NA
% Operating Expenditures Spent on Instruction
25%
Financial Information (08-09)
School State
<1 year 100% 12%
1 to 2 years 0% 9%
3 to 5 years 0% 13%
6 to 15 years 0% 43%
>15 years 0% 23%
Teachers’ longevity in school
School State
<1 year 100% 14%
1 to 2 years 0% 12%
3 to 5 years 0% 13%
6 to 15 years 0% 36%
>15 years 0% 25%
Administrators’ longevity in school
Address Grades Students Made AYP AYP Phase Ed YES! Grade State Ranking for Math/Reading 20651 West Warren St, Dearborn Heights 5-12 166 No Identified for School Improvement - Year No Grade Not Ranked
CLARA B. FORD ACADEMY (SDA)
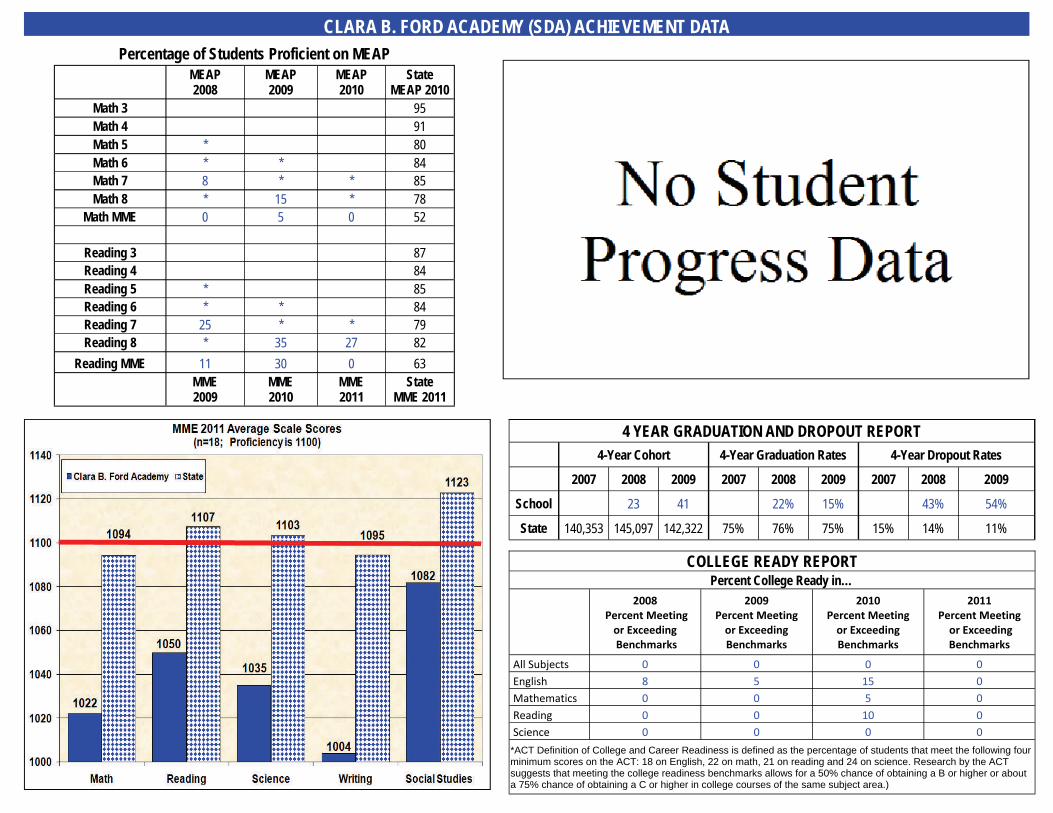
CLARA B. FORD ACADEMY (SDA) ACHIEVEMENT DATA Percentage of Students Proficient on MEAP
MEAP 2008
MEAP 2009
MEAP 2010
State MEAP 2010
Math 3 95 Math 4 91 Math 5 * 80 Math 6 * * 84 Math 7 8 * * 85 Math 8 * 15 * 78
Math MME 0 5 0 52
Reading 3 87 Reading 4 84 Reading 5 * 85 Reading 6 * * 84 Reading 7 25 * * 79 Reading 8 * 35 27 82
Reading MME 11 30 0 63
MME 2009
MME 2010
MME 2011
State MME 2011
4-Year Cohort 4-Year Graduation Rates 4-Year Dropout Rates
2007 2008 2009 2007 2008 2009 2007 2008 2009
School 23 41 22% 15% 43% 54%
State 140,353 145,097 142,322 75% 76% 75% 15% 14% 11%
4 YEAR GRADUATION AND DROPOUT REPORT
COLLEGE READY REPORT Percent College Ready in…
2008 Percent Meeting or Exceeding Benchmarks
2009 Percent Meeting or Exceeding Benchmarks
2010 Percent Meeting or Exceeding Benchmarks
2011 Percent Meeting or Exceeding Benchmarks
All Subjects 0 0 0 0 English 8 5 15 0 Mathematics 0 0 5 0 Reading 0 0 10 0 Science 0 0 0 0 *ACT Definition of College and Career Readiness is defined as the percentage of students that meet the following four minimum scores on the ACT: 18 on English, 22 on math, 21 on reading and 24 on science. Research by the ACT suggests that meeting the college readiness benchmarks allows for a 50% chance of obtaining a B or higher or about a 75% chance of obtaining a C or higher in college courses of the same subject area.)


