
CEN39 Coordinated Traffic Management Amsterdam v10
28
EasyWay Evaluation Expert Group Document Coordinated Traffic Management on the A10 Amsterdam Ring Road Final Version Issue: 1 st edition Date: January 28 th , 2013 Issued by: Rijkswaterstaat (NL) Authors: Feiko van der Veen, Royal HaskoningDHV Henk Taale, Rijkswaterstaat
Transcript of CEN39 Coordinated Traffic Management Amsterdam v10
EasyWay
Evaluation Expert Group Document
Coordinated Traffic Management on the A10 Amsterdam Ring Road
Final Version
Issue: 1st
edition
Date: January 28th
, 2013
Issued by: Rijkswaterstaat (NL)
Authors:
Feiko van der Veen, Royal HaskoningDHV
Henk Taale, Rijkswaterstaat

Coordinated Traffic Management on the A10 Amsterdam Ring Road - 2 - January 28th
, 2013
PREFACE
Late 2012 the ex-post evaluation study took place of traffic management scenarios in the Amsterdam
region, comprising a series of coordinated traffic management measures on the A10 Ring Road (E35) and
on the main arterials of Amsterdam. This evaluation document describes the results of this evaluation
study.
The coordinated traffic measures were a continuation of an earlier project within the ‘Fileproof’ Programme,
which was launched by the Dutch Ministry of Transport and Water Management in 2007, executed in 2008-
2009 and evaluated in 2010. The evaluation study of that earlier project, called ‘Improving traffic flow A10’
(in Dutch: ‘Verbeteren Doorstroming A10’, in short: VDA10), was published as an EasyWay evaluation
document in October 2011 (“Evaluation of Ramp Metering on the A10 Amsterdam Ring road”, CEN8).
To further improve traffic throughput, traffic management scenarios have been developed since 2010 in
order to be in command of the different traffic measures in a coordinated way. This implies the execution of
a specific combination of correlated traffic management measures under particular traffic circumstances.
The set of scenarios is additional to the existing traffic management measures such as (locally actuated)
ramp metering at all interchanges of the Amsterdam arterials with the A10 Ring Road, coordination of
these ramp metering stations with adjacent traffic signals, and a large number of urban and motorway
Variable Message Signs (VMS).
The coordinated traffic management project was instigated by the joint road operators Rijkswaterstaat,
Municipality of Amsterdam, province of North-Holland and the city region Amsterdam. The trial with the
new developed traffic management scenarios was started mid 2011 and they were put in operation since
October 2011. The before and after periods for the evaluation of the scenarios took place between
September and December 2011. The data analysis and reports were finalised in December 2012.
This document describes the results of the ex-post evaluation study, based on the analysis of the effects
on traffic throughput and a road user survey.

Coordinated Traffic Management on the A10 Amsterdam Ring Road - 3 - January 14th
2013
TABLE OF CONTENTS
REPORT TEMPLATE .................................................................................... 5
1. Key Evaluation Results ........................................................................ 6
1.1. Impact on Traffic Flow 6
1.2. Impact on Safety 6
1.3. Impact on Environment 6
1.4. Other Key Results 7
2. Description of the Problem .................................................................. 8
2.1. Site 8
2.2. Issues Addressed 8
3. Description of the ITS Project ............................................................ 10
3.1. Service Area 10
3.2. Key Words 10
3.3. Objectives 11
3.4. Systems and Technologies Applied 11
3.5. Costs 13
3.6. Status of the Project 14
4. Evaluation Planned ............................................................................. 15
4.1. Timing and Type of Evaluation 15
4.2. Objectives for the Evaluation 15
4.3. Research Questions 15

Coordinated Traffic Management on the A10 Amsterdam Ring Road - 4 - January 28th
, 2013
4.4. Study Area for the Evaluation 16
4.5. Expected Impacts 16
4.6. Used Methods 16
5. The Impact of the Project – Results .................................................. 19
5.1. Technical Performance 19
5.2. Results 19
5.2.1. Results at network level .................................................................................................................... 19
5.2.2. Results at sub-network level ............................................................................................................. 21
5.2.3. Results at road section level ............................................................................................................. 23
5.2.4. Results of road user survey .............................................................................................................. 23
5.2.5. Overall conclusions and recommendations ...................................................................................... 24
5.3. Reliability of Results 25
5.4. Research Questions Answered 25
5.5. Overall Assessment 25
5.5.1. Safety ................................................................................................................................................ 25
5.5.2. Efficiency .......................................................................................................................................... 25
5.5.3. Environment ...................................................................................................................................... 25
6. European Dimension: Transferability of the Results ....................... 26
Annex 1: The RWS tool MoniGraph .......................................................... 27

Coordinated Traffic Management on the A10 Amsterdam Ring Road - 5 - January 28th
, 2013
REPORT TEMPLATE
Project Name: Coordinated Traffic Management on the A10 Amsterdam Ring Road
Project Code: CEN39
Area Code: CS223
EasyWay Region: CENTRICO

Coordinated Traffic Management on the A10 Amsterdam Ring Road - 6 - January 28th
, 2013
1. Key Evaluation Results
This section presents a brief summary of the key results, specifically related to the EasyWay objectives.
The detailed results can be found in the next chapters.
Brief project description
A large set of traffic management scenarios was developed in 2010 for the Amsterdam region in order to be
in command of the different traffic measures in a coordinated way. These scenarios comprise the execution
of a specific combination of correlated traffic management measures under particular traffic circumstances.
The range of traffic management measures involved include among others (locally actuated) ramp metering
at all interchanges of the Amsterdam arterials with the A10 Ring Road, coordination of these ramp metering
stations with adjacent traffic signals, and a large number of urban and motorway Variable Message Signs
(VMS).
While the local actuation was based on traffic measures for reducing local problems, the scenario approach
is based on the combined and coordinated functioning of sets of traffic management measures for specific
conditions on road stretches, in order to reduce the situation for a complete section of the road network.
The objective of the ex-post evaluation study was to determine the added value of the (coordinated) scenario
approach compared to the local actuation of traffic management measures.
1.1. Impact on Traffic Flow
The main conclusions of the ex-post evaluation were, that the use of the developed traffic management
scenarios:
� Improved the overall traffic performance (vehicle kilometres driven) on the A10 with 2.0% to 2.5%, both
during morning and evening peak,
� Reduced the vehicle hours lost on the A10 with 7.9% in the evening peak, but showed an increase of the
delay with 3.7% in the morning peak. In total there was a reduction of 3.6% during the peak periods.
� Reduced the Congestion Rate1
by 1-3% during the morning peak and 7-9% during the evening peak.
Overall, the effects in the evening peak were more substantial as this was the busiest period of day with the
highest potential of reaching effects.
Travel times on motorways and main arterials of Amsterdam varied considerably: both increases and
decreases were identified for travel time and variation in travel time, compared to the before situation.
1.2. Impact on Safety
Not evaluated.
1.3. Impact on Environment
Not evaluated.
1
Congestion rate (in Dutch: filezwaarte) is the product of length and duration for a specific traffic queue, expressed in kilometre minutes. For example: a congestion rate of 15 kilometre minutes could be both a queue of 15 kilometres during 1 minute as a queue of 3 kilometres during 5 minutes.

Coordinated Traffic Management on the A10 Amsterdam Ring Road - 7 - January 28th
, 2013
1.4. Other Key Results
The results of the questionnaire among road users shows that the road users experience similar effects as in
the evaluation study based on traffic data: better traffic performance on the A10 motorway and unchanged
traffic performance on the urban road network of Amsterdam.
A major key result of the evaluation study is that (uniformed and centralised) registration of almost all actions
of traffic operators, changes of the statuses in the scenario software and of the roadside equipment is vital
for a thorough evaluation. Due to incomplete registration and logging, several important analyses could not
be made.

Coordinated Traffic Management on the A10 Amsterdam Ring Road - 8 - January 28th
, 2013
2. Description of the Problem
2.1. Site
The Amsterdam area still suffers from congestion on almost every working day, especially during afternoon
peak hours. Road users who use the A10 Ring Road to enter or to leave the city of Amsterdam, or the road
users who pass the Amsterdam area, are confronted with congestion on motorways that connect to the A10
as well as the Ring Road itself (see figure 2.1).
Figure 2.1 The study area of the project
2.2. Issues Addressed
Dutch transport and traffic policy emphasises a better use of the existing infrastructure, as building new
roads is too expensive and takes too much time due to procedures related to spatial and environmental
conditions and pricing is politically not an option. In order to make better use of the infrastructure, the joint
road managers in the Amsterdam region developed in 2005 plans for regional cooperation in the field of
traffic management. As a result, a large number of VMS’s and ramp metering systems were installed in the
recent years. The first elaboration started under the ‘FileProof’ traffic management programme (2006-2009)
and was evaluated in 2010. It was called the project ‘Improving traffic flow A10’ (in Dutch: Verbeteren
Doorstroming A10). The evaluation report is available as “Evaluation of Ramp Metering on the A10
Amsterdam Ring Road” (CEN8, October 10th, 2011).
The extension of this programme included the development of traffic management scenarios, which were
evaluated in 2012 and for which the evaluation is described in this document. A new programme, called
‘Operational Pilot Amsterdam’ (in Dutch: Praktijkproef Amsterdam), starts in 2013 and involves the advanced

Coordinated Traffic Management on the A10 Amsterdam Ring Road - 9 - January 28th
, 2013
coordination of traffic lights on main arterials including the ramp metering systems on the A10 Ring Road.
Within this programme also a competition will be held to stimulate the development of advanced in-car
information and navigation services for the study area by private companies.

Coordinated Traffic Management on the A10 Amsterdam Ring Road - 10 - January 28th
, 2013
3. Description of the ITS Project
3.1. Service Area
The EasyWay Service areas are:
� Traveller Information Services,
� Traffic Management Services,
� Freight and Logistics Services,
� ICT Infrastructure.
In the project involved, Coordinated Traffic Management on the A10 Amsterdam Ring Road, traffic
management services were developed and implemented.
In order to evaluate the effects of these services, traffic monitoring was used to collect and analyse traffic
data and driver behaviour (driver opinions) was investigated through questionnaires.
3.2. Key Words
The following key words (highlighted) describe the nature of the project and the applications used.
Traveller
Information Services
Traffic Management
Services
Freight and
Logistics Services
ICT Infrastructure
Pre-trip Traveller
Information
Variable Speed Limits Freight Management Data Management
and Exchange
On-trip Traveller
Information
Speed Control using
ANPR
Vehicle Safety
Systems
Traffic Management
Plans
Variable Message
Signs
Use of Hard Shoulder Parking Areas DATEX II
Motorway Advisory
Radio
Automatic Incident
Detection
Hazardous Goods
Monitoring and
Tracking
Traffic Monitoring
Driver Behaviour Use of CCTV Transport Security Control Centres
Comprehension and
Compliance
Ramp Metering
Traffic Management
using Rerouting
Enforcement
Table 3.1 Services involved in the project
Notes for table 3.1:
Coordinated traffic management measures (including rerouting) were proposed to traffic operators in the
traffic management centres, based on current, measured traffic situation. They decided which scenarios
should be put in operation. Each scenario included a set of measures like activation of VMS’s and/or ramp
metering.
For the evaluation study, traffic monitoring data was used and a road user survey was done.

Coordinated Traffic Management on the A10 Amsterdam Ring Road - 11 - January 28th
, 2013
3.3. Objectives
The main objective of the Coordinated Traffic Management project was: ‘Keep the ring road A10 running’.
The detailed objectives of the project were basically similar to the already mentioned 2006-2010 project
‘Improving traffic flow A10’ (in Dutch: Verbeteren Doorstroming A10):
� Less travel time losses on routes which partly cover the A10:
Occasionally time loss on the ramp is accepted, but there should be time benefits on the motorway
A10, with shorter travel times as a result.
� Better traffic performance A10 and connecting corridors:
Less vehicle loss hours,
Less vehicle kilometres.
� Preconditions for the urban road network:
No increase of urban traffic,
No blockage of intersections,
No side effects for target groups public transport, emergency services and bicyclists,
No decrease of traffic safety.
The EasyWay projects overarching objectives which are expected to be achieved by 2020 are as follows:
� 25% improvement in road safety by 2020,
� 25% decrease in congestion, facilitate travel and mobility of people and goods by 2020,
� 10% reduction in the impact on the environment by 2020.
The Coordinated Traffic Management project aims mainly to contribute to the EasyWay objectives by a
reduction in congestion.
3.4. Systems and Technologies Applied
The set of previously installed and during the project used measures included among others:
� ramp metering stations on all 18 interchanges of the urban road network with the A10 Ring road,
� coordination of these ramp metering stations with urban traffic lights on adjacent intersections,
� 25 VMS’s on the A10 motorway and on main arterials of the Amsterdam road network.
Before situation
The ramp metering systems used to operate locally, e.g. based on the traffic flows and speeds on the
motorway A10 and the traffic flows on the on-ramp. However, the ramp metering systems operated already
in a simple coordinated way with the urban traffic lights on adjacent intersections. Coordination was
implemented with simple rules such as “if a queue at the urban intersection exceeds a predefined length,
then the ramp metering system is switched off”.
The VMS’s could be provided with (predefined) texts and images only by intervention of traffic operators in
the traffic management centres.
After situation
The same roadside equipment was used during the Coordinated Traffic Management project, but unlike the
before situation in a more organised way. A set of traffic management scenarios was developed in 2010 for
the Amsterdam region in order to operate the different traffic measures in a more coordinated way. These
scenarios comprise the execution of a specific combination of correlated traffic management measures
under particular traffic circumstances, in order to relieve the traffic situation for a complete section of the
Coordinated Traffic Management on the A10 Amsterdam Ring Road - 12 - January 28th
, 2013
road network. Since 2011, the systems and organisational setting were implemented and embedded to
manage the regional traffic in this advanced way.
Traffic management scenarios
The main instruments for this new approach are traffic management scenarios which describe the combined
activation of related traffic management measures like VMS’s, traffic lights and ramp metering. The
combinations of these measures are grouped in three types of ‘building-blocks’: for the A10 Ring Road, for
the arterials city-inbound or city-outbound, and for the City Centre Ring Road (S100). For the entire regional
road network, 22 building blocks have been defined. A combination of building blocks is a scenario.
Starting point for the scenarios was the in 2005 approved view for the North-Holland network (in Dutch:
Netwerkvisie Noord-Holland), including the complete regional road network in the study area. With ‘Keep the
Ring road A10 running’ as main objective.
The four main ‘Services’ (solutions) to accomplish this objective are: affecting route choice, diverting traffic,
limiting inflow, increasing outflow. Through services, quick response to changes in the road network is
possible before small disturbance become major delays.
The following scheme was followed for the scenarios (in order of priority):
1. Limiting on-ramps throughput,
2. Facilitating off-ramps throughput,
3. Rerouting of traffic (for instance anti-clockwise over the ring road instead of clockwise).
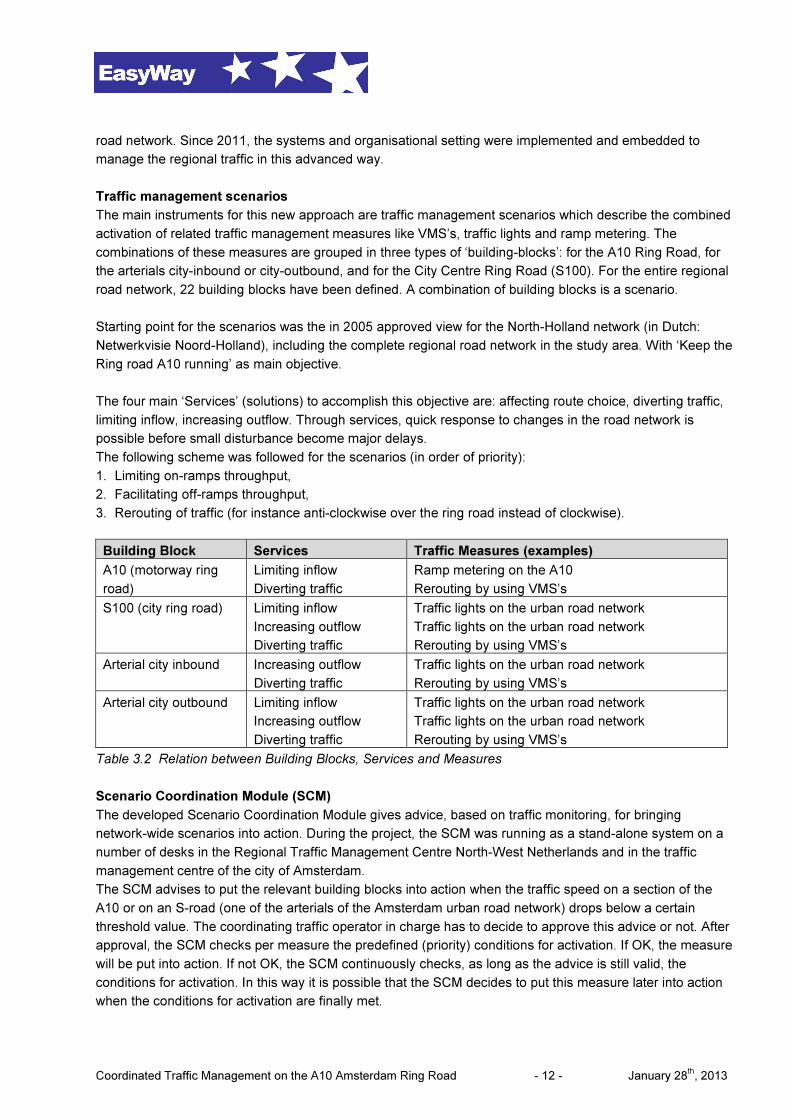
Building Block Services Traffic Measures (examples)
A10 (motorway ring
road)
Limiting inflow
Diverting traffic
Ramp metering on the A10
Rerouting by using VMS’s
S100 (city ring road) Limiting inflow
Increasing outflow
Diverting traffic
Traffic lights on the urban road network
Traffic lights on the urban road network
Rerouting by using VMS’s
Arterial city inbound Increasing outflow
Diverting traffic
Traffic lights on the urban road network
Rerouting by using VMS’s
Arterial city outbound Limiting inflow
Increasing outflow
Diverting traffic
Traffic lights on the urban road network
Traffic lights on the urban road network
Rerouting by using VMS’s
Table 3.2 Relation between Building Blocks, Services and Measures
Scenario Coordination Module (SCM)
The developed Scenario Coordination Module gives advice, based on traffic monitoring, for bringing
network-wide scenarios into action. During the project, the SCM was running as a stand-alone system on a
number of desks in the Regional Traffic Management Centre North-West Netherlands and in the traffic
management centre of the city of Amsterdam.
The SCM advises to put the relevant building blocks into action when the traffic speed on a section of the
A10 or on an S-road (one of the arterials of the Amsterdam urban road network) drops below a certain
threshold value. The coordinating traffic operator in charge has to decide to approve this advice or not. After
approval, the SCM checks per measure the predefined (priority) conditions for activation. If OK, the measure
will be put into action. If not OK, the SCM continuously checks, as long as the advice is still valid, the
conditions for activation. In this way it is possible that the SCM decides to put this measure later into action
when the conditions for activation are finally met.

Coordinated Traffic Management on the A10 Amsterdam Ring Road - 13 - January 28th
, 2013
The activation of building blocks is determined and managed per area/section of the total road network. In
general, the services within the building blocks of the A10 prevail over the services within the building blocks
of the arterials and the ones related to the city ring road.
A traffic operator can decide to switch off the entire building block or certain measures within the building
block. This may for instance occur when the safety of a waiting queue at a traffic light comes into play.
The result is that several steps are necessary before the measures of an advice are really put into action.
The delay involved was only several minutes during the project. After activation, the predefined conditions
could lead to untimely switching off a certain measure.
Not all of the steps within the sequence were logged by the SCM. The advice and the approval of the advice
were logged as separate files. However, the check on the conditions and the definite activation were not
logged in the SCM. They were available in the log files of the separate systems. See figure 3.1.
Figure 3.1 Operational processes of Scenario Coordination Module (outline)
Activation of building blocks and measures
Managed by the traffic management centres of Rijkswaterstaat (motorways) and the city Amsterdam (urban
road network), the SCM was operational during the evaluation period on:
� Monday to Friday 7:00 – 10:00 h,
� Monday to Thursday 15:00 – 19:00 h
During the evaluation period practically all building blocks for the A10 Ring Road were activated daily in both
peak periods. The building blocks for the arterials city inbound and outbound and for de city centre ring road
S100 were activated less frequently, despite adjustments of the trigger values of some of these building
blocks during the evaluation period.
After approval of the advised building block, the SCM checked if all conditions for activations were met
before the actual activation took place. The SCM did not log this last step. Thus, approval of a building block
by the traffic operator did not imply or guarantee that the involved traffic measures were practically activated.
This could be checked in the loggings of the different traffic management systems. These loggings revealed
the time stamp or the event of activation, but it was not possible to determine whether the roadside system
was activated by the SCM or locally.
3.5. Costs
The project costs were not available but modest: all roadside systems were already implemented and
available. Only the SCM module and the communication had to be developed and implemented.
Advice for use of
building blocks
Check
conditions
Activation of
measures
Monitoring of road
section status
Statelog
SCM
(minute)
System
loggings
Operatorlog
SCM
(event)
Scenario Coordination Module (SCM)
Monitoring of
conditions
Monitoring of traffic situation
(road section speed)
Approval of
building blocks

Coordinated Traffic Management on the A10 Amsterdam Ring Road - 14 - January 28th
, 2013
3.6. Status of the Project
At the time of writing (January 2013), the Coordinated Traffic Management project itself is finished. The
installed measures and SCM are still operational and work properly. A new programme, called ‘Operational
Pilot Amsterdam’ (in Dutch: Praktijkproef Amsterdam), will start in 2013 and involves the advanced
coordination of traffic lights on main arterials including the ramp metering stations on the A10 Ring Road.
Within this programme also a competition will be held to stimulate the development of advanced in-car
information and navigation services for the study area by private companies.
Coordinated Traffic Management on the A10 Amsterdam Ring Road - 15 - January 28th
, 2013
4. Evaluation Planned
4.1. Timing and Type of Evaluation
The evaluation study was carried out ex-post in 2012 and included a period of collecting traffic data and
loggings of the different central systems and road side systems. After that the evaluation continued with the
analysis of traffic related effects and a questionnaire among road users. Both types of evaluation used a
before and after survey.
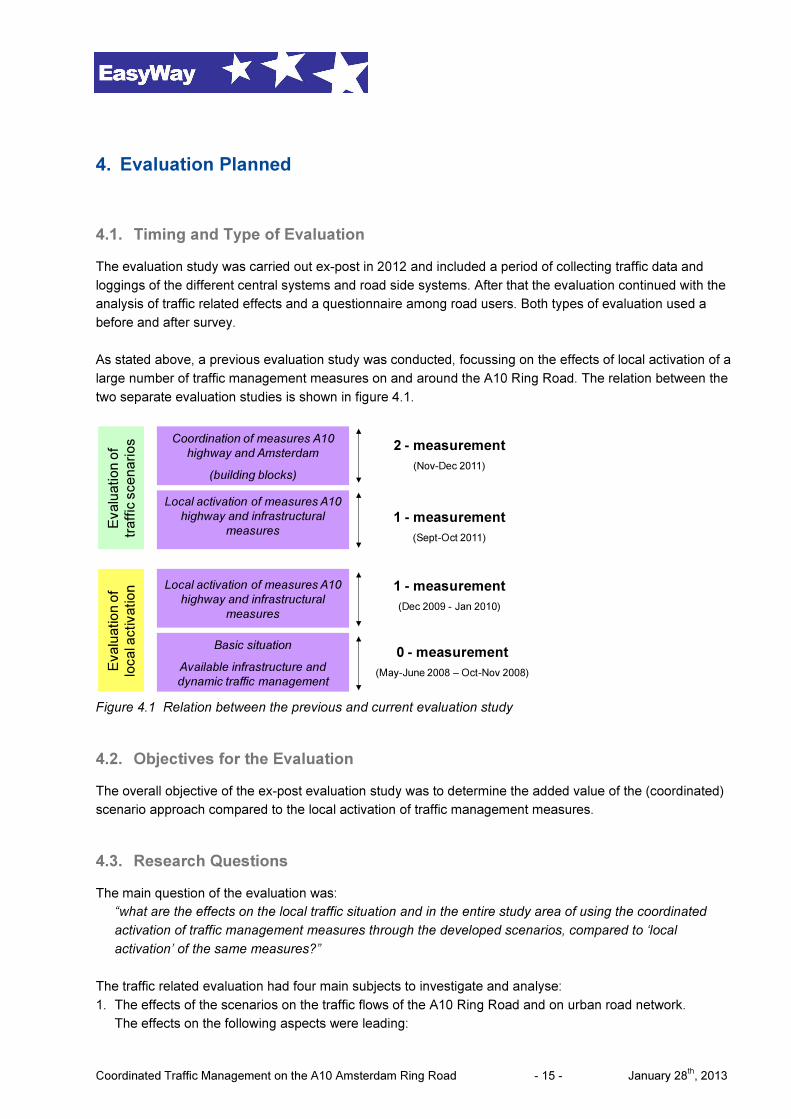
As stated above, a previous evaluation study was conducted, focussing on the effects of local activation of a
large number of traffic management measures on and around the A10 Ring Road. The relation between the
two separate evaluation studies is shown in figure 4.1.
Figure 4.1 Relation between the previous and current evaluation study
4.2. Objectives for the Evaluation
The overall objective of the ex-post evaluation study was to determine the added value of the (coordinated)
scenario approach compared to the local activation of traffic management measures.
4.3. Research Questions
The main question of the evaluation was:
“what are the effects on the local traffic situation and in the entire study area of using the coordinated
activation of traffic management measures through the developed scenarios, compared to ‘local
activation’ of the same measures?”
The traffic related evaluation had four main subjects to investigate and analyse:
1. The effects of the scenarios on the traffic flows of the A10 Ring Road and on urban road network.
The effects on the following aspects were leading:
Eva
lua
tio
no
f
loca
la
ctiva
tio
n
Eva
lua
tio
no
f
tra
ffic
sce
na
rio
s
Basic situation
Available infrastructure and
dynamic traffic management
Local activation of measures A10
highway and infrastructural
measures
Local activation of measures A10
highway and infrastructural
measures
Coordination of measures A10
highway and Amsterdam
(building blocks)
0 - measurement
(May-June 2008 – Oct-Nov 2008)
1 - measurement
(Dec 2009 - Jan 2010)
1 - measurement
(Sept-Oct 2011)
2 - measurement
(Nov-Dec 2011)

Coordinated Traffic Management on the A10 Amsterdam Ring Road - 16 - January 28th
, 2013
• travel times,
• vehicle hours lost and congestion rate,
• traffic performance of the road network,
• reliability of travel times,
• traffic safety,
• traffic flows of public transport.
2. Are the preconditions for the urban road network met (no spillback on the urban roads)?
3. The added value of the coordinated scenario approach compared to the local activation of traffic
management measures.
4. The lessons-learned of the employment of scenarios and their evaluation for network wide traffic
management in general and for the upcoming ‘Operational Pilot Amsterdam’ in particular.
Answering of the research questions was covered by both evaluations (traffic related indicators and
questionnaire).
4.4. Study Area for the Evaluation
The study area for the evaluation is indicated in figure 2.1 with the red line. It includes the A10 motorway ring
road, the connecting motorways and the Amsterdam urban road network.
4.5. Expected Impacts
The goal-oriented expectations (expected impacts) were used for the comparison of the coordinated
activation and the local activation of traffic management measures. Prior to deployment, the expected effects
of each building block were described as hypotheses. These effects have been tested by practical
experience: each situation with activated scenarios was compared to the situation without scenarios.
The hypotheses at network level, for instance, were based on the corresponding research questions:
� traffic performance of the road network increases in the after situation,
� vehicle hours lost decrease in the after situation,
� congestion rate decrease in the after situation.
Hypotheses were defined at different levels. All of the tested hypotheses are presented in the results section
of this document (chapter 5).
4.6. Used Methods
Data collection and evaluation methods were quite similar to the evaluation study of the local activation.
The indicators for the project evaluation were obtained directly from the research questions (section 4.3).
Data collection method
For the traffic related evaluation, the following data collection systems and methods were used:
� Loop detector data from the Motorway Traffic Management System (MTM) to monitor speeds and
volumes on the motorways.
� Travel time measurement system, installed on the main arterials of the Amsterdam urban road network.
This system is based on Licence Plate Recognition (LPR) and is in use to monitor and measure the traffic
flow effects on the urban network.
� Loggings of different (roadside) systems.

Coordinated Traffic Management on the A10 Amsterdam Ring Road - 17 - January 28th
, 2013
� Incident and weather reports.
The road user survey was carried out separate from the traffic related evaluation in a before and after survey
among about 1,000 road users (internet panel) using an on-line questionnaire. The questions related to:
� Daily use of the A10 Ring road during the peak hours,
� Perception of the traffic flow on the A10 and urban roads.
Evaluation method
It is essential for an evaluation to have before and after measurements with comparable days. As the total
study area was complex and extensive, there was always ‘something’ to affect the traffic process. The
scenarios primarily aimed to take care of small disturbances in the road network. Thus, it was not necessary
to filter out days with these smaller events in the before and after periods to get a comparable set of days.
In case of major incidents the disturbances were so considerable that they could not be managed with
‘regular’ scenarios. In such cases the traffic management centre deployed measures that relieved the
incident as much as possible. These days were not useful for the evaluation.
For the selection of comparable days, the following steps were completed:
1. Availability of loop data. A major part of the impact analysis was based on loop detector data of the A10
Ring Road. Days without loop data were deleted. This applied also for days without output of the network
indicators by the data processing and analysis tool MoniGraph2
.
2. Check on incidents. Peak periods with major impact on the available capacity were deleted from the
database. In most cases peak periods with a limited number of lanes on the A10 due to accidents. Major
incidents on motorways leading to the A10 and other incidents on the A10 were marked in the database.
These days were part of the selection when appeared that they did not lead to a deviating traffic situation.
3. Check on whether conditions. A
number of days was deleted when
there was heavy fog. Due to the fog,
the hard shoulder running lanes could
not be opened.
4. Check on general traffic situation.
These tests were done based on the
speed-time interval images of the A10
produced by MoniGraph (see figure
4.2). Deviating days (extensive
congestions or almost no congestion)
were deleted from the database.
5. Activation of building blocks. Days
without activation of building blocks by
the SCM were not used for the
evaluation.
Figure 4.2 Example of a speed-time interval image
6. Check on inflow. Finally, the resulting set of days from the previous steps was checked on comparable
traffic inflow on the four major motorways (A1, A2, A4 and A8) leading to the A10 Ring Road. These
2
MoniGraph is a tool from Rijkswaterstaat (developed and maintained by Henk Taale) to process, analyse and visualise data from loop detectors. MoniGraph was used in the evaluation study for processing of all loop data.
For more details, see annex 1.

Coordinated Traffic Management on the A10 Amsterdam Ring Road - 18 - January 28th
, 2013
traffic flows in the before and after situations appeared to be quite similar, with only small variations of the
inflow values (between -1.9% and +5.6%).
Coordinated Traffic Management on the A10 Amsterdam Ring Road - 19 - January 28th
, 2013
5. The Impact of the Project – Results
5.1. Technical Performance
The majority of VMS’s and ramp metering systems, including their coordination with adjacent traffic signals,
performed quite well during the evaluation periods. However, at some on-ramps the installation did not
operate adequately: in situations where one might expect (according to traffic data) that the ramp metering
stations would be activated, they were not. Besides limiting trigger values within the SCM, the (local)
configuration of the ramp metering stations could also be the disturbing factor.
5.2. Results
5.2.1. RESULTS AT NETWORK LEVEL
The results at network level concern only the A10 Ring Road, both for the inner ring (clockwise) and outer
ring (anti-clockwise) and for morning and evening peak. Indicators such as congestion rate and vehicle
hours lost on the rest of the road network could not be measured in a proper way, due to unavailability
and/or not applicable to the entire urban road network.
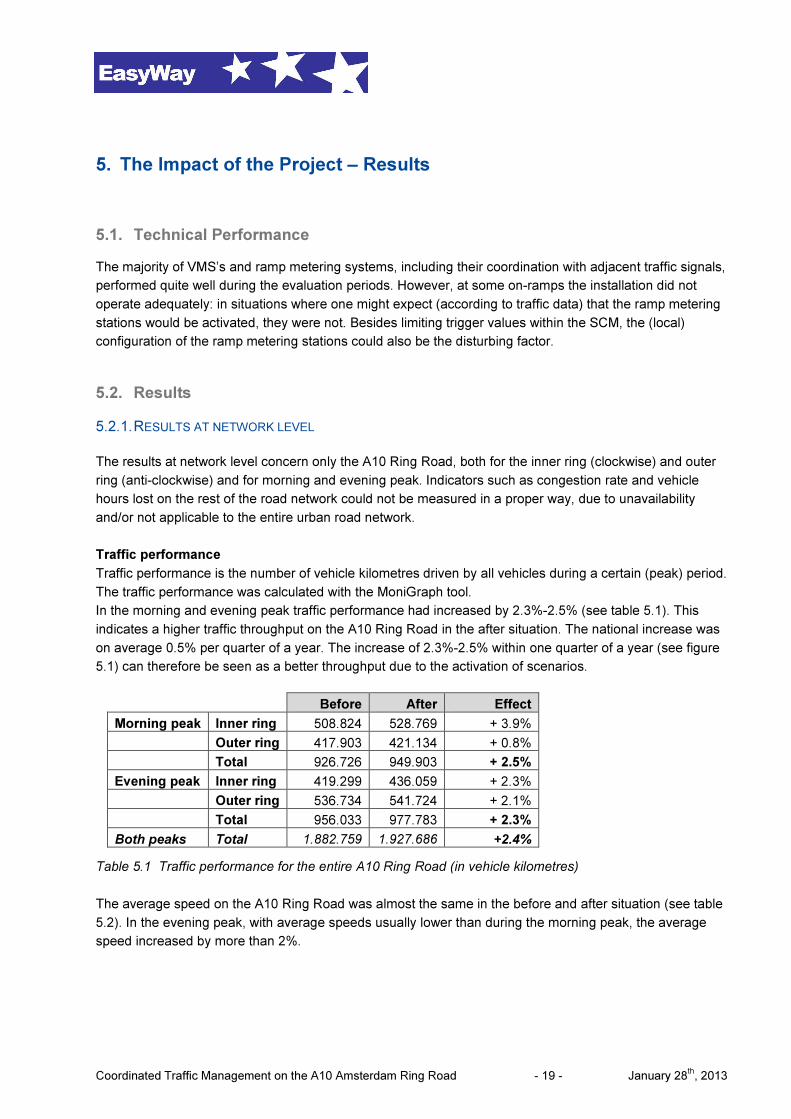
Traffic performance
Traffic performance is the number of vehicle kilometres driven by all vehicles during a certain (peak) period.
The traffic performance was calculated with the MoniGraph tool.
In the morning and evening peak traffic performance had increased by 2.3%-2.5% (see table 5.1). This
indicates a higher traffic throughput on the A10 Ring Road in the after situation. The national increase was
on average 0.5% per quarter of a year. The increase of 2.3%-2.5% within one quarter of a year (see figure
5.1) can therefore be seen as a better throughput due to the activation of scenarios.
Before After Effect
Morning peak Inner ring 508.824 528.769 + 3.9%
Outer ring 417.903 421.134 + 0.8%
Total 926.726 949.903 + 2.5%
Evening peak Inner ring 419.299 436.059 + 2.3%
Outer ring 536.734 541.724 + 2.1%
Total 956.033 977.783 + 2.3%
Both peaks Total 1.882.759 1.927.686 +2.4%
Table 5.1 Traffic performance for the entire A10 Ring Road (in vehicle kilometres)
The average speed on the A10 Ring Road was almost the same in the before and after situation (see table
5.2). In the evening peak, with average speeds usually lower than during the morning peak, the average
speed increased by more than 2%.

Coordinated Traffic Management on the A10 Amsterdam Ring Road - 20 - January 28th
, 2013
Before After Effect
Morning peak Inner ring 77 76 - 0.6%
Outer ring 81 81 - 0.8%
Evening peak Inner ring 68 70 + 2.3%
Outer ring 69 71 + 2.1%
Table 5.2 Average speed on the entire A10 Ring Road (in km/h)
Vehicle hours lost
Vehicle hours lost are defined as the difference between the actual total travel time (of all vehicles) and the
total travel time under ‘free flow’ conditions. The determined free flow speed was 100 km/h for the entire A10
Ring Road. Vehicle hours lost were calculated using the MoniGraph tool.
During the evening peak, the combination of an increase in traffic performance (table 4.1) in combination
with an increase of average speed (table 5.2) lead to a decrease of vehicle hours lost of almost 8%, primarily
on the outer ring (table 5.3). In the morning peak, the limited increase of the traffic performance lead,
together with a slightly lower speed, to a modest increase of vehicle hours lost of 3.7%. For both peaks the
improvement is 3.6% less delay.
The numbers of vehicle hours lost in the evening peak were substantially higher than in the morning peak,
especially on the outer ring. This is the result of a higher traffic volume during the evening peak with a lower
speed (lower speeds give more weight to the vehicle hours lost).
Before After Effect
Morning peak Inner ring 1.976 2.047 + 3.5%
Outer ring 1.073 1.114 + 3.9%
Total 3.049 3.161 + 3.7%
Evening peak Inner ring 2.172 2.114 - 1.3%
Outer ring 2.958 2.580 -12.8%
Total 5.129 4.724 - 7.9%
Both peaks Total 8.178 7.885 -3.6%
Table 5.3 Vehicle hours lost for the entire A10 Ring Road (in hours)
The national trend showed a decrease of vehicle hours lost of 5.0% to 7.5% in the last quarters of 2011. The
average decrease on the A10 Ring Road was therefore slightly less than the national trend. Of course in the
national trend also the Amsterdam network is included.
Congestion rate
Congestion Rate (in Dutch: Filezwaarte) is the amount of minutes and length for traffic queue with speeds
lower than 50 km/h, expressed in kilometres.minutes (km.min). For example: a congestion rate of 15 km.min
could be both a queue of 15 kilometres during 1 minute as a queue of 3 kilometres during 5 minutes.
Under all circumstances, the congestion rate decreased on the A10 Ring Road (table 5.4), especially during
the evening peak. The congestion rate in the morning peak decreased while the vehicle hours lost
increased. The reason for this had to do with the number of congestion situations: situations with average
speeds of 50-100 km/h increased the number of vehicle hours lost, but did not count up in the congestion
rate. The number of km.min with low speeds (< 50 km/h) decreased therefore, while the number of km.min
with a speed of 50-100 km/h increased. As a result, the number of congestion situations decreased in the
morning peak, but the average speeds dropped slightly (table 5.2).

Coordinated Traffic Management on the A10 Amsterdam Ring Road - 21 - January 28th
, 2013
Before After Effect
Morning peak Inner ring 743 733 - 1.3%
Outer ring 450 435 - 3.4%
Total 1.193 1.168 -2.1%
Evening peak Inner ring 1011 943 - 6.7%
Outer ring 1018 926 - 9.0%
Total 2.029 1.869 -7.9%
Both peaks Total 3.222 3.037 -5.7%
Table 5.4 Congestion rate for the entire A10 Ring Road (in kilometres.minutes)
The decrease of the congestion rate was in line with the national trend in the same period (7-9% decrease
including 5-6% decrease due to extra lanes). However, the A10 Ring Road did not open extra lanes in the
period considered. This indicates that the traffic management scenarios are partially responsible for the
decrease of the congestion rate.
Conclusions at network level
Hypothesis: traffic performance of the road network increases in the after situation.
� Yes, 2.5% higher in the morning peak compared to the before situation and 2.3% in the evening peak.
Both results were higher than the national trend which showed an increase of 0.5%.
Hypothesis: vehicle hours lost decrease in the after situation.
� Yes and no. Vehicle hours lost decreased in the evening peak during the after situation with almost 7.9%
while it increased in the morning peak by 3.7%. The average speed on the A10 Ring Road did not
change in the morning peak. It increase by more than 2% during the evening peak.
Hypothesis: congestion rate decrease in the after situation.
� Yes, the congestion rate decreased, from 1% in the morning peak on the inner ring and 9% in the
evening peak on the outer ring.
5.2.2. RESULTS AT SUB-NETWORK LEVEL
Traffic performance, vehicle hours lost and congestion rate
The different indicators traffic performance, vehicle hours lost and congestion rate were determined for the
A10 sub-networks North, East, South and West (see figure 5.1). The analysis of these indicators per sub-
network revealed that the evening peak caused most of the delays, especially on the sub-networks South
and West, for which the level of vehicle hours lost was the highest. Similar to the results on network level,
the vehicle hours lost on the outer ring decreased substantially in the after situation compared with the
before situation.
Speed and traffic volume
For the separate sub-networks of the A10, both speed and ‘performance’ of these parts were calculated. The
average traffic volumes of the first and last counting station determined the ‘performance’ of a road section.
The results per sub-network showed considerable differences in speed, but only on sub-network East: the
average speed in the after situation was significantly lower for both morning and evening peak and both on
the inner and the outer ring. For the other sub-networks there was hardly any difference in speed during the
morning peak. The speed on the A10-South increased in the evening peak, but not significantly. However,
this increase had more effect on the vehicle hours lost due to the higher traffic volumes on sub-network
South.

Coordinated Traffic Management on the A10 Amsterdam Ring Road - 22 - January 28th
, 2013
The differences in ‘performance’ (traffic volumes) between before and after measurements were limited. The
overall tendency is positive: higher traffic volumes during the after situation, similar to the results at network
level.
Figure 5.1 The sub-networks of the A10 Ring road
Congestion development
One of the objectives of the coordinated activation was trying to prevent or decrease congestion. The
activation of the traffic management scenarios appeared not to be able to prevent congestion. The
development of the traffic speed per sub-network was investigated in order to check whether coordinated
activation was able to diminish the development of congestion.
The results showed no clear postponement of the start of congestion in the after period. Moreover, in the
morning peak on the inner ring a decrease of speed occurred even a bit earlier than in the before
measurement. On most of the sub-networks, the development of congestion was almost the same in before
and after situation.
Conclusions at sub-network level
Hypothesis: a higher speed on the sub-networks in the after measurements
� No, the average speed on several sub-networks was not significantly higher than in the before
measurement. On sub-network East it was even significantly lower for both the inner as outer ring and
both in the morning and evening peak. The rest of the sub-network did not show any difference in
average speed.
Hypothesis: higher traffic volumes on sub-networks for the after measurements

Coordinated Traffic Management on the A10 Amsterdam Ring Road - 23 - January 28th
, 2013
� No, significantly higher traffic volumes were not identified on the different sub-networks in the after
measurements; all differences were quite limited. However, the overall tendency was positive.
Congestion development (no hypothesis)
� The development of the actual speeds during the peaks is an important indicator for the performance on
sub-network level. The results showed no clear evidence that congestion could be prevented with
coordinated activation.
5.2.3. RESULTS AT ROAD SECTION LEVEL
The results on road section level applied both to the motorway network and the rest of the road network.
MoniGraph was used to determine travel times on the motorways, the travel time monitoring system MoCo
of the Amsterdam municipality was used for travel times on the corridors of the urban road network.
Travel times on specific routes
For the motorway network 8 routes were defined. The travel time for the entire A10 Ring Road (inner and
outer ring) was calculated as well. The results showed that travel times on the A10 Ring Road in the morning
peak were basically similar to the before situation. Clear differences appeared in the evening peak. The
increase of travel times on specific routes was the consequence of rerouting via these routes through the
scenarios. Some routes had a longer travel time. Travel times on the different arterials of the urban road
network varied as well. The vast increase of travel time on a specific arterial was caused by road works with
particular traffic light settings.
Travel time reliability
Similar to the results for the absolute travel times on the motorway are the results for the variation of travel
times. In general, the variation of travel times in the morning peak is small. Most of the routes had an even
smaller variation of travel times in the after situation. However, the evening peak showed an increase of the
average variation in travel time, from 4-41% in the after situation compared to 2-14% in the before situation.
No direct explanation was found for this phenomenon.
Conclusions at road section level
Hypothesis: lower travel times on the pre-defined routes
� No, travel times during the morning peak changed only in a limited way. Travel times even increased on
several routes in the evening peak.
Hypothesis: smaller variations in travel times
� No, on the contrary. The variation during the evening peak increased even more.
5.2.4. RESULTS OF ROAD USER SURVEY
Important questions in the road user survey were the use of the A10 Ring Road and the experience of the
throughput of the A10 and the arterials.
The after measurement of the survey took place between end of November and early December 2011. The
results were compared with the result of the first survey (summer 2008) and of the before measurement in
May 2010. Note: the reference period for the before period for the road user survey (May 2010) is quite
different than the before period of the traffic related evaluation (September-October 2011). In one year’s
time, the (national) congestion rate decreased with 24%.
Coordinated Traffic Management on the A10 Amsterdam Ring Road - 24 - January 28th
, 2013
The daily use of the A10 Ring road by the respondents changed from 17% in the before situation of 2010 to
14% in the after situation, while the traffic performance increased with 2.3%. Part of the explanation could be
found in the composition of the respondents group: one-third of them participated in the first survey. In the
meantime they used the A10 Ring Road less because of changed employment conditions.
The respondents were quite positive about the improved traffic throughput, both in the morning and the
evening peak. The respondents experienced less congestion in both peak periods, in line with the results of
the traffic related evaluation.
The experience with the throughput on the urban road network did not seem to be changed: two-third of the
respondents did report any difference. Travel time measurements on the arterials showed quite some
variation (both increase and decrease) but the margins were limited to a change of 5 to 40 seconds,
apparently not a substantial change according to the respondents.
5.2.5. OVERALL CONCLUSIONS AND RECOMMENDATIONS
Overall conclusions
The overall effects on network level were positive: the traffic performance increased on the A10 Ring Road,
the vehicle hours lost decreased and the congestion rate decreased as well. The effects in the evening
period were higher than in the morning period. Not surprisingly as the evening peak is busier with most
disturbances. In the morning peak travel speeds are normally higher (not below 75 km/h), which leads
evidentley leads tot smaller gains.
Despite some (smaller) negative effects on sub-network level and road section level, the evaluation showed
that coordinated activation of traffic management measures has an added value over local operation.
Especially on the busiest moments and locations: the outer ring A10-South during the evening peak.
Recommendations
The effects could be even higher if the operation would be optimised. Improvement seems to be possible on
two aspects: the operation by the SCM and the development process.
The following recommendations apply:
� Expansion of the operational period of the SMC. Following a quick scan of the SCM loggings, different
network sections ‘asked’ for actuation of building blocks on a regularly basis beyond the peak periods.
� Optimisation of the trigger values for the urban road network. The building blocks for the urban road
network were activated in a very limited way. Further adjustment of these values could improve the
added value of the scenario approach.
� Optimisation of the ramp metering configuration. Analysis of the ramp metering loggings learned that
activation of ramp metering was necessary in more situations than actually performed. Ramp metering
stations were not activated or simply switched off due to limited threshold values for the urban network.
Extension of the threshold values or of the physical space near interchanges could improve this situation.
� Process related improvements. The complete optimisation cycle (plan-do-check-act) was missing.
Through constant monitoring of the scenarios, goal-oriented adjustments would have been possible in
order to optimise the total process. Currently the SCM loggings are in the process of being improved in
order to be able to evaluate and improve scenarios a short time after activation.
� Improve the monitoring through loggings. As stated above, several loggings were missing for thorough
evaluation purposes. The logging of the following items could improve the total process: trigger values,
approval of trigger values, actual actuation of measures (including check on conditions for actuation),
switching off moments of measures (due to exceeding threshold values).
Coordinated Traffic Management on the A10 Amsterdam Ring Road - 25 - January 28th
, 2013
5.3. Reliability of Results
In order to get reliable answers for the research questions, efforts were done in this ex-post evaluation study
to reduce or even exclude (external) sources of bias, like changes in traffic volume due to economic effects.
More specific:
� The results for the motorway road network are more reliable than for the urban road network. The amount
of available data for the motorways was more than sufficient. For the urban roads only limited data was
available, thus leading to a more qualitative judgement of the effects on these roads.
� As a result of calculations of significance through statistical checks, the determined changes in travel
speeds on the motorways could be regarded as highly reliable for this evaluation study.
Additionally, correlation in the processes from monitoring to advice by the SCM, approval by traffic operators
and the definite activation of road side equipment could not be made completely in detail. As a
consequence, the conclusions above were based on the available data. With better and more detailed
loggings the evaluation study would gain more value with more reliable analysis of effects as a result.
5.4. Research Questions Answered
See section 5.2
5.5. Overall Assessment
Below the main finding of the evaluation are summarised in brief in terms of contribution to the European
objectives.
5.5.1. SAFETY
Based on (partly limited) data available, no hard conclusions could be drawn. However, traffic safety did not
seem to be decreased within the study area.
5.5.2. EFFICIENCY
Travel times and vehicle hours decreased by the traffic management scenarios and traffic performance
increased. This improved the overall accessibility of the Amsterdam region and the city itself in particular.
It facilitated the mobility of people and goods, and contributes at least partly to the 25% objective of
EasyWay.
5.5.3. ENVIRONMENT
Not evaluated and it is difficult to draw conclusions Delay has decreased but kilometres driven increased and
also the speed, leading to different effects.

Coordinated Traffic Management on the A10 Amsterdam Ring Road - 26 - January 28th
, 2013
6. European Dimension: Transferability of the Results
The following conclusion can be made regarding the applicability of the results of this project to other similar
implementations in the Netherlands and other countries:
� The deployment of traffic management scenarios, using basically allready installed roadside equipment in
the study area, could be profitable for major cities in order to achieve a better throughput of the traffic in
the entire area. This is especially the case at peak hours and in situations where traffic volumes on the
ring road proves to be very high (volume/capacity ratio >0.8).
� Development of traffic management scenarios should be done on a tailor-made basis: all road networks
are different and require specific configurations, trigger values and threshold values.
� Solid traffic monitoring tools and loggings proved to be the vital factor for a constant improvement of the
traffic management processes including traffic scenarios.

Coordinated Traffic Management on the A10 Amsterdam Ring Road - 27 - January 28th
, 2013
Annex 1: The RWS tool MoniGraph
MoniGraph is a tool to process, analyse and visualise data from the Rijkswaterstaat loop detectors. It was
developed and is still maintained by Henk Taale. In the two figures below, an example is presented for the
visual output of MoniGraph. With this tool it is possible to produce a graphical representation of the traffic
speeds in a certain time period.
In the examples, the traffic situation on the entire A10 Ring road can be observed, from the Coentunnel in
the north of the A10 (at the bottom of the graph) via the outer ring (anti-clockwise) back to the same tunnel.

Coordinated Traffic Management on the A10 Amsterdam Ring Road - 28 - January 28th
, 2013
The first graph shows a before situation, the second an after situation. Per graph, three typical afternoon
peaks were selected of specific days with low, medium and high traffic volumes. The graphs show the
measured speeds as a function of time and space. All input for these graphs came from the loop detectors
on the A10 motorway.