CEMENT SECTOR - PACRA Sector_Apr19.pdf · Sr# Rated Universe PACRA VIS 1 Bestway Cement AA- 2 D.G....
20
CEMENT SECTOR – AN OVERVIEW April 2019
Transcript of CEMENT SECTOR - PACRA Sector_Apr19.pdf · Sr# Rated Universe PACRA VIS 1 Bestway Cement AA- 2 D.G....
CEMENT SECTOR –
AN OVERVIEW
April 2019
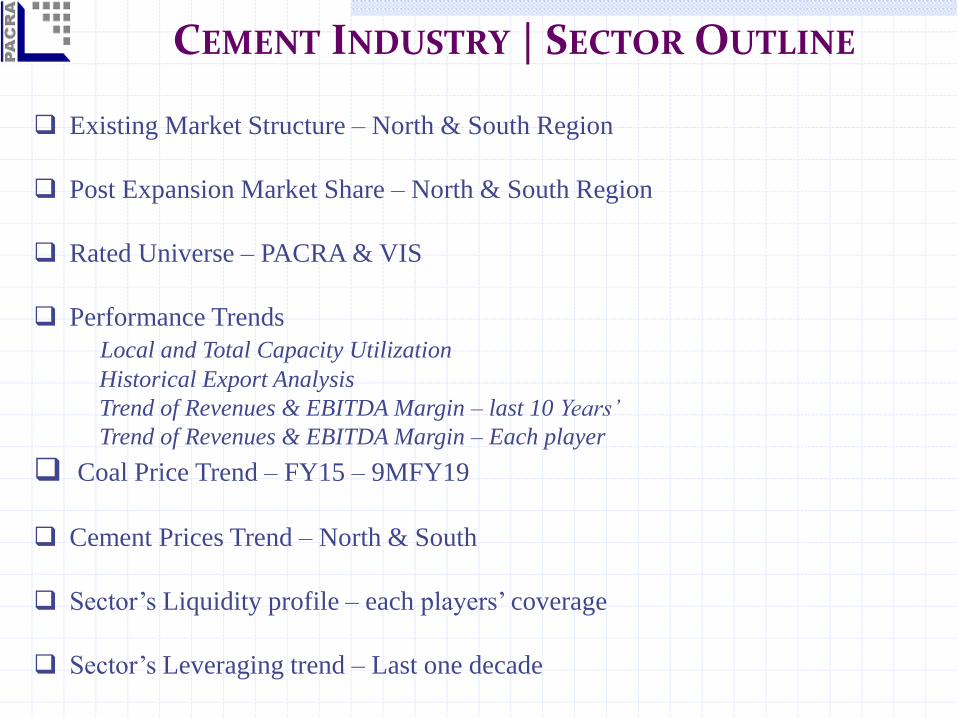
CEMENT INDUSTRY | SECTOR OUTLINE
Existing Market Structure – North & South Region
Post Expansion Market Share – North & South Region
Rated Universe – PACRA & VIS
Performance Trends
Local and Total Capacity Utilization
Historical Export Analysis
Trend of Revenues & EBITDA Margin – last 10 Years’
Trend of Revenues & EBITDA Margin – Each player
Coal Price Trend – FY15 – 9MFY19
Cement Prices Trend – North & South
Sector’s Liquidity profile – each players’ coverage
Sector’s Leveraging trend – Last one decade
CEMENT INDUSTRY | NORTH REGION
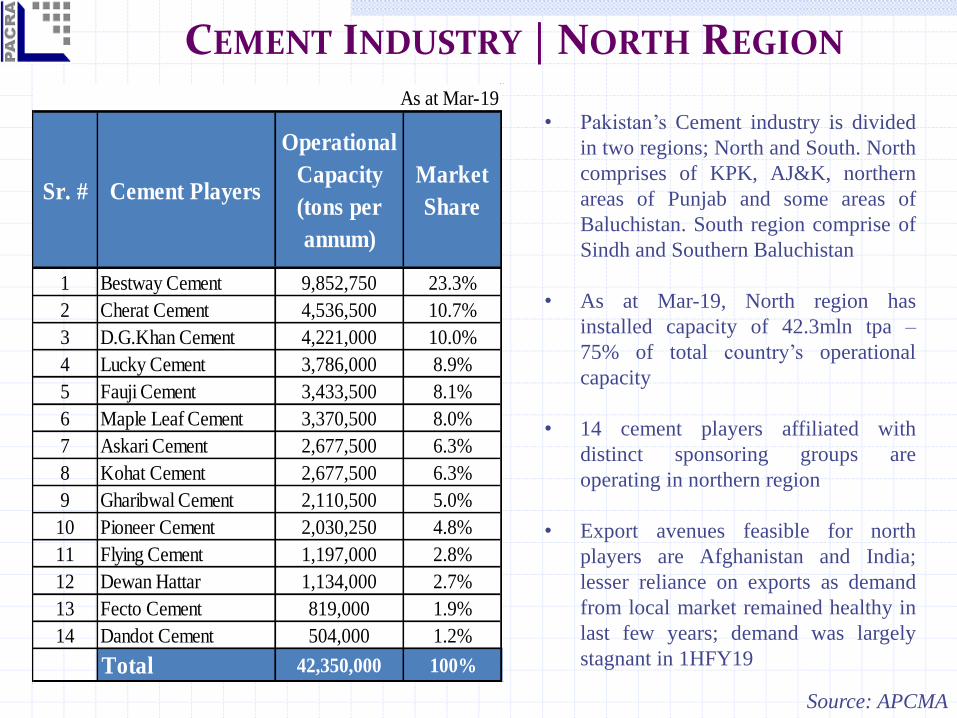
• Pakistan’s Cement industry is divided
in two regions; North and South. North
comprises of KPK, AJ&K, northern
areas of Punjab and some areas of
Baluchistan. South region comprise of
Sindh and Southern Baluchistan
• As at Mar-19, North region has
installed capacity of 42.3mln tpa –
75% of total country’s operational
capacity
• 14 cement players affiliated with
distinct sponsoring groups are
operating in northern region
• Export avenues feasible for north
players are Afghanistan and India;
lesser reliance on exports as demand
from local market remained healthy in
last few years; demand was largely
stagnant in 1HFY19
Source: APCMA
As at Mar-19
Sr. # Cement Players
Operational
Capacity
(tons per
annum)
Market
Share
1 Bestway Cement 9,852,750 23.3%
2 Cherat Cement 4,536,500 10.7%
3 D.G.Khan Cement 4,221,000 10.0%
4 Lucky Cement 3,786,000 8.9%
5 Fauji Cement 3,433,500 8.1%
6 Maple Leaf Cement 3,370,500 8.0%
7 Askari Cement 2,677,500 6.3%
8 Kohat Cement 2,677,500 6.3%
9 Gharibwal Cement 2,110,500 5.0%
10 Pioneer Cement 2,030,250 4.8%
11 Flying Cement 1,197,000 2.8%
12 Dewan Hattar 1,134,000 2.7%
13 Fecto Cement 819,000 1.9%
14 Dandot Cement 504,000 1.2%
Total 42,350,000 100%
CEMENT INDUSTRY | SOUTH REGION
Source: APCMA
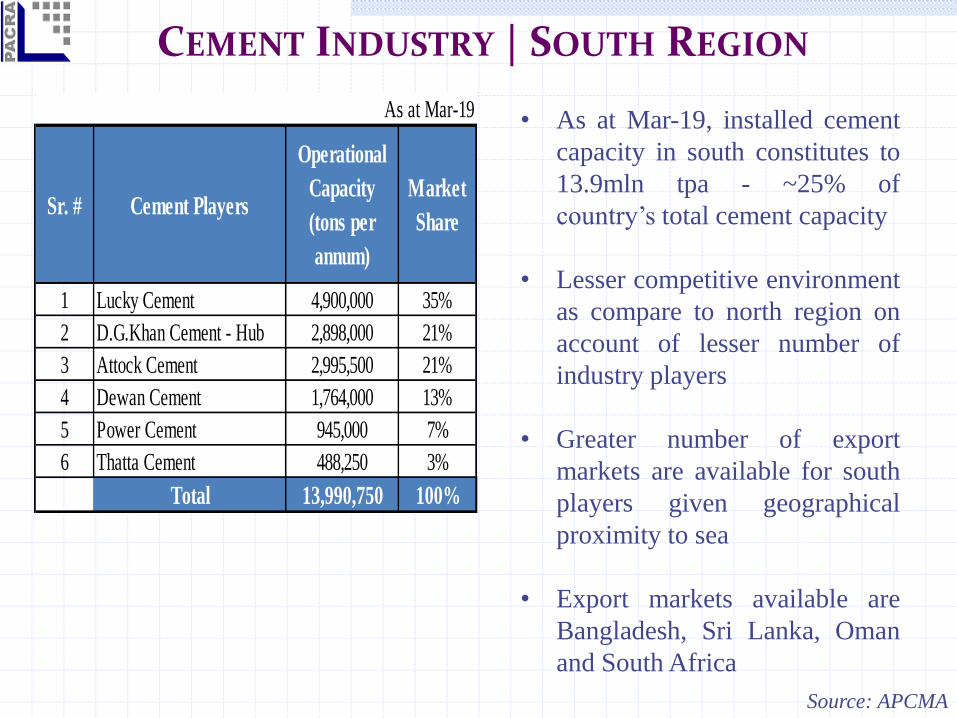
• As at Mar-19, installed cement
capacity in south constitutes to
13.9mln tpa - ~25% of
country’s total cement capacity
• Lesser competitive environment
as compare to north region on
account of lesser number of
industry players
• Greater number of export
markets are available for south
players given geographical
proximity to sea
• Export markets available are
Bangladesh, Sri Lanka, Oman
and South Africa
As at Mar-19
Sr. # Cement Players
Operational
Capacity
(tons per
annum)
Market
Share
1 Lucky Cement 4,900,000 35%
2 D.G.Khan Cement - Hub 2,898,000 21%
3 Attock Cement 2,995,500 21%
4 Dewan Cement 1,764,000 13%
5 Power Cement 945,000 7%
6 Thatta Cement 488,250 3%
Total 13,990,750 100%
CEMENT INDUSTRY | EXPANSIONS NORTH
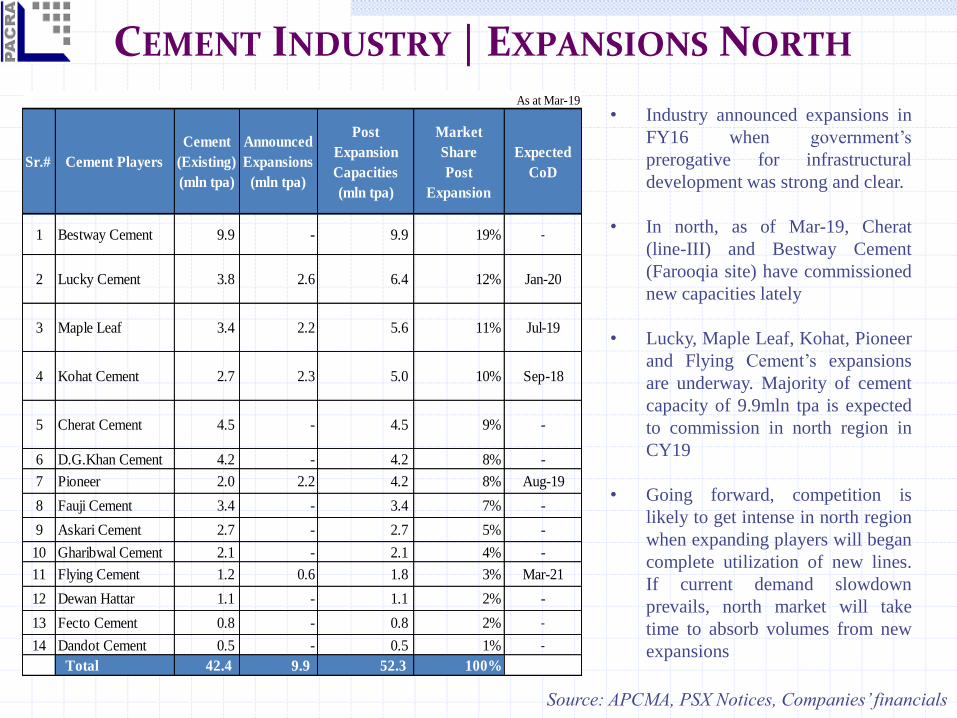
• Industry announced expansions in
FY16 when government’s
prerogative for infrastructural
development was strong and clear.
• In north, as of Mar-19, Cherat
(line-III) and Bestway Cement
(Farooqia site) have commissioned
new capacities lately
• Lucky, Maple Leaf, Kohat, Pioneer
and Flying Cement’s expansions
are underway. Majority of cement
capacity of 9.9mln tpa is expected
to commission in north region in
CY19
• Going forward, competition is
likely to get intense in north region
when expanding players will began
complete utilization of new lines.
If current demand slowdown
prevails, north market will take
time to absorb volumes from new
expansions
Source: APCMA, PSX Notices, Companies’ financials
As at Mar-19
Sr.# Cement Players
Cement
(Existing)
(mln tpa)
Announced
Expansions
(mln tpa)
Post
Expansion
Capacities
(mln tpa)
Market
Share
Post
Expansion
Expected
CoD
1 Bestway Cement 9.9 - 9.9 19% -
2 Lucky Cement 3.8 2.6 6.4 12% Jan-20
3 Maple Leaf 3.4 2.2 5.6 11% Jul-19
4 Kohat Cement 2.7 2.3 5.0 10% Sep-18
5 Cherat Cement 4.5 - 4.5 9% -
6 D.G.Khan Cement 4.2 - 4.2 8% -
7 Pioneer 2.0 2.2 4.2 8% Aug-19
8 Fauji Cement 3.4 - 3.4 7% -
9 Askari Cement 2.7 - 2.7 5% -
10 Gharibwal Cement 2.1 - 2.1 4% -
11 Flying Cement 1.2 0.6 1.8 3% Mar-21
12 Dewan Hattar 1.1 - 1.1 2% -
13 Fecto Cement 0.8 - 0.8 2% -
14 Dandot Cement 0.5 - 0.5 1% -
Total 42.4 9.9 52.3 100%
CEMENT INDUSTRY | EXPANSIONS SOUTH
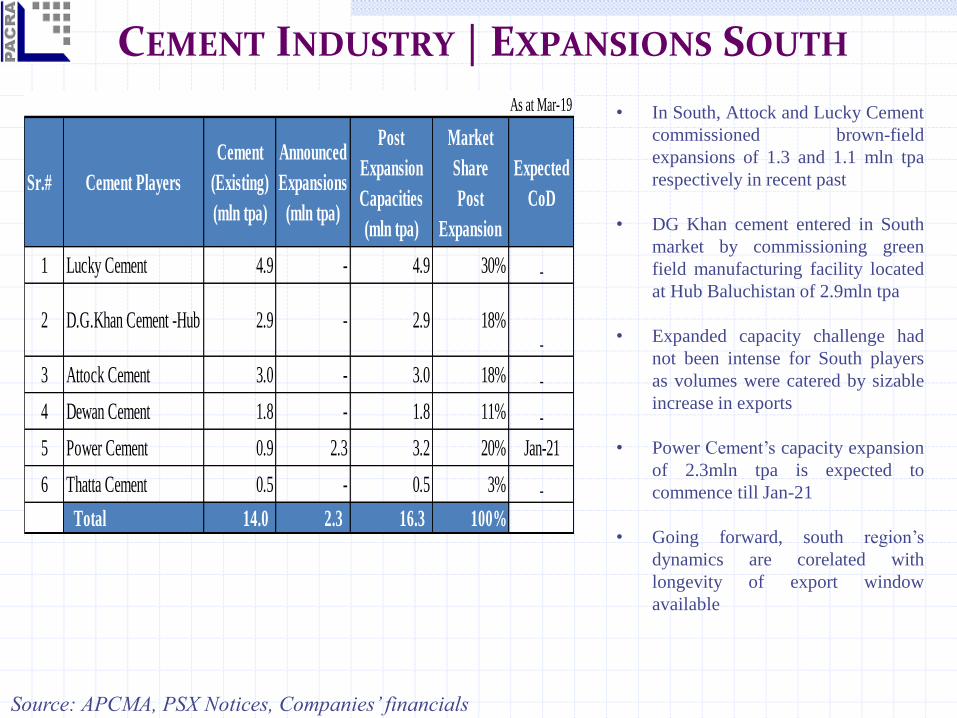
• In South, Attock and Lucky Cement
commissioned brown-field
expansions of 1.3 and 1.1 mln tpa
respectively in recent past
• DG Khan cement entered in South
market by commissioning green
field manufacturing facility located
at Hub Baluchistan of 2.9mln tpa
• Expanded capacity challenge had
not been intense for South players
as volumes were catered by sizable
increase in exports
• Power Cement’s capacity expansion
of 2.3mln tpa is expected to
commence till Jan-21
• Going forward, south region’s
dynamics are corelated with
longevity of export window
available
Source: APCMA, PSX Notices, Companies’ financials
As at Mar-19
Sr.# Cement Players
Cement
(Existing)
(mln tpa)
Announced
Expansions
(mln tpa)
Post
Expansion
Capacities
(mln tpa)
Market
Share
Post
Expansion
Expected
CoD
1 Lucky Cement 4.9 - 4.9 30% -
2 D.G.Khan Cement -Hub 2.9 - 2.9 18%-
3 Attock Cement 3.0 - 3.0 18% -
4 Dewan Cement 1.8 - 1.8 11% -
5 Power Cement 0.9 2.3 3.2 20% Jan-21
6 Thatta Cement 0.5 - 0.5 3% -
Total 14.0 2.3 16.3 100%
Sr# Rated Universe PACRA VIS
1 Bestway Cement AA-
2 D.G. Khan Cement AA-
3 Maple Leaf Cement
Factory A+
4 Attock Cement Pakistan A+
5 Cherat Cement Company A (+ve)
6 Kohat Cement Company A
7 Pioneer Cement A
8 Askari Cement A A
9 Gharibwal Cement A-
10 Fecto Cement A-
11 Power Cement A-
12 Thatta Cement A-
Capacity rated (%age) 63% 8%
Total Rated capacity 71%
CEMENT INDUSTRY | RATED UNIVERSE
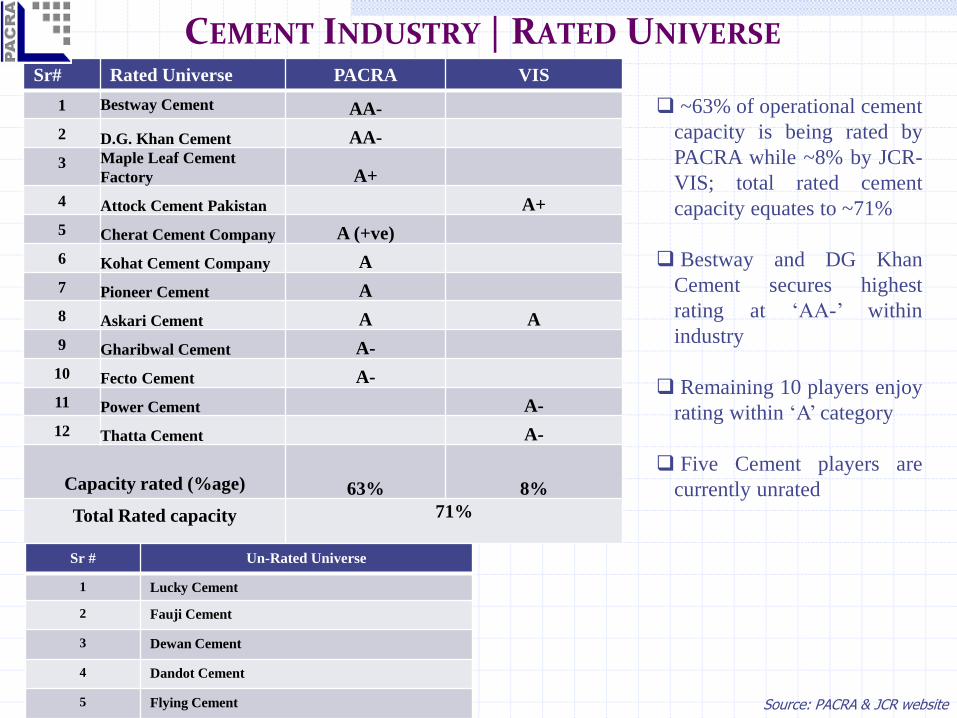
~63% of operational cement
capacity is being rated by
PACRA while ~8% by JCR-
VIS; total rated cement
capacity equates to ~71%
Bestway and DG Khan
Cement secures highest
rating at ‘AA-’ within
industry
Remaining 10 players enjoy
rating within ‘A’ category
Five Cement players are
currently unrated
Sr # Un-Rated Universe
1 Lucky Cement
2 Fauji Cement
3 Dewan Cement
4 Dandot Cement
5 Flying Cement Source: PACRA & JCR website
Cement Industry | Local & Total Utilization
Source: APCMA
FY08 FY09 FY10 FY11 FY12 FY13 FY14 FY15 FY16 FY17 FY18 1HFY19
7% -10% 16% -7% 9% 5% 4% 8% 17% 8% 15% -1%
YoY Growth in Local Despatches | Actual Figures
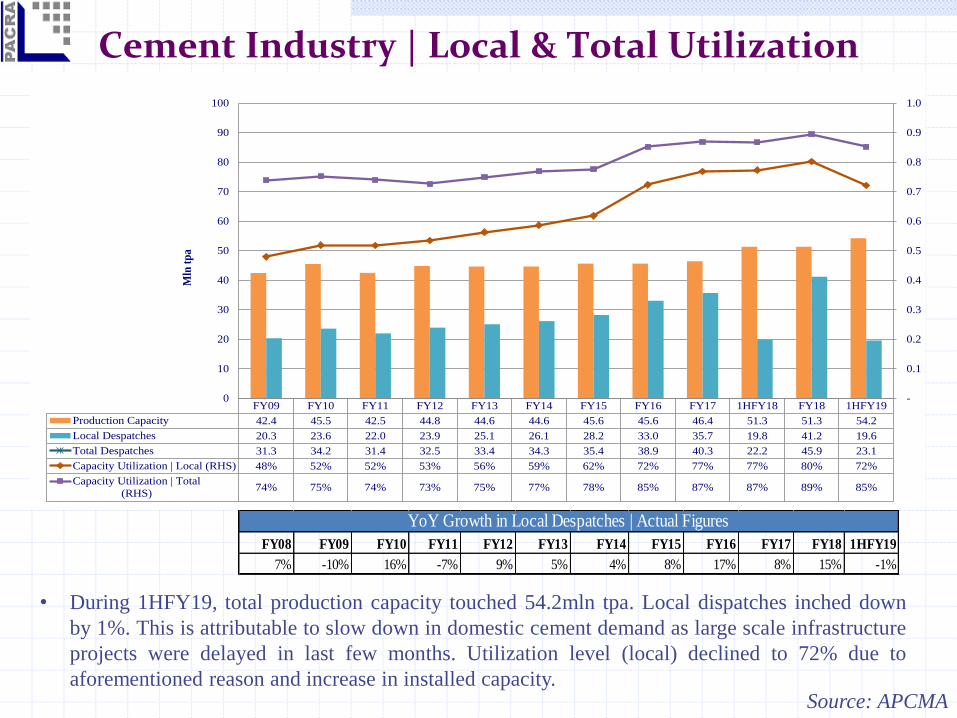
• During 1HFY19, total production capacity touched 54.2mln tpa. Local dispatches inched down
by 1%. This is attributable to slow down in domestic cement demand as large scale infrastructure
projects were delayed in last few months. Utilization level (local) declined to 72% due to
aforementioned reason and increase in installed capacity.
FY09 FY10 FY11 FY12 FY13 FY14 FY15 FY16 FY17 1HFY18 FY18 1HFY19
Production Capacity 42.4 45.5 42.5 44.8 44.6 44.6 45.6 45.6 46.4 51.3 51.3 54.2
Local Despatches 20.3 23.6 22.0 23.9 25.1 26.1 28.2 33.0 35.7 19.8 41.2 19.6
Total Despatches 31.3 34.2 31.4 32.5 33.4 34.3 35.4 38.9 40.3 22.2 45.9 23.1
Capacity Utilization | Local (RHS) 48% 52% 52% 53% 56% 59% 62% 72% 77% 77% 80% 72%
Capacity Utilization | Total
(RHS)74% 75% 74% 73% 75% 77% 78% 85% 87% 87% 89% 85%
-
0.1
0.2
0.3
0.4
0.5
0.6
0.7
0.8
0.9
1.0
0
10
20
30
40
50
60
70
80
90
100
Mln
tp
a
Cement Industry | Historical Export Analysis
Year Afghanistan
(Via Land)
India (Via
Sea & Land)
Other
Countries
(Via Sea)
Clinker Total
Growth
YoY
FY05 1.41 - 0.16 1.57
FY06 1.41 - 0.09 1.51 -4%
FY07 1.73 - 1.11 0.39 3.23 114%
FY08 2.78 0.79 3.05 1.11 7.72 139%
FY09 3.15 0.63 6.06 0.91 10.75 39%
FY10 4.02 0.72 5.63 0.28 10.65 -1%
FY11 4.73 0.59 3.91 0.20 9.43 -11%
FY12 4.72 0.61 3.25 - 8.57 -9%
FY13 4.40 0.48 3.49 - 8.37 -2%
FY14 3.66 0.68 3.80 - 8.14 -3%
FY15 2.87 0.70 3.63 - 7.20 -12%
FY16 2.44 0.99 2.44 - 5.87 -18%
FY17 1.72 1.25 1.69 - 4.66 -21%
1HFY18 1.20 0.56 0.64 - 2.41
FY18 1.82 1.21 1.71 - 4.75 2%
1HFY19 1.03 0.65 1.20 1.26 4.14 72%
Source: APCMA
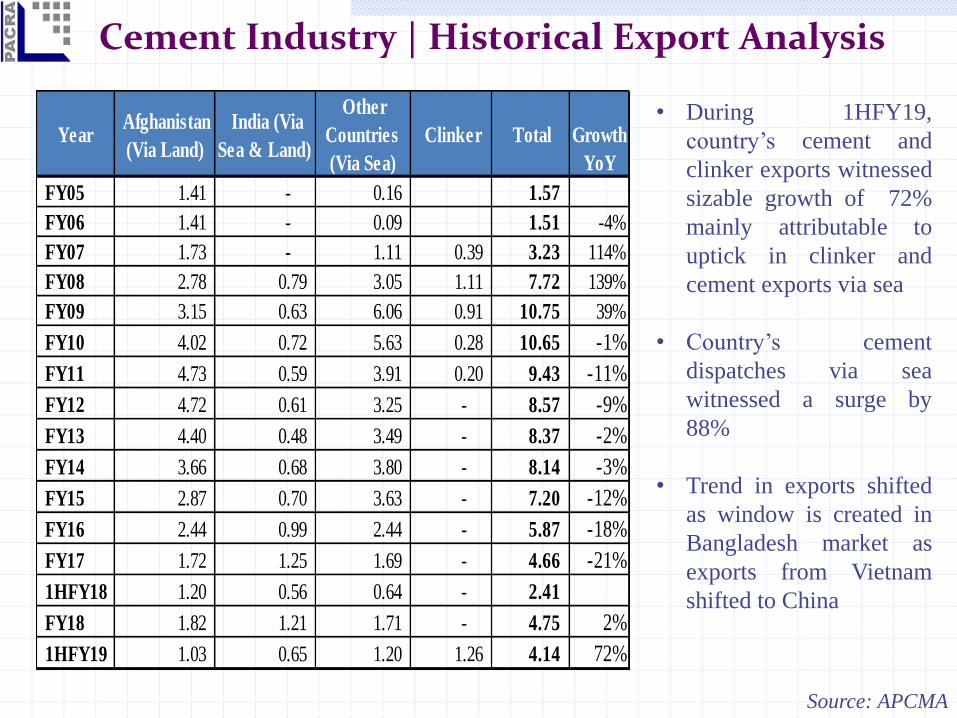
• During 1HFY19,
country’s cement and
clinker exports witnessed
sizable growth of 72%
mainly attributable to
uptick in clinker and
cement exports via sea
• Country’s cement
dispatches via sea
witnessed a surge by
88%
• Trend in exports shifted
as window is created in
Bangladesh market as
exports from Vietnam
shifted to China
Cement Industry | Performance Trend
Source: Company’s financial statements
FY11 FY12 FY13 FY14 FY15 FY16 FY17 FY18 1HFY19
Revenues 114,565 153,413 180,621 203,659 215,271 262,007 276,184 287,496 156,979
EBITDA 13,955 29,161 61,754 69,836 77,393 108,413 102,872 83,639 42,711
Net Income 1,561 20,303 36,832 41,476 50,980 64,325 62,057 57,842 23,295
EBITDA Margin 12% 19% 34% 34% 36% 41% 37% 29% 27%
Net Margin 1% 13% 20% 20% 24% 25% 22% 20% 15%
0%
5%
10%
15%
20%
25%
30%
35%
40%
45%
-
50,000
100,000
150,000
200,000
250,000
300,000
350,000
PKR
mln
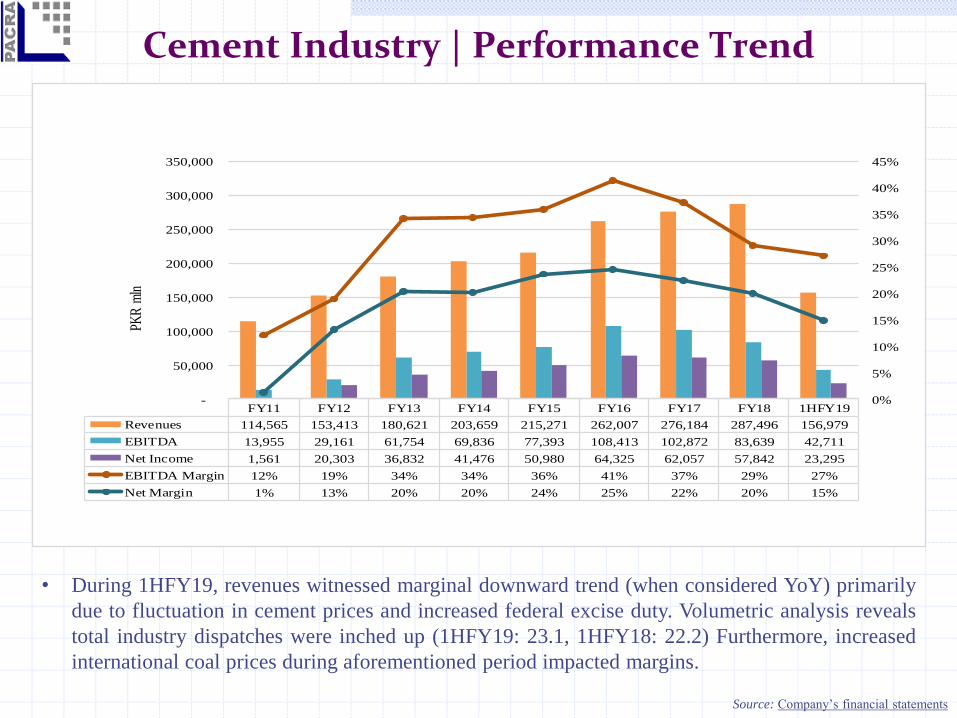
• During 1HFY19, revenues witnessed marginal downward trend (when considered YoY) primarily
due to fluctuation in cement prices and increased federal excise duty. Volumetric analysis reveals
total industry dispatches were inched up (1HFY19: 23.1, 1HFY18: 22.2) Furthermore, increased
international coal prices during aforementioned period impacted margins.
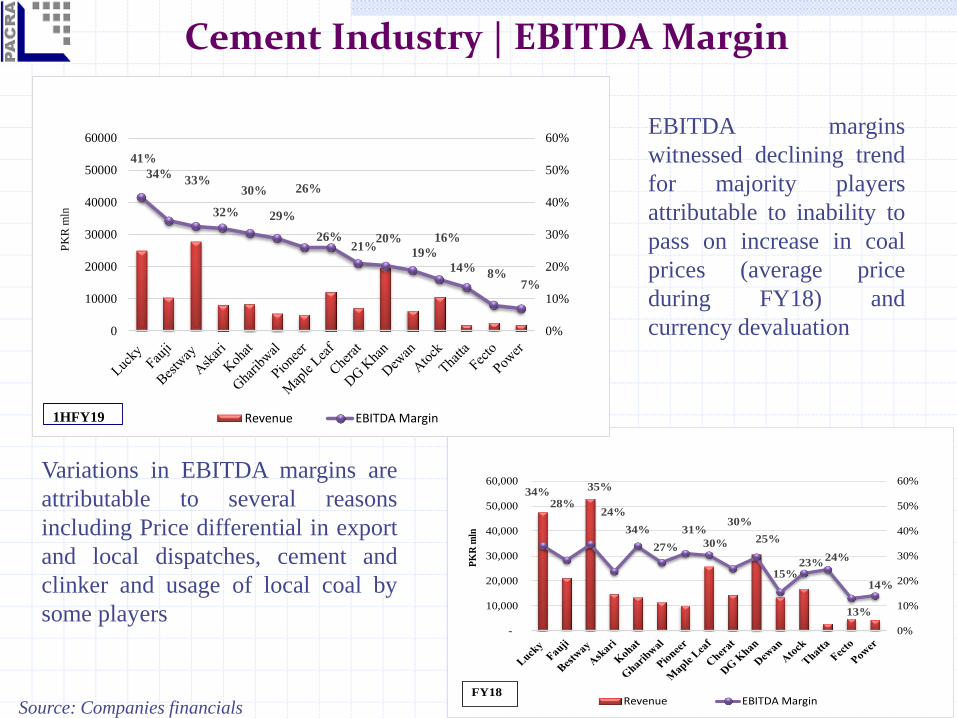
Cement Industry | EBITDA Margin
Source: Company’s financial statements
EBITDA margins
witnessed declining trend
for majority players
attributable to inability to
pass on increase in coal
prices (average price
during FY18) and
currency devaluation
34%28%
35%
24%
34%
27%
31%
30% 25%
30%
15%23%
24%
13%
14%
0%
10%
20%
30%
40%
50%
60%
-
10,000
20,000
30,000
40,000
50,000
60,000P
KR
mln
Revenue EBITDA MarginFY18
41%
34%33%
32%
30%
29%
26%
26%21%
20%
19%
16%
14%8%
7%
0%
10%
20%
30%
40%
50%
60%
0
10000
20000
30000
40000
50000
60000
PK
R m
ln
Revenue EBITDA Margin1HFY19
Source: Companies financials
Variations in EBITDA margins are
attributable to several reasons
including Price differential in export
and local dispatches, cement and
clinker and usage of local coal by
some players
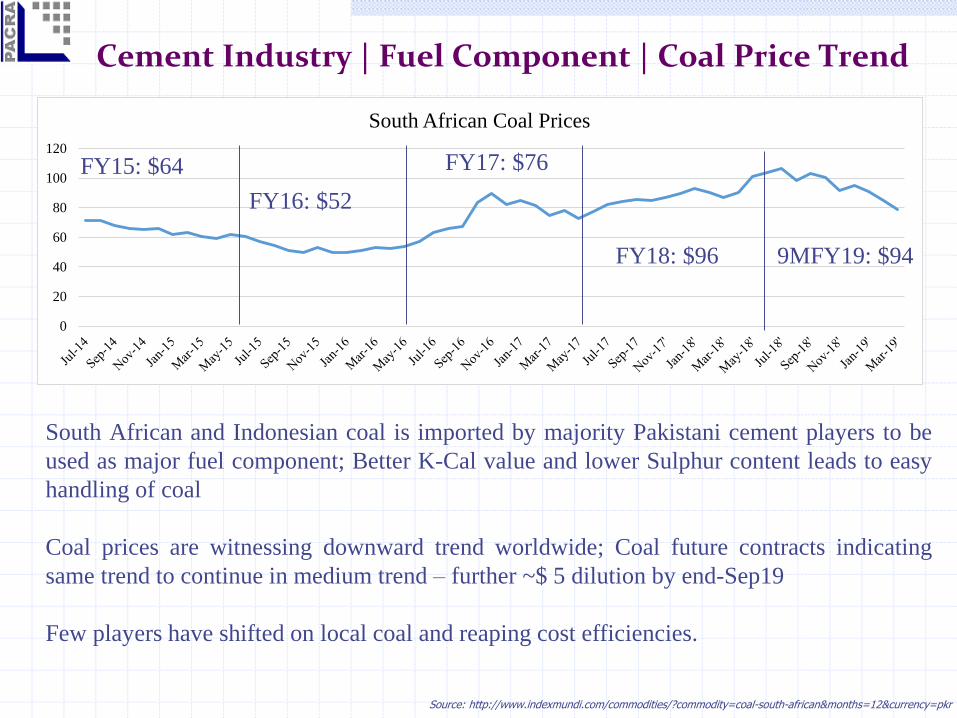
Cement Industry | Fuel Component | Coal Price Trend
Source: http://www.indexmundi.com/commodities/?commodity=coal-south-african&months=12¤cy=pkr
0
20
40
60
80
100
120
South African Coal Prices
FY15: $64
FY16: $52
9MFY19: $94FY18: $96
FY17: $76
South African and Indonesian coal is imported by majority Pakistani cement players to be
used as major fuel component; Better K-Cal value and lower Sulphur content leads to easy
handling of coal
Coal prices are witnessing downward trend worldwide; Coal future contracts indicating
same trend to continue in medium trend – further ~$ 5 dilution by end-Sep19
Few players have shifted on local coal and reaping cost efficiencies.
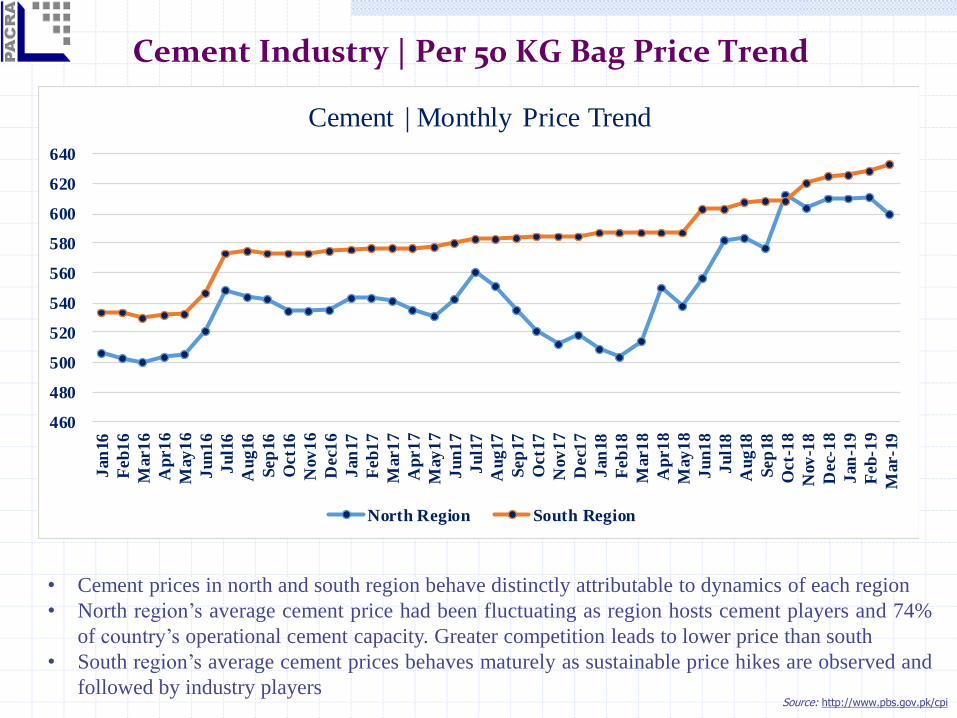
Cement Industry | Per 50 KG Bag Price Trend
Source: http://www.pbs.gov.pk/cpi
460
480
500
520
540
560
580
600
620
640
Jan
16
Feb
16
Mar1
6
Ap
r1
6
May
16
Ju
n1
6
Ju
l16
Au
g16
Sep
16
Oct1
6
Nov
16
Dec1
6
Jan
17
Feb
17
Mar1
7
Ap
r1
7
May
17
Ju
n1
7
Ju
l17
Au
g17
Sep
17
Oct1
7
Nov
17
Dec1
7
Jan
18
Feb
18
Mar1
8
Ap
r1
8
May
18
Ju
n1
8
Ju
l18
Au
g18
Sep
18
Oct-
18
Nov
-18
Dec-
18
Jan
-19
Feb
-19
Mar-1
9
Cement | Monthly Price Trend
North Region South Region
• Cement prices in north and south region behave distinctly attributable to dynamics of each region
• North region’s average cement price had been fluctuating as region hosts cement players and 74%
of country’s operational cement capacity. Greater competition leads to lower price than south
• South region’s average cement prices behaves maturely as sustainable price hikes are observed and
followed by industry players

Cement Industry | Capital Structure
Source: https://www.apcma.com/cost_debt.html & Company’s financial Statements
FY08 FY09 FY10 FY11 FY12 FY13 FY14 FY15 FY16 FY17 FY18 1HFY19
Debt 111 125 126 125 77 62 42 59 59 81 146 173
Equity 109 101 100 114 132 173 228 244 307 354 393 400
Leveraging 50% 55% 56% 52% 37% 26% 16% 19% 16% 19% 27% 30%
0%
10%
20%
30%
40%
50%
60%
0
50
100
150
200
250
300
350
400
450
PK
R (
bln
)
Cement Sector | Capital Structure
Debt Equity Leveraging
Analysis of last one decade reveals that cement industry’s equity base have increased
manifolds. Hence, leveraging in second phase of expansion (majority player’s debt is
loaded) is much lower than first phase (2008). Nevertheless, increased interest rate
requires prudent management of financial affairs
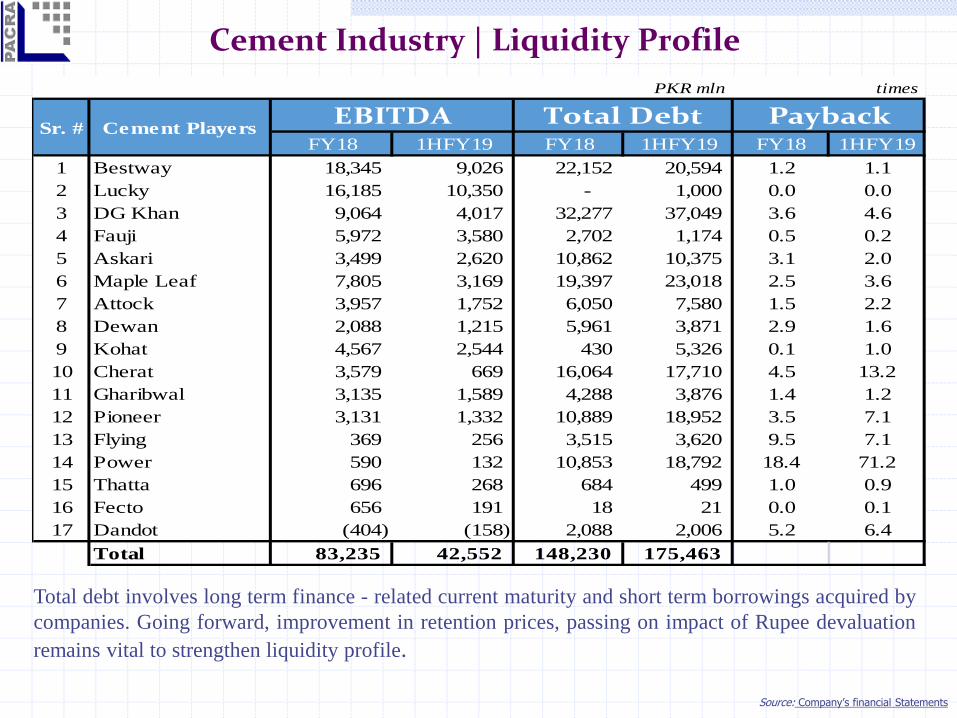
Cement Industry | Liquidity Profile
Total debt involves long term finance - related current maturity and short term borrowings acquired by
companies. Going forward, improvement in retention prices, passing on impact of Rupee devaluation
remains vital to strengthen liquidity profile.
Source: Company’s financial Statements
PKR mln
FY18 1HFY19 FY18 1HFY19 FY18 1HFY19
1 Bestway 18,345 9,026 22,152 20,594 1.2 1.1
2 Lucky 16,185 10,350 - 1,000 0.0 0.0
3 DG Khan 9,064 4,017 32,277 37,049 3.6 4.6
4 Fauji 5,972 3,580 2,702 1,174 0.5 0.2
5 Askari 3,499 2,620 10,862 10,375 3.1 2.0
6 Maple Leaf 7,805 3,169 19,397 23,018 2.5 3.6
7 Attock 3,957 1,752 6,050 7,580 1.5 2.2
8 Dewan 2,088 1,215 5,961 3,871 2.9 1.6
9 Kohat 4,567 2,544 430 5,326 0.1 1.0
10 Cherat 3,579 669 16,064 17,710 4.5 13.2
11 Gharibwal 3,135 1,589 4,288 3,876 1.4 1.2
12 Pioneer 3,131 1,332 10,889 18,952 3.5 7.1
13 Flying 369 256 3,515 3,620 9.5 7.1
14 Power 590 132 10,853 18,792 18.4 71.2
15 Thatta 696 268 684 499 1.0 0.9
16 Fecto 656 191 18 21 0.0 0.1
17 Dandot (404) (158) 2,088 2,006 5.2 6.4
Total 83,235 42,552 148,230 175,463
Sr. #
times
Total DebtEBITDA PaybackCement Players
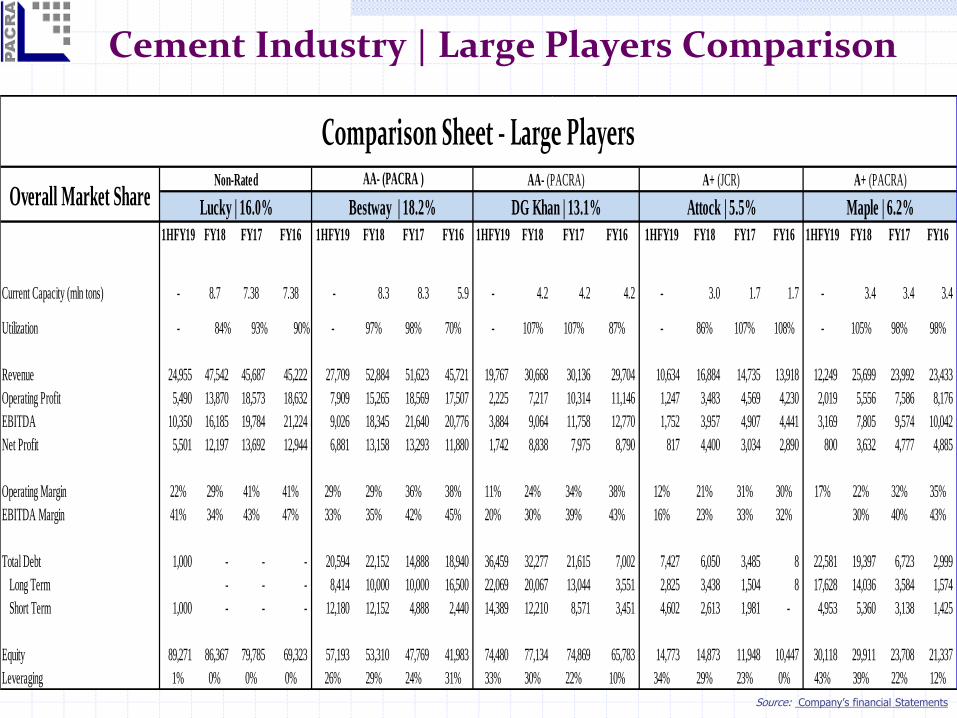
Cement Industry | Large Players Comparison
Source: Company’s financial Statements
1HFY19 FY18 FY17 FY16 1HFY19 FY18 FY17 FY16 1HFY19 FY18 FY17 FY16 1HFY19 FY18 FY17 FY16 1HFY19 FY18 FY17 FY16
Current Capacity (mln tons) - 8.7 7.38 7.38 - 8.3 8.3 5.9 - 4.2 4.2 4.2 - 3.0 1.7 1.7 - 3.4 3.4 3.4
Utilization - 84% 93% 90% - 97% 98% 70% - 107% 107% 87% - 86% 107% 108% - 105% 98% 98%
Revenue 24,955 47,542 45,687 45,222 27,709 52,884 51,623 45,721 19,767 30,668 30,136 29,704 10,634 16,884 14,735 13,918 12,249 25,699 23,992 23,433
Operating Profit 5,490 13,870 18,573 18,632 7,909 15,265 18,569 17,507 2,225 7,217 10,314 11,146 1,247 3,483 4,569 4,230 2,019 5,556 7,586 8,176
EBITDA 10,350 16,185 19,784 21,224 9,026 18,345 21,640 20,776 3,884 9,064 11,758 12,770 1,752 3,957 4,907 4,441 3,169 7,805 9,574 10,042
Net Profit 5,501 12,197 13,692 12,944 6,881 13,158 13,293 11,880 1,742 8,838 7,975 8,790 817 4,400 3,034 2,890 800 3,632 4,777 4,885
Operating Margin 22% 29% 41% 41% 29% 29% 36% 38% 11% 24% 34% 38% 12% 21% 31% 30% 17% 22% 32% 35%
EBITDA Margin 41% 34% 43% 47% 33% 35% 42% 45% 20% 30% 39% 43% 16% 23% 33% 32% 30% 40% 43%
Total Debt 1,000 - - - 20,594 22,152 14,888 18,940 36,459 32,277 21,615 7,002 7,427 6,050 3,485 8 22,581 19,397 6,723 2,999
Long Term - - - 8,414 10,000 10,000 16,500 22,069 20,067 13,044 3,551 2,825 3,438 1,504 8 17,628 14,036 3,584 1,574
Short Term 1,000 - - - 12,180 12,152 4,888 2,440 14,389 12,210 8,571 3,451 4,602 2,613 1,981 - 4,953 5,360 3,138 1,425
Equity 89,271 86,367 79,785 69,323 57,193 53,310 47,769 41,983 74,480 77,134 74,869 65,783 14,773 14,873 11,948 10,447 30,118 29,911 23,708 21,337
Leveraging 1% 0% 0% 0% 26% 29% 24% 31% 33% 30% 22% 10% 34% 29% 23% 0% 43% 39% 22% 12%
Non-Rated
Lucky | 16.0%
AA- (PACRA )
Bestway | 18.2%
AA- (PACRA)
DG Khan | 13.1%
A+ (JCR)
Attock | 5.5%
A+ (PACRA)
Maple | 6.2%Overall Market Share
Comparison Sheet - Large Players
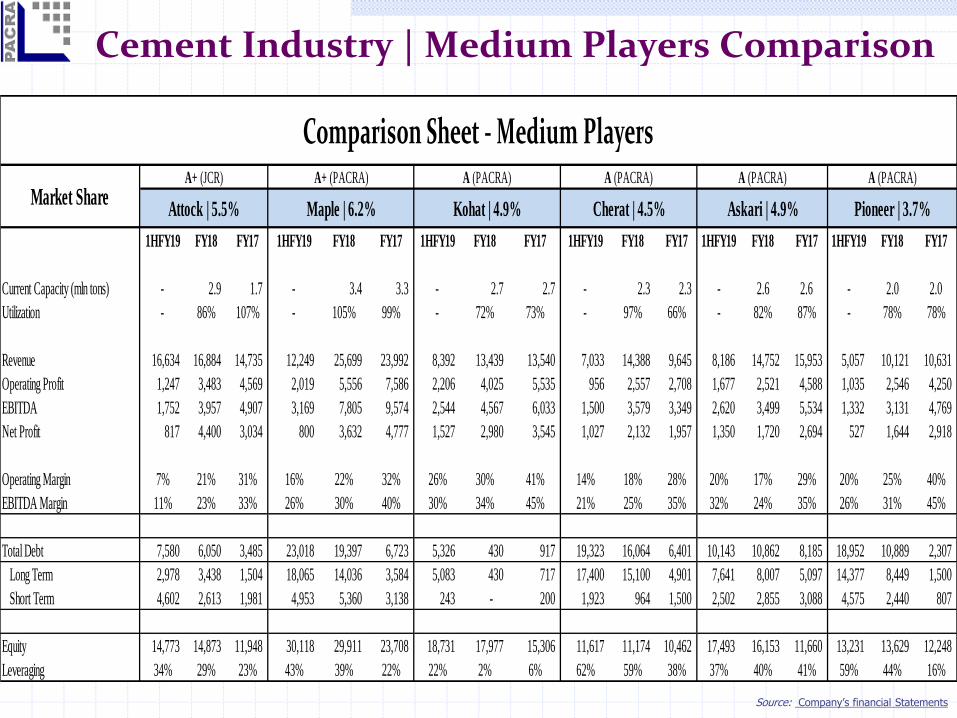
Cement Industry | Medium Players Comparison
Source: Company’s financial Statements
1HFY19 FY18 FY17 1HFY19 FY18 FY17 1HFY19 FY18 FY17 1HFY19 FY18 FY17 1HFY19 FY18 FY17 1HFY19 FY18 FY17
Current Capacity (mln tons) - 2.9 1.7 - 3.4 3.3 - 2.7 2.7 - 2.3 2.3 - 2.6 2.6 - 2.0 2.0
Utilization - 86% 107% - 105% 99% - 72% 73% - 97% 66% - 82% 87% - 78% 78%
Revenue 16,634 16,884 14,735 12,249 25,699 23,992 8,392 13,439 13,540 7,033 14,388 9,645 8,186 14,752 15,953 5,057 10,121 10,631
Operating Profit 1,247 3,483 4,569 2,019 5,556 7,586 2,206 4,025 5,535 956 2,557 2,708 1,677 2,521 4,588 1,035 2,546 4,250
EBITDA 1,752 3,957 4,907 3,169 7,805 9,574 2,544 4,567 6,033 1,500 3,579 3,349 2,620 3,499 5,534 1,332 3,131 4,769
Net Profit 817 4,400 3,034 800 3,632 4,777 1,527 2,980 3,545 1,027 2,132 1,957 1,350 1,720 2,694 527 1,644 2,918
Operating Margin 7% 21% 31% 16% 22% 32% 26% 30% 41% 14% 18% 28% 20% 17% 29% 20% 25% 40%
EBITDA Margin 11% 23% 33% 26% 30% 40% 30% 34% 45% 21% 25% 35% 32% 24% 35% 26% 31% 45%
Total Debt 7,580 6,050 3,485 23,018 19,397 6,723 5,326 430 917 19,323 16,064 6,401 10,143 10,862 8,185 18,952 10,889 2,307
Long Term 2,978 3,438 1,504 18,065 14,036 3,584 5,083 430 717 17,400 15,100 4,901 7,641 8,007 5,097 14,377 8,449 1,500
Short Term 4,602 2,613 1,981 4,953 5,360 3,138 243 - 200 1,923 964 1,500 2,502 2,855 3,088 4,575 2,440 807
Equity 14,773 14,873 11,948 30,118 29,911 23,708 18,731 17,977 15,306 11,617 11,174 10,462 17,493 16,153 11,660 13,231 13,629 12,248
Leveraging 34% 29% 23% 43% 39% 22% 22% 2% 6% 62% 59% 38% 37% 40% 41% 59% 44% 16%
Comparison Sheet - Medium Players
Askari | 4.9%
A (PACRA)A (PACRA)
Cherat | 4.5%
A (PACRA)
Kohat | 4.9%
A+ (PACRA)
Market ShareMaple | 6.2%
A+ (JCR)
Attock | 5.5%
A (PACRA)
Pioneer | 3.7%
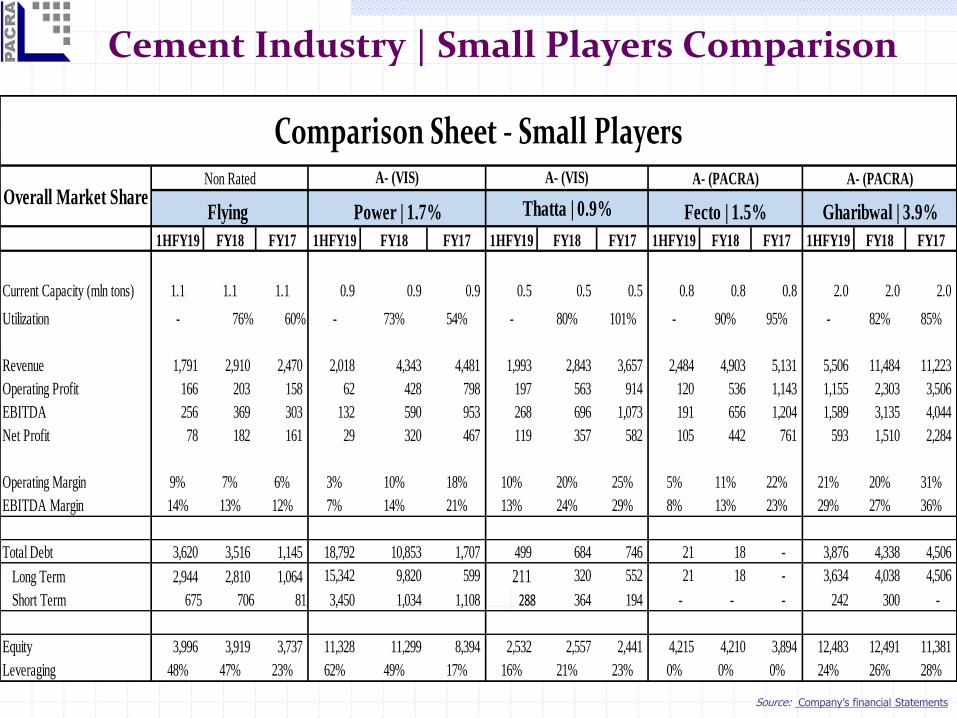
Cement Industry | Small Players Comparison
Source: Company’s financial Statements
1HFY19 FY18 FY17 1HFY19 FY18 FY17 1HFY19 FY18 FY17 1HFY19 FY18 FY17 1HFY19 FY18 FY17
Current Capacity (mln tons) 1.1 1.1 1.1 0.9 0.9 0.9 0.5 0.5 0.5 0.8 0.8 0.8 2.0 2.0 2.0
Utilization - 76% 60% - 73% 54% - 80% 101% - 90% 95% - 82% 85%
Revenue 1,791 2,910 2,470 2,018 4,343 4,481 1,993 2,843 3,657 2,484 4,903 5,131 5,506 11,484 11,223
Operating Profit 166 203 158 62 428 798 197 563 914 120 536 1,143 1,155 2,303 3,506
EBITDA 256 369 303 132 590 953 268 696 1,073 191 656 1,204 1,589 3,135 4,044
Net Profit 78 182 161 29 320 467 119 357 582 105 442 761 593 1,510 2,284
Operating Margin 9% 7% 6% 3% 10% 18% 10% 20% 25% 5% 11% 22% 21% 20% 31%
EBITDA Margin 14% 13% 12% 7% 14% 21% 13% 24% 29% 8% 13% 23% 29% 27% 36%
Total Debt 3,620 3,516 1,145 18,792 10,853 1,707 499 684 746 21 18 - 3,876 4,338 4,506
Long Term 2,944 2,810 1,064 15,342 9,820 599 211 320 552 21 18 - 3,634 4,038 4,506
Short Term 675 706 81 3,450 1,034 1,108 288 364 194 - - - 242 300 -
Equity 3,996 3,919 3,737 11,328 11,299 8,394 2,532 2,557 2,441 4,215 4,210 3,894 12,483 12,491 11,381
Leveraging 48% 47% 23% 62% 49% 17% 16% 21% 23% 0% 0% 0% 24% 26% 28%
Comparison Sheet - Small Players
Flying
Non Rated A- (PACRA)
Gharibwal | 3.9%
A- (PACRA)
Fecto | 1.5%Overall Market Share
A- (VIS)
Thatta | 0.9%
A- (VIS)
Power | 1.7%
Cement Sector | Outlook
Factors for outlook:
• Slow down in large infrastructural projects
• Industry players achieving major capacity expansions in upcoming months –
especially in north region – which amid low demand may result in supply glut in
upcoming year
• Trend in cement prices across north region; historically unsustainable in period of
expansions coming online (recently prices have come down despite increase in cost)
• Hike in interest rate is burdening profitability of industry players
Short to Medium term outlook: Negative

Rating Team Unit Head - RatingsJhangeer Hanif
Supervisory SeniorSehar Fatima
Contact Number: +92 42 3586 9504
DISCLAIMERPACRA has used due care in preparation of this document. Our information has been obtained from
sources we consider to be reliable but its accuracy or completeness is not guaranteed. The information
in this document may be copied or otherwise reproduced, in whole or in part, provided the source is
duly acknowledged. The presentation should not be relied upon as professional advice.