cement sector program in sub-saharan africa: barriers analysis to ...

FINAL REPORT - April 2009 -
THE WORLD BANK
CEMENT SECTOR PROGRAM IN SUB-SAHARAN AFRICA:
BARRIERS ANALYSIS TO CDM AND SOLUTIONS
Pub
lic D
iscl
osur
e A
utho
rized
Pub
lic D
iscl
osur
e A
utho
rized
Pub
lic D
iscl
osur
e A
utho
rized
Pub
lic D
iscl
osur
e A
utho
rized
World Bank/CF Assist Cement Sector Program in SSA: Barriers Analysis to CDM and Solutions
Final Report
Econoler International i (REF: # 5430)
ABBREVIATIONS AND ACRONYMS ACC Associated Cement Company ACEL Ambuja Cement Eastern Limited ACIL Ambuja Cement India Limited ACM Approved Consolidated Methodology AMS Approved Methodology for Small-Scale Project Activity APO Asian Productivity Organization ASSOCHAM Associated Chambers of Commerce and Industry of India BC Blended Cement BCSD Business Council for Sustainable Development BEE Bureau of Energy Efficiency BEE Black Economic Empowerment BHC British High Commission CAGR Compound Annual Growth Rate CASCADe Carbon Finance for Agriculture, Silviculture,
Conservation and Action against Deforestation CD4CDM Capacity Development for the CDM CDCF Community Development Carbon Fund CDM Clean Development Mechanism CEB Electricity Community of Benin CER Certified Emission Reduction CF Carbon Finance CII Confederation of India Industry CMA Cement Manufacturers Association CMAN Cement Manufacturers Association of Nigeria CO2 Carbon Dioxide CPWD Central Public Works Department CSI Cement Sustainability Initiative DNA Designated National Authority DOE Designated Operational Entity DTI Department of Trade and Industry EACPA East Africa Cement Producers Association EAPCC East Africa Portland Cement Company EJ Exa joule (1018) EU ETS European Union Emission Trading System FCCI Federation of Indian Chambers of Commerce and Industry FFEM French Global Environment Fund GACL Gujarat Ambuja Cement Limited GERIAP Greenhouse Gas Emission Reduction from Industry in Asia and Pacific GHG Greenhouse Gas
World Bank/CF Assist Cement Sector Program in SSA: Barriers Analysis to CDM and Solutions
Final Report
Econoler International ii (REF: # 5430)
GJ Giga joule (109) GTZ Gesellschaft für Technische Zusammenarbeit HFC HydroFluoroCarbures HFO Heavy Fuel Oil ICR International Cement Review IFC International Financial Corporation IREDA Indian Renewable Energy Development Agency Limited JI Joint Implementation LULUCF Land Use, Land-Use Change and Forestry MAN Manufacturers Association of Nigeria MDG Millennium Development Goals MSW Municipal Solid Waste Mt million tonne Mtpa Million tonne per annum NCAER National Council of Applied Economic Research NCBM National Cement and Building Materials NCPC National Cleaner Production Center NEDO New Energy and Industrial Technology Development Organization NF Nairobi Framework NO2 Nitrogen Dioxide NPC National Productivity Council OECD Organisation for Economic co-operation and Development OPC Ordinary Portland Cement PDD Project Design Document PIN Project Idea Note PPC Pozzolona Portland Cement PSC Portland Slag Cement R&D Research and Development SON Standards Organization of Nigeria SSA Sub-Saharan Africa UNDP United Nations Development Programme UNEP United Nations Environment Programme UNF United Nations Foundation UNFCCC United Nations Framework for Climate Change Conversion UNIDO United Nations Industrial Development Organization UNSD United Nations Statistics Division URC UNEP Risoe Centre USAID United States Agency for International Development WBCSD World Business Council for Sustainable Development
World Bank/CF Assist Cement Sector Program in SSA: Barriers Analysis to CDM and Solutions
Final Report
Econoler International iii (REF: # 5430)
TABLE OF CONTENTS
ABBREVIATIONS AND ACRONYMS ............................................... I ACKNOWLEDGEMENTS ........................................................ VI EXECUTIVE SUMMARY ..................................................... VIII INTRODUCTION ............................................................. 1 1 METHODOLOGY.......................................................... 4 2 ANALYSIS OF THE SUCCESS STORIES OF INDIA............................. 6
2.1 Overview of the Indian cement sector.............................. 6 2.2 CDM Project Portfolio in India’s Cement Industry................. 12 2.3 CDM Lessons Learnt from the Approach in India.................... 20
3 ASSESSMENT OF BARRIERS TO CDM PROJECTS DEVELOPMENT IN SUB-SAHARAN AFRICA .................................................................. 27
3.1 Overview of the Sub-saharan African Cement Industry.............. 27 3.2 Barriers Analysis to CDM Projects in the SSA Cement Sector....... 37 3.3 Parallel between the Indian and SSA Cement Industries............ 42
4 CDM OPPORTUNITIES IN THE SSA CEMENT SECTOR.......................... 44 4.1 Review of CDM Projects Portfolio in Africa....................... 44 4.2 Ongoing CDM Initiatives in the SSA Cement Industry............... 49 4.3 Cement Manufacturing process and CDM Opportunities............... 51 4.4 Quantitative Analysis of Emissions Reduction Potential........... 56
5 RECOMMENDATIONS TO BOOST CDM PROJECTS IN THE SSA CEMENT SECTOR...... 73 APPENDIX 1 QUESTIONAIRE FOR CEMENT INDUSTRY’S STAKEHOLDERS IN INDIA APPENDIX 2 QUESTIONAIRE FOR CEMENT MANUFACTURERS IN INDIA APPENDIX 3 LIST OF ORGANIZATIONS CONTACTED IN INDIA APPENDIX 4 DATABASE OF THE INDIAN CDM PROJECTS IN THE CEMENT SECTOR APPENDIX 5 QUESTIONNAIRE FOR CEMENT MANUFACTURERS IN SSA COUNTRIES APPENDIX 6 LIST OF ORGANIZATION CONTACTED IN AFRICA APPENDIX 7 LIST OF CEMENT PLANTS IN SUB-SAHARAN AFRICA APPENDIX 8 CEMENT PRODUCTION IN SSA COUNTRIES BIBLIOGRAPHY LIST OF TABLES Table 1 : Process-wise reduction in Energy Consumption in Indian Cement Plants ............................10

World Bank/CF Assist Cement Sector Program in SSA: Barriers Analysis to CDM and Solutions
Final Report
Econoler International iv (REF: # 5430)
Table 1: Number of Projects Submitted by Approved Methodology .....................................................14 Table 2: Cost of CO2 Reduced over the Crediting Period.....................................................................19 Table 3: Barriers to CDM in the Indian Cement Sector.........................................................................24 Table 4: List of Rejected Projects in India’s Cement Sector .................................................................25 Table 5: Baseline Benchmark for Selected Blended Cement Project in India ......................................26 Table 6: Top Three Cement Manufacturing Companies in SSA...........................................................28 Table 7: Breakdown of Cement Plants and Installed Capacity in SSA .................................................30 Table 8: Cement Retail Prices in Selected Countries ...........................................................................36 Table 9: Specific Energy Consumption in Selected Cement Plants in Sub-Saharan Africa .................37 Table 10: Parallel between Indian and SSA Cement Industries ...........................................................43 Table 11: CDM Projects Portfolio per Region as of January 1, 2009 ...................................................44 Table 12: CDM Projects at the PDD Stage in Africa (as of January 1, 2009).......................................45 Table 3 : CDM Projects Identified during Field Assessment in the SSA Cement Sector ......................50 Table 14: CDM Projects Opportunities in the Cement Sector...............................................................55 Table 15: Assumptions for Energy Savings and Emission Reduction Estimate ...................................57 Table 16: Emission Reduction Potential for Fuel Savings in SSA Cement Kilns..................................58 Table 17: Emissions Reduction Potential for Electricity Savings in SSA Cement Facilities..................59 Table 18: Waste Heat Recovery for Power Generation in a Cement Factory56 ....................................62 Table 19: ER Potential for Waste Heat Recovery CDM Projects in SSA Cement Kilns .......................63 Table 20: Emissions Reduction for Typical Alternative Fuels ...............................................................66 Table 21: Emissions Reduction Potential for Fuel Substitution Projects in SSA Cement Kilns ............67 Table 22: Relation between Blend Increase and Emissions Reductions..............................................70 Table 23: CDM Opportunities: Shifting from OPC to Blended Cement Production in SSA...................71 LIST OF FIGURES Figure 1: Production and Consumption Trends in the Indian Cement Sector.........................................8 Figure 2: Historical Prices of Cement in India.........................................................................................9 Figure 3: Breakdown of Registered CDM Projects in the Cement Sector.............................................16 Figure 4: Number of Registered Projects in the Indian Cement Sector ................................................17 Figure 5: Number per Quarter of Indian Projects Posted for Comments and Registered.....................18 Figure 6: Cement Production Trends by Region (103 metric tonnes) ...................................................31 Figure 7: Cement Trade Balance for Selected Countries (103 tonnes).................................................33 Figure 8: Geographical Distribution of CDM Projects in Africa (as of January 1, 2009) .......................46 Figure 9: Number of CDM Projects Submitted for Validation per Year in Africa...................................47 Figure 10: Breakdown of CDM Project in Africa by Type (as of Jan. 1, 2009)......................................48 Figure 11: Energy use of different steps ...............................................................................................51 Figure 12: Cement Manufacturing Process and CDM Projects Opportunities ......................................53 LIST OF BOXES Box 1: Lafarge in Sub-Saharan Africa ..................................................................................................29
World Bank/CF Assist Cement Sector Program in SSA: Barriers Analysis to CDM and Solutions
Final Report
Econoler International v (REF: # 5430)
Box 2 : Nigeria Cement Sector .............................................................................................................35 Box 3: Vikram Cement (VC): Energy Efficiency Improvement by up Gradation of Preheater in Cement..............................................................................................................................................................60 Box 4: Grasim Cement: Energy Efficiency by up-Gradation of Clinker Cooler in Cement Manufacturing..............................................................................................................................................................61 Box 5: Waste Heat Recovery Project at EAPCC plant in Kenya ..........................................................64 Box 6: SOCOCIM Partial Substitution of Coal by Jatropha Fruits and Biomass Residues in the Production of Portland Cement in Senegal...........................................................................................68 Box 7: Lafarge Cement WAPCO Blended Cement Project at the Shagamu Cement and Ewekoro Cement Plants in Nigeria .....................................................................................................................72
World Bank/CF Assist Cement Sector Program in SSA: Barriers Analysis to CDM and Solutions
Final Report
Econoler International vi (REF: # 5430)
ACKNOWLEDGEMENTS
The issue of CDM project development in the cement sector, dedicated to Africa, includes a number of analyses carried out mainly by African international and local experts.
Part 1 presents the methodology of the study. The approach used during this study was designed on intensive field works through in-person and telephone consultations with cement industry key players in selected countries based on the location of major cement facilities as well as in India to learn from India successful experience.
Part 2 deals with Indian experience in CDM project development, particularly in the cement sector. India has been one of the most successful countries in harnessing the benefits of CDM, with about 358 registered projects so far, including 25 projects in the cement sector. The particular success of the Indian cement sector has been facilitated by many factors, among which the Energy Conservation Act, the leading role played by government agencies, bilateral agencies and industry associations for energy efficiency promotion, awareness raising.
The success stories of the Indian cement sector in CDM have informed the basis of the proposed “Cement Sector Program” launched by the Work Bank’s Carbon Finance Assist Programme to better understand the CDM projects barriers in the Sub-Saharan Africa cement sector. Through this sectoral study, the CF-Assist aims at facilitating experience and best practices sharing from India to support the private sector overcoming these barriers in the Sub-Saharan Africa cement industry.
Part 3 is related to the assessment of barriers impeding the development of CDM projects in Sub-Saharan Africa, except South-Africa which is the most skilled country of the continent with regard to CDM. The barriers analysis in the specific context of Africa and the parallel between Indian and SSA cement industries provide the framework for drawing recommendations to support CDM promotion in the target sector in Africa.
Part 4 presents the assessment of CDM opportunities in cement plants on country and regional basis. Four types of possible projects are assessed: waste heat recovery and use, fuel switching or substitution, increasing the blend of additives and energy efficiency. The assessment deals with highly aggregated data and posits some assumptions described in section 4.4. The results represent maximum technical potential of CDM projects and don’t include specific conditions in each country.
Part 5 is dedicated to practical recommendations: Capacity building and awareness of cement facility managers are among the concrete solutions suggested by the study. Building the capacity of this energy intensive sector, thus enabling enhanced participation of the African private sector in CDM, is a quite innovative approach adopted to be implemented within CF-Assist program. This initiative stems from the decision made recently by the United Nations through the Nairobi Framework to foster Africa’s participation in the CDM.

World Bank/CF Assist Cement Sector Program in SSA: Barriers Analysis to CDM and Solutions
Final Report
Econoler International vii (REF: # 5430)
The study team we would like to address his warmest thanks to all CF-Assist staff for the opportunity offered to Africa experts to conduct an in-depth analysis of barriers and make recommendations that will, in term, allow Africa to turn its weakness into strength, with regards to the global carbon market based on best practices and lessons from Indian approach.
We would particularly thank the World Bank peer review committee members: Michel Folliet (IFC), Georges Zahar (IFC), Venkata Putti (WBI CF Assist), Nadine Dulac (WBI CF Assist), Alexandra Le Courtois (WB AFR), Lasse Ringius (WB ENVCF), Felix Dayo (Consultant).
We are also grateful to the participating Cement Plants and other stakeholders met in Africa for their time, information sharing and insights. The valuable contribution of the following companies needs to be highlighted: Lafarge France, Lafarge Group’s Cement Plants in SSA (SCB-Lafarge - Benin, WAPCO - Nigeria, CIMENCAM - Cameroon, Bamburi - Kenya, Hima Cement - Uganda, Mbeya Cement - Tanzania), DANGOTE Cement (Nigeria), WACEM and CIMTOGO (Togo), SOCIM, SCA and SOCIMAT (Cote d’Ivoire), SOCOCIM and Les Ciments du Sahel (Senegal), CINAT and CILU (DR Congo), EAPCC, and Athi River Mining (Kenya), Tanga Cement and TPCC (Tanzania), Tororo Cement (Uganda), Ture Dire Dawa Cement and Midroc Debra (Ethiopia), Manufacturers Association of Nigeria.
Special thanks to the Indian Cement industry, Associations, Government agencies and CDM consultants for their time and their inputs, especially: Bureau of Energy Efficiency, NPC, NCBM, CMA, FICICI, CII, TERI, GTZ Carbon procurement Unit, and other stakeholders that contributed directly or indirectly to this study.

World Bank/CF Assist Cement Sector Program in SSA: Barriers Analysis to CDM and Solutions
Final Report
Econoler International viii (REF: # 5430)
EXECUTIVE SUMMARY
RATIONALE FOR THE STUDY
Worldwide, the cement industry is one of the most energy intensive sector in which energy represents 20 to 40% of the total production costs and also a significant source of greenhouse gas, accounting for about 5% of the annual global anthropogenic carbon dioxide emissions - representing 1,800 million tonnes of CO2 emissions in 2005 from the use of fossil fuels and chemical reaction during clinker processing. The average CO2 intensity ranges from 0.65 to 0.92 tCO2 per tonne of cement across countries with a weighted average 0.83 tCO2/t1.
In order to increase the sector growth in a sustainable way, the global cement industry has initiated many actions through organizations like the Cement Sustainable Initiative (CSI) of the World Business Council for Sustainable Development (WBCSD). The cement industry is also playing an active role in the Kyoto Protocol, particularly in the Clean Development Mechanism (CDM) to cut down sectoral greenhouse gas emissions.
To date, about 4% of the 1,300 CDM projects registered worldwide are from the cement sector. India has succeeded in registering the largest number of projects developed by the cement sector with 25 projects (48%) out of 52 followed by China with 17 projects (33%)2. The review of CDM projects pipeline shows that only 28 (2.1%) of the registered CDM projects are located in the African continent and no project has been registered so far, except the Tétouan wind farm project developed by Lafarge Cement Plant in Morocco.
Even if there seems to be a positive trend with 38 projects out of 90 submitted in 2008 in the African CDM and three projects developed by the African cement industry, the continent is still misrepresented.
To enhance Africa’s participation in CDM, the international community initiated several actions and programs to overcome the main barriers that prevent the continent from benefiting from the carbon market. In this perspective, the World Bank has launched the Carbon Finance Africa Assist program that supported institutional and technical capacity building, project development and sectoral assessment at global, regional and national levels.
As part of the sectoral assessment, CF Assist initiated this study in the Sub-Saharan Africa (SSA) cement sector to inform cement plant managers and carbon market players on the opportunities of developing CDM projects within the cement industry in SSA as an interesting and necessary trade-off between clean technologies, emissions reduction and profitability of cement plant operations.
1 International Energy Agency 2007, Tracking Industrial Energy Efficiency and CO2 Emissions 2 UNEP, 2009. CDM Pipeline, January 1, 2009.

World Bank/CF Assist Cement Sector Program in SSA: Barriers Analysis to CDM and Solutions
Final Report
Econoler International ix (REF: # 5430)
METHODOLOGY OF THE STUDY
The main objective of this assessment was to identify the barriers project developers in the SSA cement industry (excluding South Africa) encountered and develop recommendations to address them based on lessons learnt from the Indian cement sector which succeeded in registering the largest number of projects. The study also looked at all existing project proposals and identified new opportunities in four main areas for CO2 emissions reduction: energy efficiency, waste heat recovery, fuel switch with biomass, and clinker substitution with alternative raw materials. Finally, the study identified CDM opportunities and developed on eligible CDM project in the cement sector in SSA.
The approach used during this study was designed on intensive field works through in-person and telephone consultations with cement industry key players in African selected countries based on the location of major cement facilities as well as in India to learn from their experiences. Overall, more than 28 cement facilities and industry associations were visited and interviewed in 12 SSA countries including Ethiopia, Uganda, Kenya, and Tanzania (East Africa), Nigeria, Niger, Togo, Benin, Côte d’Ivoire and Senegal (West Africa), Cameroon and DR Congo (Central Africa). In India, 19 key stakeholders from cement plants, industry associations, consultants and bilateral agencies were consulted. This was done through intensive ground activities by the study team and the six national consultants who took part in the study.
Moreover, the study’s inputs from CF Assist team and from organizations such as the Cement Sustainable Initiative, the World Bank Group’s International Finance Corporation (IFC), international consultants involved in CDM in Africa. An intensive desk review of cement sector reference documents was undertaken to generate secondary data including a review of the actual database on cement production and consumption in the world.
Finally, the study assessed CDM project opportunities in the African cement sector. The assessment was based on field findings, literature reviews and exchanges with key stakeholders interested in CDM project development in the SSA cement industry.
COMPARISON BETWEEN INDIAN AND SSA CEMENT INDUSTRIES
According to the 2007 Global Cement Report of the International Cement Review (IRC), there were about 1,826 integrated cement production facilities and 421 grinding units recorded worldwide3 as of end of 2006. The total combined cement capacity was about 2,380 million tonnes per annum (Mtpa) (compared to 594 Mtpa in 1970). IRC projected the global demand at 2,557 Mtpa in 2006 with an annual average growth of cement consumption at 8.6% during 2004 and 2006. The major part of the growth is driven by developing countries, especially in China with 47% of the demand. India ranks second with 6% of the demand followed by the USA with 5% of the global cement demand.
3 IRC, Global Cement Report, 2007. 7th Edition. http://www.cemnet.com/publications/GlobalCementReport/default.aspx
World Bank/CF Assist Cement Sector Program in SSA: Barriers Analysis to CDM and Solutions
Final Report
Econoler International x (REF: # 5430)
Highlights of Indian Cement Industry
Market Players
The majority of cement plants are owned by the private sector at 97 percent. The top two groups in the industry, the Aditya Birla Group and Holcim Group, now control more than 40 percent of the total capacity in the country. In addition, more than a quarter of the total capacity is now controlled by global major groups. Over the last decade, four of the top five cement companies in the world entered India through mergers, acquisitions, joint ventures or new cement plants. These included Lafarge (France), Holcim (Switzerland), the Italcementi Group (Italy) and Heidelberg Cement (Germany). While Lafarge is investing over USD 500 million in India to expand its capacity by six million tonnes, Italcementi Group intends to invest USD 174 million over the next two years in various greenfield and acquisition projects4 and Holcim has a plan to invest about USD 2.49 billion in the next five years to set up plants and raise capacity by 25 Mtpa in the country.
Cement Production and Consumption
India is the world’s second largest cement producer and consumer after China with an industry capacity of around 210 Mtpa in 2008 (compared to 171 Mtpa in 2006). The production was about 174 Mt in 2008 (155 Mt in 2007).With the boost given by the government to various infrastructures, roads and housing, the installed capacity is expected to increase to 241 Mtpa by end FY 20105. India's cement industry is likely to maintain an annual growth of 10 percent in the coming years with higher domestic demand resulting in increased capacity utilisation.
Industry Associations
The Indian industry in general is supported by organizations that defend the interests of the industry, provide assistance and technical advice and raise awareness about eco-friendly packaging. These organizations have created a dynamic for clean technologies in the Indian cement industry. As an example, the Cement Manufacturers’ Association (CMA) offers dynamic online benchmarking to its nearly 55 cement companies owning 126 cement plant members through its website manual benchmarking against international data, reporting on energy consumption, reporting on the productivity of the workforce and machinery and statistical analysis reports. The Confederation of Indian Industry (CII) prepared an Investors Manual for Energy Efficiency in 2004 in which various energy saving opportunities in the cement sector are covered extensively.
Energy Consumption
Continuous technological upgrading and assimilation of latest technologies have been going on in the cement industry. In 2008, 98% of the plants used dry process technology compared to 6% in 1960.
4 Equity Research Report by ICICI, April 2008
5 ICRA Industry Monito

World Bank/CF Assist Cement Sector Program in SSA: Barriers Analysis to CDM and Solutions
Final Report
Econoler International xi (REF: # 5430)
The induction of advanced technology has helped the industry immensely to conserve energy and fuel and to substantially save materials.
Based on a study of recently established cement plants, the target energy consumption of a new cement plant could be as low as: i) specific electrical energy consumption: 75 units/tonne of OPC – 43; ii) specific thermal energy consumption: 715 kCal/kg of clinker6. The best energy performance in the Indian cement industry was established in 2006 at 663 kcal/kg of clinker and 63 kWh/tonne of cement.
Highlight of SSA’s Cement Industry
The challenging work in this study was to generate reliable and updated statistics from the SSA cement sector where there is a real lack of publicly available data. Several sources are used to build the necessary data to understand the market.
Market Players
Until 2007, the SSA cement market was dominated by the world’s top three cement manufacturers, namely: Lafarge (France), Heidelberg Cement (Germany) and Holcim (Switzerland) with respectively 15, 11 and 7 cement facilities in the continent. However, in 2007 Holcim sold major parts of its equity shareholding of Holcim (South Africa) and Tanga Cement (Tanzania) to AfriSam. Heidelberg sold in 2007 and early 2008 all its cement plants in Nigeria (Sokoto and Edo cement) to Nigeria’s Damnaz Cement and its cement terminal to Dangote Cement. As part of SSA cement sector restructuration Dangote Group (Nigeria) entered the market with two cement facilities and two terminals in Nigeria. The total capacity of Dangote’s Cement operations is around 11 million tonnes (capacity of 7 Mt per annum for plants and 4 Mt for terminals).
The increasing demand driven by the infrastructure and housing sectors is boosting investments in new production lines, retrofit old plants and expansion of production capacity. Lafarge is increasing its production capacity by 1 Mt in South Africa, 750,000 tonnes in Zambia and 480,000 in Uganda, by 600,000 tonnes in its grinding plant in Cameroon while considering a 4-million tonne capacity expansion project in Nigeria7. After having increased its Obajana Cement plant to 4.4 million tonnes a year8 through an investment of USD 75 million by IFC, Dangote Cement signed an agreement of USD 1.6 billion with China’s Sinoma to build six cement production lines in Nigeria. Other companies are also investing in the sector.
Cement Production and Consumption in SSA
Based on the Global Cement Report, IFC estimated the total consumption of cement at 60.6 Mt and the production capacity of SSA cement plants (including South Africa) at 56.3 Mtpa (42 Mtpa
6 CII, Investors Manual for Energy Efficiency, 2004 7 Lafarge in Kenya and Uganda: a sustainable commitment. Press kit, October 2007. 8http://www.ifc.org/ifcext/africa.nsf/Content/PressReleases

World Bank/CF Assist Cement Sector Program in SSA: Barriers Analysis to CDM and Solutions
Final Report
Econoler International xii (REF: # 5430)
integrated cement plants plus 14.3 Mtpa cement grinding plants). Without South Africa, the installed cement capacity in the rest of SSA is 41.6 Mtpa. The relatively completed recent data available was gathered from 2006 US Geological Survey (USGS)9. According to USGS data, the total installed capacity in 2004 was about 45 million tonnes for approximately 75 plants throughout the SSA continent, including South Africa. The breakdown by region is summarized in the following table.
Breakdown of Cement Plants and Installed Capacity in SSA
Number of Plants
Production Capacity (tonnes of cement)
Actual Production (tonnes of cement)
Capacity Utilization
West Africa 29 19,241,000 8,779,130 46% Central Africa 11 3,613,000 1,720,000 48% East Africa 29 8,954,000 6,768,110 76% Southern Africa 6 13,145,000 12,348,000 94% Total 75 44,953,000 29,615,240 66%
Most of the cement facilities are located in West and East Africa with 29 cement works each. The Central Africa region has 11 cement plants followed by South Africa with 6 cement production units. The majority of the cement plants is located in Ghana, Nigeria, Senegal, Ethiopia, Kenya, Tanzania, Zimbabwe and South Africa. In West Africa, the industry is driven by Nigeria with 9 plants for an installed capacity of 9.75 Mtpa (around 51% of the region’s production capacity). In East Africa, Kenya is the leading country with a production capacity of 2.75 Mt. In Central Africa, Cameroon is the major cement producer with a production capacity estimated at 1.2 Mt in 2004. The total cement produced in 2004 was around 17.3 Mt (excluding South Africa). West Africa’s production represented 51% of the total cement produced, followed by East Africa with 39%. Central Africa lagged behind with only 10 percent. In West Africa, the production was driven by Ghana, Nigeria and Senegal with approximately 2.1 million tonnes each in 2004.
The capacity utilization observed in SSA’s cement plants is very low. The average capacity utilization is 54% excluding South Africa as compared to the benchmark of 80% or 94% in India and South Africa. There are significant variations between regions whereas the percentages are 76% in East Africa, 48% in Central Africa and 46% in West Africa where the capacity utilization in Nigeria is as low as 22 percent.
SSA has the lowest per capita cement consumption in the world, averaging at 70 kg, while the world average is currently 340 kg per capita and 140 kg in India10. In 2006, the market growth was estimated at 9.4% for the continent as compared to the global growth of 8.6 percent. The increasing cement demand, the low capacity utilization and the limited production capacity have resulted in the dependency of the continent from imported cement, particularly in countries where the demand is high. For instance, in 2006, Nigeria’s cement market was about 10 million with only 3.7 million tonnes produced locally. The imported cement share represented around 65% of the total market.
9 U.S. Geological Survey Open-File Report 2006-1135http://pubs.usgs.gov/of/2006/1135/index.html 10 Lafarge, 2007
World Bank/CF Assist Cement Sector Program in SSA: Barriers Analysis to CDM and Solutions
Final Report
Econoler International xiii (REF: # 5430)
Energy Consumption
The share of wet process in the African cement industry was estimated at 66% in a 2002 publication by WBCSD. Wet process and semi-dry process represented respectively 24% and 9%11.
The energy performance of most existing cement manufacturing plants in Africa is low when compared to the average in India, which is about 760 kcal/kg of clinker and 85 kWh/tonne of cement. Based on data collected during this study, the specific electrical energy consumption in some plants in East and Central Africa cement plants varied between 105 and 140 kWh/tonne of cement and the specific thermal energy consumption was between 800 to 1,000 kcal/kg of clinker.
Industry Associations
The only regional cement producers association in SSA (excluding Southern Africa) is the East Africa Cement Producers Association (EACPA) formed by seven cement manufacturing companies from Kenya, Uganda and Tanzania: Mbeya Cement and Tanga Cement Company of Tanzania, Hima Cement Limited and Uganda’s Tororo Cement Limited and Athi River Mining Limited, Bamburi Cement Limited and Kenya’s East African Portland Cement Limited. At the national level, a cement manufacturer association (CMAN) is constituted in Nigeria under the Manufacturers Association of Nigeria (MAN), a national industrial association serving and representing nearly 2,000 companies in the private and public manufacturing, construction and service sectors of the national economy. MAN offers jointly with Rosebank Consulting training in the areas of environmental management and sustainable development.
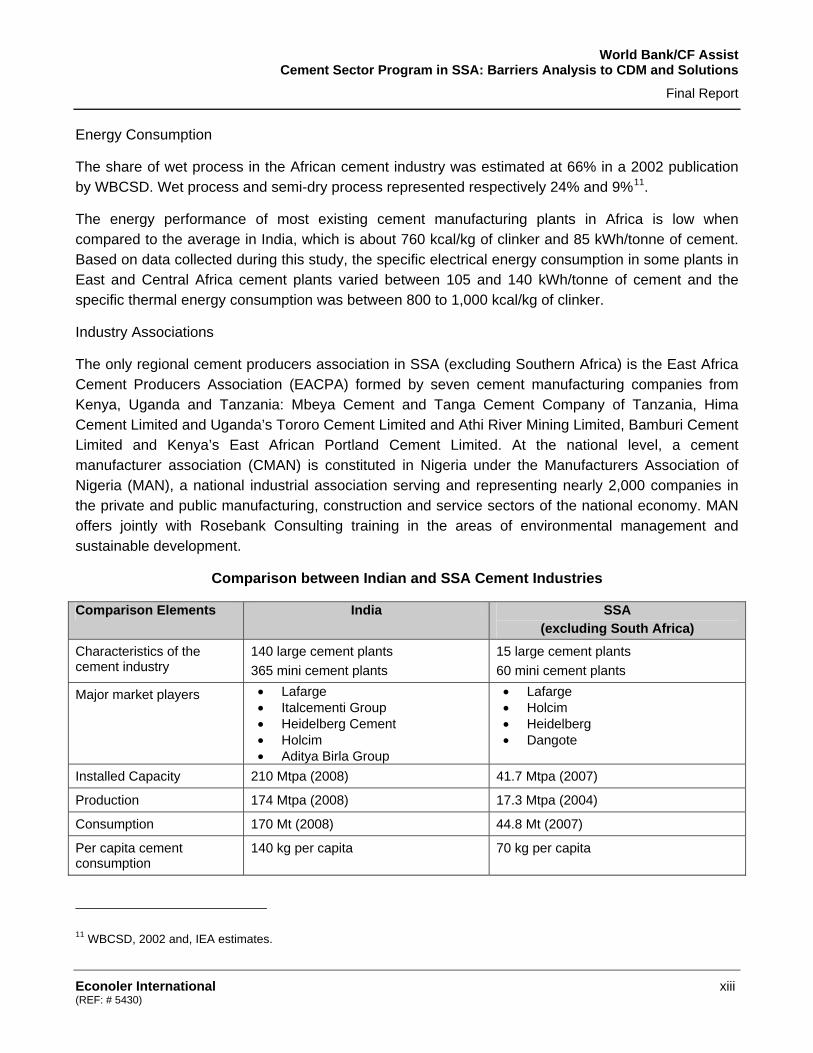
Comparison between Indian and SSA Cement Industries
Comparison Elements India SSA (excluding South Africa)
Characteristics of the cement industry
140 large cement plants 365 mini cement plants
15 large cement plants 60 mini cement plants
Major market players • Lafarge • Italcementi Group • Heidelberg Cement • Holcim • Aditya Birla Group
• Lafarge • Holcim • Heidelberg • Dangote
Installed Capacity 210 Mtpa (2008) 41.7 Mtpa (2007)
Production 174 Mtpa (2008) 17.3 Mtpa (2004)
Consumption 170 Mt (2008) 44.8 Mt (2007)
Per capita cement consumption
140 kg per capita 70 kg per capita
11 WBCSD, 2002 and, IEA estimates.

World Bank/CF Assist Cement Sector Program in SSA: Barriers Analysis to CDM and Solutions
Final Report
Econoler International xiv (REF: # 5430)
Comparison Elements India SSA (excluding South Africa)
Capacity Utilization 94% (2008) 54% (2008)
Annual Growth Rate 10% (2007) 9.4% (2007)
Price of Cement USD 5.50 (per bag of 50 kg) USD 8.4 – 15.6 (per bag of 50 kg)
Process types 98% dry process (2008) 66% dry process (WBCSD, 2002)
Thermal energy use 760 kcal/kg of clinker 800-1000 kcal/kg of clinker
Electrical energy use 85 kWh/t of cement 105 – 140 kWh/t of cement
DRAWING LESSONS FROM THE INDIAN CEMENT SECTOR SUCCESS STORIES IN CDM
Indian Cement Sector CDM Projects Portfolio
India’s dominance in carbon trading under CDM is beginning to influence the business dynamics of the country in various sectors. Indian industries have started adopting cleaner, sustainable technologies that, so far, have earned corporate Indians USD 341 million in 2007 just by selling carbon credits to parties based in developed countries (Annex I countries) as per CII estimates.
As of January 1, 2009, two hundred and three projects have been submitted worldwide in the cement sector for CDM registration. Out of this number of projects submitted to the UNFCCC, 110 projects (54%) were developed in China, whereas 49 projects (24%) were hosted by India. In 2008 only, 33 projects were submitted for registration; the majority from China (24 projects). A total of 52 CDM projects from the global cement industry have been registered; 25 projects (48%) were developed by the Indian cement industry and 33% in China12.
The majority of registered projects in India were related to blended cement (ACM005) with 13 projects, four had to do with the substitution of fossil fuels (ACM003), four with the heat recovery (AM0024 and ACM0004) and four were associated to energy efficiency (two for EE through upgrading preheaters and two for improved EE through clinker coolers (AMS II.D). At the same time, six CDM projects submitted by the Indian cement industry were rejected by the CDM Executive Board: four were about blended cement (ACM0005), two were on energy efficiency (AMS II.D) and one was on power generation from waste heat (ACM0004). The reasons for rejection are: i) failure to demonstrate additionality of the blended cement above the level of common practice in India for ACM0005; ii) lack of metering of energy use by the industrial facility (AMS II.D); iii) size limit for bundling small scale projects (AMS II.D).
About 20 of the largest Indian cement companies have applied for CDM projects; including the Aditya Birla Group, Orient Cement; Binani Cement; Shree Cements; ACC; India Cements; Gujarat Ambuja; Lafarge. 12 UNEP, 2009. CDM Pipeline, January 1, 2009.

World Bank/CF Assist Cement Sector Program in SSA: Barriers Analysis to CDM and Solutions
Final Report
Econoler International xv (REF: # 5430)
The variation in the number of CDM projects over time indicates that a large number of PDDs were completed in 2005 and 2006. Only one was submitted to UNFCCC in 2008. Twenty-four projects were submitted in 2005; 17 in 2006; 7 in 2007 and only 1 in 2008 out of 38 projects posted on UNFCCC’s website.
Many of the Indian CDM projects registered were unilateral: no Annex I party was involved in these projects and CERs were issued to the national registry of India. Most of the project developers were large corporate entities that could put together the project financing on their own and wait for CERs to be issued and traded later at more favorable prices rather than sell them upfront at lower prices.
Main Lessons Drawn from India’s Cement Industry
The Energy Conservation Act 2001 has been the catalyst of energy efficiency in India. The Bureau of Energy Efficiency created under this Act identified cement companies as energy intensive industries and designated energy consumers, requiring them to report periodically on their energy consumption and efficiency levels.
Government agencies (BEE, NCBM, NPC, etc.) and industry associations such as the CII and CMA have mainly promoted energy efficiency with data for benchmarking as a mean to reduce production costs and to cope with energy shortages and coal availability constraints. They have increased awareness on CDM sector opportunities, but have not specifically facilitated any CDM project in the sector. The need to be globally competitive and the pioneer CDM projects could be considered as the other general factors that have influenced the Indian cement industry to develop CDM projects.
The GTZ through the Indo German energy efficiency program has also supported energy efficiency initiatives and CDM in India.
Besides, the success of CDM in India could be partly attributed to the role of well-trained and qualified CDM experts that enable projects development, data collection, play interface between international consultants and carbon credit buyers and project participants.
The main barriers encountered in CDM project development are technological, marketing and financial. Technological barriers rely on the lack of knowledge on clean technology, aversion to unfamiliar technologies like waste heat recovery (WHR), high investment costs of WHR projects. Marketing barriers are observed in blended cement projects where customers have bad perceptions about the Government’s Central Public Works Department ban on the use of Pozzolona Portland Cement (PPC) on bridges. Financial barriers are related to transaction costs and the risk of project rejection.
Mitigation solutions were: demonstration projects for waste heat recovery by NEDO (Japan), benchmarking efforts by CMA, indigenous development of technology, strong R&D for use of blended cement and marketing to promote blended cement.
World Bank/CF Assist Cement Sector Program in SSA: Barriers Analysis to CDM and Solutions
Final Report
Econoler International xvi (REF: # 5430)
Regarding the rejection of blended cement projects by the CDM Executive Board, the reason is that the Designated Operational Entity (DOE) and the project participant failed to substantiate significant and additional technological and market acceptability barriers to increase the level of additives in the production of blended cement above the level of common practice in the country. It is unlikely that more projects will be developed under ACM0005 mainly due to difficulties in establishing the baseline as blended cement is popular now in India.
CDM PROJECTS IN THE SSA CEMENT SECTOR
Presentation of CDM General Portfolio
The primary global CDM transactions represented USD 7.4 billion in 2007 for a transacted volume of 551 MtCO2e. Africa ranks fourth on the transaction market with 5% of the market. Projects in Africa have been contracted to supply about 50 MtCO2e to the market so far, with more than 20MtCO2e transacted in 2007 alone.
The SSA’s participation in the CDM is very weak when compared to the similar regions of Latin America and Asia. Out of 4,367 projects developed under CDM as of January 1, 200913, only 90 (2%) are located in Africa. This represents a volume of about 19 million tCO2 per year. Out of the 1,300 projects registered worldwide, 28 are in Africa and only 4 are at the CER issuance stage. The registered volume represents 7 million tonnes of CO2; only 2.9% of the total volume registered worldwide.
Renewable energy (hydro, geothermal, wind, solar, tidal) accounts for the majority of the projects (40%) developed in Africa to date. Landfill projects follow with a 23% share of the pipeline. Energy efficiency and fuel switching projects respectively account for 13 and 8 percent.
The breakdown of registered projects shows that among the 28 projects registered as of January 2009, South Africa owns 14, while Morocco owns 4, Egypt: 4 and Tunisia: 2; the remaining three countries (Nigeria, Tanzania and Uganda) have 1 project each. It should be noted that only four registered projects are located in SSA, excluding South Africa, and that the share of SSA francophone countries is nil.
Two interesting lessons can be drawn from the CDM pipeline. The first is the increase observed in the trend of CDM project development in Africa. The number of projects per annum has increased from 2 projects in 2004 to 38 in 2008. The second interesting fact is that new countries have joined the list of those that have submitted projects for registration. Most of these new countries are francophone: Democratic Republic of Congo, Mali, Senegal, Madagascar, and Côte d’Ivoire.
CDM Projects in SSA Cement Sector
13 UNEP, 2009. CDM Pipeline, January 1, 2009.

World Bank/CF Assist Cement Sector Program in SSA: Barriers Analysis to CDM and Solutions
Final Report
Econoler International xvii (REF: # 5430)
Three CDM projects developed by cement plants located in Africa have been recently submitted for registration. SOCOCIM, a subsidiary of Vicat in Senegal, has developed a fuel switching project using Jatropha plantations and biomass residues. WAPCO, a Lafarge operation in Nigeria, has initiated a blended cement project in its Shagamu Cement and Ewekoro Cement Plants. CEMEX Assuit Cement in Egypt has requested the registration of a partial substitution of fossil fuels by renewable plantation biomass and biomass residues.
OPPORTUNITIES FOR CDM PROJECT DEVELOPMENT IN THE SSA CEMENT INDUSTRY
Type of Projects
Cement manufacturing is energy and GHG emissions intensive. GHG emissions can be dramatically decreased through low emission cement processing as well as reducing the energy input or energy source. CDM possibilities pertain more or less to the different phases of the whole manufacturing process. Four types of possible projects are assessed in this study: waste heat recovery and use, fuel switching or substitution, increasing the blend of additives and energy efficiency.
Type of CDM Projects in Cement Plants and Opportunities
Type of Projects Applicable Approved
Methodologies
Description of Applicable Technologies
Opportunities
Waste Heat Recovery
AM0024 ACM0012 ACM0004 AMS III.Q
Capture waste heat currently vented at pre-calciner and/or at the cooler end of kiln to preheat raw materials and fuel at the existing plant or for electricity generation using heat recovery boilers and generation units.
Interesting, especially in a context where energy cost is high and supply is unreliable 1 MW results in reduction of 5000 tonnes of CO2/ annum CO2 abatement cost USD 15 to 50/tCO2:
Alternative fuels ACM0003 ACM0002 AM0049 AMS I.D
In less resource-intensive processes such as grinding, electricity can be provided by renewable sources rather than by conventional fuel oil generation. In pyro-processing, fuel can be partly replaced by alternative fuels such as gas or unconventional mass (tires, plastics, textiles, or rubber, etc.)
Potential for substituting small percentages of fossil fuel by biomass Use of solid wastes, waste tires, non hazardous industrial waste, sludges CO2 abatement cost Biomass residues: USD 4/tCO2 Biomass plantation: USD 12/tCO2
Changing Blending/mix of cement
ACM0005 Blended cement is produced by increasing the proportion of additives, such as limestone, pozzolana and fly ash in the fine grinding process, thereby reducing the clinker content.
1 tonne of PPC reduces gross CO2 emission by 20% 1 tonne of PSC reduces CO2 emissions by 45% CO2 abatement cost USD 4.38 to 6.24/tCO2

World Bank/CF Assist Cement Sector Program in SSA: Barriers Analysis to CDM and Solutions
Final Report
Econoler International xviii (REF: # 5430)
Type of Projects Applicable Approved
Methodologies
Description of Applicable Technologies
Opportunities
Energy Efficiency AMS II.D Multi-technology options including: upgradation of preheater, upgrading a clinker cooler, optimization in grinding media, automatic control, variable speed drives efficient motors, etc.
Directly or indirectly reduces the consumption of fossil fuels CO2 abatement cost USD 24/tCO2 (for preheater upgradation)
The previous table shows that the lowest CO2 abatement costs are in blended cement projects and fuel substitution by biomass.
The study analyses the potential of CO2 emissions reduction in cement plants on country and regional basis. The assessment deals with highly aggregated data and posits some assumptions described in section 4.4. Caution should thus be used when interpreting these results; they represent a maximum technical possibility of CDM projects and do not include specific conditions in each country and cross-effects. Detailed tables by type of projects are presented in section 4.4. The summary shown in the following table excludes South Africa.
Technical Potential for Emissions Reduction in SSA Cement Plants
Type of Projects Number of Projects
Emissions Reduction Potential (tCO2/year)
Initial Investment (USD million)
Thermal energy efficiency 35 1,073,419 Abatement cost of USD 24/tCO2 for
preheater upgradation Electric energy efficiency 49 319,028 N/A Waste heat recovery 35 2,123,349 323.4 Alternative fuels (biomass) 35 2,393,226 536.1 Blended cement 44 2,910,149 127.32
Energy Efficiency Projects
The scope of energy efficiency projects in the cement industry is very large. It encompasses system upgradation, specific technologies such as variable speed drives, motors, compressed air, ventilators as well as process control and energy management system. The study team found out that almost all contacted cement plants have not carried out recent detailed energy audits.
The potential of energy savings distinguishes thermal savings and electricity savings using average specific energy consumption and a target. Thus, thermal energy is reduced from 950 to 750 kcal/kg of clinker for integrated cement plants only and electricity is cut down from 120 to 90 kWh/t of cement for all units.
The potential for kiln fuel savings is deemed to be in the range of 12.5 million giga joules per year from 35 clinker production units across 17 countries in SSA (excluding South Africa). This represents

World Bank/CF Assist Cement Sector Program in SSA: Barriers Analysis to CDM and Solutions
Final Report
Econoler International xix (REF: # 5430)
annually 553,000 tonnes of coal or 345,000 tonnes of heavy fuel oil savings. The equivalent CO2 emissions reductions could amount to 1 million tCO2 distributed mainly in West Africa (46%) and East Africa (42%) with a potential majority in Nigeria, Senegal, Ethiopia, Kenya and Tanzania.
The results of electricity savings and the related GHG emissions reductions in selected SSA countries’ cement plants cover integrated plants and grinding units. It clearly appears that when taken in CDM perspective emissions reductions potential is very low or insignificant in some countries. This is due to the low emission factor accounting for hydro-based electricity generation in many countries. The total electricity savings potential is about 646 GWh/year and GHG emissions reduction is estimated at 319,000 tonnes.
The estimated energy savings potential seems to be significant in the SSA cement industry, especially in the socio-economical context of the continent where most of the population does not have access to electricity. At the industry level, energy efficiency projects could be motivated by production costs reduction as energy is one of the most expensive inputs for cement manufacturing.
Waste Heat Recovery Projects
Based on a few assumptions and regional and actual cement production, the technical potential of the total annual emissions reduction was derived.
The theoretical potential of CO2 emissions reductions through WHR projects represents 2.1 million tCO2e per annum. The total investment required was based on the De Gouvello et al. 14 figures and estimated at USD 323.4 million. The previous table on “Type of CDM Projects in Cement Plants and Opportunities” shows that waste heat recovery project for power generation has a high CO2 abatement cost ranging from USD 15-50/tCO2 depending on the size of the project and other factors.
The regional figures indicate that efforts should be particularly directed towards major cement producing countries such as Nigeria, Senegal and Togo in West Africa and Ethiopia, Kenya, Tanzania in East Africa. In Central Africa, only Angola is offering interesting opportunities.
Alternative Fuels and Fuels Switching
The study team assessed CO2 emissions reduction potential in SSA cement industry based on key parameters determined from the SOCOCIM partial coal substitution project in Senegal. The alternative fuels are biomass from jatropha plantations and other biomass residues such as rice husks, cotton shells, cashew nutshells.
The estimate summarized in the above table illustrates that the ER potential for fuel switching from fossil fuels (coal and heavy fuel oil) to biomass. The theoretical ER potential using biomass for clinker
14 Christophe De Gouvello, Felix B. Dayo and Massamba Thioye. 2008. Low-carbon Energy Projects for Development in
Sub-Saharan Africa, Unveiling the Potential, Addressing the Barriers. The International Bank for Reconstruction and Development / The World Bank
World Bank/CF Assist Cement Sector Program in SSA: Barriers Analysis to CDM and Solutions
Final Report
Econoler International xx (REF: # 5430)
calcination is estimated at 4.1 million tCO2e (2.4 million if South Africa is excluded). The investment requirements are estimated around USD 936 million (USD 536.1 million without South Africa). However, these initial investments are estimated on a production ratio basis only. This means that economies of scale are not accounted for. For instance, it is realistic to assume that the marginal cost of additional units of alternative fuel will be decreasing to a certain extent (forming, a “U-shape” relation). It is also realistic to assume that transaction costs might be reduced after a demand-driven alternative fuel distribution capacity or network has been put in place.
It should be noted that sources of alternative fuels can also be tire, plastic, wasted oil, etc. Each project will need to assess the potential of alternative fuels present in the surroundings of the cement plant, the availability of the resources and the alternative use in the country. As many of SSA countries have vast lands, dedicated energy plantations (jatropha, casurina trees or other species) could be an interesting solution for biomass supply issues as it is being done in Senegal and Egypt.
Blended Cement
Developing blended cement (BC) projects as a CDM project will require setting up a baseline and demonstrating that the proposed project scenario is additional.
This study did not carry out a detailed estimate of Ordinary Portland Cement (OPC) production in the 75 cement manufacturing facilities recorded. According to the study conducted by De Gouvello et al., implementing blended cement projects by increasing the share of additives by 20% in SSA (including South Africa) can result in 44 projects in OPC production plants spread over the continent.
The results of the analysis showed that 44 blended cement CDM projects could be developed in 24 countries using the ACM0005 methodology. When packaged, these projects would yield a total emissions reduction of 2.9 million tCO2 per annum representing 0.105 tCO2 per tonne of cement produced. An estimated USD 127 million would be needed to implement these projects leading to a cost of USD 4.38 per tonne of CO2 reduced over a 10-year period.
BARRIERS TO CDM IN THE AFRICAN CEMENT SECTOR
The barriers to CDM project development in the African context have been intensively treated by various studies and experts. Commonly discussed barriers include, among other things, i) the high transaction costs of project development; ii) the lack of favorable business environment and policy framework; iii) the limited access to finance by potential developers; iv) the financial intermediaries’ lack of knowledge about the CDM; v) the lack of trained local CDM consultants; vi) limited budgets for Designated National Authority (DNA) operations.

World Bank/CF Assist Cement Sector Program in SSA: Barriers Analysis to CDM and Solutions
Final Report
Econoler International xxi (REF: # 5430)
These barriers could be very strong and impede the investment to leverage for project development and implementation. In the specific case of the SSA cement sector (excluding South Africa), some of the listed barriers may apply such as the limited awareness of industry decision-makers, the lack of local CDM consultants, the unfavorable investment climate and limited budgets for DNAs (resulting in a lack of assistance to project developers).
In general, it appeared that the CDM was not a priority for the cement units as they were comparatively more preoccupied with capacity expansions and other issues like quality control and cost reduction. The unprecedented demand for cement over the recent years is such that the top management’s attention is focused on capacity expansions, efficient management and quality issues.
Moreover, the high opportunity costs for developing CDM project combined with the risk of project rejection and the high initial capital cost for acquiring clean technologies are perceived by managers to be unnecessary financial burdens on the company when the need is more on capacity increasing with tangible outputs.
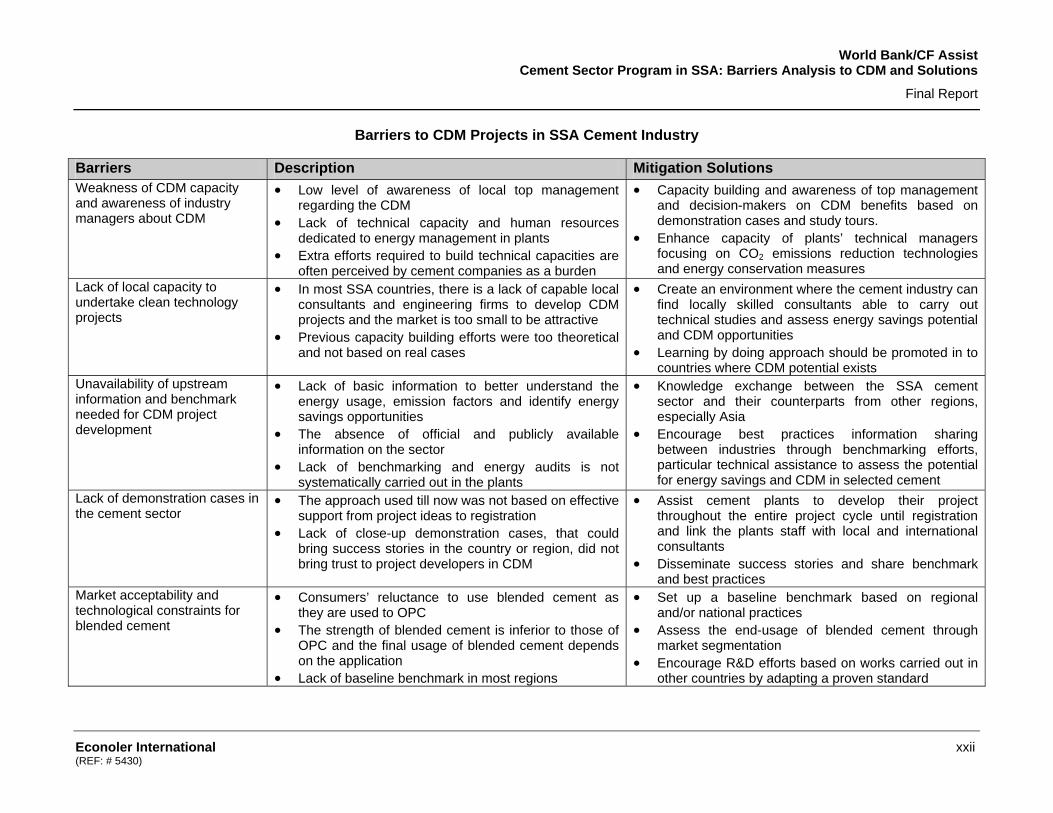
The study captured five main issues that constitute the bottleneck of CDM project development in SSA cement plants. The main findings are summarized in the below table.
World Bank/CF Assist Cement Sector Program in SSA: Barriers Analysis to CDM and Solutions
Final Report
Econoler International xxii (REF: # 5430)
Barriers to CDM Projects in SSA Cement Industry
Barriers Description Mitigation Solutions Weakness of CDM capacity and awareness of industry managers about CDM
• Low level of awareness of local top management regarding the CDM
• Lack of technical capacity and human resources dedicated to energy management in plants
• Extra efforts required to build technical capacities are often perceived by cement companies as a burden
• Capacity building and awareness of top management and decision-makers on CDM benefits based on demonstration cases and study tours.
• Enhance capacity of plants’ technical managers focusing on CO2 emissions reduction technologies and energy conservation measures
Lack of local capacity to undertake clean technology projects
• In most SSA countries, there is a lack of capable local consultants and engineering firms to develop CDM projects and the market is too small to be attractive
• Previous capacity building efforts were too theoretical and not based on real cases
• Create an environment where the cement industry can find locally skilled consultants able to carry out technical studies and assess energy savings potential and CDM opportunities
• Learning by doing approach should be promoted in to countries where CDM potential exists
Unavailability of upstream information and benchmark needed for CDM project development
• Lack of basic information to better understand the energy usage, emission factors and identify energy savings opportunities
• The absence of official and publicly available information on the sector
• Lack of benchmarking and energy audits is not systematically carried out in the plants
• Knowledge exchange between the SSA cement sector and their counterparts from other regions, especially Asia
• Encourage best practices information sharing between industries through benchmarking efforts, particular technical assistance to assess the potential for energy savings and CDM in selected cement
Lack of demonstration cases in the cement sector
• The approach used till now was not based on effective support from project ideas to registration
• Lack of close-up demonstration cases, that could bring success stories in the country or region, did not bring trust to project developers in CDM
• Assist cement plants to develop their project throughout the entire project cycle until registration and link the plants staff with local and international consultants
• Disseminate success stories and share benchmark and best practices
Market acceptability and technological constraints for blended cement
• Consumers’ reluctance to use blended cement as they are used to OPC
• The strength of blended cement is inferior to those of OPC and the final usage of blended cement depends on the application
• Lack of baseline benchmark in most regions
• Set up a baseline benchmark based on regional and/or national practices
• Assess the end-usage of blended cement through market segmentation
• Encourage R&D efforts based on works carried out in other countries by adapting a proven standard

World Bank/CF Assist Cement Sector Program in SSA: Barriers Analysis to CDM and Solutions
Final Report
Econoler International xxiii (REF: 5430)
Parallel between the Indian and SSA Cement Industries
India SSA CDM Project Portfolio
• 49 projects developed • 25 projects registered
• 3 projects at validation • None registered
Organizational Structure
• A huge market at national level • Strong industrial sector and Indian-
owned • Many government and private sector
organizations facilitating CDM projects either directly or indirectly
• Benchmarking efforts by the industry association
• Small country-based market • In general, the industrial sector is weak
with daily operation issues • The industry is dominated by large
conglomerates • Cement retail price are more politically
driven than market based • No dedicated associations for the cement
industry, except in Nigeria with CMAN and East Africa EACPA
• Existing associations have not developed any benchmark
Legal and Institutional Framework
• The Energy Conservation Act and strong awareness and capacity building initiatives and the international mobilization towards a cleaner industrial sector have been the drivers in India
• DNA with strong capacity and financial resources
• Weak legal framework and no action towards energy efficiency
• DNAs failed to promote CDM as the commitment of governments was generally low
CDM Capacities • Steady technical assistance by GTZ under the Indo German Energy Program and other donors
• Strong experiences gained from pioneer efforts
• Top management very responsive to energy conservation and CDM
• Skilled and active local consultants
• Weak experience and demonstration case in CDM
• Low commitment of top manager • Lack of capable local consultants • Lack of practical capacity building based
on a “learning by doing approach”
Technological and Marketing Barriers
• Lack of knowledge about clean technologies
• Aversion to unfamiliar technologies and associated risks
• Active equipment vendors • Customer perceptions about the
government’s ban on the use of PPC on bridges
• Experience in R&D efforts
• Aversion to unfamiliar technologies and associated risks
• Lack of local technologies suppliers • Need assistance for technology transfer • Efforts needed for marketing and R&D
and standards setting up for blended cement
Financial Barriers • Transactions costs and risk of project rejection
• Initially, high investment costs • Some technologies are still
expensive (waste heat recovery)
• High transaction costs • High initial investment costs • CDM is not a priority. Capacity extension
is the main priority
World Bank/CF Assist Cement Sector Program in SSA: Barriers Analysis to CDM and Solutions
Final Report
Econoler International xxiv (REF: 5430)
RECOMMENDATIONS TO BOOST CDM PROJECTS IN SSA CEMENT SECTOR
Effective training activities addressing different issues related to the CDM in SSA still need to be scaled up to reach all the key stakeholders at the national or regional level. Thus, in addition to face-to-face training, institutional capacity strengthening and projects identification, new ways of delivering effective capacity building based on sectoral needs and practical assistance, which is not yet widely practiced in African countries, should be considered. Here are some paths considered by the study team to be relevant in the SSA cement sector.
1. Increase Awareness and Capacity Building
One-on-one meetings with top management would be required to gain acceptance for developing CDM projects. Once a top manager has decided to go ahead with a CDM project, the technical department follows. In this view, it would be helpful to top management representatives and technical managers of African Cement Industry to carry out a study mission in the Indian Cement Industry. The mission could be partly funded by CF Assist and other multilateral and bilateral organizations.
The focus of this mission could be on energy efficiency improvement projects, benchmarking, equipment sourcing and development of CDM projects and meeting with plant managers and industry associations in India.
Awareness should be strengthened, while being focused on the cement sector and on precise countries or regions. Capacity building related to CDM project opportunities in the cement sector should be technology-based (e.g. blended cement, fossil fuel substitution or waste heat recovery from kiln). In regions or countries (ex. East Africa and Nigeria) where there are active industry associations, the actions should build on ongoing awareness and capacity building channels. As an example of ongoing capacity building activities in the national industry, MAN partnered with Rosebank Consulting to offer the Nigerian industry MAN Green courses. These associations could be networked with their counterpart like CII and CMA in India.
2. Develop CDM projects on learning-by-doing approach
Intensive efforts by CDM consultants and EE equipment vendors will also be needed and directed towards the large conglomerates that own or manage the cement plants in SSA. In view of the lukewarm response from the cement units, it is recommended that about 6 CDM projects should be funded to up to UNFCCC registration stage with the active participation of one of the World Bank Carbon Funds. Local consultants and technical staff of cement plants should actively participate in the project cycle.
Based on regional concentration, countries with integrated plants and significant cement production should be targeted. In West Africa, the target countries could be Nigeria, Benin and Togo for waste heat recovery and fuel substitution. Senegal, Ghana and Cote d’Ivoire could be added when blended cement is considered. In East Africa and central Africa, Kenya, Uganda, Tanzania, DR Congo could be selected.

World Bank/CF Assist Cement Sector Program in SSA: Barriers Analysis to CDM and Solutions
Final Report
Econoler International xxv (REF: 5430)
3. Develop basic information for CDM project in the cement sector
The SSA cement sector will need to build basic data that enable energy savings and CDM projects assessment. A starting point could be the sharing of statistics, benchmarking and other knowledge resources relevant to the cement industry (such as the Analysis of the Success of the CDM in the Indian cement industry, Energy Efficiency benchmarking tools developed by the CMA, etc.). Based on the lessons learned from India, it will be important to develop the benchmarks for the SSA cement sector. This will require sustained actions through specific studies listed hereafter:
• Conduct benchmarking study for specific energy consumption and baseline benchmark for blended cement on a regional basis. The possibility for adopting and adapting international standards for blended cement could be also investigated.
• Develop grid emission factors for major countries and regions as in India under GTZ assistance for establishing a CO2 baseline database for the Indian Power Sector or in Tanzania with the grid emission factors developed by UNEP Risoe and CD4CDM.
• Develop and disseminate basic data sheets on financial and economic environment for CDM and success stories based on real projects.
4. Encourage Energy Audits and Promote Energy Management Systems (EMS) within the Cement Plants
Energy efficiency projects can drive CDM projects. Therefore, it is recommended to launch a project to conduct Investment Grade Energy Audits in the African cement industry. Such external Energy Audits need to focus attention on investment and economical analysis (including carbon revenues) of the energy conservation opportunities to facilitate decision-making by the top management. Organizations such as UNIDO, IFC, AFD, GTZ or DANIDA might be interested in such approach.
This action could be integrated in a more global approach in the view of creating energy management systems or establishing energy managers in the SSA cement industry drawing lessons from India.

World Bank/CF Assist Cement Sector Program in SSA: Barriers Analysis to CDM and Solutions
Final Report
Econoler International 1 (REF : # 5430)
INTRODUCTION
The cement industry is one of the most energy intensive industries in which energy represents 20 to 40% of the total production costs. Most of the energy used is in the form of fuel for the production of cement clinker and electricity to grind raw materials and finished cement. Since cement production consumes an average of 4 to 5 GJ per tonne, this industry uses 8 to 10 EJ of energy annually15.
According to the 2007 Global Cement Report of the International Cement Review (ICR), there were about 1,826 integrated cement production facilities and 421 grinding units recorded worldwide16 as of the year-end 2006 with a total combined cement capacity of about 2,380 million tonnes (compared to 594 Mt in 1970). IRC projected the global demand at 2,557 Mt in 2006 with an annual average growth of cement consumption at 8.6% during the period 2004 and 2006. The major part of the growth is driven by developing countries, especially in China with 47% of the demand. India ranks second with 6% of the demand followed by the USA with 5% of the global cement demand.
In Sub-Saharan Africa (SSA), the cement production was estimated at about 26.6 million tonnes in 200317. Using ICR's Global Cement Report 2007 edition, the International Finance Corporation (IFC) estimates that SSA consumed 60.6 Mt of cement in 2007 and had an installed cement capacity of 56.3 Mtpa (42 Mtpa integrated cement plants plus 14.3 Mtpa cement grinding plants). There are approximately 75 cement facilities operating in SSA. The majority of the cement plants are located in Ethiopia, Kenya, Nigeria, Tanzania, Zimbabwe, Senegal and South Africa. There is actually a real need for capacity extension, mainly driven by the infrastructure and housing markets. In 2006, the market growth was estimated at 9.4% for the continent. The tendency among the individual cement producers is to increase their own market share and invest in capacity expansions.
The cement industry is a significant source of greenhouse gases (GHG), accounting for about 5% of the annual global anthropogenic carbon dioxide emissions18, which makes the sector interesting for CO2 emission mitigation options. About half of the emissions are created through the use of fossil fuels and the rest is generated during the calcining process, a chemical reaction resulting from heating limestone. The average CO2 intensity ranges from 0.65 to 0.92 tCO2 per tonne of cement across countries with a weighted average of 0.83 tCO2/t, which represented 1,800 million tonnes of CO2 emissions in 200519.
Several initiatives have been taken by the global cement industry to accommodate businesses and sustainable development. As an example, the Cement Sustainable Initiative (CSI) of the World Business Council for Sustainable Development (WBCSD) has been formed to help the cement industry to address the challenges of sustainable development with the participation of major cement
15 International Energy Agency, 2006. Energy Efficiency and CO2 Emissions from the Global Cement Industry 16 Global Cement Report, 2007. 7th Edition. http://www.cemnet.com/publications/GlobalCementReport/default.aspx 17 Estimate World Bank, Africa Region 2005 18 Howard Klee, (World Business Council on Sustainable Development (WBCSD ) 19 International Energy Agency 2007, Tracking Industrial Energy Efficiency and CO2 Emissions
World Bank/CF Assist Cement Sector Program in SSA: Barriers Analysis to CDM and Solutions
Final Report
Econoler International 2 (REF : # 5430)
companies worldwide. The CSI promotes sustainable development through actions that companies can undertake to accelerate the move towards sustainable development, knowledge, experiences and best practices sharing. The cement industry is also playing an active role in the Kyoto Protocol to cut down the sectorial greenhouse gases emissions, particularly in the Clean Development Mechanism (CDM).
According to the United Nations Framework Conversion on Climate Change (UNFCCC)20, as of January 1, 2009, the total number of CDM projects submitted for registration was 4,364 of which 203 projects (4.7%) were related to cement production and cement facilities operations in developing countries. Out of this number of CDM projects submitted to the UNFCCC, 110 projects (54%) were developed in China, whereas 49 projects (24%) were hosted by India. In 2008 only, 33 projects have been submitted for registration. The majority is from China (24 projects) showing the predominance of the Chinese cement industry in future CDM. However, India has registered the largest number of projects developed by the cement sector. Out of the 52 developed by the cement sector, 25 projects (48%) are located in India and 17 projects (33%) in China.
Technically, registered CDM projects have been developed using several approved methodologies. An overview of the registered projects shows that the most commonly used methodologies are: i) ACM 0005: Displacement of clinker and substitution with fly ash or other additives (27%); ii) ACM 0003: Partial substitution of fossil fuel with alternative energetic materials including biomass byproducts (23%); iii) another group of projects was registered to introduce technologies aimed at capturing the waste heat gas generated in the clinker-making process (i.e. in cement kilns) to produce electricity instead of only venting the waste heat into the atmosphere (ACM 0004 with 32.6%); iv) approved small-scale methodologies, especially AMS-II-D on energy efficiency and fuel switching measures for industrial plants, AMS-III-B on switching fossil fuel and AMS-I-D.
Africa, in general, and Sub-Saharan Africa in particular (excluding South Africa) is under-represented in the CDM and the cement sector is no exception. The continent has registered only 28 CDM projects (2.1%) out of 1300 projects registered worldwide. No project is registered so far, except the Tétouan wind farm project developed by Lafarge Cement Plant in Morocco. This negative pattern seems to improve with three new projects submitted for registration in mid-2008: i) a bundled blended cement projects in two plants owned by WAPCO in Nigeria, ii) the jatropha plantation and biomass residues for partial substitution of coal in the SOCOCIM plant in Senegal and iii) biomass and biomass residues used as alternative fuels in a CEMEX plant in Egypt. Two other projects are under development at the Lafarge cement plants in Mombassa (Kenya) and Hima (Uganda), based on the substitution of fossil fuels by alternative fuels (coffee husks biomass) and the use of pozzolans and one project at the Mbeya Cement Plant, Tanzania’s for fossil fuel substitution developed under UNEP.
As a response to the weak participation of the Sub-Saharan Africa in CDM the international community has initiated several actions and programs to help addressing the main barriers that hinder
20 United Nation Convention on Climate Change
World Bank/CF Assist Cement Sector Program in SSA: Barriers Analysis to CDM and Solutions
Final Report
Econoler International 3 (REF : # 5430)
the region’s participation in CDM as compared to the other developing regions. In this view, the World Bank’ Carbon Finance Assist has supported host country governments to establish the Designated National Authority (DNA), built capacity of private and public entities and developed CDM projects portfolio. In order to identify potential and promote CDM project activities in specific sectors, CF Assist has been supporting sectorial assessment at global, regional and national level.
To this perspective, CF Assist launched the carbon potential assessment for the SSA cement sector to enable the region’s cement industry to fully participate in the carbon market. The main objective of this assessment was to identify the barriers encountered by project developers in the SSA cement industry and develop recommendations for addressing them based on lessons learnt from the Indian cement sector which succeeded in registering the largest number of projects. The study looked at all existing project proposals and identified new opportunities in four main areas for CO2 emissions reduction: energy efficiency, waste heat recovery, fuel switch with biomass, and clinker substitution with alternative raw materials. Finally, the study identified and developed eligible CDM projects in the cement sector in SSA.

World Bank/CF Assist Cement Sector Program in SSA: Barriers Analysis to CDM and Solutions
Final Report
Econoler International 4 (REF : # 5430)
1 METHODOLOGY
The methodology used in this study intended to be pragmatic and based on ground situation. First, India was chosen as the comparative country for its success story in registering CDM projects in the cement sector. Indian businessmen in the cement industry are also active in the SSA and this offers a comparative advantage when compared to China the second world largest Certified Emission Reduction’s (CER) suppliers from the cement industry.
Second, the study capitalized on Econoler’s ground knowledge and its strong rooting in India and Africa. Econoler’s experiences and presence in India in CDM projects development and energy efficiency field in the past 6 years offered the advantage of capturing the ground situation in India. Econoler has been developing and implementing energy projects in more than 20 countries in Africa since past 10 years.
Third, Indian and African consultants as well as other experts who have strong experiences on the Indian and African contexts were closely involved in field data gathering, secondary data generation and barriers analysis.
Practically, the methodology was applied in three phases linked to the main activities covered by this study.
Analyzing the Success of CDM Projects in the Cement Sector in India
The study team analyzed through lessons learnt approach the success of CDM in India’s cement sector. The following tasks were conducted:
• Reviewing the literature that various government agencies and apex industry associations have developed, including a desk research on these organizations’ Websites.
• Collecting structured information through two questionnaires prepared to assess the approach used by stakeholders to motivate the cement sector to develop their CDM projects and best practices, the main energy efficiency and renewable energy measures that were implemented, the barriers that were faced and how they were overcome as well as how the additionality of their projects was demonstrated.
• Interviews by phone with three cement manufacturers who have registered CDM projects and two consultants who have developed Project Design Documents (PDDs) for the cement industry to document their learning, further potential and suggestions for a potential approach to Africa based on Indian experiences.
• For a specific methodology related to the substitution of alternative fossil fuels, assessing the current Indian market by product and raw materials used in CDM projects and using this data to compare it to African conditions.

World Bank/CF Assist Cement Sector Program in SSA: Barriers Analysis to CDM and Solutions
Final Report
Econoler International 5 (REF : # 5430)
Assessing Barriers and Conditions for Developing CDM Projects in Africa
Three main tasks were carried out in this study to assess the barriers for developing CDM projects in the African cement sector and propose solutions to overcome the identified constraints based on lessons learnt from the Indian experiences and the particular context of SSA. The approach used is described hereafter:
• Establish an overview of the cement industry in terms of production, consumption and future trends of the market to understand the structure of the industry and the main challenges.
• Collect and generate basic information for the analysis of CDM projects’ potential and the barriers in the African cement sector. A questionnaire was built in this end and sent to the major cement manufacturers (Lafarge, Holcim and Heidelberg), to national associations of cement manufacturers and/or Chambers of Commerce and all the cement plants identified in 12 countries. Desk research was also used to gather the needed information.
• Field visits and phone interviews were conducted in selected cement facilities for in-depth discussions on the barriers, possible projects and mitigation solutions. To this end, field missions were organized and conducted in the following countries: Ethiopia, Uganda, Kenya, Tanzania, Nigeria, Niger, Togo, Benin, Côte d’Ivoire, Cameroon, DR Congo and Senegal. This was done through intensive ground activities by the team members and the participation of six local consultants who took part in the study. Overall, more than 28 cement facilities and industry associations were visited and interviewed in the targeted countries in Africa. The list of organizations contacted is in Appendix 6.
• Analyze the barriers faced by the African cement industry to develop CDM projects drawing on the parallel with the situation in India.
Identifying CDM Projects Opportunities
The study assessed CDM projects opportunities in the African cement sector. The assessment was based on the field findings, literature review and exchanges with key stakeholders interested by CDM projects development in the SSA cement industry. The potential for developing blended cement, project, waste heat recovery and fuel substitution was evaluated and the foreseen barriers for developing such project in SSA context were highlighted.

World Bank/CF Assist Cement Sector Program in SSA: Barriers Analysis to CDM and Solutions
Final Report
Econoler International 6 (REF : # 5430)
2 ANALYSIS OF THE SUCCESS STORIES OF INDIA
2.1 OVERVIEW OF THE INDIAN CEMENT SECTOR
Organizational Structure
The Indian cement industry includes 140 large21 cement plants and 365 mini cement plants22. The installed capacity was around 198 million tonnes in 2007. Over the last decade, four of the top five cement companies in the world entered India through mergers, acquisitions, joint ventures or greenfield projects. These included Lafarge (France), Holcim (Switzerland), the Italcementi Group (Italy) and Heidelberg Cement (Germany). While Lafarge is investing over USD 500 million in India to expand its capacity by six million tonnes, Italcementi Group intends to invest USD 174 million over the next two years in various greenfield and acquisition projects23 and Holcim has a plan to invest about US$ 2.49 billion in the next five years to set up plants and raise capacity by 25 Mtpa in the country.
The Indian cement industry has also witnessed a flurry of mergers and acquisitions among its domestic players, bringing smaller players under the umbrella of larger companies and larger companies under the umbrella of global players like Holcim and Heidelberg. The top two groups in the industry, the Aditya Birla Group and Holcim Group, now control more than 40 percent of the total capacity in the country. In addition, more than a quarter of the total capacity is now controlled by global majors. Furthermore, there are 300 mini cement plants with an installed capacity of 11.10 million tonnes producing about 6.0 million tonnes of cement in 2007-2008.
The French cement major, Lafarge, acquired the cement plants of Tata Steel cement in 1999. Lafarge entered India in 1999, Raymond Cement in 2001, Tisco in the recent past, and currently has an installed capacity of 6 Mtpa. It plans to double its capacity to 12 Mt over the next five years by adopting the greenfield expansion route.
The Holcim Group entered India in January 2005 through a strategic alliance with Gujarat Ambuja Cement Limited (GACL). It acquired a further 67% stake in the GACL group company Ambuja Cement India Limited (ACIL), the holding company of the Ambuja Group. ACIL in turn holds an approximate 35% stake in Associated Cement Company (ACC) and a 97% stake in Ambuja Cement Eastern Limited (ACEL). In January 2006, Holcim acquired a 14.8% stake in GACL followed by another 3.7% over the following few months. Holcim now commands around 25% of the total market share with a 34.2 Mt capacity through ACC and Ambuja. India represents its single largest country exposure at about 18% of its global exposure. The other large group, Birla, controls another 31.2 Mt of the country's cement capacity through group companies, Grasim Industries and Ultratech Cements.
21 Large cement plants are defined as those with a production capacity over 1 million tons per year while mini cement plants produce less than 200,000 tons per year. 22 CII, Investors Manual for Energy Efficiency, 2004 23 Equity Research Report by ICICI, April 2008
World Bank/CF Assist Cement Sector Program in SSA: Barriers Analysis to CDM and Solutions
Final Report
Econoler International 7 (REF : # 5430)
Italy’s Italcementi entered India in 2001 with the acquisition of 50% of Zuari Cement with a capacity of 3.4 Mtpa, then through Ruari cement acquired Sri Vishnu in 2002, then in 2005 acquired the remaining 50% of Zuari.
Heidelberg Cement has entered into an equal joint venture agreement with Indorama Cement, controlled by the S. P. Lohia Group. Heidelberg Cement is also expected to take a 50% controlling stake in Indorama's grinding plant of 0.75 Mtpa at Raigad in Maharashtra. It is also taking over Mysore Cement of the S. K. Birla Group at a consideration of USD 93 million.
Production
Globally, India is the second largest cement producer after China that accounts for 46.6% of the total cement produced worldwide. India ranks second with 5.7% of the production share followed by the USA with 4.3% of the global production. Despite the near double digit growth of the Indian cement industry, India's per capita production of 130 kilograms per year lags behind the world average of over 340 kilograms and China's production of more than 750 kilograms per capita24.
The major types of cement produced in India include Ordinary Portland Cement (OPC), 33, 43 and 53 grades and blended cements such as Portland Pozzolana Cement (PPC) and Portland Slag Cement (PSC). The OPC varieties account for about 70% of the production, while the blended cements (PPC and PSC) account for 18% and 10% respectively. There is a recent trend to produce more quantities of the blended cement varieties.
According to the CMA, the average monthly capacity utilization during fiscal year 2007-2008 was 94%. Also, cement dispatches for 2007-2008 were at an all-time high of 174 million tonnes (Mt), up from 155 Mt in 2006-2007, thereby recording a growth of around 12%25. The growth was driven by a booming housing sector, global demand and increased activity in terms of infrastructure development such as state and national highways; the cement industry has therefore outpaced itself, ramping up its production capacity, attracting the world’s top cement companies and sparking off a spate of mergers and acquisitions to spur growth. Housing continues to be the main driver and constitutes 60% of the overall demand.
Demand and Projection
The majority of cement companies witnessed a surge in their sales volume, which was led by the rising demand. The impact of high demand growth was evident in the continuous upward movement of prices. Concurrently, companies reported higher production, sales and profits. The net profit growth rate of cement firms was 85% in the fourth quarter ending in March 2007:
24 Lafarge, 2007. 25 Equity Research Report by ICICI, April 2008

World Bank/CF Assist Cement Sector Program in SSA: Barriers Analysis to CDM and Solutions
Final Report
Econoler International 8 (REF : # 5430)
• Ultra Tech Cement reported a 76% rise in net profits at USD 56.65 million in the last quarter of 2006-07.
• Ambuja Cements grew by 43% to USD 144.23 million. • ACC’s net profits rose by 54.5% to USD 88.82 million. • Sanghi Cement recorded a 75% growth at USD 34.89 million in net profits in 2006-07.
To meet this rising demand, many Indian companies are going for capacity expansion. Close to 54 Mt of additional capacity is to come up in the next three years, with an investment of around USD 5.31 billion26.
Figure 1: Production and Consumption Trends in the Indian Cement Sector
Despite the strong demand on the national market, India exported about 8 Mt in 2006, ranking fourth after China, Thailand and Japan27. The demand has risen so much in India that, in 2008, the Government restricted cement exports and imports were being allowed from neighboring Pakistan.
According to a Deutsche Bank report, close to 5.1 Mt were planned to be added on by the second half of 2007-08, while 11.46 Mt will be added on in 2008-09. Around 28.90 Mt are likely to be added in 2009-10 and 2.87 Mt in 2010-11. A similar projection by the National Council of Applied Economic Research (NCAER) for cement consumption, on a conservative basis, has placed the demand for cement at 225 Mt by fiscal year 2011. If the Government goes ahead with its infrastructure projects as planned, the annual consumption is likely to be much higher, at 291 Mt.
26 Equity Research Report by ICICI, April 2008 27 Global Cement Report 2007. http://www.cemnet.com/publications/GlobalCementReport/default.aspx

World Bank/CF Assist Cement Sector Program in SSA: Barriers Analysis to CDM and Solutions
Final Report
Econoler International 9 (REF : # 5430)
Financial Performance and Prices
As per estimates in ICICI’s Equity Research Report and the Confederation of Indian Industry28, the vital statistics of the Indian cement industry are as follows:
• Production was 155 million tonnes in 2007. • Per capita consumption is 120 kg. • The compound annual growth rate was 8% over ten years. The current growth rate is about 10
to 12 percent. • The energy intensity is 43.7% of the manufacturing costs. • The energy costs represent USD 1,400 million. • The energy saving potential in Indian cement industry is about 5% as indicated by several
energy audits. This represents energy costs saving of USD 70 million. • The investment potential on energy saving projects is USD 140 million.
The historical cement prices in India29 have gone up from about USD 3.12 (per bag of 50kg) in September 2003 to nearly USD 5.50 (per bag) by March 2008, representing an increase of 76.3% over a 5-year period.
Figure 2: Historical Prices of Cement in India
In India, cement prices are in keeping with the market demand and global trends. Recently, the Government of India has warned the cement industry to lower their prices or face a ban on exports. This year, India imported cement because of the unsatisfied demand and rising prices.
28 Investors Manual for Energy Efficiency by CII, 2004 and Equity Research Report by ICICI, April 2008 29 Equity Research Report by ICICI, April 2008

World Bank/CF Assist Cement Sector Program in SSA: Barriers Analysis to CDM and Solutions
Final Report
Econoler International 10 (REF : # 5430)
Specific Energy Consumption
The share of installed capacity of energy inefficient wet process plants had slowly decreased from 94% in 1960 to 3% in 2006 as a result of quantum jump in production capacities through modern dry process plants as well as conversion of some of the wet process plants. In 2008, 98% plants used dry process technology.
NCBM’s energy monitoring studies indicate reducing thermal and electrical energy consumption trend of the dry process plants from 876 to 734 kcal/kg clinker and 120 to 89 kWh/t cement respectively from the year 1990 to 2001.
Table 1 : Process-wise reduction in Energy Consumption in Indian Cement Plants30
Process/Plants 1950-60’s Wet process
1970’s Semi-dry process
1980’s Dry-4 Stage Preheater/ Precalciner
1990’s Dry-5 Stage Preheater/ Precalciner
2000’s & Beyond Pyrostep coolers,
petcoke use, advanced kiln, roll press for cement grinding
Capacity (tonnes/day) 300 – 600 600 – 1200 2400 – 3000 3300 – 7500 8000 – 10000
Heat consumption (kcal/kg clinker)
1300 – 1600 900 – 1000 800 – 900 680 – 750 663 – 730
Power consumption (kWh/t cement)
115 – 130 110 – 125 105 – 115 80 – 100 67 – 85
The average specific energy consumption of the various Indian cement plants in 2001-2002 was about 98 kWh per tonne of cement (OPC) – 43 grades). There are about 10 cement plants that have done extremely well and are operating with a specific energy consumption of less than 85 kWh/tonne. The thermal energy consumption average is about 760 kcal/kg of clinker. Based on a study of recently established cement plants, the target energy consumption of a new cement plant could be as low as: i) specific electrical energy consumption: 75 units/tonne of OPC – 43; ii) specific thermal energy consumption: 715 kCal/kg of clinker31. The best energy performance in the Indian cement industry was established in 2006 at 663 kcal/kg of clinker and 63 kWh/tonne of cement.
Government Initiatives to support the sector development
Government initiatives in the infrastructure sector, coupled with the housing sector boom and urban development, continue being the main drivers of growth for the Indian cement industry.
• Increased infrastructure spending has been a key focus area over the last five years indicating good times ahead for cement manufacturers.
30 Dr. S.P. Ghosh, Indian Cement Industry from 20 to 21 st Century, presented at Stakeholder Discussion Forum: Building a sustainable cement sector in India 18-20 September 2008 31 CII, Investors Manual for Energy Efficiency, 2004
World Bank/CF Assist Cement Sector Program in SSA: Barriers Analysis to CDM and Solutions
Final Report
Econoler International 11 (REF : # 5430)
• The government has increased budgetary allocation for roads under National Highways Development Project (NHDP). This coupled with government's initiatives on the infrastructure and housing sector fronts would continue to remain the key drivers.
• Appointing a coal regulator is looked upon as a positive move as it will facilitate timely and proper allocation of coal blocks to the core sectors, cement being one of them.
Other budget measures such as cut in import duty from 12.5 percent to nil for raw material, removal of 16 percent countervailing duty, 4 percent cut in customs duty on Portland cement and differential excise duty are all intended to cut costs and boost availability.
Industry Associations
The Indian industry in general is supported by organizations that defend the industry’s interests, provide assistance and technical advice and raise awareness about eco-friendly packaging. The following organizations interact directly with the cement industry:
• Cement Manufacturers’ Association (CMA). • National Productivity Council (NPC). • National Council for Cement and Building Materials (NCBM). • Associated Chambers of Commerce and Industry of India (ASSOCHAM). • The Confederation of Indian Industry (CII). • Federation of Indian Chambers of Commerce and Industry (FICCI).
The CMA is the apex body with close to 55 cement companies owning 126 cement plants as members. It plays a significant role in projecting the cement industry to the Government and coordinating various activities in respect to the formulation of Government policies for the cement industry through its continuous dialogues and interactions. It identifies and strengthens the industry’s role in the economic development of the country and provides up to date statistical data/information to the industry and other agencies. The CMA offers dynamic benchmarking to its members as an online service through its Website, which includes benchmarking with the best performer among 62 plants, manual benchmarking against international data, reporting on energy consumption, reporting on the productivity of the workforce and machinery, and statistical analysis reports.
The NPC is a national organization that promotes productivity in India. Besides providing training, consultancy services and undertaking research in the area of productivity, the NPC also implements the productivity promotion plans and programs of the Tokyo-based Asian Productivity Organization (APO), an intergovernmental body of which the Government of India is a founding member. The NPC is the first in the country to set the tone for energy conservation through audits. It is regularly associated with the cement industry. NPC also runs a National Cleaner Production Center (NCPC) with the support of the United Nations Environment Programme (UNEP) for demonstration projects, training programs and information dissemination.

World Bank/CF Assist Cement Sector Program in SSA: Barriers Analysis to CDM and Solutions
Final Report
Econoler International 12 (REF : # 5430)
Created in 1985, the NCBM is an apex body dedicated to continuous research, technology development and transfer, educational and industrial services for the cement and building materials industries. The entire range of the NCBM’s services is delivered by eight corporate centers through its three units in Delhi, Ballabhgarh and Hyderabad. The NCBM’s activities in CDM consist in raising awareness and encouraging the units to take on such projects.
The ASSOCHAM includes a membership of over 200,000 companies and professionals across the country. It represents the interests of industry and trade, interfaces with Government on policy issues and interacts with counterpart international organizations to promote bilateral economic issues. As part of its leading role, the ASSOCHAM has committed to assist the industry move towards a sustainable environment by organizing workshops on ISO 14000, energy management systems, hazardous waste management, technical knowledge transfer. ASSOCHAM has a cement expert committee to address all the industry’s issues. It has set up an Energy Efficiency & Conservation Promotion, Guidance, Counseling and Consultancy Centre with the assistance of the Indian Renewable Energy Development Agency Limited (IREDA).
The Confederation of Indian Industry (CII) is a non-governmental, not-for-profit, industry-led and industry-managed organization working to create and sustain an environment conducive to the growth of industry in India, partnering industry and government alike through advisory and consultative processes. Founded over 112 years ago, it is India's premier business association, with a direct membership of over 7,000 organizations from the private and public sectors, including SMEs and big conglomerates, and an indirect membership of over 90,000 companies from around 362 national and regional sectorial associations. The CII has a vast experience working with multilateral and bilateral agencies such USAID, UNDP, UNIDO, ADB, IFC and the World Bank, etc. It has embarked on smarter initiatives that enhance the competitiveness of Indian industries by underlining the need for the rapid upgrading of parameters like quality, corporate governance, knowledge management, energy efficiency and environment management. Under the 3-Country Energy Efficiency Project of the World Bank, UNEP and UNF, the CII prepared an Investors Manual for Energy Efficiency in 2004 in which various energy saving opportunities in the cement sector are covered extensively.
The Federation of Indian Chambers of Commerce and Industry (FICCI) includes members from various industries and other smaller regional or sectorial associations. The FICCI’s objective is to secure the proactive participation and involvement of businesses and people to improve the quality of the environment. The FICCI's Environment Division has been active in raising widespread stakeholders’ awareness on climate change and CDM, the core issues and challenges confronting various stakeholders and CDM opportunities.
2.2 CDM PROJECT PORTFOLIO IN INDIA’S CEMENT INDUSTRY
World Bank/CF Assist Cement Sector Program in SSA: Barriers Analysis to CDM and Solutions
Final Report
Econoler International 13 (REF : # 5430)
India succeeded in registering the largest number of CDM projects with 379 projects registered (29%) out of the total 1,300 projects registered (as of January 1, 2009), although China contributed to the highest annual CER volume from registered projects (54% in China, 13% in India)32.
India’s dominance in carbon trading under CDM is beginning to influence the business dynamics of the country in various sectors. Indian industries have started adopting cleaner, sustainable technologies that, so far, have earned corporate Indians USD 341 million in 2007 just by selling carbon credits to parties based in developed countries (Annex I countries) as per CII estimates. CDM consultants interviewed during this study estimated at USD 4 billion India’s share in global carbon trading by 2012. There are projects in the pipeline that could create up to 306 million tradable CERs. Projections indicate that if more companies adopt clean technologies, the total CERs in India could reach 500 million.
An extensive PDD study of the registered and rejected CDM projects in the Indian cement sector was undertaken based on the available files on the UNFCCC Website and a compilation by UNEP Risoe centre. The database of CDM projects in India’s cement sector established portrays the different types of projects registered by approved methodology, quantum of CERs being delivered as well as the project participants, DOE and PDD consultants, status of registration and submission date. This database is provided in Appendix 4.
The CDM project pipeline developed by the United Nations Environment Programme (UNEP)33 based on the UNFCCC database indicates the following. As of January 1, 2009, 203 projects have been submitted worldwide in the cement sector for CDM registration. Out of this number of CDM projects submitted to the UNFCCC, 110 projects (54%) were developed in China, whereas 49 projects (24%) were hosted by India. In 2008 only, 33 projects have been submitted for registration. The majority is from China (24 projects).
32 UNFCCC, 2008. http://cdm.unfccc.int/Statistics/index.html 33 UNEP, 2009. CDM Pipeline, January 1, 2009.
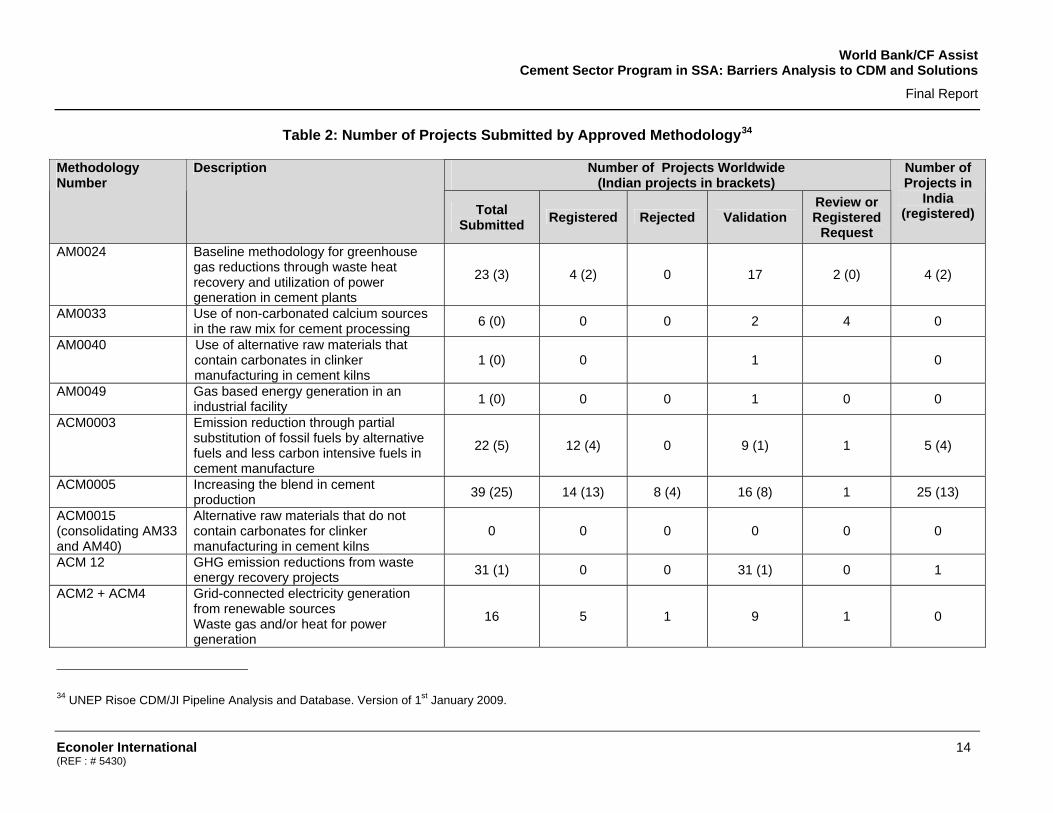
World Bank/CF Assist Cement Sector Program in SSA: Barriers Analysis to CDM and Solutions
Final Report
Econoler International 14 (REF : # 5430)
Table 2: Number of Projects Submitted by Approved Methodology34
Number of Projects Worldwide (Indian projects in brackets)
Methodology Number
Description
Total Submitted Registered Rejected Validation
Review or Registered
Request
Number of Projects in
India (registered)
AM0024 Baseline methodology for greenhouse gas reductions through waste heat recovery and utilization of power generation in cement plants
23 (3) 4 (2) 0 17 2 (0) 4 (2)
AM0033 Use of non-carbonated calcium sources in the raw mix for cement processing 6 (0) 0 0 2 4 0
AM0040 Use of alternative raw materials that contain carbonates in clinker manufacturing in cement kilns
1 (0) 0 1 0
AM0049 Gas based energy generation in an industrial facility 1 (0) 0 0 1 0 0
ACM0003 Emission reduction through partial substitution of fossil fuels by alternative fuels and less carbon intensive fuels in cement manufacture
22 (5) 12 (4) 0 9 (1) 1 5 (4)
ACM0005 Increasing the blend in cement production 39 (25) 14 (13) 8 (4) 16 (8) 1 25 (13)
ACM0015 (consolidating AM33 and AM40)
Alternative raw materials that do not contain carbonates for clinker manufacturing in cement kilns
0 0 0 0 0 0
ACM 12 GHG emission reductions from waste energy recovery projects 31 (1) 0 0 31 (1) 0 1
ACM2 + ACM4 Grid-connected electricity generation from renewable sources Waste gas and/or heat for power generation
16 5 1 9 1 0
34 UNEP Risoe CDM/JI Pipeline Analysis and Database. Version of 1st January 2009.
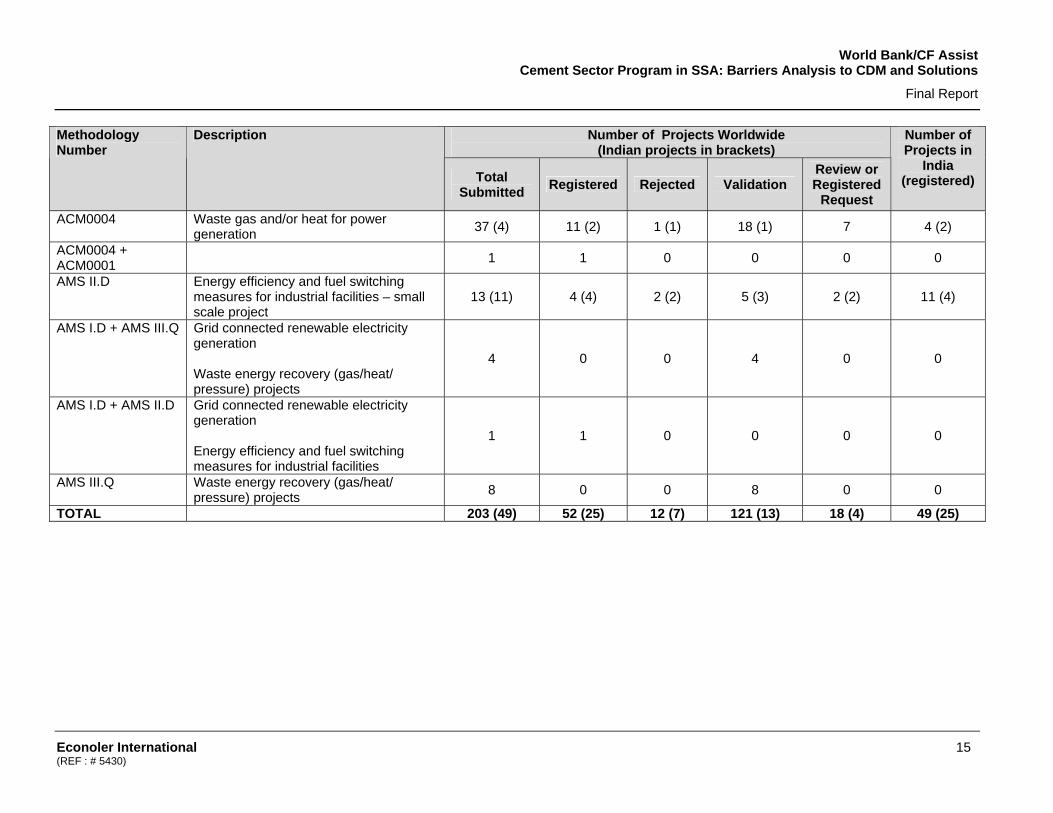
World Bank/CF Assist Cement Sector Program in SSA: Barriers Analysis to CDM and Solutions
Final Report
Econoler International 15 (REF : # 5430)
Number of Projects Worldwide (Indian projects in brackets)
Methodology Number
Description
Total Submitted Registered Rejected Validation
Review or Registered
Request
Number of Projects in
India (registered)
ACM0004 Waste gas and/or heat for power generation 37 (4) 11 (2) 1 (1) 18 (1) 7 4 (2)
ACM0004 + ACM0001
1 1 0 0 0 0
AMS II.D Energy efficiency and fuel switching measures for industrial facilities – small scale project
13 (11) 4 (4) 2 (2) 5 (3) 2 (2) 11 (4)
AMS I.D + AMS III.Q Grid connected renewable electricity generation Waste energy recovery (gas/heat/ pressure) projects
4 0 0 4 0 0
AMS I.D + AMS II.D Grid connected renewable electricity generation Energy efficiency and fuel switching measures for industrial facilities
1 1 0 0 0 0
AMS III.Q Waste energy recovery (gas/heat/ pressure) projects 8 0 0 8 0 0
TOTAL 203 (49) 52 (25) 12 (7) 121 (13) 18 (4) 49 (25)

World Bank/CF Assist Cement Sector Program in SSA: Barriers Analysis to CDM and Solutions
Final Report
Econoler International 16 (REF : # 5430)
Out of the 203 CDM projects initiated by the global cement industry, 12 were rejected (7 in India with 1 withdrawal, 2 in Brazil, 1 in China, 1 in Mexico and 1 in Sri Lanka), 121 projects are at the validation stage (13 in India and 78 in China, 3 in Africa) and 18 projects are at registration or correction stages. A total of 52 CDM projects have been registered, with 25 projects (48%) developed by the Indian cement industry. The remaining 27 CDM projects stem from China (17), Indonesia (3), Israel (1), Malaysia (1), Argentina (1), Uruguay (1), Colombia (1), Peru (1) and Costa Rica (1).
Distribution of Registered CDM Projects in Cement Sector
India48%
China33%
Indonesia6%
Others13%
Source: Data from UNEP CDM Pipeline, Jan. 2009
Figure 3: Breakdown of Registered CDM Projects in the Cement Sector
As of January 1, 2009, of the 25 registered projects in India, the majority (13) were for blended cement (ACM005), 4 were for the substitution of fossil fuels (ACM003), 4 were for waste heat recovery (AM0024 and ACM0004) and 4 were for energy efficiency (2 for EE through upgrading preheaters and 2 for improved EE through clinker coolers (AMS II.D).

World Bank/CF Assist Cement Sector Program in SSA: Barriers Analysis to CDM and Solutions
Final Report
Econoler International 17 (REF : # 5430)
Number of Registered Projects in India by Approved Methodologies
25
13
42 2
4
TotalRegistered
Projects
ACM0005 ACM0003 ACM0004 AM0024 AMS II.D
Figure 4: Number of Registered Projects in the Indian Cement Sector by Approved Methodologies
Out of the 6 projects rejected, 4 projects were for blended cement (ACM0005), two were for energy efficiency (AMS II.D) and one was for power generation from waste heat (ACM0004). The reasons for projects rejection are: i) failure to demonstrate additionality of the blended cement above the level of common practice in India for ACM0005, ii) lack of metering of energy use by the industrial facility (AMS II.D) and iii) size limit for bundling small scale projects (AMS II.D).
It is interesting to note that, among more than 120 major cement industries, about 20 have applied for CDM projects in India; these include the Aditya Birla Group – 6 (Vikram Cement, Grasim Cement, Ultratech Cement, Birla Plus brands); Orient Cement – 3; Binani Cement – 2; Shree Cements – 2; ACC – 1 (for six plants); India Cements – 1; Gujarat Ambuja – 1; Lafarge – 1; and 1 project apiece for Mysore Cements, Century Cement, JK Lakshmi Cement, Birla Corporation and Dalmia Cement.
In certain cases, CDM projects in several plants have been bundled under one project submitted by corporate entities such as the ACC – 6 plants and the Century Textiles and Industries Ltd – 3 plants. In both cases, the CDM projects involved increasing the percentage of fly ash in the blended cement. In the case of Orient Cement, three separate projects were registered for blended cement; one for Portland slag and two for Portland fly ash in three different locations.
The variation in the number of CDM projects over time indicates that a large number of PDDs were completed in 2005 and 2006 and that only one has been submitted to UNFCCC in 2008. This confirms that India may have reached a plateau particularly with respect to blended cement CDM projects as shown in the following figure. As illustrated in Figure 5, the number of projects submitted by the Indian
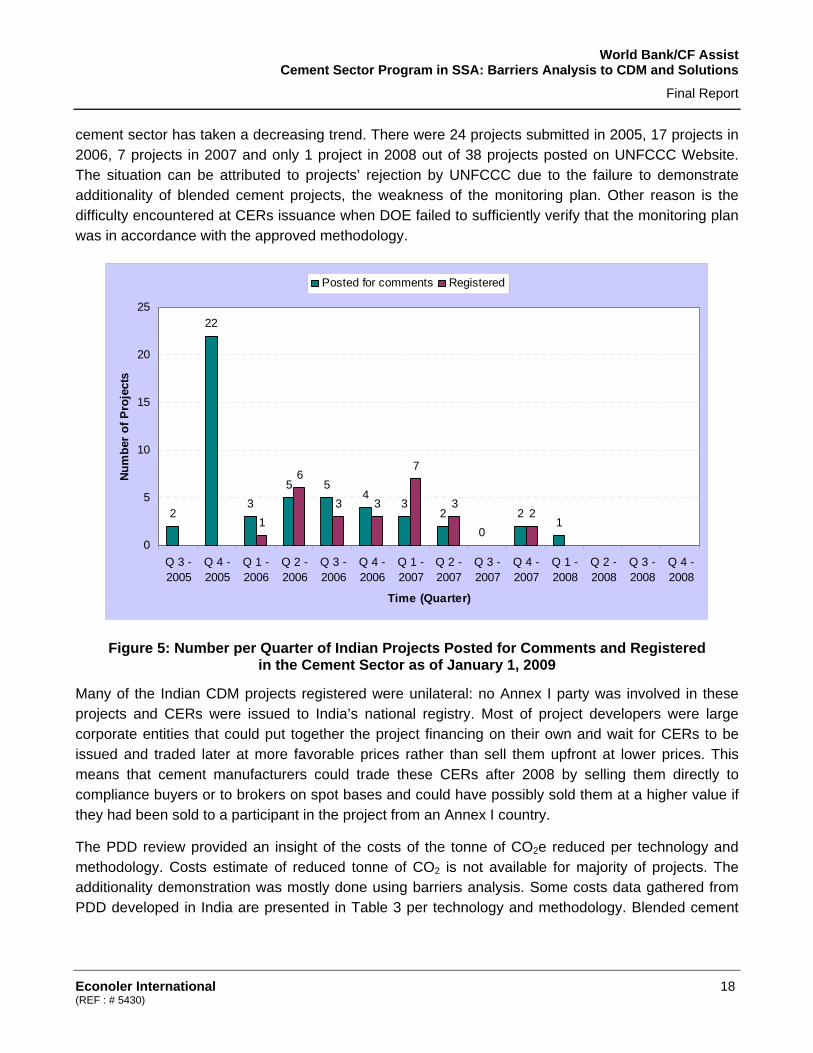
World Bank/CF Assist Cement Sector Program in SSA: Barriers Analysis to CDM and Solutions
Final Report
Econoler International 18 (REF : # 5430)
cement sector has taken a decreasing trend. There were 24 projects submitted in 2005, 17 projects in 2006, 7 projects in 2007 and only 1 project in 2008 out of 38 projects posted on UNFCCC Website. The situation can be attributed to projects’ rejection by UNFCCC due to the failure to demonstrate additionality of blended cement projects, the weakness of the monitoring plan. Other reason is the difficulty encountered at CERs issuance when DOE failed to sufficiently verify that the monitoring plan was in accordance with the approved methodology.
2
22
35 5
43
20
211
6
3 3
7
32
0
5
10
15
20
25
Q 3 -2005
Q 4 -2005
Q 1 -2006
Q 2 -2006
Q 3 -2006
Q 4 -2006
Q 1 -2007
Q 2 -2007
Q 3 -2007
Q 4 -2007
Q 1 -2008
Q 2 -2008
Q 3 -2008
Q 4 -2008
Time (Quarter)
Num
ber
of P
roje
cts
Posted for comments Registered
Figure 5: Number per Quarter of Indian Projects Posted for Comments and Registered in the Cement Sector as of January 1, 2009
Many of the Indian CDM projects registered were unilateral: no Annex I party was involved in these projects and CERs were issued to India’s national registry. Most of project developers were large corporate entities that could put together the project financing on their own and wait for CERs to be issued and traded later at more favorable prices rather than sell them upfront at lower prices. This means that cement manufacturers could trade these CERs after 2008 by selling them directly to compliance buyers or to brokers on spot bases and could have possibly sold them at a higher value if they had been sold to a participant in the project from an Annex I country.
The PDD review provided an insight of the costs of the tonne of CO2e reduced per technology and methodology. Costs estimate of reduced tonne of CO2 is not available for majority of projects. The additionality demonstration was mostly done using barriers analysis. Some costs data gathered from PDD developed in India are presented in Table 3 per technology and methodology. Blended cement
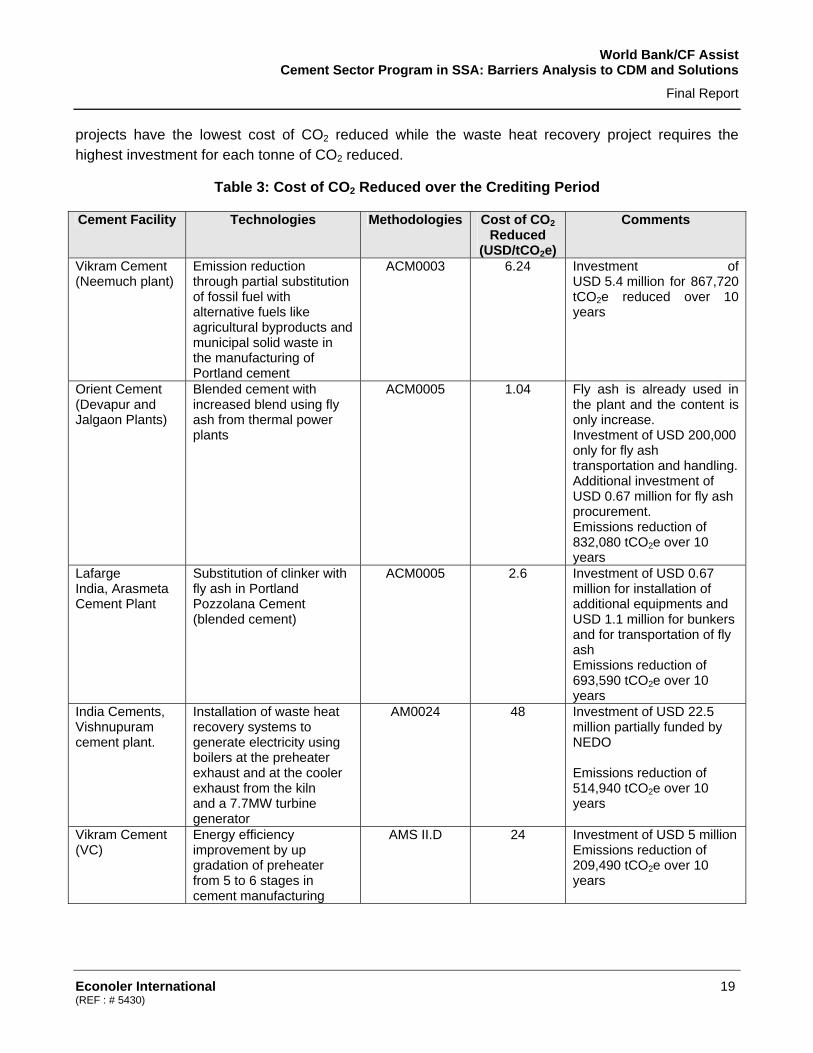
World Bank/CF Assist Cement Sector Program in SSA: Barriers Analysis to CDM and Solutions
Final Report
Econoler International 19 (REF : # 5430)
projects have the lowest cost of CO2 reduced while the waste heat recovery project requires the highest investment for each tonne of CO2 reduced.
Table 3: Cost of CO2 Reduced over the Crediting Period
Cement Facility Technologies Methodologies Cost of CO2 Reduced
(USD/tCO2e)
Comments
Vikram Cement (Neemuch plant)
Emission reduction through partial substitution of fossil fuel with alternative fuels like agricultural byproducts and municipal solid waste in the manufacturing of Portland cement
ACM0003 6.24 Investment of USD 5.4 million for 867,720 tCO2e reduced over 10 years
Orient Cement (Devapur and Jalgaon Plants)
Blended cement with increased blend using fly ash from thermal power plants
ACM0005 1.04 Fly ash is already used in the plant and the content is only increase. Investment of USD 200,000 only for fly ash transportation and handling. Additional investment of USD 0.67 million for fly ash procurement. Emissions reduction of 832,080 tCO2e over 10 years
Lafarge India, Arasmeta Cement Plant
Substitution of clinker with fly ash in Portland Pozzolana Cement (blended cement)
ACM0005 2.6 Investment of USD 0.67 million for installation of additional equipments and USD 1.1 million for bunkers and for transportation of fly ash Emissions reduction of 693,590 tCO2e over 10 years
India Cements, Vishnupuram cement plant.
Installation of waste heat recovery systems to generate electricity using boilers at the preheater exhaust and at the cooler exhaust from the kiln and a 7.7MW turbine generator
AM0024 48 Investment of USD 22.5 million partially funded by NEDO Emissions reduction of 514,940 tCO2e over 10 years
Vikram Cement (VC)
Energy efficiency improvement by up gradation of preheater from 5 to 6 stages in cement manufacturing
AMS II.D 24 Investment of USD 5 million Emissions reduction of 209,490 tCO2e over 10 years

World Bank/CF Assist Cement Sector Program in SSA: Barriers Analysis to CDM and Solutions
Final Report
Econoler International 20 (REF : # 5430)
2.3 CDM LESSONS LEARNT FROM THE APPROACH IN INDIA
2.3.1 Key Lessons Drawn from Interviews and Questionnaires
Two types of questionnaires were used in this study: i) one questionnaire targeted the approach stakeholders used (industry associations, Government agencies and consultants) to motivate the cement manufacturing units to develop their CDM projects (Appendix 1); ii) another questionnaire targeted cement manufacturers to analyze the success of CDM projects in the cement sector and covering aspects such as the technologies and approved CDM methodologies used, how the barriers were overcome, financing the project investment cost and the transaction costs (Appendix 2). The study team conducted phone interviews with three cement manufacturers who have registered CDM projects and two consultants who have developed PDDs for the industry. The list of all the organizations contacted in India for the study is provided in Appendix 3.
Legal Framework for Promoting Energy Efficiency in the Industrial Sector
The Bureau of Energy Efficiency (BEE), established under the Energy Conservation Act 2001, provides a legal framework for energy efficiency initiatives in India. The Act empowers the Central Government and, in some instances, the State Governments to: i) identify energy intensive industries, other establishments and commercial buildings as designated consumers: ii) establish and prescribe energy consumption norms and standards for designated consumers; iii) direct designated consumers to appoint a certified energy manager in charge of activities for the efficient use of energy and its conservation, etc.
As per the application of the Energy Conservation Act 2001, the BEE identified cement companies as energy intensive industries and designated energy consumers, requiring them to report periodically on their energy consumption and efficiency levels. The need to be globally competitive and the pioneer CDM projects could be considered as the other general factors that have influenced the Indian cement industry to develop CDM projects.
Role of Industry Associations
Government agencies (BEE, NCBM, NPC, etc.) and industry associations such as the CII and CMA have mainly promoted energy efficiency with data for benchmarking as a mean to reduce production costs and to cope with energy shortages and coal availability constraints. They have increased awareness about the opportunities in the CDM sector but have not specifically facilitated any CDM project in the sector.
With its 55 members and 126 cement plants operating in India, the CMA collects data on the production of various types of cement by grades and blends, on the fuels used, the energy consumed, etc. which were useful to establish the baseline for CDM project development. Furthermore, the benchmarking set by the CMA undoubtedly helped in peer level comparisons that would have motivated cement units to adopt energy efficiency policies and CDM project development. To focus on

World Bank/CF Assist Cement Sector Program in SSA: Barriers Analysis to CDM and Solutions
Final Report
Econoler International 21 (REF : # 5430)
CDM project development, in January 2005, the CMA, along with the GTZ, organized an international seminar in Mumbai on “Cost Effectiveness in Cement Manufacture and Construction - Technological and Management Options”, with cement technology providers. The main purpose of the event was to acquaint technology experts and users with the recent developments in technology upgrades, especially for the cement industry. The technical sessions covered the most concurrent and emerging issues for cement industry including alternate and hazardous waste derived fuel use and waste heat based cogeneration, state of art grinding, pyro-processing and maintenance system, retrofitting for cost-effective plant modernization, modernization of emission control, reduction of greenhouse gases, blended cement, CDM, sustainable development and carbon trading.
The NCBM and NPC have worked in the cement sector for many decades and have focused on technology upgrades (switching from wet process to dry process in cement manufacturing), energy efficiency and productivity improvements even though they have not directly facilitated any CDM project in the cement industry. The CII has worked closely with the cement industries on energy audits and the implementation of audit recommendations. Under a World Bank project, the CII has developed and circulated, free of charge, an Investors Manual for Energy Efficiency, which has one section completely devoted to EE improvement projects in the cement industry.
Industry associations and organizations have focused mainly on industrial development to meet infrastructural needs and energy efficiency for reducing the production costs. CDM was indirectly promoted by these agencies as a mean of additional revenues stream. The CII, FICCI and ASSOCHAM have conducted seminars and conferences that highlighted CDM benefits and the project development process. The FICCI has offered consulting services for CDM project development with a 50% subsidy of the costs for PDD preparation, but did not directly finance any project in the cement sector. Both the FICCI and ASSOCHAM have organized a number of conferences and seminars that have brought together carbon buyers, CDM project consultants, project developers, carbon funds and other stakeholders.
Large Corporations
Indian cement industries, particularly the larger units belonging to big corporate houses, have strong engineering and technical service teams who were inclined to import new technologies, try new projects and reduce energy costs through energy efficiency. The CMA’s vast database provided the benchmarking related to the specific energy consumptions, percentage of blends, fuels used, etc., which was useful for peer level performance comparisons by the cement units.
The large number of Indian projects registered is common across all sectors and not just restricted to the cement industry. Most CDM projects in the cement industry were largely through the initiative of the industries’ management where awareness programs by industry associations and other government agencies in the field played a supportive role in influencing the decision-making. However, the driving forces were more for industrial development and production cost reductions.

World Bank/CF Assist Cement Sector Program in SSA: Barriers Analysis to CDM and Solutions
Final Report
Econoler International 22 (REF : # 5430)
CDM projects were taken up to get some additional benefits for energy efficiency projects or to make them financially more attractive.
Most projects were developed with the manufacturers’ own funds (except one on waste heat recovery, which was partly funded by the New Energy and Industrial Technology Development Organization (NEDO), Japan, as a demonstration project and which the company fully repaid). In most cases, units did not sell CERs in advance and carbon revenues did not form a part of the upfront project financial arrangement. Many projects were registered unilaterally with CERs being credited to the national registry. This has enabled the units to trade CERs at a higher price.
Bilateral Aid Agencies
The GTZ conducted a number of awareness workshops on CDM and maintained a Website www.cdmindia.org that was a useful reference to get started with project development. This Website, which was established in partnership with the BEE, is now called www.carbonyatra.com and has institutional linkages with the National CDM Authority. Until now, the GTZ has received 60 project proposals with the potential to generate over 40 million CERs. It has supported the PDD development for 10 projects; 6 of which have received host country approval and 3 of which have signed validators’ contracts.
The GTZ has also supported the creation of TERI Business Council for Sustainable Development India (TERI BCSD), a partner of the World Business Council for Sustainable Development WBCSD. TERI-BCSD India in association with the World Business Council for Sustainable Development's Cement Sustainability Initiative (WBCSD - CSI) and the European Cement Research Academy (ECRA) organised a Stakeholder Discussion Forum on “Building a sustainable cement sector in India” in September 2008. The benchmarking methodologies, voluntary targets in wake of CDM, feasibility of industry sectorial approaches, future technologies for energy efficiency and financial options available for the cement industry were discussed35.
The technology providers from Japan, Germany, China and the UK have been instrumental in convincing the units to take up projects. The NEDO’s Japanese Department, the GTZ, the British High Commission and the Department of Trade and Industry have organized international seminars and trade missions, which brought technology providers and international CDM consultants to India. The major technology transfer is the waste heat recovery project at India cements where the technology transfer and even financing was done by NEDO. Other projects involved imported equipment for alternative fuels use etc. but did not involve any major technology transfer exercise.
35 TERI BCSD, Stakeholder Discussion Forum: Building a sustainable cement sector in India 18-20 September 2008 IHC, New Delhi.
World Bank/CF Assist Cement Sector Program in SSA: Barriers Analysis to CDM and Solutions
Final Report
Econoler International 23 (REF : # 5430)
Role of CDM Consultants
Cement manufacturers have appreciated the role CDM consultants have played and who have carefully collected the data and prepared the documentation required to justify the additionality of projects. In general, the success of CDM in India is partly due to the availability of well-trained and qualified CDM experts that enable projects development, data collection, play interface between international consultants and carbon credit buyers and project participants.
2.3.2 Summary of Barriers and Mitigation Solutions in India
One of the initial major barriers related to the lack of capacity in terms of technology and the marketing of a new product could be quickly mitigated by various means as described in Chapter 3. The main efforts were focused on the following:
• Awareness of technology upgrades, especially for the cement industry. • Development of a benchmarking system with the support of the BEE. • Showcases of cement plants’ practices, achievements and capabilities in India in the field of
efficient cost-effective technologies. • Technical sessions to cover the most concurrent and emerging issues in the cement industry,
including the use of alternate and hazardous waste-derived fuel and waste heat-based cogeneration, greenhouse gas reductions, blended cement and cement-based new generation binders, sustainable development, CDM and carbon trading.
• Enhancement of the overall CDM projects developing environment, including the availability of qualified local consultants.
Main barriers faced by Indian cement industries to develop CDM projects were analyzed along with how those barriers were overcome. This analysis was carried out through a PDD study of CDM projects in the cement industry, the answers to questionnaires and direct contacts with cement plant managers and consultants. The three barriers are discussed in the following table.

World Bank/CF Assist Cement Sector Program in SSA: Barriers Analysis to CDM and Solutions
Final Report
Econoler International 24 (REF : # 5430)
Table 4: Barriers to CDM in the Indian Cement Sector
Common Barriers Description Mitigation Actions Technological Barriers • Common practices include the
use of coal, pet coke and lignite as the main fuels in kilns
• Lack of knowledge about clean technologies
• Fly ash variation in respect to blains and loss on ignition percentage were the major technological barriers
• Aversion to unfamiliar technologies and associated risks
• Promotion of alternative fuels including biomass, tires, MSW
• Demonstration projects of heat recovery project by NEDO
• GTZ mission did promotion Energy efficiency and renewable energy and CDM in the country
• Technology’s indigenous development involved in blending fly ash by the Indian cement manufacturers based on scientific studies from Annex 1 countries on the options available to increase the blending of fly ash and on PPC’s properties.
• The CMA’s benchmarks and best practices promotion in the industry through an online portal to benchmark various operational parameters (raw material, energy, cost of production) for its members reference and use
Barriers Due to Marketing
• Customer perceptions about the Government’s Central Public Works Department’s ban on the use of PPC on bridges
• The mindset of builders / masons that “PPC is ash mixed cement” and the darker color of PPC was attributed to impurities
• Cement units invested in R&D for blends in producing Portland Pozzolana Cement (PPC) (cement industry structure based on large groups helped to integrate these R&D findings in engineering units)
• Special campaigns to prove the quality and strength of PPC cement. Masons and builders needed special training to adopt higher blends of PPC
Financial Barriers • Transaction costs and risk of project rejection;
• Initially, high upfront capital
• Pioneers led the way • Efforts of CDM consultants and equipment
vendors
As many blended cement projects have been registered and now the projects could be deemed to be happening on economic grounds, it appears more difficult to demonstrate the additionality of such projects. The majority of rejected projects by the CDM Executive Board are blended cement projects where the DOE and the project participant failed to substantiate significant and additional technological and market acceptability barriers to increasing the level of additives in the production of blended cement above the level of common practice in the country. The list of rejected projects is compiled in the table below.

World Bank/CF Assist Cement Sector Program in SSA: Barriers Analysis to CDM and Solutions
Final Report
Econoler International 25 (REF : # 5430)
Table 5: List of Rejected Projects in India’s Cement Sector
Ref. Project Title Methodologies Reasons for Rejection EB Comments 454 Increasing the Additive
Blend in cement production by Jaiprakash Associates Ltd.
ACM5 Additionality requirements not met
DOE and the project participant failed to substantiate significant and additional technological and market acceptability barriers to increasing the level of additives in the production of blended cement above the level of common practice in the country.
715 Blended Cement Project with Fly Ash – Lafarge India Private Limited
ACM5 Idem Idem
861 ACEL Blended cement project at Sankrail grinding unit
ACM5 Idem Idem
863 Optimum utilisation of clinker for Pozzolana Portland Cement (PPC) production at Birla Plus Cement in Bathinda, Punjab
ACM5 Idem Idem
859 Vikram Cement: Energy efficiency by up-gradation of clinker cooler in cement manufacturing
AMS-II.D. Monitoring requirements not met
Lack of metering of energy use by of the industrial facility, equipment or processes affected by the project activity. Corrections requested by the Board had not been made
954 GHG emission reduction by energy efficiency improvement of clinker cooler in cement manufacturing at Rajashree cement at District Gulbarga, Karnataka India
AMS-II.D. Size limit of bundled small scale project
DOE and project participant failed to substantiate that the size of the total bundle does not exceed the limits for small scale CDM project activities.
It is unlikely that more projects will be developed under ACM0005 mainly due to difficulties in establishing the baseline. As shown in the table below for some registered blended cement project, substantiating a project scenario with clinker content lower than the baseline benchmark is more difficult as the share of clinker in the benchmark is already very low. Moreover, blended cement projects were complicated and their success depended upon very good Research and Development (R&D) and quality monitoring at the plant as well as convincing marketing promotion that there was no compromise in regards to quality. Teams at both the plant and marketing levels had to be very keen and committed in order to ensure the success of these projects.

World Bank/CF Assist Cement Sector Program in SSA: Barriers Analysis to CDM and Solutions
Final Report
Econoler International 26 (REF : # 5430)
Table 6: Baseline Benchmark for Selected Blended Cement Project in India
Ref. Project Title Baseline Benchmark (t clinker/t blended cement)
0183 Optimal Utilization of Clinker” project at Shree Cement Limited (SCL), Beawar, Rajasthan
0.666 – 0.712
0287 ACC Blended cement projects at New Wadi Plant, Tikaria Cement Plant, Chanda Cement Works, Kymore Cement Works, Lakheri Cement Works and Chaibasa Cement Works
0.606 – 0.733
0314 Optimal Utilization of Clinker in PPC manufacturing at Birla Corporation Limited, Raebareli Unit
0.678 – 0.727
0361 Optimum utilisation of clinker by PPC production at Binani Cement Limited, Rajasthan
0.701 – 0.746
0468 Optimum utilisation of clinker by production of Pozzolana Cement at UltraTech Cement Ltd. (UTCL), Andhra Pradesh
0.767 – 0.802
0473 Optimal utilization of clinker: Substitution of Clinker by Fly ash in Portland Pozzolana Cement blend at OCL, India
0.658 – 0.704
Note: Baseline benchmark value takes a range since it is updated annually
Some projects were rejected because of their inadequate justification/proof of additionality while other projects were rejected due to the fact that the achieved energy efficiency measurement was not foolproof and the applicants were unable to justify how the required instrumentation would be put in place to measure the energy savings. All these projects were rejected between December 2006 and July 2007. Since July 2007, only three CDM projects were submitted and developed by the Indian cement industry.
World Bank/CF Assist Cement Sector Program in SSA: Barriers Analysis to CDM and Solutions
Final Report
Econoler International 27 (REF : # 5430)
3 ASSESSMENT OF BARRIERS TO CDM PROJECTS DEVELOPMENT IN SUB-SAHARAN AFRICA
3.1 OVERVIEW OF THE SUB-SAHARAN AFRICAN CEMENT INDUSTRY
The 2008 OECD’s African Economic Outlook indicates that Africa has experienced a record economic growth for four consecutive years. Overall in 2007, the continent registered a 5.7% GDP growth and a per capita increase of 3.7%36. This represents the highest growth since 1996. The improving performance of Africa's economies has led to a strong growth in the cement demand in the region. The Global Cement Report 2007 estimated the cement demand growth at 9.4% in 2006 as compared to the global growth of 8.6%. Countries in SSA have experienced the boom observed in other worldwide regions like India, especially in the infrastructure sector.
Demographic growth, urbanization and the need to accelerate the economic performance in a sustainable way are among the factors driving new investments in the African residential, commercial and industrial sectors, in infrastructure projects, such as roads and power (e.g. dams), and in tourism. Moreover, post-conflict reconstruction also drives the growth in the infrastructure sector in certain countries. These factors, combined with economic reforms, debt relief and a favorable international background are benefiting the construction sector and consequently result in an increase in the cement demand in most SSA countries37.
Organizational Structure of Sub-Saharan African Cement Industry
The African cement market is dominated by the world’s top five cement manufacturers, namely: Lafarge (France), Holcim (Switzerland), CEMEX (Mexico), Heidelberg Cement (Germany) and Italcementi (Italy). CEMEX and Italcementi operate cement facilities only in North Africa. CEMEX has a cement plant in Egypt with a production capacity of 4.9 million tonnes per year whereas Italcementi is present in Egypt (5 plants with a production capacity of 12 million per year) and Morocco (3 plants and 1 grinding unit with a total production capacity of 3.2 million tonnes per year). Among the top five, only Lafarge, Holcim and Heidelberg own or operate cement processing units in SSA. They have consolidated their position in the SSA cement market over the years by acquiring former publicly-owned or concurrent companies, merging with other groups for strategic positioning on the market to fight external competition, forming concessions and starting new operations (new plants and extensions).
36 OECD. 2008. Africa in 2008: Breaking Down the Growth (based on the African Economic Outlook 2008). Policy Insights No 64, April 2008. 37 Culverhouse, Stuart. Africa Building Foundations - Cement Companies in SSA. December 2006. As seen in http://columbuscapitaladvisor.com/ in October 2008.

World Bank/CF Assist Cement Sector Program in SSA: Barriers Analysis to CDM and Solutions
Final Report
Econoler International 28 (REF : # 5430)
Table 7: Top Three Cement Manufacturing Companies in SSA38
Cement Kilns Grinding Plants Production Capacity (tonnes)
Lafarge 11 4 11 147 000 Heidelberg 2 9 4 505 000 Holcim 1 6 5 390 000 Total 16 19 28 042 000
However, it should be noted that the SSA cement industry picture could greatly change in the coming year as it was reported during this study that both Heidelberg and Holcim have/are desinvesting from SSA. In 2007 Holcim sold 85% of its 54% equity shareholding in Holcim South Africa to AfriSam (a Black Economic Empowerment - BEE consortium), that has also taken over Holcim South Africa’s 62.5% equity shareholding in Tanga Cement (Tanzania). Therefore, Holcim is only holding about 8% and 10% of its former South African and Tanzanian subsidiaries limiting its presence to technical assistance. Heidelberg sold in 2007 and early 2008 all its operations in Nigeria (Sokoto and Edo cement to Damnaz Cement of Nigeria and its cement terminal to Dangote) and in Niger (Société Nigérienne de Cimenterie (SNC) to Damnaz Cement). Heidelberg is currently looking at selling its other SSA operations.
As part of this SSA cement sector restructuring, Dangote Cement, a subsidiary of the Nigerian conglomerate Dangote Group entered the market with 2 cement facilities and 2 terminals in Nigeria. The total capacity of Dangote’s Cement operations is around 11 million tonnes (capacity of 7 Mt per annum for plants and 4 Mt for terminals). The current production is 3.2 Mtpa.
38 Steinweg, Tim. Cement Sector Scan. May 2008. As seen at http://somo.nl in October 2008

World Bank/CF Assist Cement Sector Program in SSA: Barriers Analysis to CDM and Solutions
Final Report
Econoler International 29 (REF : # 5430)
Cement Manufacturers Associations in SSA
Even though there have been some regional initiatives to establish a regional organization for the SSA cement sector, little has been done to bring together cement manufacturers in particular regions. The only regional association of cement producers in SSA (excluding South Africa) is the East Africa Cement Producers Association (EACPA) formed by seven cement manufacturing companies: Mbeya Cement and Tanga Cement Company in Tanzania, Hima Cement Limited and Tororo Cement Limited in Uganda and Athi River Mining Limited, Bamburi Cement Limited and East African Portland Cement Limited in Kenya.
Box 1: Lafarge in Sub-Saharan Africa
Lafarge’s presence in SSA dates back to 1985, with the acquisition of a grinding plant in Cameroon. From 1980 to 2000, Lafarge has reinforced its position on the SSA market with a series of acquisitions in Kenya, South Africa, Uganda and Benin. With its purchase of Blue Circle in 2001, Lafarge inherited operations in five more countries: Zimbabwe, Tanzania, Malawi, Nigeria and Zambia.
Lafarge is the main cement producer in the SSA region. It owns 15 different facilities (11 integrated plants and 4 grinding units) in 10 countries with a production capacity of 11 million tonnes. Lafarge employs 7,700 persons in its SSA operations.
Lafarge installed capacities in SSA countries and its market presence are shown in the following map of Africa.
In most countries where it is present, Lafarge has a large market share. The overall market share in SSA is about 29% with important variations among countries.
Countries Cement Plants
Grinding Plants
Approx. Market Share
Benin 1 - 34%
Cameroon 1 1 95%
Kenya 1 1 60%
Malawi - 1 75%
Nigeria 3 - 30%
South Africa
1 1 20%
Tanzania 1 - 38% Uganda 1 - 56%
Zambia 2 - 91%
Total 11 4 -
Cement produced at these facilities is sold on the local market, which covers a total of 18 countries as shown on the map below. Lafarge cement sales in SSA reached €1.5 billion in 2006.
Source : Lafarge, 2007

World Bank/CF Assist Cement Sector Program in SSA: Barriers Analysis to CDM and Solutions
Final Report
Econoler International 30 (REF : # 5430)
At the national level, a cement manufacturer is constituted in Nigeria under the Manufacturers Association of Nigeria (MAN), a national industrial association serving and representing nearly 2,000 companies in the private and public manufacturing, construction and service sectors of the national economy. The MAN’s mission consists in taking actions to provide manufacturers throughout Nigeria with the means to formulate promote and influence general policies in regard to industrial, labor, technical, social, legal and training matters and to encourage a high standard of quality of its members’ products through the collection and circulation of useful information and the provision of advice. The Cement Manufacturers Association of Nigeria (CMAN) is a sub-sectorial group under the Non-Metallic Mineral Products sectorial group.
Production
The challenging work in this study was to generate reliable and updated statistics from the SSA cement sector where there is real lack of publicly available data. Several sources are used to build the necessary data to understand the market. Using International Cement Review's Global Cement Report 2007 edition, IFC estimated that in 2007 SSA consumed 60.6 Mt of cement and had an installed cement capacity of 56.3 Mtpa (42 Mtpa integrated cement plants plus 14.3 Mtpa cement grinding plants). The relatively complete recent data available was gathered from 2006 US Geological Survey39. According to these data, the total installed capacity in 2004 was about 45 million tonnes for a total of approximately 75 plants throughout the SSA continent, including South Africa. The breakdown by region is summarized in Table 8. A detailed list is provided in Appendix 7.
Table 8: Breakdown of Cement Plants and Installed Capacity in SSA
Number of Plants
Production Capacity (tonnes of cement)
Actual Production (tonnes of cement)
Capacity Utilization
West Africa 29 19 241 000 8 779 130 46% Central Africa 11 3 613 000 1 720 000 48% East Africa 29 8 954 000 6 768 110 76% Southern Africa 6 13 145 000 12 348 000 94% Total 75 44 953 000 29 615 240 66%
Most of cement facilities are located in West Africa and East Africa with 29 cement works each. The Central Africa region has 11 cement plants followed by South Africa with 6 cement production units. West Africa also has the largest installed capacity representing 43% of the continent’s total installed capacity. South Africa ranks second with 29% followed by East Africa (20%) and Central Africa (8%).
The majority of cement plants are located in Ethiopia, Kenya, Nigeria, Senegal, Tanzania, Zimbabwe and South Africa. In West Africa, the industry is driven by Nigeria with 9 plants registered by the US Geological Survey for an installed capacity of 9.75 million tonnes (around 51% of the region’s production capacity). In East Africa, Kenya is the leading country with a production capacity of 2.75 million tonnes. In Central Africa, Cameroon is the major cement producer with a production capacity 39 U.S. Geological Survey Open-File Report 2006-1135http://pubs.usgs.gov/of/2006/1135/index.html
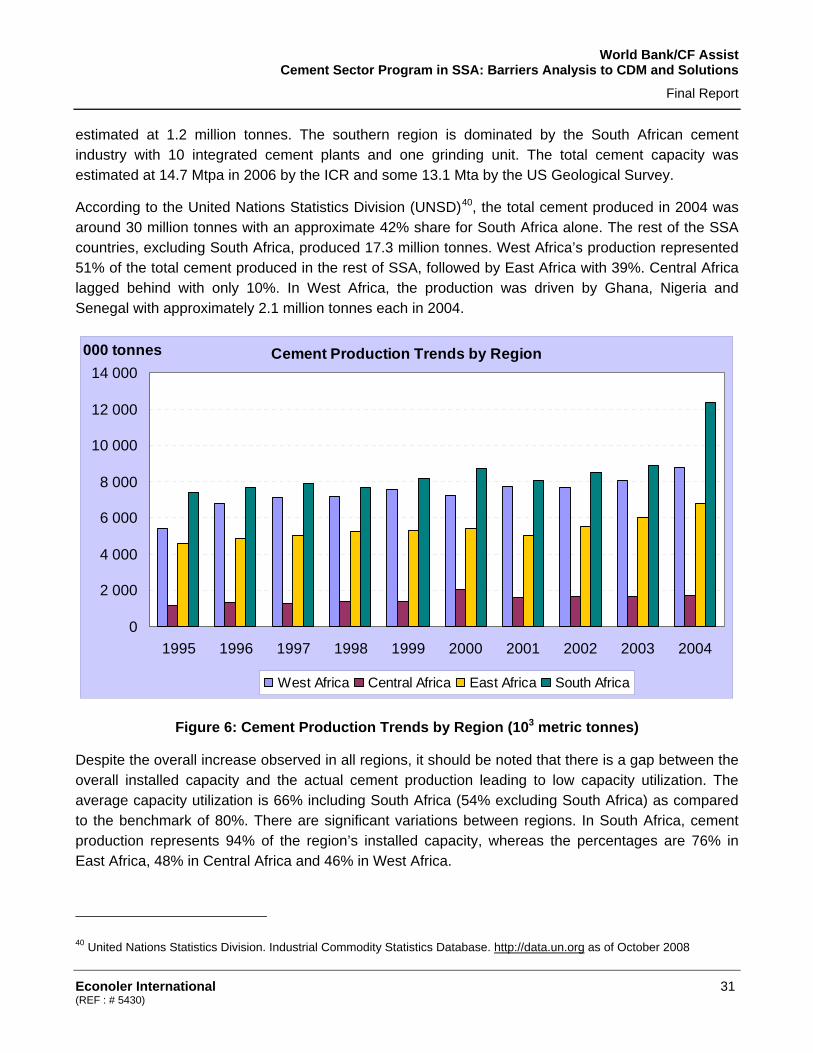
World Bank/CF Assist Cement Sector Program in SSA: Barriers Analysis to CDM and Solutions
Final Report
Econoler International 31 (REF : # 5430)
estimated at 1.2 million tonnes. The southern region is dominated by the South African cement industry with 10 integrated cement plants and one grinding unit. The total cement capacity was estimated at 14.7 Mtpa in 2006 by the ICR and some 13.1 Mta by the US Geological Survey.
According to the United Nations Statistics Division (UNSD)40, the total cement produced in 2004 was around 30 million tonnes with an approximate 42% share for South Africa alone. The rest of the SSA countries, excluding South Africa, produced 17.3 million tonnes. West Africa’s production represented 51% of the total cement produced in the rest of SSA, followed by East Africa with 39%. Central Africa lagged behind with only 10%. In West Africa, the production was driven by Ghana, Nigeria and Senegal with approximately 2.1 million tonnes each in 2004.
Cement Production Trends by Region
0
2 000
4 000
6 000
8 000
10 000
12 000
14 000
1995 1996 1997 1998 1999 2000 2001 2002 2003 2004
000 tonnes
West Africa Central Africa East Africa South Africa
Figure 6: Cement Production Trends by Region (103 metric tonnes)
Despite the overall increase observed in all regions, it should be noted that there is a gap between the overall installed capacity and the actual cement production leading to low capacity utilization. The average capacity utilization is 66% including South Africa (54% excluding South Africa) as compared to the benchmark of 80%. There are significant variations between regions. In South Africa, cement production represents 94% of the region’s installed capacity, whereas the percentages are 76% in East Africa, 48% in Central Africa and 46% in West Africa.
40 United Nations Statistics Division. Industrial Commodity Statistics Database. http://data.un.org as of October 2008

World Bank/CF Assist Cement Sector Program in SSA: Barriers Analysis to CDM and Solutions
Final Report
Econoler International 32 (REF : # 5430)
Consumption and Demand Projections
Cement consumption in SSA is the lowest in the world, averaging at 70 kg per capita, while the global average is currently 340 kg per capita. India and China have respectively a per capita consumption of 130 kg and 750 kg41.
According to the 2007 Global Cement Report, the overall growth observed on the cement market demand, besides in China, was 5.8% in 2006. The report indicates significant variations in growth across regions. In the African regions, the growth was 9.4% while in Europe and the USA it was respectively 3.5% and 1.4%. Asian regions experienced the highest growth with 13% in the North and 12.4% on the Indian sub-continent42. For instance, in 2005, Kenya’s cement consumption amounted to about 1.57 Mt compared with nearly 1.42 Mt in 2004; the increase was partially attributable to growth in the residential construction sector (Central Bank of Kenya, 2006a, p. 2; Swan and Klotnick, undated)43.
Lafarge estimated the SSA cement market to be 48 million tonnes in 2006 and 50 million tonnes in 200744 while IFC estimate is much higher at 60.6 Mtpa. These figures are still far below those recorded on the Indian and Chinese markets with 153 Mtpa and 1,200 Mtpa respectively. According to a forecast by Lafarge, there is a very significant potential for growth and market expansion of around 6-8% per year, predicting that cement consumption in SSA countries could more than double over the next 10 years, around 140 kg per capita.
Exports and Imports
The increasing cement demand and the limited production capacity have resulted in the continent’s dependency from imported cement particularly in countries where demand is high. IFC estimated cement consumption in SSA at 60.6 Mtpa while the production capacity was 56.3 Mtpa. The booming demand could not be met by the region cement production and the shortage of some facilities in Nigeria and the low capacity utilization are among other factors that contributed to increase the gap between cement demand and production. For instance, in 2006, the cement market in Nigeria was about 10 million with only 3.7 million tonnes produced locally. The imported cement share represented around 65% of the total market.
The graph below shows the trade balance of selected countries from 2001 to 2007. Nigeria, Ghana, Ethiopia and Tanzania were net cement importers during the whole period. Kenya remained a net exporter during the whole period whilst Senegal became one only after 2004. South Africa shows a declining trend as it became a net importer after 2004, almost tripling its imports from 2005 to 200645. The cement import is from Asian countries like India, China, Japan, Europe (Spain) but also trade 41 Lafarge, 2007 42 Global Cement Report, 2007, 7th Edition. http://www.cemnet.com/publications/GlobalCementReport/default.aspx 43 http://minerals.usgs.gov/minerals/pubs/country/2005/kemyb05.pdf 44 Excerpt from the 2007 annual report. Lafarge 45 Database Statistics Division - United Nations Commodity Trade Statistics. Http://comtrade.un.org as of October 2008
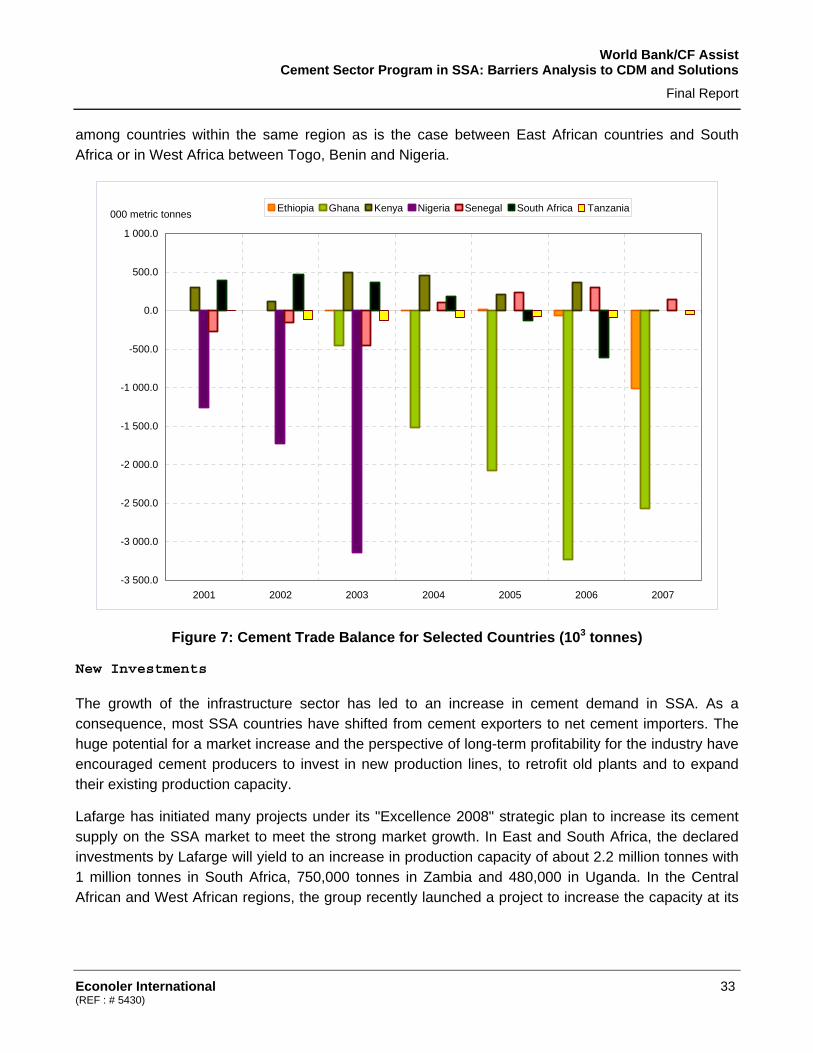
World Bank/CF Assist Cement Sector Program in SSA: Barriers Analysis to CDM and Solutions
Final Report
Econoler International 33 (REF : # 5430)
among countries within the same region as is the case between East African countries and South Africa or in West Africa between Togo, Benin and Nigeria.
-3 500.0
-3 000.0
-2 500.0
-2 000.0
-1 500.0
-1 000.0
-500.0
0.0
500.0
1 000.0
2001 2002 2003 2004 2005 2006 2007
000 metric tonnes Ethiopia Ghana Kenya Nigeria Senegal South Africa Tanzania
Figure 7: Cement Trade Balance for Selected Countries (103 tonnes)
New Investments
The growth of the infrastructure sector has led to an increase in cement demand in SSA. As a consequence, most SSA countries have shifted from cement exporters to net cement importers. The huge potential for a market increase and the perspective of long-term profitability for the industry have encouraged cement producers to invest in new production lines, to retrofit old plants and to expand their existing production capacity.
Lafarge has initiated many projects under its "Excellence 2008" strategic plan to increase its cement supply on the SSA market to meet the strong market growth. In East and South Africa, the declared investments by Lafarge will yield to an increase in production capacity of about 2.2 million tonnes with 1 million tonnes in South Africa, 750,000 tonnes in Zambia and 480,000 in Uganda. In the Central African and West African regions, the group recently launched a project to increase the capacity at its

World Bank/CF Assist Cement Sector Program in SSA: Barriers Analysis to CDM and Solutions
Final Report
Econoler International 34 (REF : # 5430)
grinding plant by 600,000 tonnes in Cameroon while considering a 4-million tonnes capacity expansion project in Nigeria46.
Investment flows in the Nigerian cement industry are boosted by Dangote Cement activities, a subsidiary of the Dangote Group. Dangote Cement benefited from an investment of USD 75 million by the IFC to increase the production capacity of its Obajana Cement plant to 4.4 million tonnes a year47. The company has announced many other projects to increase the cement offered on the Nigerian market. An agreement of USD 1.6 billion was signed with the Chinese firm Sinoma to build six cement production lines in Nigeria. In the short term, Dangote is planning to increase its production capacity in Nigeria from its current 7 Mt to 12 Mt by 201048.
In Senegal, SOCOCIM and Les Ciments du Sahel are increasing their production capacity by adding new production lines of 3,500 and 3,600 tonnes of clinker/day respectively. The two lines will be installed by Polysius and be commissioned in 200949. Les Ciments du Sahel will invest about USD 288 million to increase its total production capacity to 3 Mt/year. Tanzania Portland Cement Company, a subsidiary of Heidelberg, has recently commissioned a new cement mill and packing plant and is building a new kiln line with a precalciner and a 5-stage preheater, which should be operational in 2009.
In Ethiopia, Mugher Cement Enterprise planned to start an expansion of its installed capacity to 2.3 Mt/year from 900,000 tonnes/year in late December 2006. The project was expected to be completed in 2009. National Cement SC planned to increase the capacity at its Dire Dawa plant to about 180,000 tonnes/year from 72,000 tonnes/year. Falath Petroleum Company of Saudi Arabia plans to complete a new cement plant at Melka Jedu with a capacity of about 660,000 tonnes/year in 2009. Midroc Ethiopia Group and Star Business Group plan to build new plants in the Dejen area with capacities of 2.2 Mt/year project financed by IFC and 73,000 tonnes/year, respectively.
46 Lafarge in Kenya and Uganda: a sustainable commitment. Press kit, October 2007. 47http://www.ifc.org/ifcext/africa.nsf/Content/SelectedPR?OpenDocument&UNID=C7F066E2685DE7C885257023005480D9 48 http://www.nigerianbestforum.com/index.php?topic=5232.0 49 Polysius, Rapport Ciment 06/07
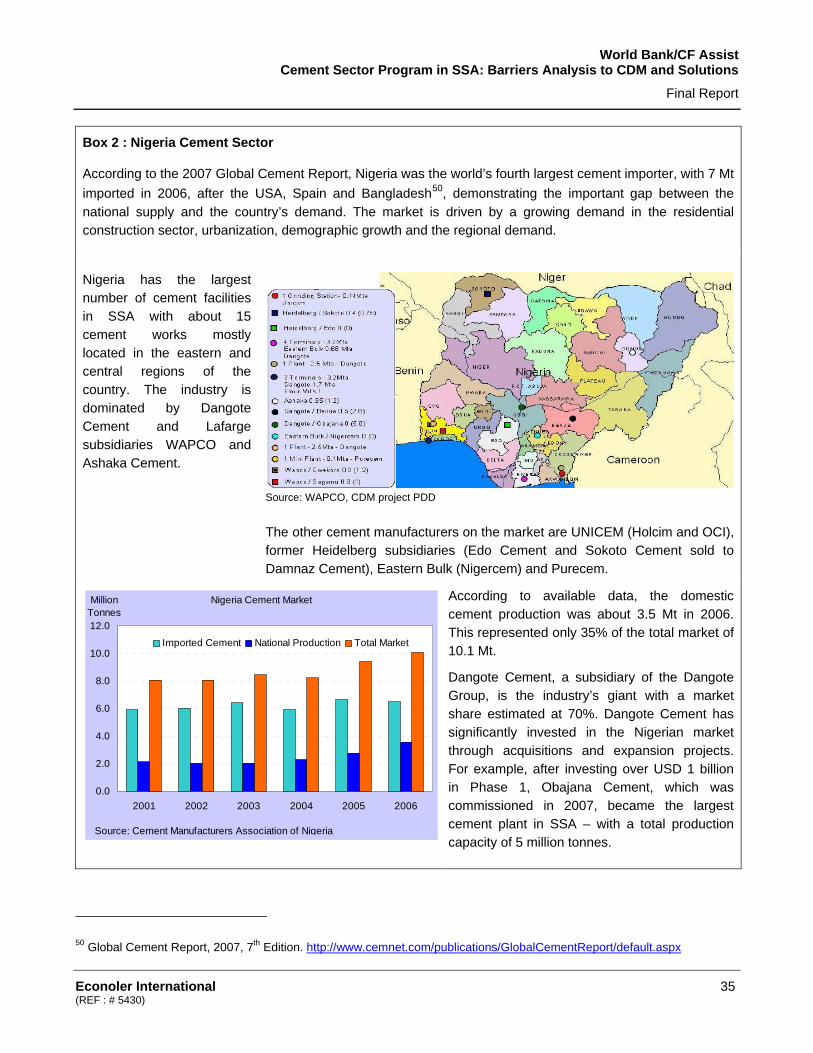
World Bank/CF Assist Cement Sector Program in SSA: Barriers Analysis to CDM and Solutions
Final Report
Econoler International 35 (REF : # 5430)
Box 2 : Nigeria Cement Sector
According to the 2007 Global Cement Report, Nigeria was the world’s fourth largest cement importer, with 7 Mt imported in 2006, after the USA, Spain and Bangladesh50, demonstrating the important gap between the national supply and the country’s demand. The market is driven by a growing demand in the residential construction sector, urbanization, demographic growth and the regional demand.
Nigeria has the largest number of cement facilities in SSA with about 15 cement works mostly located in the eastern and central regions of the country. The industry is dominated by Dangote Cement and Lafarge subsidiaries WAPCO and Ashaka Cement.
Source: WAPCO, CDM project PDD The other cement manufacturers on the market are UNICEM (Holcim and OCI), former Heidelberg subsidiaries (Edo Cement and Sokoto Cement sold to Damnaz Cement), Eastern Bulk (Nigercem) and Purecem.
Nigeria Cement Market
0.0
2.0
4.0
6.0
8.0
10.0
12.0
2001 2002 2003 2004 2005 2006
Million Tonnes
Imported Cement National Production Total Market
Source: Cement Manufacturers Association of Nigeria
According to available data, the domestic cement production was about 3.5 Mt in 2006. This represented only 35% of the total market of 10.1 Mt.
Dangote Cement, a subsidiary of the Dangote Group, is the industry’s giant with a market share estimated at 70%. Dangote Cement has significantly invested in the Nigerian market through acquisitions and expansion projects. For example, after investing over USD 1 billion in Phase 1, Obajana Cement, which was commissioned in 2007, became the largest cement plant in SSA – with a total production capacity of 5 million tonnes.
50 Global Cement Report, 2007, 7th Edition. http://www.cemnet.com/publications/GlobalCementReport/default.aspx
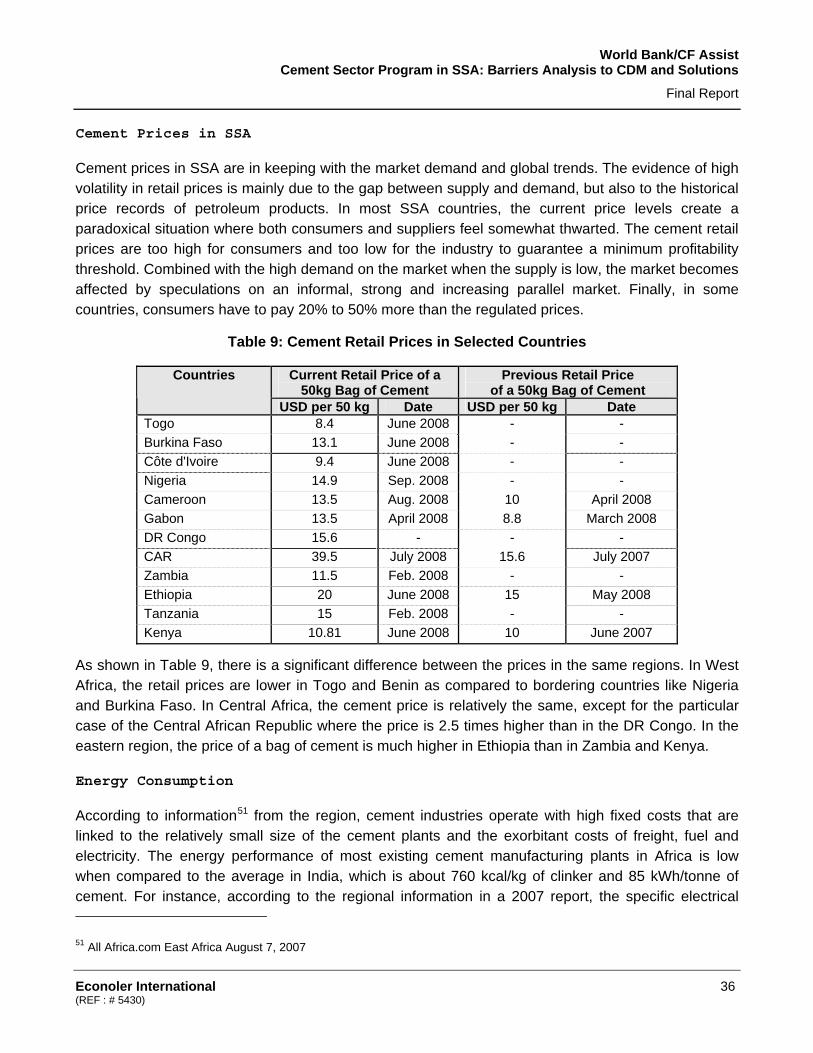
World Bank/CF Assist Cement Sector Program in SSA: Barriers Analysis to CDM and Solutions
Final Report
Econoler International 36 (REF : # 5430)
Cement Prices in SSA
Cement prices in SSA are in keeping with the market demand and global trends. The evidence of high volatility in retail prices is mainly due to the gap between supply and demand, but also to the historical price records of petroleum products. In most SSA countries, the current price levels create a paradoxical situation where both consumers and suppliers feel somewhat thwarted. The cement retail prices are too high for consumers and too low for the industry to guarantee a minimum profitability threshold. Combined with the high demand on the market when the supply is low, the market becomes affected by speculations on an informal, strong and increasing parallel market. Finally, in some countries, consumers have to pay 20% to 50% more than the regulated prices.
Table 9: Cement Retail Prices in Selected Countries
Current Retail Price of a 50kg Bag of Cement
Previous Retail Price of a 50kg Bag of Cement
Countries
USD per 50 kg Date USD per 50 kg Date Togo 8.4 June 2008 - - Burkina Faso 13.1 June 2008 - - Côte d'Ivoire 9.4 June 2008 - - Nigeria 14.9 Sep. 2008 - - Cameroon 13.5 Aug. 2008 10 April 2008 Gabon 13.5 April 2008 8.8 March 2008 DR Congo 15.6 - - - CAR 39.5 July 2008 15.6 July 2007 Zambia 11.5 Feb. 2008 - - Ethiopia 20 June 2008 15 May 2008 Tanzania 15 Feb. 2008 - - Kenya 10.81 June 2008 10 June 2007
As shown in Table 9, there is a significant difference between the prices in the same regions. In West Africa, the retail prices are lower in Togo and Benin as compared to bordering countries like Nigeria and Burkina Faso. In Central Africa, the cement price is relatively the same, except for the particular case of the Central African Republic where the price is 2.5 times higher than in the DR Congo. In the eastern region, the price of a bag of cement is much higher in Ethiopia than in Zambia and Kenya.
Energy Consumption
According to information51 from the region, cement industries operate with high fixed costs that are linked to the relatively small size of the cement plants and the exorbitant costs of freight, fuel and electricity. The energy performance of most existing cement manufacturing plants in Africa is low when compared to the average in India, which is about 760 kcal/kg of clinker and 85 kWh/tonne of cement. For instance, according to the regional information in a 2007 report, the specific electrical 51 All Africa.com East Africa August 7, 2007

World Bank/CF Assist Cement Sector Program in SSA: Barriers Analysis to CDM and Solutions
Final Report
Econoler International 37 (REF : # 5430)
energy consumption in Lafarge’s East Africa cement plants was about 105 kWh/tonne of cement and the specific thermal energy consumption was 900 to 1000 kcal/kg of clinker.
Table 10: Specific Energy Consumption in Selected Cement Plants in Sub-Saharan Africa
Cement Plants Specific Electrical Energy Consumption (kWh/tonne cement)
Specific Thermal Energy Consumption
(kcal/kg clinker) Bamburi Lafarge - Kenya, Uganda, Tanzania
105 900 – 1000
EAPCC - Kenya 140 933.5 Athi River Mining - Tanzania 105 820 Cimenterie de Lukala (CILU) – DR Congo - 800 Cimenterie Nationale (CINAT) – DR Congo 122 950
3.2 BARRIERS ANALYSIS TO CDM PROJECTS IN THE SSA CEMENT SECTOR
The barriers to CDM project development in the African context have been intensively treated by various studies and experts. One of the key barriers to CDM development in Africa is the high transaction costs of project development due to a lack of local capacity and the reluctance of the private sector to invest in a new and so innovative mechanism. Such costs are unaffordable for many project developers, which prevents them from considering the CDM in spite of all its benefits. Others barriers that are commonly mentioned include, among other things, i) the lack of favorable business environment and policy framework; ii) the limited access to finance by potential developers; iii) the financial intermediaries’ lack of knowledge about CDM; iv) the lack of trained local CDM consultants; v) the unfavorable investment climate; vi) limited budgets for DNA operations. Many other institutional and legal barriers are also to be considered while developing CDM projects in the African context. These barriers could be very strong and impede the investment to leverage for project development and implementation.
In the specific case of SSA’s cement sector (excluding South Africa), some of the listed barriers may apply such as the limited awareness of industry decision-makers, the lack of local CDM consultants, the unfavorable investment climate and limited budgets for DNAs (resulting in a lack of assistance to project developers). These barriers are external to the cement industry, but may affect CDM project development in the sector.
The field missions and telephone interviews conducted during this study have brought to light specific barriers that impede CDM project development in the cement sector. These specific barriers are described below and are followed by proposed mitigation measures.

World Bank/CF Assist Cement Sector Program in SSA: Barriers Analysis to CDM and Solutions
Final Report
Econoler International 38 (REF : # 5430)
Cement Manufacturers’ Priorities versus CDM
Overall, it appeared that the CDM is not a priority for the cement units as they were comparatively more preoccupied with capacity expansions and other issues like quality control and cost reduction. The unprecedented demand for cement over the recent years is such that the attention of top management is focused on capacity expansions, efficient management and quality issues. Naturally, the CDM has been put on the back burner in view of the perceived project development risks and the long project cycle duration.
Moreover, the high opportunity costs for developing CDM projects combined with the risk of project rejection and the high initial capital cost for acquiring clean technologies are perceived by managers to be unnecessary financial burdens on the company when the need is more on capacity increasing with tangible outputs.
1. Weakness of CDM Capacity and Awareness of Industry Managers about CDM
The “low level of awareness amongst project sponsors and investors, particularly local top management” regarding the CDM is considered as the first barrier. In general, the study team found that there is a vague knowledge about CDM acquired during workshops and conferences amongst the technical managers. However, the situation varies from country to country.
At the plant level, CDM awareness was found as very high among some of the cement manufacturers especially when there had been an initiative to develop CDM projects. In these cases, the technical managers have had the opportunity to learn from these experiences. For the other plants, the awareness was very low and often confused with current environment management in cement industry. Many cement units were not aware of the CDM process in their country because of weaker CDM promotion by the DNA and priorities oriented towards production and plants operation.
The critical situation is at the top management level. Most of the time, managers who should normally decide to bring their companies around the CDM process, are not willing to listen and understand more about CDM which they assimilate to a very far away goal to achieve, compared with conventional business, which outputs are tangible. Once the decision-makers are convinced about CDM benefits and the added value for their business, the decision to finance opportunity studies, CDM development and investments costs will be straightforward. The situation is exacerbated by the lack of technical capacity and human resources dedicated to energy and environment management in the plants. As a comparison, most industries in India have a plant energy manager certified by the Bureau of energy efficiency that is in charge of looking at energy savings opportunities including CDM in link with the environment department.
During field missions, many units reported to have been approached through capacity building projects where they had no control over the timeframe of the projects or the project deliverables. They also complained about the lack of continuity in the capacity building initiatives and real assistance for CDM project development.
World Bank/CF Assist Cement Sector Program in SSA: Barriers Analysis to CDM and Solutions
Final Report
Econoler International 39 (REF : # 5430)
In addition, many countries lack the technologies and human resources required to provide technical advice in the area of CDM such as quality assurance for the clinker in blended cement or for cogeneration and heat recovery projects. The added investments and extra efforts required to build technical capacities and skills are often perceived by cement companies as a burden on their normal operations. In addition to having to acquire and install new equipment, launching a blended cement project usually requires an R&D effort. The extensive pre-market testing that is needed — both internally and externally — may discourage CDM project implementation52.
Mitigation measures: The starting point for CDM development in the cement sector should be a targeted capacity building and awareness of top management and decision-makers on CDM benefits based on demonstration cases and study tours. The capacity of plants’ technical managers will also need to be enhanced focusing on specific CO2 emissions reduction technologies and energy conservation measures in the cement industry.
2. Lack of Local Capacity to Undertake Clean Technology Projects
The success of CDM in India is partly due to quantity and quality of local CDM consultants, but also engineering firms and professionals capable to carry out energy audits. The efforts of technologies suppliers to assist their clients (industries) in identifying energy savings and GHG emissions reduction opportunities have facilitated CDM projects development in India.
In most SSA countries (except South Africa), there is a lack of capable local consultants and engineering firms to develop CDM projects particularly in its methodological aspects including establishing baseline and monitoring plan and demonstrating additionality. The small size of the market does not foster the creation of a CDM local capacity and technology suppliers’ network that can be in a position to promote clean technologies. In a well established energy efficiency market, local consultants and equipment vendors can propose energy and costs saving measures through energy audits and performance contracting as part of their current business.
Besides, SSA imports most of its efficient technologies in contrast with India, where local technology providers are able to add to the dynamics of the market and facilitate the implementation of projects.
Mitigation Measure: The cement industry needs to evolve in a context where it could find locally skilled and qualified consultants to carry out energy audits and other technical studies to assess energy savings potential and CDM opportunities. Previous capacity building efforts were too theoretical and not based on real cases where participants and local consultants can learn by developing projects themselves through learning by doing. As an example, UNEP Risoe and DANIDA are financing CDM projects preparation under the CDM Green Facility Project in six SSA countries directly giving local consultants the responsibility to identify projects and prepare PINs and PDDs.
52 Christophe De Gouvello, Felix B. Dayo and Massamba Thioye. 2008. Low-carbon Energy Projects for Development in
Sub-Saharan Africa, Unveiling the Potential, Addressing the Barriers. The International Bank for Reconstruction and Development/The World Bank

World Bank/CF Assist Cement Sector Program in SSA: Barriers Analysis to CDM and Solutions
Final Report
Econoler International 40 (REF : # 5430)
Such approach should be extended to countries where the potential exists for CDM project development in the cement sector.
3. Unavailability of Upstream Information and Benchmark Needed for CDM Projects Development
The lack of official information publicly available on the sector and/or on the economic activities is found as one of the difficult barriers to CDM projects development. This barrier is applicable not only to the cement sector, but also to all energy projects including energy generation and energy savings. When compared to India where CDM-related data are available (technical data gathered though many studies, benchmark, power sector emissions baseline and energy efficiency manuals for the cement industry), Africa demonstrates a lack of basic information to better understand the sector’s energy usage and identify energy savings opportunities. Data related to CDM projects could be grouped into three categories: energy sector plan, benchmark and energy audits and other technical studies.
• The lack of an energy sector plan is more related to government institutions and DNA that makes the calculation of emission factors difficult. The absence of official and publicly available information concerning the financial and the economic sector also makes the demonstration and the assessment of additionnality challenging.
• Benchmarking does not exist in the SSA cement sector. The cement units are often aware that their energy costs are high compared to new/modern plants; however, they do not know exactly to what extent can the cost be reduced as they do not have any benchmark from the region or other countries like India. The lack of benchmark concerns also specific technologies such as cement blending where strong R&D and marketing efforts are needed.
• In most plants there were no recent technical studies conducted to assess the energy reduction potential. Energy costs reduction actions are often securing fuel supply and switching from costly heavy fuel oil to coal based only on supply cost. Energy audits is not systematically carried out in the plants to identify energy wastages and waste heat recovery potential. During field missions, only EAPCC in Kenya has carried out preliminary audits to assess the possibility to recover and use the waste heat in the kiln.
Mitigation Measure: Filling the gap of basic information needed for CDM project development will require specific actions to facilitate knowledge exchange between the SSA cement sector and their counterparts from other regions, especially Asia. It will also have to encourage best practices information sharing between industries through benchmarking efforts, particular technical assistance to assess the potential for energy savings and CDM in selected cement plant. These selected cement plants should at first be different from those affiliated to multinationals, which can develop internal capacity with minimum assistance.
4. Lack of Demonstration Cases in the Cement Sector
Since early 2000, the international community has identified the lack of institutional and technical capacity as one of the main issues that impede the participation of Africa in the CDM. The approach

World Bank/CF Assist Cement Sector Program in SSA: Barriers Analysis to CDM and Solutions
Final Report
Econoler International 41 (REF : # 5430)
used till now is more based on workshops, conferences and short-term assistance without significant improvement when compared to the number of projects developed in other developing countries. It was not based on effective support from project ideas to registration where local consultants are involved and capacity is built on the real case.
The lack of close-up demonstration cases that could bring success stories in the country or region did not bring trust of project developers in CDM.
Mitigation Measure: Capacity building cannot materialize or be implemented only through workshops, conferences and lectures. Participants need to be intrinsically familiarized with real projects through a “learning by doing approach”; i.e. by performing (or contributing to) the exercise itself in order to build up skills. It will be important to assist selected cement plants to develop their project throughout the entire project cycle including technical assessment of CDM opportunities, PDD development and validation and registration by linking plants staff with local and international consultants. Importance should be given to dissemination of success stories and sharing of benchmark and best practices.
5. Market Acceptability and Technological Constraints for Blended Cement
One of the main barriers to reducing clinker content in cement manufacturing across SSA involves the acceptance by consumers of blended cement as a substitute for OPC. Even if many plants in Africa (Cameroon, Benin, Côte d’Ivoire, etc.) are already using blended cement because of its cost-effectiveness, the current share of clinker (more than 80%) is still offering opportunities to increase the content of alternative materials. For this to result in a valid CDM project, one has to clearly demonstrate that the modification will increase the blend above the region or country benchmark.
Blended cement strength is normally lower than OPC’s and is indicated by the grade (for example a grade 33 has lower compression strength than a grade 43 and 53). For lower grade cement, it is cheaper, more energy friendly, and less CO2 intensive to use a blended cement with a lower clinker/cement (down to 0.65 with limestone or pozzolana addition) ratio than to use an OPC cement (minimum 0.9 or 0.95 depending of the country's cement quality standards). In the case of slag cement widely used in Eastern India, close to the steel industry blast furnaces, early strengths are normally lower than OPC strengths but longer term strengths (at or after 28 days) may be higher.
Traditionally, consumers have been using OPC, which dominates the cement market across the region. Their aversion to switching from OPC to blended cement is based on the fact that the strength of blended cement is inferior to those of OPC. The introduction of blended cement in the market needs R&D and marketing efforts to design a product acceptable by consumers.
In general, the technologies and human resources that are available are insufficient to trigger an increase in the quality of clinker and improve quality assurance policies in the production of blended cement. Technologies for the transfer of equipment and for building the capacity/skills in the countries are needed and this requires investments and extra efforts.
World Bank/CF Assist Cement Sector Program in SSA: Barriers Analysis to CDM and Solutions
Final Report
Econoler International 42 (REF : # 5430)
Mitigation Measure: Developing a blended cement project needs the setting up of baseline benchmark based on regional and/or national common practices. Market acceptability of blended cement could need market segmentation based on the end usage of cement. It could be very dangerous to introduce lower quality range products in SSA which, while being well adapted to small rural construction (over 2/3rd of the needs in SSA), could be misused in higher rise buildings or infrastructure works (to save cost) with dire consequences. The use of blended cement should be established with strong standards. The needed research and development efforts can build on works already carried out in other countries by adopting or adapting a proven standard. Blended cement CDM projects in SSA should also try to pay due attention to demonstration of additionnality and monitoring issues since shortcomings in these areas have led to rejection of blended cement projects, most notably in India.
3.3 PARALLEL BETWEEN THE INDIAN AND SSA CEMENT INDUSTRIES
While interesting lessons could be learned from CDM projects development in the Indian cement sector, it should be noted that big differences could appear between the Indian situation and the SSA cement industry.
First, India is a country with an estimated population of 1.15 billion people and a national policy applying to all states. Decisions and acts taken at the central government level are translated in action plans at states level. Sub-Saharan Africa has an estimated population of 800 million living in 47 different countries with different policies and priorities. Even regional organizations exist; the decisions and policies directives taken at these organization levels are not efficiently reflected in national policies and strategies, particularly in the energy sector.
Second, in the particular case of the cement sector, there are 140 large and 365 mini cement plants in India compared to some 75 cement units in SSA with less than 15 large plants. Besides, capacity utilization is beyond 94% in India and 54% in SSA (excluding South Africa). The per capita consumption shows also a big difference between India and SSA with 140 kg and 70 kg respectively. The parallel presented in the following table attempts to capture the particularity of India and SSA based on selected factors that may favor or hinder CDM projects development in the cement industry.
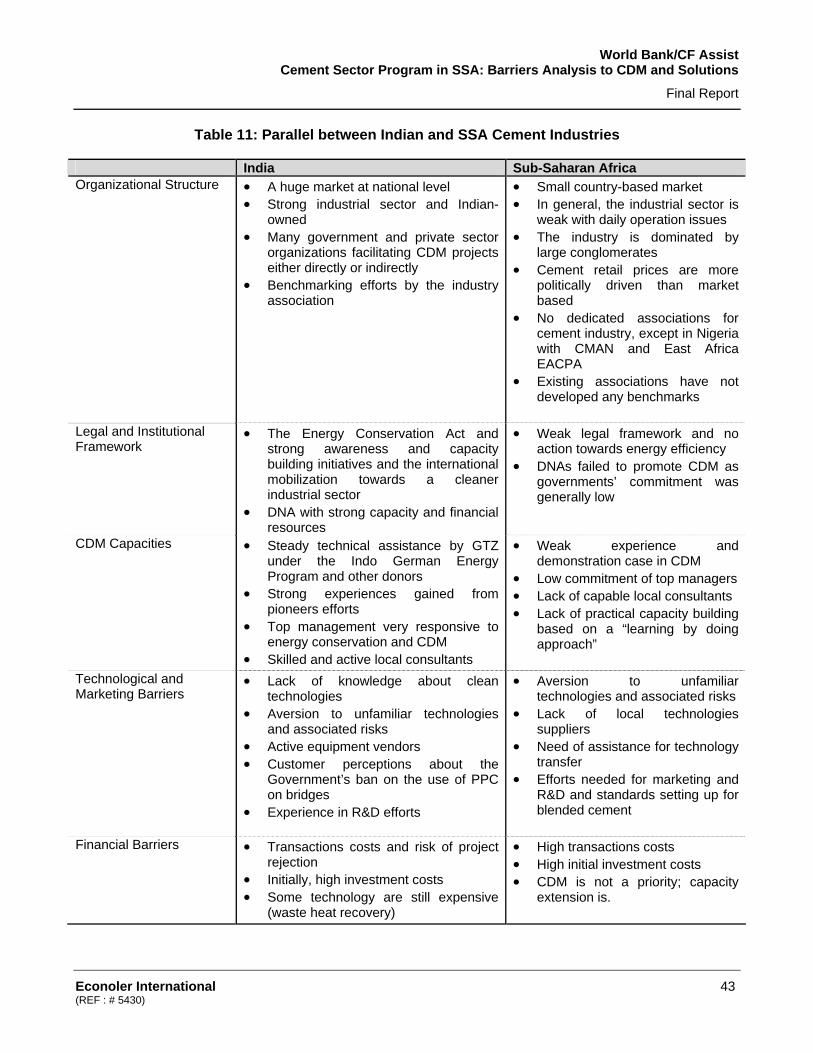
World Bank/CF Assist Cement Sector Program in SSA: Barriers Analysis to CDM and Solutions
Final Report
Econoler International 43 (REF : # 5430)
Table 11: Parallel between Indian and SSA Cement Industries
India Sub-Saharan Africa Organizational Structure • A huge market at national level
• Strong industrial sector and Indian-owned
• Many government and private sector organizations facilitating CDM projects either directly or indirectly
• Benchmarking efforts by the industry association
• Small country-based market • In general, the industrial sector is
weak with daily operation issues • The industry is dominated by
large conglomerates • Cement retail prices are more
politically driven than market based
• No dedicated associations for cement industry, except in Nigeria with CMAN and East Africa EACPA
• Existing associations have not developed any benchmarks
Legal and Institutional Framework
• The Energy Conservation Act and strong awareness and capacity building initiatives and the international mobilization towards a cleaner industrial sector
• DNA with strong capacity and financial resources
• Weak legal framework and no action towards energy efficiency
• DNAs failed to promote CDM as governments’ commitment was generally low
CDM Capacities • Steady technical assistance by GTZ under the Indo German Energy Program and other donors
• Strong experiences gained from pioneers efforts
• Top management very responsive to energy conservation and CDM
• Skilled and active local consultants
• Weak experience and demonstration case in CDM
• Low commitment of top managers • Lack of capable local consultants • Lack of practical capacity building
based on a “learning by doing approach”
Technological and Marketing Barriers
• Lack of knowledge about clean technologies
• Aversion to unfamiliar technologies and associated risks
• Active equipment vendors • Customer perceptions about the
Government’s ban on the use of PPC on bridges
• Experience in R&D efforts
• Aversion to unfamiliar technologies and associated risks
• Lack of local technologies suppliers
• Need of assistance for technology transfer
• Efforts needed for marketing and R&D and standards setting up for blended cement
Financial Barriers • Transactions costs and risk of project rejection
• Initially, high investment costs • Some technology are still expensive
(waste heat recovery)
• High transactions costs • High initial investment costs • CDM is not a priority; capacity
extension is.

World Bank/CF Assist Cement Sector Program in SSA: Barriers Analysis to CDM and Solutions
Final Report
Econoler International 44 (REF : # 5430)
4 CDM OPPORTUNITIES IN THE SSA CEMENT SECTOR
4.1 REVIEW OF CDM PROJECTS PORTFOLIO IN AFRICA
CDM Project Pipeline
As of January 1, 2009, 4,367 projects were recorded worldwide in the CDM project pipeline and 1,300 projects were registered by CDM EB. An overview of the portfolio is summarized in Table 12. The total volume of emission reductions to be generated by these projects is about 596.5 MtCO2e, of which 243.2 MtCO2e will stem from registered projects. Most of the projects developed so far are located in Latin America (19.2%) and the Asia and Pacific region (76.5%). India’s share alone represents about 26.5% of the global project portfolio and 15.8% of the total CERs.
Table 12: CDM Projects Portfolio per Region as of January 1, 2009
Total Projects in the Pipeline
Registered Projects Projects at Issuance Stage
Number kCERs Number kCERs Number kCERs Latin America 837 80 159 389 41 885 160 40 202 Asia & Pacific w/o India&China 573 58 552 127 24 884 25 43 059 India 1 158 94 019 379 32 989 165 54 145 China 1 608 332 406 352 131 849 84 99 994 Europe and Central Asia 43 4 077 10 387 0 0 Africa 90 18 894 28 7 161 5 2 913 Middle-East 55 8 366 15 4 087 2 42 Total 4 364 596 473 1 300 243 242 441 240 355
African participation in the CDM is very weak when compared to the similar regions of Latin America and Asia. From the global CDM projects portfolio, only 90 (2%) were located in Africa of which 27 are registered and only 4 are at the CER issuance stage. In terms of volume, the expected amount of CERs from the African CDM projects portfolio is about 19 million tCO2 per year. The registered volume represents 7 million tonnes of CO2, only 2.9% of the total volume registered worldwide.
The breakdown and analysis of project distribution within Africa shows that currently 15 countries in Africa have at least one project in the pipeline. South Africa ranks first with 27 projects out of 90, followed by Egypt (12 projects), Morocco (10 projects), Uganda (8 projects) and Kenya (7 projects). The 26 remaining projects are located in 14 countries. In terms of regional distribution, most projects are located in South Africa and North Africa with, respectively, 30 projects and 24 projects. East Africa follows with 16 projects, whereas West Africa has recorded 9 projects. Central Africa and the Indian Ocean region (Madagascar and Mauritius) have 2 projects in each region.
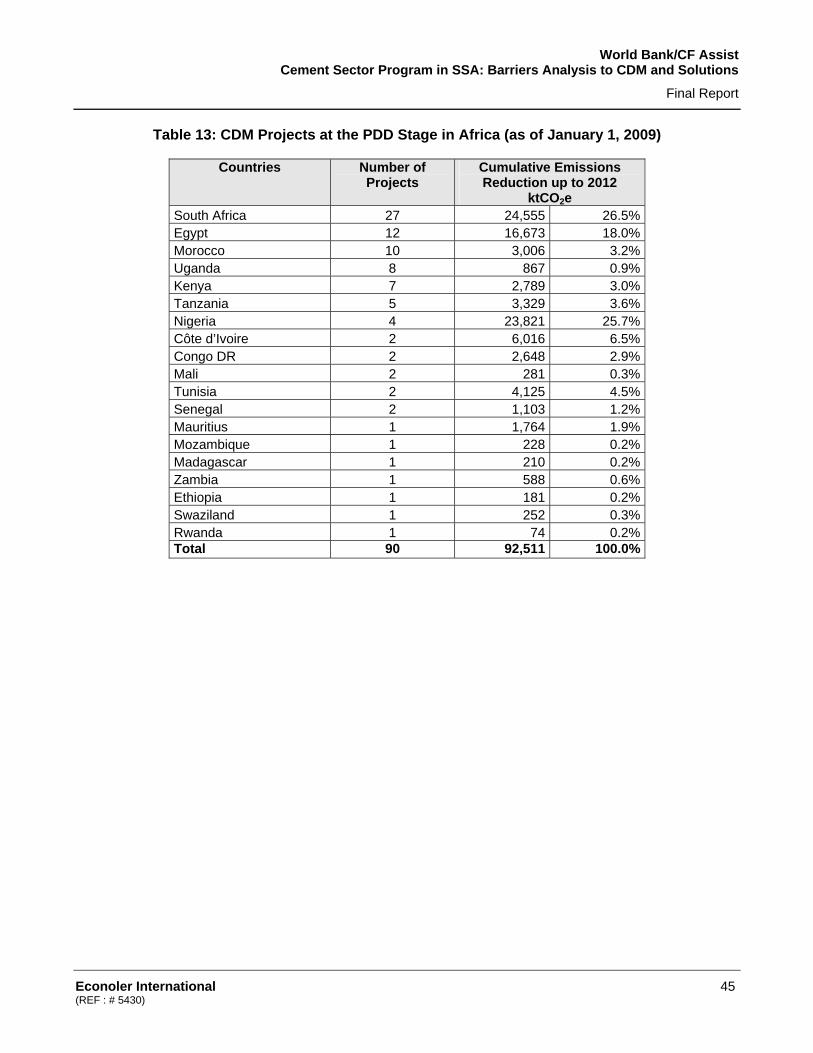
World Bank/CF Assist Cement Sector Program in SSA: Barriers Analysis to CDM and Solutions
Final Report
Econoler International 45 (REF : # 5430)
Table 13: CDM Projects at the PDD Stage in Africa (as of January 1, 2009)
Countries Number of Projects
Cumulative Emissions Reduction up to 2012
ktCO2e South Africa 27 24,555 26.5% Egypt 12 16,673 18.0% Morocco 10 3,006 3.2% Uganda 8 867 0.9% Kenya 7 2,789 3.0% Tanzania 5 3,329 3.6% Nigeria 4 23,821 25.7% Côte d’Ivoire 2 6,016 6.5% Congo DR 2 2,648 2.9% Mali 2 281 0.3% Tunisia 2 4,125 4.5% Senegal 2 1,103 1.2% Mauritius 1 1,764 1.9% Mozambique 1 228 0.2% Madagascar 1 210 0.2% Zambia 1 588 0.6% Ethiopia 1 181 0.2% Swaziland 1 252 0.3% Rwanda 1 74 0.2% Total 90 92,511 100.0%

World Bank/CF Assist Cement Sector Program in SSA: Barriers Analysis to CDM and Solutions
Final Report
Econoler International 46 (REF : # 5430)
Figure 8: Geographical Distribution of CDM Projects in Africa (as of January 1, 2009)
The breakdown of registered projects shows that among the 27 projects registered as of January 2009, South Africa owns 14, while Morocco owns 4, Egypt: 4 and Tunisia: 2; the remaining three countries (Nigeria, Tanzania and Uganda) have 1 project each. It should be noted that only 4 registered projects are located in SSA, excluding South Africa, and that the share of SSA francophone countries is nil.
However, two interesting lessons can be drawn from the CDM pipeline. The first is the increase observed in the trend of CDM project development in Africa. The number of projects per year has increased from 2 projects in 2004 to 38 in 2008. The second interesting fact is that new countries have

World Bank/CF Assist Cement Sector Program in SSA: Barriers Analysis to CDM and Solutions
Final Report
Econoler International 47 (REF : # 5430)
joined the list of ones that have submitted projects for registration. Most of these new countries are francophone: Congo Democratic Republic, Mali, Senegal, Madagascar, and Côte d’Ivoire.
Number of Projects Submitted for Validation from Africa as of Jan. 1, 2009
2
13
19 18
38
0
5
10
15
20
25
30
35
40
2004 2005 2006 2007 2008Years
Figure 9: Number of CDM Projects Submitted for Validation per Year in Africa
The increase in the number of projects located in Africa and the participation of new countries in the mechanism is not sufficient to conclude that there is an enhancement of the CDM context in the host countries, but this is nevertheless a great achievement that could boost emission reduction projects in the countries and the region.
A technology breakdown of the African CDM portfolio is presented in Figure 10. Renewable energy (hydro, geothermal, wind, solar, tidal) accounts for the majority of projects (40%) developed in Africa to date. Landfill projects follow with a 23% share of the pipeline. Energy efficiency and fuel switching projects respectively account for 13 percent and 8 percent.

World Bank/CF Assist Cement Sector Program in SSA: Barriers Analysis to CDM and Solutions
Final Report
Econoler International 48 (REF : # 5430)
Number of Projects in Africa by Type
Landfill etc23%
Supply-side EE7%
Fuel switch8%
Afforestation & Reforestation
11%Demand-side EE
6%Renewables
40%
HFC & N2O reduction
6%
Figure 10: Breakdown of CDM Project in Africa by Type (as of Jan. 1, 2009)
The classification per project type changes drastically when the volume of CERs is used as the main criterion. Landfill projects generate 52% of the total volume; HFC&NO2 and renewable energy follow with respectively 18% and 16%. Energy efficiency represents 5% of the volume and fuel switching, 5 percent.
Africa’s Share in the Carbon Market Transactions
According to a World Bank report on the state and trends of the global carbon market, the market had more than doubled to USD 64 billion in 2007 from USD 31.2 billion in 200653. The market is still largely driven by the European Union Emission Trading System (EU ETS) market, which alone accounted for USD 50 billion in 2007. The transactions value of project-based markets (CDM, JI, voluntary market, etc.) was USD 13.6 billion in 2007 (USD 6.5 billion in 2006). CDM accounted for the vast majority of project-based transactions, at 87% of the volume and 91% of the values.
The primary global CDM transactions represented USD 7.4 billion in 2007 for a transacted volume of 551 MtCO2e. China was the largest seller, and expanded its CDM transactions’ market share to 73%. Brazil and India, at a 6% market share each, transacted the highest volumes after China. Compared to their position in the CDM pipeline, India and Brazil have a relatively low transactions’ market share. Project sponsors in these two countries are expecting to sell CERs issued at the highest price instead of selling forward CER streams. The strategy is to retain CERs till attractive prices are available on the market, in the range of €15-16.50.
53 The World Bank, 2008. State and Trends of the Carbon Market 2008

World Bank/CF Assist Cement Sector Program in SSA: Barriers Analysis to CDM and Solutions
Final Report
Econoler International 49 (REF : # 5430)
Africa ranks fourth with 5% of the transaction market. Projects in Africa have been contracted to supply about 50 MtCO2e to the market so far, with more than 20MtCO2e transacted in 2007 alone. Among the number of countries that joined the project pipeline for the first time, SSA countries have emerged: Kenya, Uganda, and Nigeria. Although they account for a much smaller share of the primary CDM market, they reported sharp increases in transaction volumes.
4.2 ONGOING CDM INITIATIVES IN THE SSA CEMENT INDUSTRY
Most of cement factories operating in Africa are owned by big conglomerates. While these conglomerates have committed to environmental sustainability by undertaking CO2 emissions reduction projects in their plants located in Annex I countries and in India, such projects have not been registered in Africa. However, some encouraging initiatives have recently been observed in many SSA cement plants.
Three CDM projects developed by cement plants located in Africa have been recently submitted for registration. SOCOCIM, a subsidiary of Vicat in Senegal, has developed a fuel switching project using Jatropha plantations and biomass residues. WAPCO, a Lafarge operation in Nigeria, has initiated a blended cement project at its Shagamu Cement and Ewekoro Cement Plants. CEMEX Assuit Cement in Egypt has requested the partial substitution of fossil fuels’ registration by renewable plantation biomass and biomass residues. See Boxes Box 6 and Box 7 for the SOCOCIM and WAPCO projects.
The emissions reduction potential in the African cement sector is still untapped. As demonstrated by the CDM project developed by WAPCO in Nigeria, more than 1.2 million tonnes of CO2 can be reduced by increasing the additives content of cement produced in two cement plants. The projects initiated by SOCOCIM in Senegal and CEMEX in Egypt also indicate an interesting potential for reducing GHG emissions using alternative fuels including biomass residues and plantation biomass.
Many other initiatives should also be mentioned. In East Africa, Lafarge owns four cement plants that are undertaking CDM projects. Three of the projects are for fuel substitution: one at the Hima Cement Plant (Uganda), a bundled project at the Bamburi Cement plants in Nairobi and Mombasa (Kenya) and a project at the Mbeya Cement Plant (Tanzania). The fourth is for increasing the pozzolona content at Bamburi Cement, Nairobi. The East Africa Portland Cement Company Ltd (EAPCC), a Kenyan government-owned cement facility, just completed a PDD for a CDM project for limestone reduction in clinker using substitute raw materials and applying the AM0033 methodology. The project validation is pending.
Other CDM projects prospects identified during the field missions conducted during the study are listed in the following table. The barriers for developing these projects will need to be assessed individually.
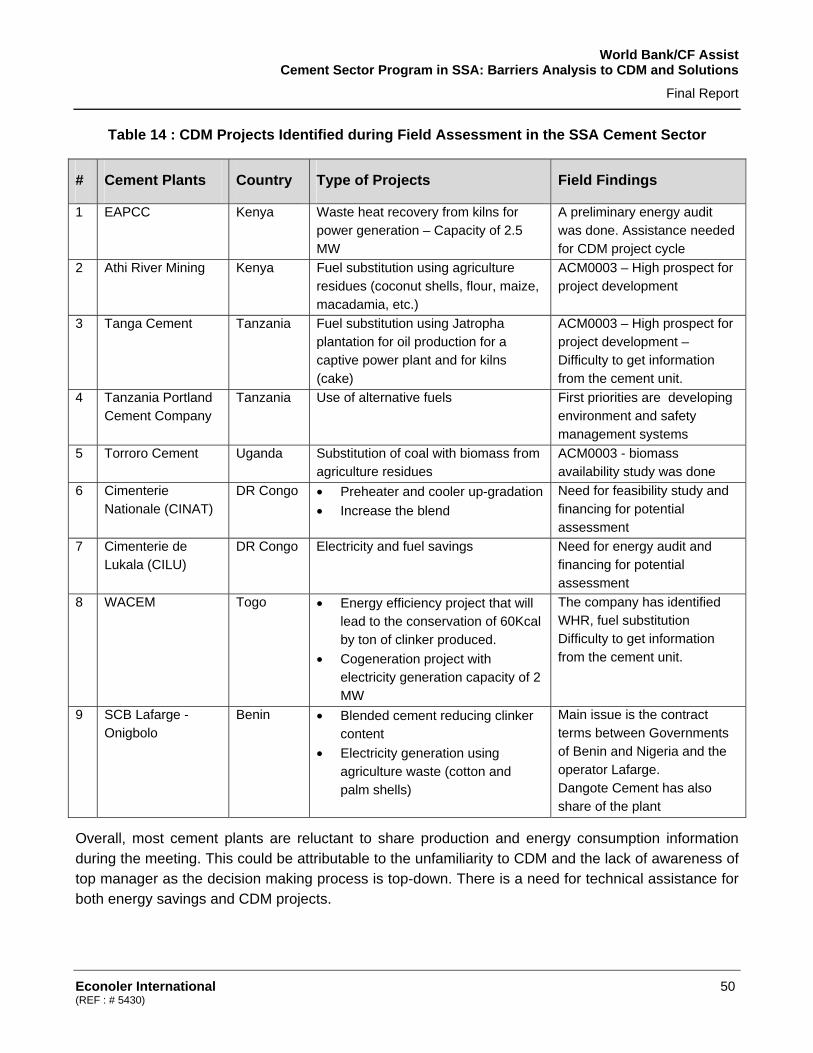
World Bank/CF Assist Cement Sector Program in SSA: Barriers Analysis to CDM and Solutions
Final Report
Econoler International 50 (REF : # 5430)
Table 14 : CDM Projects Identified during Field Assessment in the SSA Cement Sector
# Cement Plants Country Type of Projects Field Findings
1 EAPCC Kenya Waste heat recovery from kilns for power generation – Capacity of 2.5 MW
A preliminary energy audit was done. Assistance needed for CDM project cycle
2 Athi River Mining Kenya Fuel substitution using agriculture residues (coconut shells, flour, maize, macadamia, etc.)
ACM0003 – High prospect for project development
3 Tanga Cement Tanzania Fuel substitution using Jatropha plantation for oil production for a captive power plant and for kilns (cake)
ACM0003 – High prospect for project development – Difficulty to get information from the cement unit.
4 Tanzania Portland Cement Company
Tanzania Use of alternative fuels First priorities are developing environment and safety management systems
5 Torroro Cement Uganda Substitution of coal with biomass from agriculture residues
ACM0003 - biomass availability study was done
6 Cimenterie Nationale (CINAT)
DR Congo • Preheater and cooler up-gradation • Increase the blend
Need for feasibility study and financing for potential assessment
7 Cimenterie de Lukala (CILU)
DR Congo Electricity and fuel savings Need for energy audit and financing for potential assessment
8 WACEM Togo • Energy efficiency project that will lead to the conservation of 60Kcal by ton of clinker produced.
• Cogeneration project with electricity generation capacity of 2 MW
The company has identified WHR, fuel substitution Difficulty to get information from the cement unit.
9 SCB Lafarge - Onigbolo
Benin • Blended cement reducing clinker content
• Electricity generation using agriculture waste (cotton and palm shells)
Main issue is the contract terms between Governments of Benin and Nigeria and the operator Lafarge. Dangote Cement has also share of the plant
Overall, most cement plants are reluctant to share production and energy consumption information during the meeting. This could be attributable to the unfamiliarity to CDM and the lack of awareness of top manager as the decision making process is top-down. There is a need for technical assistance for both energy savings and CDM projects.

World Bank/CF Assist Cement Sector Program in SSA: Barriers Analysis to CDM and Solutions
Final Report
Econoler International 51 (REF : # 5430)
4.3 CEMENT MANUFACTURING PROCESS AND CDM OPPORTUNITIES
Cement Manufacturing Process
This section aims at providing an overview of the cement-making process and describes the opportunities for CDM projects. The Figure 12 lists the principal processes involved in cement manufacture.
There are three main steps in cement manufacturing: i) the preparation of raw materials, ii) the production of clinker (a crucial intermediate product), and iii) the blending of clinker with additives and other products. Raw materials are usually found close to cement mills as transportation costs are to be kept low. These raw materials are prepared (crushed, grounded or mixed) and fed into a pre-heater or pre-calciner. After preparation of raw materials, they are transported to a kiln for “pyro-processing”. The result is an aggregation of particles into what is called “clinker”. Fuel-driven “pyro-processing” is the most resource intensive process of the whole manufacture (85%), followed by cement grinding (8%), raw material grinding (4%) and electric pyro-processing (3%). The breakdown of energy consumption is illustrated in the following figure.
Figure 11: Energy use of different steps
The main energy source for pyro-processing is non-renewable energy such as coal or fuel oil. GHG is released during high temperature carbonate calcinations in the raw materials in the kiln and from fuel combusted in the kiln to produce energy for the calcinations reaction. GHG emissions also stem from electrical energy used for rotating the kiln, for cement grinding and in other handling equipments. All in all, per tonne of clinker produced, “approximately half of emissions are process-related
World Bank/CF Assist Cement Sector Program in SSA: Barriers Analysis to CDM and Solutions
Final Report
Econoler International 52 (REF : # 5430)
(decarbonisation of limestone in the calcination process) and the other half are energy-related (fuel combustion and, to a much lesser extent, electricity use)”54.
54 OECD/IEA 2001, op cit.
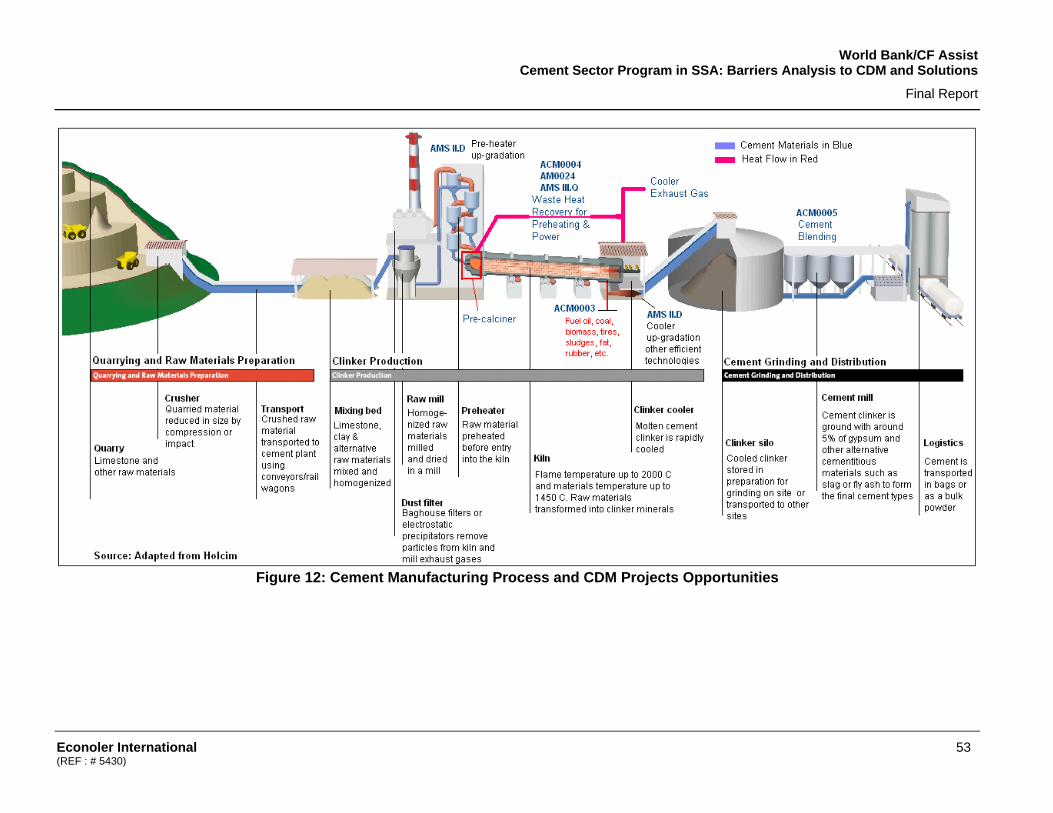
World Bank/CF Assist Cement Sector Program in SSA: Barriers Analysis to CDM and Solutions
Final Report
Econoler International 53 (REF : # 5430)
Figure 12: Cement Manufacturing Process and CDM Projects Opportunities

World Bank/CF Assist Cement Sector Program in SSA: Barriers Analysis to CDM and Solutions
Final Report
Econoler International 54 (REF : # 5430)
It is important to note the difference between “dry” and “wet” processing of raw materials to produce clinker. Obviously, wet processing of raw materials requires more energy than the dry process since water absorbs an important quantity of energy in evaporating. Nowadays, wet processing of materials has been largely phased-out. The share of wet process in the African cement industry was estimated at 66% in a 2002 publication by WBCSD. Wet process and semi-dry process represented respectively 24% and 9%55.
Finally, the blending of clinker with other materials is a key issue. Directly, the process of blending is not resource-intensive (compared, at least, with “pyro-processing”). However, since the production of clinker is resource-intensive, the specific blend a mill chooses has a considerable effect on energy usage. For instance, the production of Ordinary Portland Cement, which contains 95% clinker, will be more resource-intensive than Portland composite cement, which can contain as low as 20% clinker.
CDM Opportunities in the Cement Sector
Cement manufacturing is energy and GHG emissions intensive. GHG emissions can be dramatically decreased through low emission cement processing as well as reducing the energy input or energy source. CDM possibilities pertain more or less to the different phases of the whole manufacturing process, as shown in Figure 12. Four types of possible projects are described in the table hereafter. These are: waste heat recovery and use, fuel switching or substitution, increasing the blend of additives and energy efficiency.
55 WBCSD, 2002 and, IEA estimates.

World Bank/CF Assist Cement Sector Program in SSA: Barriers Analysis to CDM and Solutions
Final Report
Econoler International 55 (REF : # 5430)
Table 15: CDM Projects Opportunities in the Cement Sector
Type of projects Applicable Approved
Methodologies
Description of Applicable Technologies Opportunities Challenges
Waste Heat Recovery
AM0024 ACM0012 ACM0004 AMS III.Q
Waste heat currently vented at precalciner and/or at the cooler end of kiln could be captured to preheat raw materials and fuel at the existing plant or for electricity generation using heat recovery boilers and generation units. The electricity generated can be either used within the plant or fed to the grid.
The potential could be interesting, especially in a context where energy cost is high and supply is unreliable 1 MW results in reduction of 5000 tonnes of CO2/annum CO2 abatement cost at US$50/tCO2
Can be used only with 4 Stage/ 5 Stage preheater kilns and with coolers High capital cost of around US$ 1 to 5 million per MW
Alternative fuels ACM0003 ACM0002 AM0049 AMS I.D
Several CDM methodologies pertain to the switch in fuel source. In less resource-intensive processes such as grinding, electricity can be provided by renewable sources rather than by conventional fuel oil generation. In the resource-intensive pyro-processing, fuel can be partly replaced by alternative fuels such as gas or unconventional mass (tires, plastics, textiles from polymers, or rubber, etc.)
Solve the problem of solid wastes by efficient waste management. Potential for substituting small percentage of fossil fuel by biomass. Opportunities for using waste tyres, non hazardous industrial waste, industrial sludges CO2 abatement cost between US$ 4 to 12 /tCO2
National regulations for using alternative fuels Uncertainty about biomass and biomass residues availability and supply
Blended cement ACM0005 Blended cement is produced by increasing the proportion of additives, such as limestone, pozzolana and fly ash in the fine grinding process, thereby reducing the clinker content. The implication is that, for each tonne of cement, less clinker is required and thus fewer raw materials to be calcinated, resulting in lower CO2 emissions. Reducing CO2-emitting raw material input and reducing the clinker intensity of cement are both powerful ways to generate emission reductions.
Every tonne of PPC reduces gross CO2 emission by 20% (from 0.83 t to 0.66 t/t of cement) Every tonne of PSC reduces CO2 emission by 45% ( from 0.83 t to 0.55 t / t of cement) Blending material like fly ash /slag are industrial wastes and are difficult to dispose. CO2 abatement cost between US$4.38 to 6.24/tCO2
UNFCCC has been rejecting blended cement projects, mainly from India under additionality criteria Negative perception of blended cement for construction of bridges and dams.
Energy Efficiency AMS II.D Multitechnologies options including: upgradation of preheater, upgrading a clinker cooler, optimization in grinding media, automatic control, and variable speed drives efficient motors, etc.
Directly or indirectly reduces the consumption of fossil fuels Major opportunities lie in cooler and preheater where energy measurement is possible only by heat balance method available. CO2 abatement cost of around US$24/tCO2 (for preheater up-gradation)
Approved Methodology for large Scale Energy Efficiency does not exist The heat balance method has not been accepted to by CDM Meth Panel and EB has refused to register such projects.

World Bank/CF Assist Cement Sector Program in SSA: Barriers Analysis to CDM and Solutions
Final Report
Econoler International 56 (REF : # 5430)
4.4 QUANTITATIVE ANALYSIS OF EMISSIONS REDUCTION POTENTIAL
Determining the emissions reduction potential of each type of CDM project activity is a challenging task in the context of SSA cement sector where there is a lack of official, publicly available information on the sector and/or on economic activities in general. Moreover, there was a reluctance to share basic data needed for CDM projects development among cement plants met or contacted during the study. When aggregate numbers are found (such as global output of countries or factories), crucial information is nonetheless often lacking (factory processes, baseline cement blend, production rate, baseline equipment efficiency, type and availability of alternative fuels, etc.). Also, factors such as efficiency of new installations, fuel used for kilns and capacity of kilns are all important in determining the amount of reductions per factory but are often impossible to gather. In fact, every factory, depending on its size, production and efficiency, has a different potential for emission reductions. The following analyses are thus based on highly aggregated data and posit some assumptions. Caution should be used when interpreting these results: they represent maximum technical possibility of CDM projects.
Energy Efficiency Projects
The scope of energy efficiency projects in the cement industry is very large. It encompasses system up-gradation, specific technologies such as variable speed drives, motors, compressed air, ventilators as well as process control and energy management system. The study team found on the ground that almost all cement plants contacted have not carried out detailed energy audits in the recent past as energy audits is not required by national laws in contrary to India where the Energy Conservation Act required periodic energy audits for energy intensive facilities. While the industry sector is commonly seen as a significant sink for energy savings, very few studies were conducted on this issue. The study team investigated energy savings potential based on a set of assumptions described hereafter.
As shown in Table 10 (section 4.1), the specific thermal energy consumption in the SSA ranged between 800 and 1,000 kcal/kg of clinker and the specific electricity consumption varied between 105 and 140 kWh/tonne of cement. Most of the cement plants from India surveyed during this study target a specific electrical energy consumption of 85 to 90 kWh/tonne of cement and a specific thermal energy consumption of 750 kcal/kg of clinker. Giving these data from some SSA cement plants, values of 900 kcal/kg of clinker and 120 kWh/tonne of cement were considered for energy saving potential determination. Furthermore, the target for specific energy consumption was set up at 750 kcal/kg of clinker and 90 kWh/tonne of cement. This means that overall, a technical potential for thermal energy savings of 200 kcal/kg of clinker (21%) in clinker production and electricity savings of 30 kWh/tonne of cement (25%) could be assumed. The potential for CO2 emission reductions was derived from the calculated energy savings assuming that fuel combusted in kilns are either coal or HFO. GHG emission reductions due to electricity savings were estimated based on countries’ grids emission factors taken from RETScreen GHG tool and PDD developed in countries like Côte d’Ivoire, Nigeria,
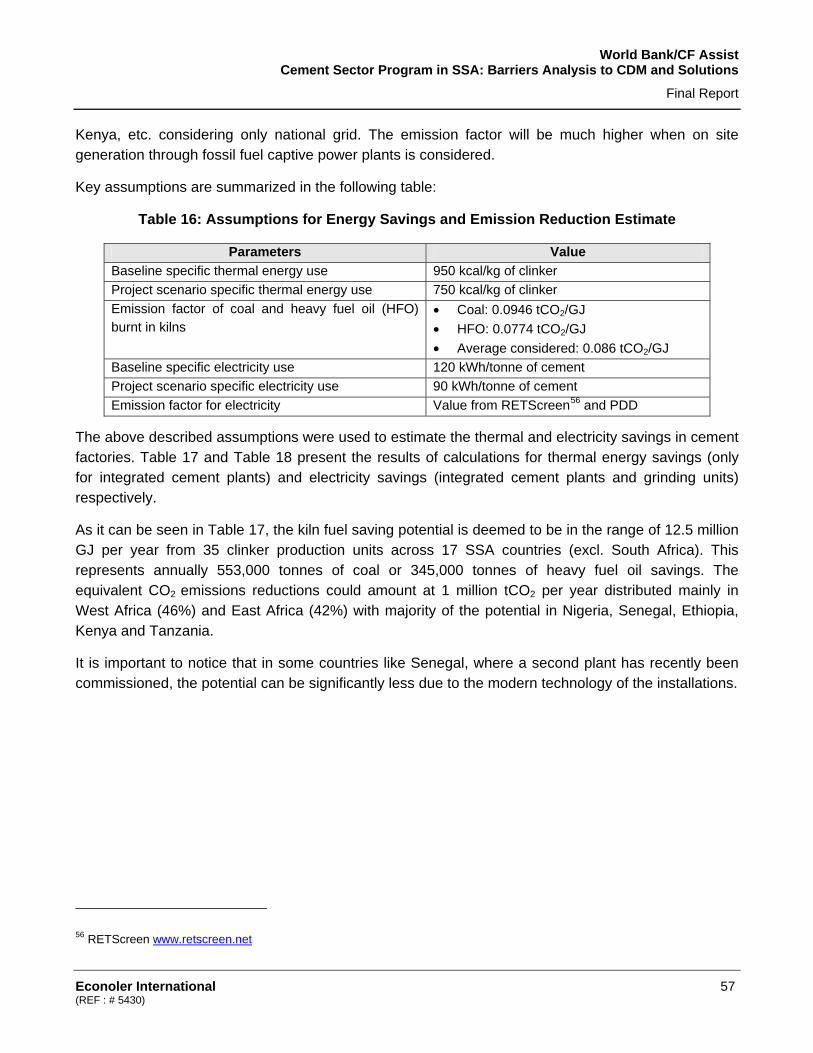
World Bank/CF Assist Cement Sector Program in SSA: Barriers Analysis to CDM and Solutions
Final Report
Econoler International 57 (REF : # 5430)
Kenya, etc. considering only national grid. The emission factor will be much higher when on site generation through fossil fuel captive power plants is considered.
Key assumptions are summarized in the following table:
Table 16: Assumptions for Energy Savings and Emission Reduction Estimate
Parameters Value Baseline specific thermal energy use 950 kcal/kg of clinker Project scenario specific thermal energy use 750 kcal/kg of clinker Emission factor of coal and heavy fuel oil (HFO) burnt in kilns
• Coal: 0.0946 tCO2/GJ • HFO: 0.0774 tCO2/GJ • Average considered: 0.086 tCO2/GJ
Baseline specific electricity use 120 kWh/tonne of cement Project scenario specific electricity use 90 kWh/tonne of cement Emission factor for electricity Value from RETScreen56 and PDD
The above described assumptions were used to estimate the thermal and electricity savings in cement factories. Table 17 and Table 18 present the results of calculations for thermal energy savings (only for integrated cement plants) and electricity savings (integrated cement plants and grinding units) respectively.
As it can be seen in Table 17, the kiln fuel saving potential is deemed to be in the range of 12.5 million GJ per year from 35 clinker production units across 17 SSA countries (excl. South Africa). This represents annually 553,000 tonnes of coal or 345,000 tonnes of heavy fuel oil savings. The equivalent CO2 emissions reductions could amount at 1 million tCO2 per year distributed mainly in West Africa (46%) and East Africa (42%) with majority of the potential in Nigeria, Senegal, Ethiopia, Kenya and Tanzania.
It is important to notice that in some countries like Senegal, where a second plant has recently been commissioned, the potential can be significantly less due to the modern technology of the installations.
56 RETScreen www.retscreen.net
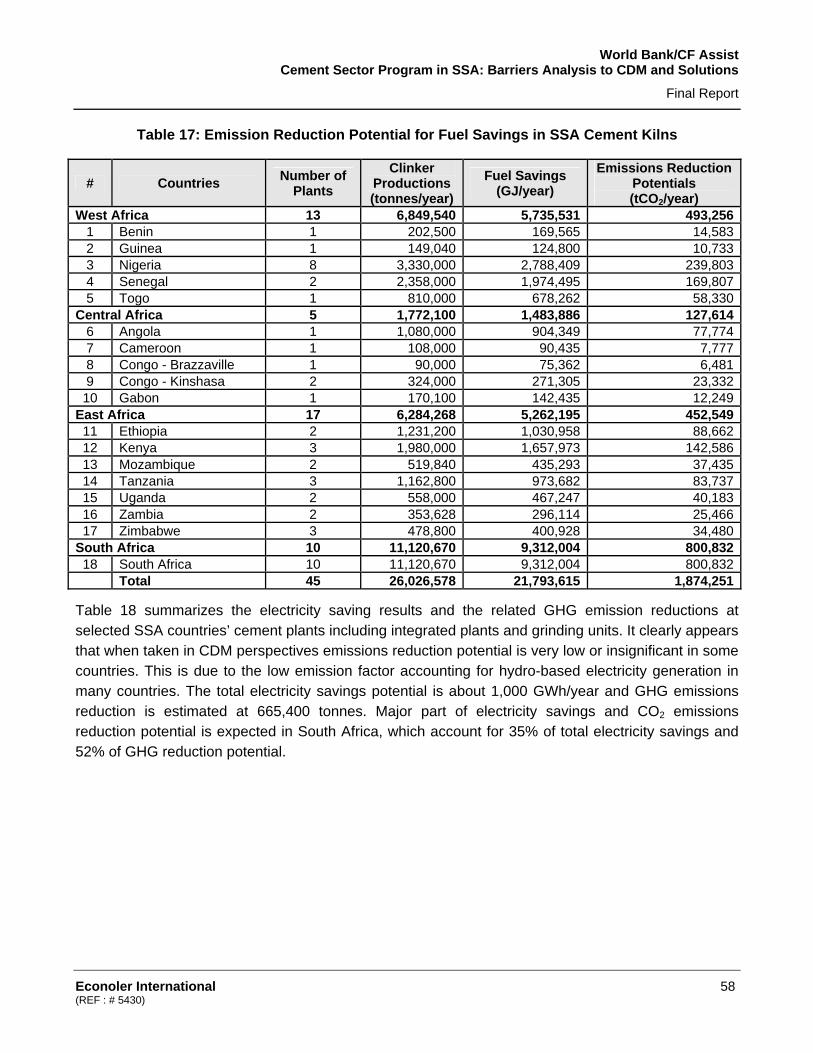
World Bank/CF Assist Cement Sector Program in SSA: Barriers Analysis to CDM and Solutions
Final Report
Econoler International 58 (REF : # 5430)
Table 17: Emission Reduction Potential for Fuel Savings in SSA Cement Kilns
# Countries Number of Plants
Clinker Productions (tonnes/year)
Fuel Savings (GJ/year)
Emissions Reduction Potentials (tCO2/year)
West Africa 13 6,849,540 5,735,531 493,2561 Benin 1 202,500 169,565 14,5832 Guinea 1 149,040 124,800 10,7333 Nigeria 8 3,330,000 2,788,409 239,8034 Senegal 2 2,358,000 1,974,495 169,8075 Togo 1 810,000 678,262 58,330
Central Africa 5 1,772,100 1,483,886 127,6146 Angola 1 1,080,000 904,349 77,7747 Cameroon 1 108,000 90,435 7,7778 Congo - Brazzaville 1 90,000 75,362 6,4819 Congo - Kinshasa 2 324,000 271,305 23,33210 Gabon 1 170,100 142,435 12,249
East Africa 17 6,284,268 5,262,195 452,54911 Ethiopia 2 1,231,200 1,030,958 88,66212 Kenya 3 1,980,000 1,657,973 142,58613 Mozambique 2 519,840 435,293 37,43514 Tanzania 3 1,162,800 973,682 83,73715 Uganda 2 558,000 467,247 40,18316 Zambia 2 353,628 296,114 25,46617 Zimbabwe 3 478,800 400,928 34,480
South Africa 10 11,120,670 9,312,004 800,83218 South Africa 10 11,120,670 9,312,004 800,832
Total 45 26,026,578 21,793,615 1,874,251
Table 18 summarizes the electricity saving results and the related GHG emission reductions at selected SSA countries’ cement plants including integrated plants and grinding units. It clearly appears that when taken in CDM perspectives emissions reduction potential is very low or insignificant in some countries. This is due to the low emission factor accounting for hydro-based electricity generation in many countries. The total electricity savings potential is about 1,000 GWh/year and GHG emissions reduction is estimated at 665,400 tonnes. Major part of electricity savings and CO2 emissions reduction potential is expected in South Africa, which account for 35% of total electricity savings and 52% of GHG reduction potential.
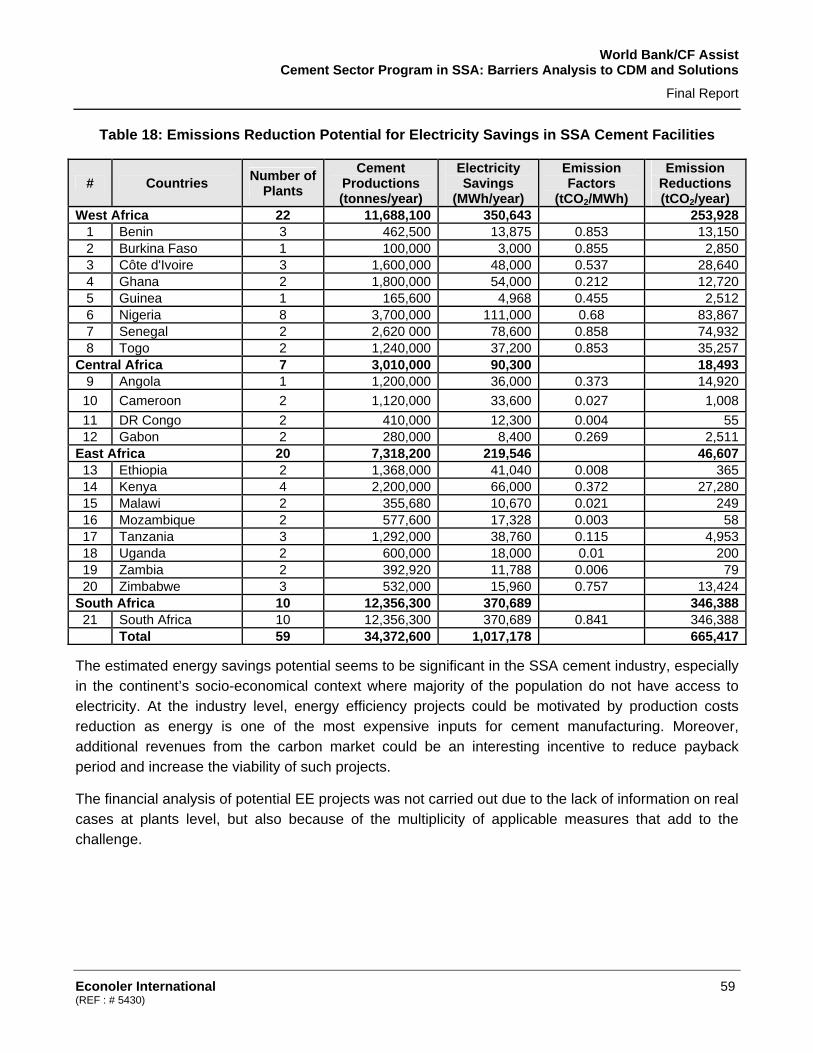
World Bank/CF Assist Cement Sector Program in SSA: Barriers Analysis to CDM and Solutions
Final Report
Econoler International 59 (REF : # 5430)
Table 18: Emissions Reduction Potential for Electricity Savings in SSA Cement Facilities
# Countries Number of Plants
Cement Productions (tonnes/year)
Electricity Savings
(MWh/year)
Emission Factors
(tCO2/MWh)
Emission Reductions (tCO2/year)
West Africa 22 11,688,100 350,643 253,9281 Benin 3 462,500 13,875 0.853 13,1502 Burkina Faso 1 100,000 3,000 0.855 2,8503 Côte d'Ivoire 3 1,600,000 48,000 0.537 28,6404 Ghana 2 1,800,000 54,000 0.212 12,7205 Guinea 1 165,600 4,968 0.455 2,5126 Nigeria 8 3,700,000 111,000 0.68 83,8677 Senegal 2 2,620 000 78,600 0.858 74,9328 Togo 2 1,240,000 37,200 0.853 35,257
Central Africa 7 3,010,000 90,300 18,4939 Angola 1 1,200,000 36,000 0.373 14,92010 Cameroon 2 1,120,000 33,600 0.027 1,00811 DR Congo 2 410,000 12,300 0.004 5512 Gabon 2 280,000 8,400 0.269 2,511
East Africa 20 7,318,200 219,546 46,60713 Ethiopia 2 1,368,000 41,040 0.008 36514 Kenya 4 2,200,000 66,000 0.372 27,28015 Malawi 2 355,680 10,670 0.021 24916 Mozambique 2 577,600 17,328 0.003 5817 Tanzania 3 1,292,000 38,760 0.115 4,95318 Uganda 2 600,000 18,000 0.01 20019 Zambia 2 392,920 11,788 0.006 7920 Zimbabwe 3 532,000 15,960 0.757 13,424
South Africa 10 12,356,300 370,689 346,38821 South Africa 10 12,356,300 370,689 0.841 346,388
Total 59 34,372,600 1,017,178 665,417
The estimated energy savings potential seems to be significant in the SSA cement industry, especially in the continent’s socio-economical context where majority of the population do not have access to electricity. At the industry level, energy efficiency projects could be motivated by production costs reduction as energy is one of the most expensive inputs for cement manufacturing. Moreover, additional revenues from the carbon market could be an interesting incentive to reduce payback period and increase the viability of such projects.
The financial analysis of potential EE projects was not carried out due to the lack of information on real cases at plants level, but also because of the multiplicity of applicable measures that add to the challenge.
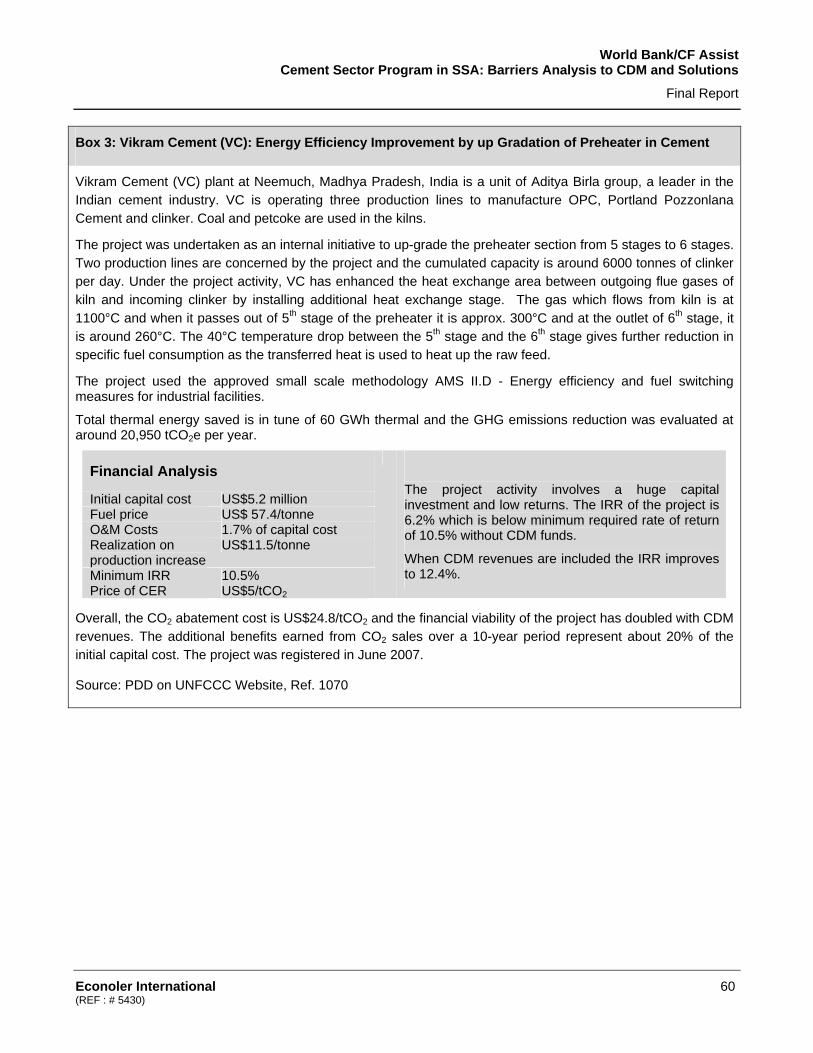
World Bank/CF Assist Cement Sector Program in SSA: Barriers Analysis to CDM and Solutions
Final Report
Econoler International 60 (REF : # 5430)
Box 3: Vikram Cement (VC): Energy Efficiency Improvement by up Gradation of Preheater in Cement
Vikram Cement (VC) plant at Neemuch, Madhya Pradesh, India is a unit of Aditya Birla group, a leader in the Indian cement industry. VC is operating three production lines to manufacture OPC, Portland Pozzonlana Cement and clinker. Coal and petcoke are used in the kilns.
The project was undertaken as an internal initiative to up-grade the preheater section from 5 stages to 6 stages. Two production lines are concerned by the project and the cumulated capacity is around 6000 tonnes of clinker per day. Under the project activity, VC has enhanced the heat exchange area between outgoing flue gases of kiln and incoming clinker by installing additional heat exchange stage. The gas which flows from kiln is at 1100°C and when it passes out of 5th stage of the preheater it is approx. 300°C and at the outlet of 6th stage, it is around 260°C. The 40°C temperature drop between the 5th stage and the 6th stage gives further reduction in specific fuel consumption as the transferred heat is used to heat up the raw feed.
The project used the approved small scale methodology AMS II.D - Energy efficiency and fuel switching measures for industrial facilities.
Total thermal energy saved is in tune of 60 GWh thermal and the GHG emissions reduction was evaluated at around 20,950 tCO2e per year.
Financial Analysis
Initial capital cost US$5.2 million Fuel price US$ 57.4/tonne O&M Costs 1.7% of capital cost Realization on production increase
US$11.5/tonne
Minimum IRR 10.5% Price of CER US$5/tCO2
The project activity involves a huge capital investment and low returns. The IRR of the project is 6.2% which is below minimum required rate of return of 10.5% without CDM funds.
When CDM revenues are included the IRR improves to 12.4%.
Overall, the CO2 abatement cost is US$24.8/tCO2 and the financial viability of the project has doubled with CDM revenues. The additional benefits earned from CO2 sales over a 10-year period represent about 20% of the initial capital cost. The project was registered in June 2007.
Source: PDD on UNFCCC Website, Ref. 1070

World Bank/CF Assist Cement Sector Program in SSA: Barriers Analysis to CDM and Solutions
Final Report
Econoler International 61 (REF : # 5430)
Box 4: Grasim Cement: Energy Efficiency by up-Gradation of Clinker Cooler in Cement Manufacturing
Grasim Cement Raipur (GCR) belongs to Grasim industries limited, Aditya Birla group of companies and manufactures OPC, Portland Pozzonlana Cement and clinker. The production capapcity is around 4300 tonnes a day.
The project activity is to upgrade the clinker cooler for energy efficiency in the cement manufacturing process through the redesigning of the grate system with control impact system and mechanical flow regulator (CIS-MFR) plate type system, which will increase the cooler recuperation efficiency by reduction of heat consumption by 20 kcal/kg of clinker.
GCR has registered this project (in March 2007) under the approved small scale methodology AMS II.D - Energy efficiency and fuel switching measures for industrial facilities. The saving in thermal energy from the project activity is in the tune of 43.3 GWh thermal per annum equivalent to 12,000 tonnes of coal per year.
The expected CO2 emissions reduction was estimated at 15,160 tCO2e per year.
Financial Analysis
Initial capital cost US$0.52 million Fuel price US$ 30.1/tonne O&M Costs 1% of capital cost Administration and insurance cost
4% of the capital investment
Minimum IRR 18% Price of CER US$6.5/tCO2
The project activity involves a huge capital investment and low returns. The IRR of the project is 6.9% which is below minimum required rate of return of 18% without CDM funds.
The minimum required rate of return for the Grasim industries was lower than the prime lending rate (11%) of bank during that time. It improves to 17.7% with CDM funds availed against sale of CERs, which is crossing the internal benchmark of Grasim Industries Limited.
The CO2 abatement cost was US$3.4/tCO2 and the financial viability of the project has significantly improved with CDM revenues. The additional benefits earned from CO2 sales over a 10-year period represent about 20% of the initial capital cost.
Source: PDD on UNFCCC Website, Ref. 858

World Bank/CF Assist Cement Sector Program in SSA: Barriers Analysis to CDM and Solutions
Final Report
Econoler International 62 (REF : # 5430)
Waste Heat Recovery Projects
The assessment of CDM opportunities in waste heat recovery projects relies on data extracted from a recent study conducted for the World Bank57, which deals, inter alia, with emission reductions in SSA’s cement sector, but also on an energy audit report at EAPCC Kenya and a typical project in India. In the World Bank study, a typical “Waste Heat Recovery for Power Generation in a Cement Factory” is analyzed. The following lists the case’s main parameters:
Table 19: Waste Heat Recovery for Power Generation in a Cement Factory57
Parameter Value Unit Industrial capacity (clinker) 2,500 1 clinker/day New waste heat-based generation capacity
13.2 MW
Investment cost 16.3 USD million New power production O&M cost 1.1 USD million Electricity revenue 3.4 USD million CO2 emission reductions 107,000 tCO2/year Carbon revenue 0.64 USD million Total carbon revenue (3 x 7 years) 12.84 USD million IRR without CERs revenue 13.3 % IRR with CERs revenue 17.8 %
It should also be noted that data gathered from the India Cements project (Vishnupuram cement plant) and the energy audit conducted at EAPCC plant in Kenya showed initial investment costs of around USD 3 million for 1 MW power generation capacity and a reduced CO2 cost of USD 48 to USD 51/tCO2e. The example by De Gouvello et al. has an investment cost of USD 1.23 million per MW installed and CO2 reduction cost of USD 15.23/tCO2e over 10 years.
In fact, the cost the installed MW could vary significantly depending on the size of the project (unit cost of large projects is usually lower), the origin of the technology, the local availability of the experts, etc. The unit cost could vary in the range of US$ 1 to 5 million per MW installed.
A capacity reduction ratio is extracted from the De Gouvello et al. case study. Since industrial capacity is given in tonnes of clinker/day, it has to be translated into absolute production in order to be applicable to the national aggregated data found. It is thus assumed, in accordance with qualitative analyses conducted, that SSA cement production (excluding South Africa) is mainly characterised by OPC production. Thus, the clinker-to-cement percentage is established at 90%, meaning that overall, the cement produced in SSA has a 90% clinker component. The assumption that WRH projects are possible for all cement units was also made to simplify the calculations and 300 days of production were taken. This brings the total capacity to 833,000 tonnes of cement yearly for the example shown
57 Christophe De Gouvello, Felix B. Dayo and Massamba Thioye. 2008. Low-carbon Energy Projects for Development in
Sub-Saharan Africa, Unveiling the Potential, Addressing the Barriers. The International Bank for Reconstruction and Development / The World Bank

World Bank/CF Assist Cement Sector Program in SSA: Barriers Analysis to CDM and Solutions
Final Report
Econoler International 63 (REF : # 5430)
in Table 19. Since emission reductions amount to 107,000 tCO2/year, the reduction capacity ratio is of 7.8.
Based on aforementioned assumptions and actual regional cement production, the theoretical potential of total annual emission reductions was derived. There are 45 integrated cement plants of 18 SSA countries that were assessed. The results of this exercise are summarized in Table 20. As can be seen, the theoretical potential of CO2 emission reductions through WHR projects represents 3.7 million tCO2e per annum including South Africa. The total investment required was based on the De Gouvello et al. figures and estimated at USD 564.7 million. When South Africa is excluded, the total CO2 emissions reduction is deemed to be 2.1 Mt per year needing USD 323.4 million to be invested.
Table 20: ER Potential for Waste Heat Recovery CDM Projects in SSA Cement Kilns
# Countries Number of Cement Plants
Installed Capacities
(tonnes/year)
Actual Productions (tonnes/year)
Emissions Reduction Potential
(tCO2/year)
Initial Investments
(USD million)
WEST AFRICA 13 14,210,000 7,610,600 975,718 148.61 Benin 1 450,000 225,000 28,846 4.42 Guinea 1 360,000 165,600 21,231 3.23 Nigeria 8 9,300,000 3,700,000 474,359 72.24 Senegal 2 2,900,000 2,620,000 335,897 51.25 Togo 1 1,200,000 900,000 115,385 17.6
CENTRAL AFRICA 5 3,140,000 1,969,000 252,435.9 38.46 Angola 1 1,500,000 1,200,000 153,846 23.47 Cameroon 1 200,000 120,000 15,385 2.38 Congo - Brazzaville 1 450,000 100,000 12,821 2.09 DR Congo 2 720,000 360,000 46,154 7.010 Gabon 1 270,000 189,000 24,231 3.7EAST AFRICA 17 9,377,000 6,982,520 895,195 136.311 Ethiopia 2 1,800,000 1,368,000 175,385 26.712 Kenya 3 2,650,000 2,200,000 282,051 43.013 Mozambique 2 760,000 577,600 74,051 11.314 Tanzania 3 1,700,000 1,292,000 165,641 25.215 Uganda 2 1,250,000 620,000 79,487 12.116 Zambia 2 51, 000 392,920 50,374 7.717 Zimbabwe 3 700,000 532,000 68,205 10.4SOUTH AFRICA 10 13,145,000 12,356,300 1,584,141 241.318 South Africa 10 13,145,000 12,356,300 1,584,141 241.3 Total 45 39,872,000 28,918,420 3,707,490 564.7
The regional figures presented in the above table (except South Africa) indicate that efforts should be particularly directed towards major cement producing countries such as Nigeria, Senegal and Togo, in West Africa and Ethiopia, Kenya, Tanzania in East Africa. In Central Africa, only Angola is offering interesting opportunities. Obviously, the potential in South Africa is more important (43% of SSA theoretical potential). Despite the interesting potential shown in this assessment, figures should be taken with caution as no energy audit was conducted in fields during this study.

World Bank/CF Assist Cement Sector Program in SSA: Barriers Analysis to CDM and Solutions
Final Report
Econoler International 64 (REF : # 5430)
The aggregation level of the data presented here did not allow any reliable calculation of financial indicators such the internal rate of return (IRR) and the net present value (NPV). Moreover, the calculations do not consider the heat recovery’s actual potential in each plant as the plants were not audited during this study. However, the financial simulation of a real case of WHR project at EAPCC plant in Nairobi Kenya is presented in Box 3.
Box 5: Waste Heat Recovery Project at EAPCC plant in Kenya
East Africa Portland Cement Company (EAPCC) is among the biggest electricity consumers. As such, it has been asked to switch its production activities to night-time to avoid countrywide power failures. Electricity constitutes the most expensive energy input for EAPCC. Hence, EAPCC is considering captive power generation to shift its energy source from grid electricity to coal to cut down power bills and operation costs by 30%.
The electricity from the waste heat recovery unit replaces coal based power plant planned by EAPCC to address electricity shortage faced by the company. EAPCC carried out an audit of the clinker kiln to assess the possibility of cogeneration and the audit report recommended a capacity of 2.5MW. The electricity amount to be generated was estimated at 15 GWh per annum representing about 21 kWh per tonne of cement. The baseline was taken as to be the coal-based power plant.
The technology is new to the country and to the company as WHR has not been tried in the cement industry in Kenya. Besides, the payback is long, over seven years based on the prefeasibility study carried out by Integrated Energy Solutions, Kenya.
Based on the data generated by the preliminary audit, the study team evaluated the CDM opportunity. The project falls under the small-scale project activities eligibility criteria as the installed capacity is less than the size limit of 15 MW. Moreover, the annual electricity to be generated is less than 60 GWh. The initial assessment indicated that the following SSC methodologies could be combined:
• AMS III.Q - Waste Energy Recovery (gas/heat/pressure) projects.
• AMS I.C - Thermal energy for the user with or without electricity.
It was assumed that each MWh produced will displace 1 tCO2e from a coal-based captive plant initially planned by EAPCC. Therefore, the GHG emissions reduction was evaluated at 15,000 tCO2e par year.
Assumptions Financial Indicators
Total project costs
USD 7.7 million Without CER With CER @USD 10/tCO2e
Electricity rates USD 0.1/kWh IRR 9.8% 11.4% O&M Costs 10% of investment costs NPV (USD) - USD 68 729 USD 420 855 Interest rate 10% Income tax 30% Debt ratio 70%
The preliminary financial analysis indicated that the internal return rate (IRR) can be significantly improved when CDM is considered. CDM revenues over a 10-year period represent about 20% of the total investment costs.

World Bank/CF Assist Cement Sector Program in SSA: Barriers Analysis to CDM and Solutions
Final Report
Econoler International 65 (REF : # 5430)
Alternative Fuels and Fuels Switching
It is hardly possible to come up with a clear idea of the CDM potential of SSA with alternative fuels. The reason is straightforward: for any appraisal of fuel switching CDM projects, alternative fuels and replaced fuels must be known. This appraisal will thus rely on generic estimation of CERs generation from the substitution of fossil fuels with alternative fuels in cement plants, in accordance with methodology ACM0003. The estimated CERs generation is taken from a 2007 publication from the Global Environment Centre Foundation/Japanese Ministry of Environment (CER Estimation Toolkit, v.02).
In the baseline scenario, the plant produces cement using the existing technology, materials and fuel mix. The CDM project activity is therefore the replacement of fossil fuels used in cement plant by alternative fuels such as wastes originating from fossil sources (e.g. tires, plastics) and biomass residues in the pre-calciner and the kiln for the production of clinker in cement manufactures. If applicable, the project may also reduce CH4 emissions from preventing disposal or uncontrolled burning of biomass residues.
The following assumptions were made to simplify the potential assessment of alternative fuels use in cement processing based on ACM0003.
Baseline scenario
i) CO2 emissions from the use of fossil fuels replaced by alternative fuels • This value is calculated by multiplying the total actual heat of the alternative fuel (TJ/yr) by CO2
emissions factor of the fossil fuel substituted (tCO2 /TJ). Moisture penalty is neglected for simplicity.
• Heating value of each alternative fuel is assumed to be 0.033 TJ/tonne for tire, 0.042 TJ/tonne for plastic, and 19.5 TJ/tonne for biomass residues.
• The replaced fossil fuel is assumed to be coal whose carbon emission factor is 94.6 tCO2 /TJ (= 25.8tC/TJ) for simplicity.
ii) CH4 emissions from the biomass residues • No emissions from this source are assumed. Note that this emission can be taken into account
only if it is demonstrated that the biomass residues would be burned or decomposed anaerobically in landfills in the absence of the project.
Project scenario
iii) CO2 emissions from the use of alternative fuels • If the project uses waste originating from fossil sources, these emissions need to be considered.
This value is calculated by multiplying the total weight of the alternative fuel (tonne/yr) by its CO2 emissions factor (tCO2 /tonne).
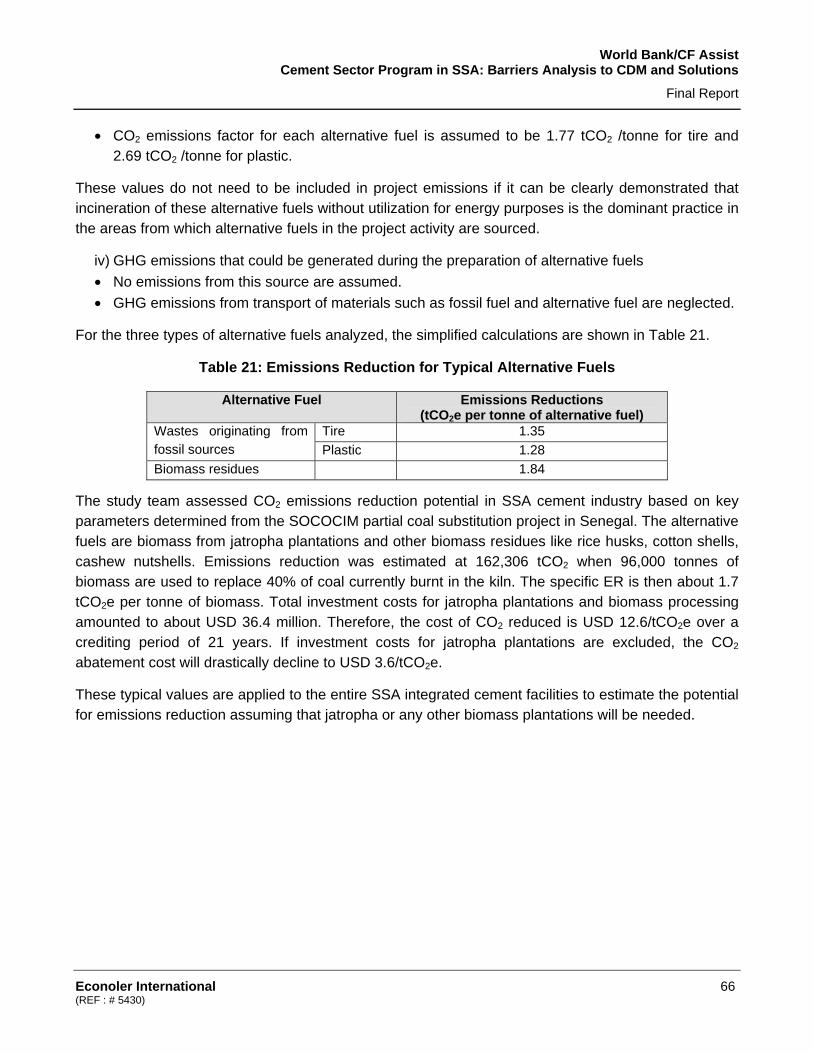
World Bank/CF Assist Cement Sector Program in SSA: Barriers Analysis to CDM and Solutions
Final Report
Econoler International 66 (REF : # 5430)
• CO2 emissions factor for each alternative fuel is assumed to be 1.77 tCO2 /tonne for tire and 2.69 tCO2 /tonne for plastic.
These values do not need to be included in project emissions if it can be clearly demonstrated that incineration of these alternative fuels without utilization for energy purposes is the dominant practice in the areas from which alternative fuels in the project activity are sourced.
iv) GHG emissions that could be generated during the preparation of alternative fuels • No emissions from this source are assumed. • GHG emissions from transport of materials such as fossil fuel and alternative fuel are neglected.
For the three types of alternative fuels analyzed, the simplified calculations are shown in Table 21.
Table 21: Emissions Reduction for Typical Alternative Fuels
Alternative Fuel Emissions Reductions (tCO2e per tonne of alternative fuel)
Tire 1.35 Wastes originating from fossil sources Plastic 1.28 Biomass residues 1.84
The study team assessed CO2 emissions reduction potential in SSA cement industry based on key parameters determined from the SOCOCIM partial coal substitution project in Senegal. The alternative fuels are biomass from jatropha plantations and other biomass residues like rice husks, cotton shells, cashew nutshells. Emissions reduction was estimated at 162,306 tCO2 when 96,000 tonnes of biomass are used to replace 40% of coal currently burnt in the kiln. The specific ER is then about 1.7 tCO2e per tonne of biomass. Total investment costs for jatropha plantations and biomass processing amounted to about USD 36.4 million. Therefore, the cost of CO2 reduced is USD 12.6/tCO2e over a crediting period of 21 years. If investment costs for jatropha plantations are excluded, the CO2 abatement cost will drastically decline to USD 3.6/tCO2e.
These typical values are applied to the entire SSA integrated cement facilities to estimate the potential for emissions reduction assuming that jatropha or any other biomass plantations will be needed.
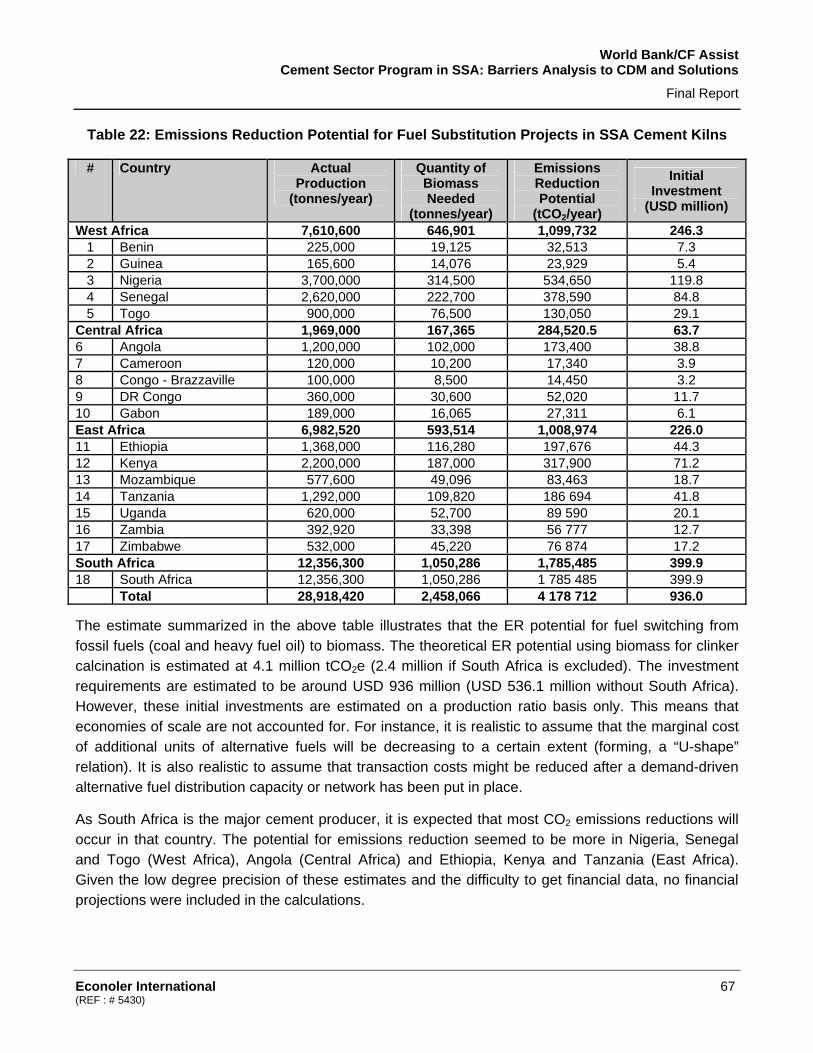
World Bank/CF Assist Cement Sector Program in SSA: Barriers Analysis to CDM and Solutions
Final Report
Econoler International 67 (REF : # 5430)
Table 22: Emissions Reduction Potential for Fuel Substitution Projects in SSA Cement Kilns
# Country Actual Production
(tonnes/year)
Quantity of Biomass Needed
(tonnes/year)
Emissions Reduction Potential
(tCO2/year)
Initial Investment
(USD million)
West Africa 7,610,600 646,901 1,099,732 246.3 1 Benin 225,000 19,125 32,513 7.3 2 Guinea 165,600 14,076 23,929 5.4 3 Nigeria 3,700,000 314,500 534,650 119.8 4 Senegal 2,620,000 222,700 378,590 84.8 5 Togo 900,000 76,500 130,050 29.1
Central Africa 1,969,000 167,365 284,520.5 63.7 6 Angola 1,200,000 102,000 173,400 38.8 7 Cameroon 120,000 10,200 17,340 3.9 8 Congo - Brazzaville 100,000 8,500 14,450 3.2 9 DR Congo 360,000 30,600 52,020 11.7 10 Gabon 189,000 16,065 27,311 6.1 East Africa 6,982,520 593,514 1,008,974 226.0 11 Ethiopia 1,368,000 116,280 197,676 44.3 12 Kenya 2,200,000 187,000 317,900 71.2 13 Mozambique 577,600 49,096 83,463 18.7 14 Tanzania 1,292,000 109,820 186 694 41.8 15 Uganda 620,000 52,700 89 590 20.1 16 Zambia 392,920 33,398 56 777 12.7 17 Zimbabwe 532,000 45,220 76 874 17.2 South Africa 12,356,300 1,050,286 1,785,485 399.9 18 South Africa 12,356,300 1,050,286 1 785 485 399.9 Total 28,918,420 2,458,066 4 178 712 936.0
The estimate summarized in the above table illustrates that the ER potential for fuel switching from fossil fuels (coal and heavy fuel oil) to biomass. The theoretical ER potential using biomass for clinker calcination is estimated at 4.1 million tCO2e (2.4 million if South Africa is excluded). The investment requirements are estimated to be around USD 936 million (USD 536.1 million without South Africa). However, these initial investments are estimated on a production ratio basis only. This means that economies of scale are not accounted for. For instance, it is realistic to assume that the marginal cost of additional units of alternative fuels will be decreasing to a certain extent (forming, a “U-shape” relation). It is also realistic to assume that transaction costs might be reduced after a demand-driven alternative fuel distribution capacity or network has been put in place.
As South Africa is the major cement producer, it is expected that most CO2 emissions reductions will occur in that country. The potential for emissions reduction seemed to be more in Nigeria, Senegal and Togo (West Africa), Angola (Central Africa) and Ethiopia, Kenya and Tanzania (East Africa). Given the low degree precision of these estimates and the difficulty to get financial data, no financial projections were included in the calculations.

World Bank/CF Assist Cement Sector Program in SSA: Barriers Analysis to CDM and Solutions
Final Report
Econoler International 68 (REF : # 5430)
It should be noted that sources of alternative fuels can also be tire, plastic, wasted oil, etc. Each project will need to assess the potential of alternative fuels present in the surroundings of the cement plant, the availability of the resources and the alternative use in the country. As many of SSA countries have vast lands, dedicated energy plantations (jatropha, casurina trees or other species) could be an interesting solution for biomass supply issues as it is being done in Senegal and Egypt.
Box 6: SOCOCIM Partial Substitution of Coal by Jatropha Fruits and Biomass Residues in the Production of Portland Cement58 in Senegal
SOCOCIM INDUSTRIES (Senegal), a member of the VICAT Group since 1999, is an integrated cement manufacturing facility located in Rufisque. The installed capacity for clinker production is 1,350,000 tonnes per year. The cement plant was using coal as fuel for its clinker production and small quantities of heavy fuel oil (HFO) for start up.
The purpose of the CDM project is the partial replacement of a fossil fuel, coal, by Jatropha fruits and biomass residues for combustion in the cement kiln. The project uses the approved consolidated methodology ACM0003.
The project scenario consists of Jatropha nursing, plantation, cultivation, transport and processing in the cement plant to replace about 40% of the imported coal. Total upfront investment for 11,000 ha is estimated at EUR 20 million, and the plant process adaptation will require an additional EUR 8 million.
The transport and process of 300 t/day of Jatropha fruits and other biomass is a major challenge for SOCOCIM INDUSTRIES.
Overall, about 96,000 tonnes of biomass is annually required for the kiln operation. At full implementation, GHG emission reductions were estimated at about 162,000 tCO2e per year.
The project profitability is very low without the sale of CER with a payback of 9.1 years and a return on capital employed (ROCE) of 6.3%, and modest with the inclusion of CER sale (payback of 7.9 years and ROCE of 7.6%).
Source: PDD SOCOCIM at UNFCCC Website Jatropha fruits
58 UNFCC Website, 2008. PDD – SOCOCIM Partial Substitution of Coal by Jatropha Fruits and Biomass Residues in the Production of Portland Cement.

World Bank/CF Assist Cement Sector Program in SSA: Barriers Analysis to CDM and Solutions
Final Report
Econoler International 69 (REF : # 5430)
Blended Cement
This study did not carry out a detailed estimate of OPC production in the 75 cement manufacturing facilities recorded. However, based on the larger number of cement units recorded, it can be assumed that the potential to reduce GHG emissions by increasing the percentage of alternative material is much higher than estimated in the De Gouvello et al. study.
Developing blended cement (BC) projects as a CDM project will require setting up a baseline and demonstrating that the proposed project scenario is additional. The following steps should be followed when applying the ACM 0005 CDM methodology.
Baseline Scenario Determination
ACM0005 adopts the benchmark approach to determine the share of clinker per tonne of BC in baseline scenario. The baseline scenario is the benchmark percentage of available additives such as fly ash, limestone, slag, etc. in the cement currently produced by the plant. The baseline scenario could be the country or regional benchmark for producing blended cement. The baseline is updated each year. The baseline value needs to be determined as the lowest value among the following:
i) The average (weighted by production) mass percentage of clinker for the five highest blend cement brands for the relevant cement type in the region; if the region comprises less than five blend cement brands, the national market should be used as the default region; or
ii) The production weighted average mass percentage of clinker in the top 20% (in terms of share of additives) of the total production of the BC type in the region. If 20% falls on part capacity of a plant, that plant is included in the calculations; or
iii) The mass percentage of clinker in the relevant cement type produced in the proposed project activity plant before the implementation of the CDM project activity, if applicable (for the Greenfield project activity this option may be excluded).
Baseline emissions include: i) CO2 emissions due to clinker production emissions from calcinations of calcium carbonate and magnesium carbonate, combustion of fossil fuels, and electricity use for clinker production; ii) CO2 emissions due to electricity consumption of BC grinding and preparation of additives.
Project Scenario
The project scenario is the increase of additives shared above the baseline benchmark. Project emissions include CO2 emissions due to clinker production, CO2 emissions due to electricity consumption of BC grinding and preparation of additives and emissions due to fuel use for processing and transport of raw materials.

World Bank/CF Assist Cement Sector Program in SSA: Barriers Analysis to CDM and Solutions
Final Report
Econoler International 70 (REF : # 5430)
Demonstration of Additionality
The additionality of a BC project should be undoubtedly substantiated so that the project scenario would not be implemented without CDM due to the weakness of financial viability or analysis of barriers such as i) technological barriers comprising substantial research effort required to enable the increase in blending and the lack of infrastructure for implementation of the technology; ii) institutional barriers to project activity implementation, for example, lack of access to financing; iii) market acceptability barriers including perception that high additive blended cement is of inferior quality and lack of awareness of customers on the use of high additive blended cement.
Simplified calculations of emissions reduction indicate that the amount of CER is proportional to the increased share (%) and annual blended cement production in kt/yr. The increased share is the amount of increase in the percentage of additives in blended cement. This is based on the following assumptions:
• Leakage is neglected (emissions due to raw materials transportation). • CO2 emissions per tonne of clinker is assumed to be 0.900 tCO2/tonne of clinker in baseline and
project scenarios including emissions from calcinations of calcium carbonate and magnesium carbonate, combustion of fossil fuels, and electricity use for clinker production.
• CO2 emissions factor for BC grinding and preparation of additives is assumed to be 0.025 tCO2/tonne of BC in both baseline and project scenarios.
Based on the aforementioned assumptions, the Global Environment Center’s CER Estimation Toolkit59, version 2 of March 2007 calculated CO2 emissions reduction for an increased share of additives in BC as indicated in the table below. Overall, every increased share of 1% in additives is equivalent to 0.009 tCO2e per tonne of BC produced.
Table 23: Relation between Blend Increase and Emissions Reductions
Emissions Reductions (tCO2) Increased Share (%) 1,000 kt BC/year 2,000 kt BC/year 3,000 kt BC/year 10% 90,000 180,000 270,000 20% 180,000 270,000 540,000 30% 270,000 540,000 810,000
De Gouvello, Dayo and Thioye estimated GHG emissions reduction potential of the SSA cement industry using the ACM0005. According to the study, implementing blended cement projects in SSA (including South Africa) can result in 44 projects in OPC production plants spread over the continent. The estimate is based on key assumptions such as a 95 percent clinker content of OPC in the
59 Global Environment Centre - CER Estimation Toolkit, version 2 of March 2007

World Bank/CF Assist Cement Sector Program in SSA: Barriers Analysis to CDM and Solutions
Final Report
Econoler International 71 (REF : # 5430)
baseline and 75 percent clinker content in the project scenario. This represents an increased share of additives of 20 percent. The results are given in Table 24.
Table 24: CDM Opportunities: Shifting from OPC to Blended Cement Production in SSA60
The results of the analysis showed that 44 blended cement CDM projects could be developed in 24 countries using the ACM0005 methodology. When packaged, these projects would yield a total emissions reduction of 2.9 million tCO2 per annum representing 0.105 tCO2 per tonne of cement produced. An estimated USD127 million would be needed to implement these projects leading to a cost of USD 4.38 per tonne of CO2 reduced over a 10-year period.
60 Christophe De Gouvello, Felix B. Dayo and Massamba Thioye. 2008. Low-carbon Energy Projects for Development in
Sub-Saharan Africa, Unveiling the Potential, Addressing the Barriers. The International Bank for Reconstruction and Development / The World Bank

World Bank/CF Assist Cement Sector Program in SSA: Barriers Analysis to CDM and Solutions
Final Report
Econoler International 72 (REF : # 5430)
Box 7: Lafarge Cement WAPCO Blended Cement Project at the Shagamu Cement and Ewekoro Cement Plants in Nigeria 61
The project aims to manufacture and sell a new type of cement (hereafter referred to as “blended cement”) categorized under a new cement standard (Nigerian standard CEM II/A-L 32.5N). The project is being implemented at the two WAPCO Cement production sites located in Shagamu and Ewekoro, both in Ogun State in South West Nigeria. The production capacities of the two cement works are 1.32 million tonnes and 1.0 million tonnes of cement per year for Sagamu and Ewekoro respectively.
The main barrier to a successful introduction of blended cement onto the Nigerian cement market has been identified as an aversion of consumers to a change to any cement other than the OPC, which has been the only type on the market. WAPCO has developed and successfully implemented a significant marketing effort to reduce this barrier.
The blended cement project intends to gradually reduce the clinker content of WAPCO’s Shagamu cement production and that of Ewekoro Cement Works from about 86.6% and 84.7% in 2005 to 75% in 2017. The methodology used is ACM0005.
The baseline scenario was the current practice in Nigeria where the amount of non-gypsum additive materials in OPC is limited to 6%, thus resulting in a clinker factor above 89% for CEM I brand of cement (Gypsum content in cement is about 5-6%). This clinker factor can be achieved without major investments. WAPCO worked jointly with the Nigerian Cement Manufacturing group, the SON, relevant governmental agencies, cement users etc., to propose a new blended cement standard.
The baseline benchmark considered in the project is a clinker-to-cement ratio of 0.908 for the two plants and the country benchmark is 0.89. Baseline emissions are 0.8483 tCO2e/tonne BC and 0.8185 tCO2/tonne BC for Shagamu and Ewekoro plants respectively.
The clinker-to-cement ratio in the project scenario is 0.75. At terms, projects emissions are estimated at 0.3688 tCO2/tonne BC for Shagamu and 0.4603 tCO2/tonne BC for Ewekoro.
The expected emissions reduction from the project is 1,324,140 tonnes CO2 per year with respectively 865,789 tCO2e and 458,351 tCO2e for Shagamu and Ewekoro.
Source: PDD WAPCO, UNFCCC Website
61 UNFCC Website, 2008. PDD - Lafarge Cement WAPCO Plc’s (WAPCO) Blended Cement (BC) Project at: Sagamu Cement and Ewekoro Cement Plants

World Bank/CF Assist Cement Sector Program in SSA: Barriers Analysis to CDM and Solutions
Final Report
Econoler International 73 (REF : # 5430)
5 RECOMMENDATIONS TO BOOST CDM PROJECTS IN THE SSA CEMENT SECTOR
The limited capacity to identify, promote, evaluate and implement projects remains a major barrier to CDM development in Africa, despite a number of previous targeted efforts. This implies that effective training activities addressing different issues related to the CDM still need to be scaled up to reach all key stakeholders at the national or regional level. Thus, in addition to face-to-face training, new ways of delivering effective capacity building, which is not yet widely practiced in African countries, should be considered62.
Removing the barriers in the cement industry will require sustained and focused efforts. It is therefore recommended to:
1. Increase Awareness and Capacity Building
One-on-one meetings with top management would be required to gain acceptance for developing CDM projects. Once a top manager has decided to go ahead with a CDM project, the technical department follows. In this view, it would be helpful to top management representatives and technical managers of African Cement Industry to carry out a study mission in the Indian Cement Industry. The mission could be partly funded by CF Assist and other multilateral and bilateral organizations. The focus of this mission could be on energy efficiency improvement projects, benchmarking, equipment sourcing and development of CDM projects. Other than plant visits, meetings could be arranged with CII-GBC, NCBM, TERI, CMA, equipment vendors, energy auditors and CDM consultants.
Awareness should be strengthened, while being focused on the cement sector and on precise countries or regions. Capacity building related to CDM project opportunities in the cement sector should be technology-based (e.g. blended cement, fossil fuel substitution or waste heat recovery from kilns). In regions or countries where there are active industry associations, the actions should build on ongoing awareness and capacity building channels. Two associations can be approached: EACPA in East Africa, which brings together seven cement units from Kenya, Uganda and Tanzania, and MAN in Nigeria. As an example of ongoing capacity building activities in the industry, MAN partnered with Rosebank Consulting to offer the Nigerian industry MAN Green courses. These associations could be networked with their counterpart such as CII and CMA in India.
2. Develop CDM Projects on the Learning-by-Doing Approach
Intensive efforts by CDM consultants and EE equipment vendors will also be needed and directed towards the large conglomerates that own or manage cement plants in SSA. In view of the lukewarm
62 ICF, 2007. Analysis of activities implemented under the Nairobi Framework in Sub-Saharan Africa. Achievements, challenges and solutions. Final Report, October 2007. Report commissioned by UK DFID.

World Bank/CF Assist Cement Sector Program in SSA: Barriers Analysis to CDM and Solutions
Final Report
Econoler International 74 (REF : # 5430)
response from the cement units, it is recommended that about six CDM projects should be funded up to UNFCCC registration stage with the active participation of one of the World Bank Carbon Funds.
Local consultants and technical staff of cement plants should actively participate in the project cycle.
Based on regional concentration, countries with integrated plants and significant cement production should be targeted. In West Africa, the target countries could be Nigeria, Benin and Togo for waste heat recovery and fuel substitution. Senegal, Ghana and Côte d’Ivoire could be added when blended cement is considered. In East Africa and Central Africa, Kenya, Uganda, Tanzania, DR Congo could be selected.
3. Develop Basic Information for CDM Projects in the Cement Sector
The SSA cement sector will need to build basic data that enable energy savings and CDM projects assessment. A starting point could be the sharing of statistics, benchmarking and other knowledge resources relevant to the cement industry (such as the analysis of the CDM CDM success in the Indian cement industry, energy efficiency benchmarking tools developed by CMA, etc.). An experience-sharing approach would be, for instance, to create a network between experts from other developing countries that have demonstrated best practices and their SSA counterparts. Based on lessons learned from India, it will be important to develop the benchmarks for the SSA cement sector. This will require sustained actions through specific studies listed hereafter:
• Conduct benchmarking studies for specific energy consumption and baseline benchmark for blended cement on a regional basis. The possibility of adopting and adapting international standards for blended cement could also be investigated.
• Develop grid emission factors for major countries and regions as in India under GTZ assistance for establishing a CO2 baseline database for the Indian Power Sector or in Tanzania with the grid emission factors developed by UNEP Risoe and CD4CDM.
• Develop and disseminate basic data sheets on financial and economic environment for CDM and success stories based on real projects.
4. Encourage Energy Audits and Promote Energy Management Systems
Energy efficiency projects can drive CDM projects. Therefore, it is recommended to launch a project to conduct Investment Grade Energy Audits in the African cement industry. Such external audits need to focus on investment and financial analyses (including carbon revenues) of the energy conservation opportunities to facilitate decision-making by the top management. When dealing with cement plant projects in their inception, this approach would amount to incorporating energy efficiency at the design stage (with incremental investment reasoning). Organizations such as UNIDO, IFC, AFD, GTZ or DANIDA might be interested in such approach.
This action could be integrated in a more global approach in the view of creating energy management systems or establishing energy managers in the SSA cement industry drawing lessons from India.

APPENDIXES

World Bank/CF Assist Barriers to CDM Project Development in Africa’s Cement Sector
Final Report
Econoler International A1-1 (REF : # 5430)
APPENDIX 1 QUESTIONAIRE FOR CEMENT INDUSTRY’S STAKEHOLDERS IN INDIA
Background
The World Bank through Carbon Finance Assist program (www.carbonfinance.org) has mandated Econoler International (www.econolerint.com), a Canadian company specialized in energy efficiency and CDM to undertake a study to categorize the current bottlenecks and difficulties encountered by the project proponents in Africa to develop CDM projects and to identify new cement CDM projects eligible for the first commitment period or for the voluntary market. Shri Shakti Alternative Energy Ltd (www.ssael.co.in) is assisting Econoler International in this study and will be conducting an analysis of the CDM projects in the cement industry in India to develop an understanding of the reasons for their tremendous success.
Out of 31CDM projects that have been registered from the cement industry worldwide, 22 (71%) are from the Indian cement industry. The remaining 9 CDM projects in cement industry are from Argentina (1), China (3), Indonesia (2), Israel (1), Malaysia (1), Uruguay (1).
It is hoped that an analysis of the success of CDM projects in India and knowledge sharing from this study will help build the capacity of the African cement industry to take up development of CDM projects.
In this regard, we kindly solicit your valuable inputs and contribution by filling up this questionnaire and sending it back to Mr. D. V. Satya Kumar (+91 98491 29629) or Mr. I. V. R. Kumar (+91 94400 53323) at Shri Shakti Alternative Energy Ltd within one week.
Postal Address: 4th Floor, Venus Plaza, Begumpet, Hyderabad – 500016, Fax: 040 2377 0513
Email: [email protected] or [email protected]
Thank you for collaborating and spending your precious time on this survey.
Please, return the questionnaire either by fax or email.
1. Name of the Organization ………………………………………………………………………………............
2. Name of the contact person……………………………………………………………………………............
3. Mailing address …………………………….…………………………………………………...........................
Telephone …………..……………………………………………………………………...................................
Fax ………………………………………………………………………………...............................................
Mobile…..………………………………………..…………………………………………...................................
Email ………………………………………………………………………………………………………………..
4. No. of CDM projects facilitated in cement sector …………………………………………………………

World Bank/CF Assist Barriers to CDM Project Development in Africa’s Cement Sector
Final Report
Econoler International A1-2 (REF : # 5430)
5. Number of CDM projects facilitated and approved
Name of the Cement Plant
Production Capacity (MMTA)
Project Title / UNFCCC Regn No.
Annual Energy Savings Avg CERs / yr over crediting period
kWh Units kCal
6. Activities undertaken to facilitate CDM
Activities Yes No Remarks Conducting Workshops & Seminars on CDM
Support for technology identification / Investment grade energy audit
New legal/regulation recommendations (reduction clinker/cement factor, emission monitoring and reporting, etc.)
Preparation of PIN
Finding a buyer and signing of ERPA
Preparation of PDD and host country approval
7. Identifying the barriers faced and how they were overcome
a. Raising awareness among the Industrial units (seminars, strategic studies, demonstration projects, best practice, etc.)
b. Through Capacity building on technology
c. Through Capacity building on CDM d. Convincing them to Commit financial
resources
8. Please describe other measures taken to promote CDM in cement industry
9. How did the units pay for the transaction cost of developing CDM project?
Own Sources Borne by Buyers
Through consultants success fee

World Bank/CF Assist Barriers to CDM Project Development in Africa’s Cement Sector
Final Report
Econoler International A1-3 (REF : # 5430)
10. How did the units pay for the investment costs related to the CDM projects?
Own Sources Borrowings
Upfront payment by Buyer
11. General information on the cement sector in India:
a. Can you offer your comments on the demand v/s installed capacity at the country level / regional level?
b. Your opinion of demand variation due to the price increases in the past.
c. Please comment on the degree of adoption of coal and/or coke as primary energy in the cement sector in India and the effect it has had on the cost of production.
d. What are the substitution rates achieved with fuel derived from wastes?
e. What has been the experience of the cement industry in their commitment to improve local land and communities and the positive impact it has had on the motivation for developing the CDM projects?
f. Please comment on the cement industry’s commitment to the Cement Sustainability Initiative (SCI)
g. Other: comments
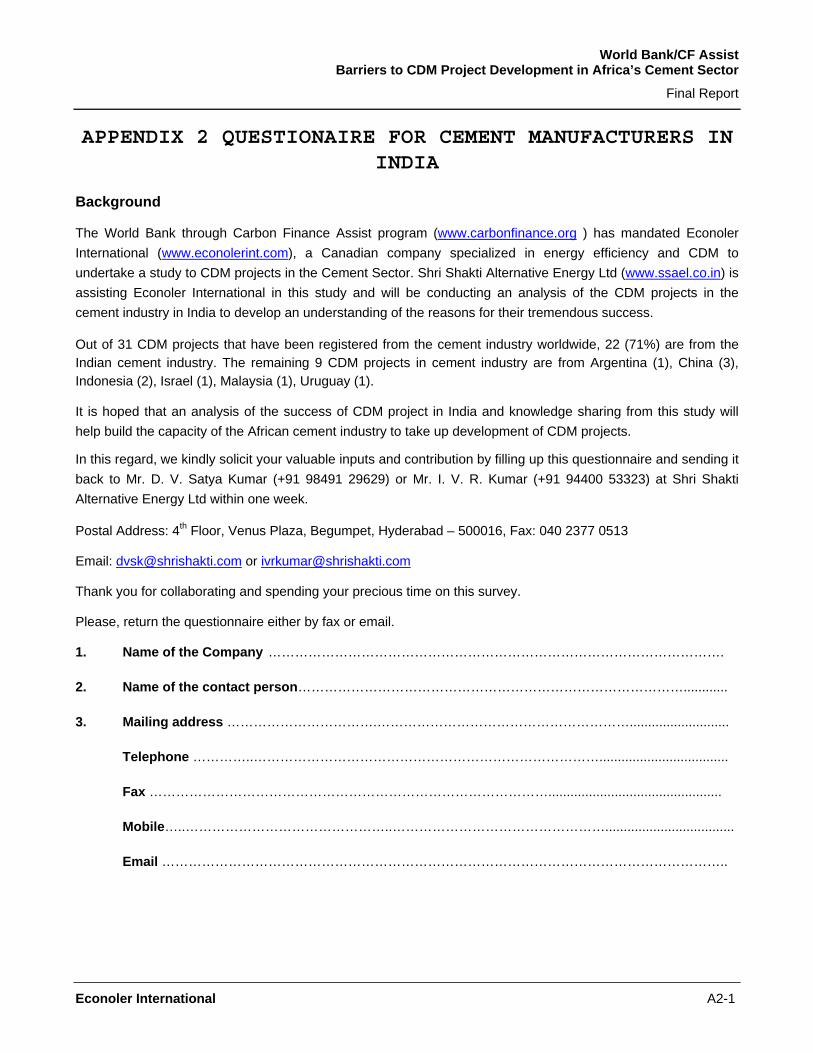
World Bank/CF Assist Barriers to CDM Project Development in Africa’s Cement Sector
Final Report
Econoler International A2-1
APPENDIX 2 QUESTIONAIRE FOR CEMENT MANUFACTURERS IN INDIA
Background
The World Bank through Carbon Finance Assist program (www.carbonfinance.org ) has mandated Econoler International (www.econolerint.com), a Canadian company specialized in energy efficiency and CDM to undertake a study to CDM projects in the Cement Sector. Shri Shakti Alternative Energy Ltd (www.ssael.co.in) is assisting Econoler International in this study and will be conducting an analysis of the CDM projects in the cement industry in India to develop an understanding of the reasons for their tremendous success.
Out of 31 CDM projects that have been registered from the cement industry worldwide, 22 (71%) are from the Indian cement industry. The remaining 9 CDM projects in cement industry are from Argentina (1), China (3), Indonesia (2), Israel (1), Malaysia (1), Uruguay (1).
It is hoped that an analysis of the success of CDM project in India and knowledge sharing from this study will help build the capacity of the African cement industry to take up development of CDM projects.
In this regard, we kindly solicit your valuable inputs and contribution by filling up this questionnaire and sending it back to Mr. D. V. Satya Kumar (+91 98491 29629) or Mr. I. V. R. Kumar (+91 94400 53323) at Shri Shakti Alternative Energy Ltd within one week.
Postal Address: 4th Floor, Venus Plaza, Begumpet, Hyderabad – 500016, Fax: 040 2377 0513
Email: [email protected] or [email protected]
Thank you for collaborating and spending your precious time on this survey.
Please, return the questionnaire either by fax or email.
1. Name of the Company ………………………………………………………………………………………….
2. Name of the contact person……………………………………………………………………………............
3. Mailing address …………………………….…………………………………………………...........................
Telephone …………..……………………………………………………………………...................................
Fax ………………………………………………………………………………...............................................
Mobile…..………………………………………..…………………………………………...................................
Email ………………………………………………………………………………………………………………..
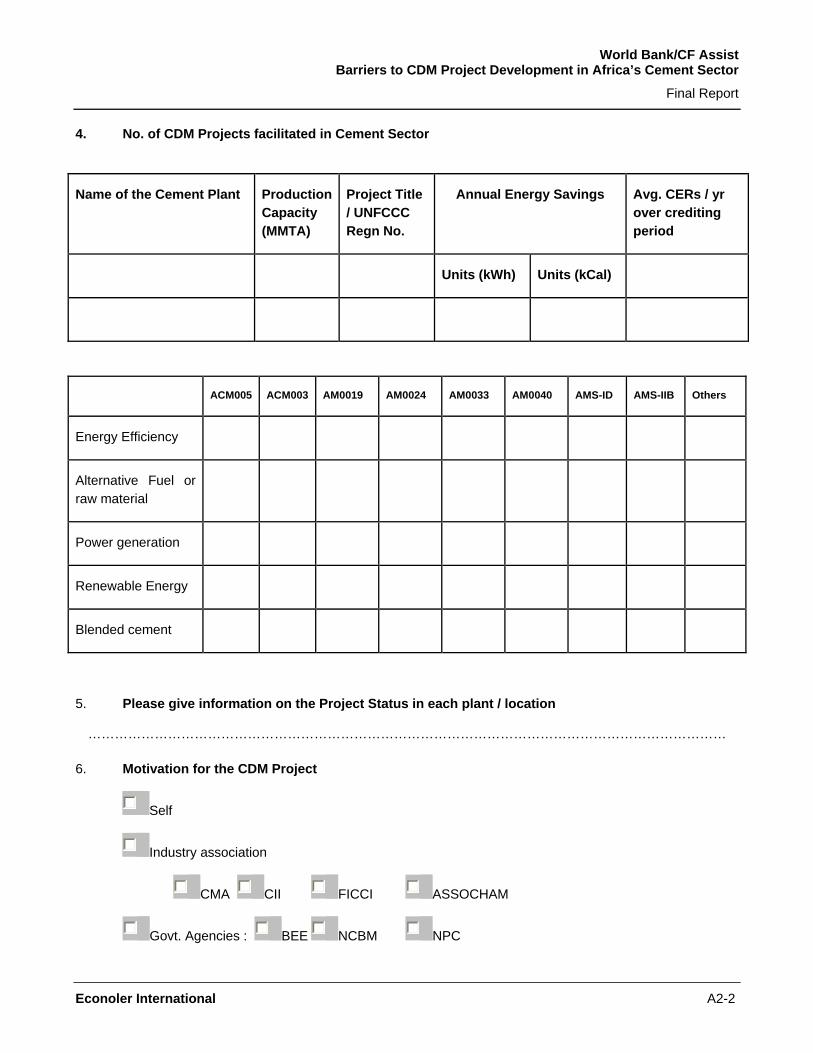
World Bank/CF Assist Barriers to CDM Project Development in Africa’s Cement Sector
Final Report
Econoler International A2-2
4. No. of CDM Projects facilitated in Cement Sector
Name of the Cement Plant Production Capacity (MMTA)
Project Title / UNFCCC Regn No.
Annual Energy Savings Avg. CERs / yr over crediting period
Units (kWh) Units (kCal)
ACM005 ACM003 AM0019 AM0024 AM0033 AM0040 AMS-ID AMS-IIB Others
Energy Efficiency
Alternative Fuel or raw material
Power generation
Renewable Energy
Blended cement
5. Please give information on the Project Status in each plant / location
………………………………………………………………………………………………………………………………
6. Motivation for the CDM Project
Self
Industry association
CMA CII FICCI ASSOCHAM
Govt. Agencies : BEE NCBM NPC

World Bank/CF Assist Barriers to CDM Project Development in Africa’s Cement Sector
Final Report
Econoler International A2-3
Technology Provider
Energy Auditor
Increase in energy costs
Environmental Concerns
7. Barriers faced and how they were overcome?
8. Your comments on the role of the CDM consultants in facilitating the whole process.
9. Your comments on the role of the Buyer in facilitating the whole process.
…………………………………………………………………………………………………………………………
10. How did you pay for the transaction costs of developing the CDM project?
Own Sources
Borne by the Buyer
Was part of Consultant’s success fee
Others; if so please specify ..............................................................................................................
11. How did you fund the investment costs related to the CDM Projects?
Own Sources
Borrowings based on the CER delivery and ERPA
Upfront payment by the Buyer
Others; if so please specify ..............................................................................................................
12. Please provide any additional information that you feel would be useful for this study?
…………………………………………………………………………………………………………………………

World Bank/CF Assist Barriers to CDM Project Development in Africa’s Cement Sector
Final Report
Econoler International A3-1
APPENDIX 3 LIST OF ORGANIZATIONS CONTACTED IN INDIA
AGENCIES FACILITATING / WORKING ON CDM PROJECTS
Sl.No Name and Organization Contact Brief 1 Mr. D.Pawan Kumar,
Director (Energy Management), National Productivity Council, New Delhi 110 003
+91 98188 02231 [email protected]
Capacity building and training programs on CDM and GHG accounting, Carbon neutral projects with assistance from UNEP. Also proposes to carry out a program for Asian Productivity Council (APO), Tokyo
2 Dr. .S.K. Ghosh, Advisor (Technical), Cement Manufacturers Association, NOIDA Mr. N A Viswanathan Secretary General Mr. G Y Narayana
0120 – 2411 955 [email protected]
Capacity building and Training. Opines CDM projects in cement industry are coming down as they are not attractive.
3 Mrs. Rita Roy Chowdhary, Team Leader, Environment Division, Federation of Indian chamber of commerce and industry, Tansen Marg, New Delhi 110 001
011-2332 5110 [email protected]
Facilitation and capacity building for CDM projects in all sectors. No specific project facilitation in cement sector.
4 Mr. Vivek Tyagi /Mr. G Verma Associated Chamber of Commerce and Industry, New Delhi
011-4655 0555 [email protected]
5 GTZ, Carbon Procurement Unit, Gurgoan
Dr. Hermann Herz Team Leader GTZ International Services, Carbon Procurement Unit (CPU), U & I Corporate Center Suit No – 26, Sector - 32 Gurgoan, Haryana – 122 001 India Tele: +91 124 4259926 / 4048273 Mobile: +91 987 1156877 Email: [email protected]
Response recd by Mr. DVSK on 9th July. Referred to Mr. Ramaswamy in GTZ
6 Mr. Somesh Kumar Associate Director, Transaction Advisory, Earnest and Young Ltd, Gurgaon
0124-464 4000 +91 98110 09212 [email protected] Tel: +91-11-2661 1004-09 / +91-11-4159- 4251 Mob: +91-98108-88024 Fax: +91 11 2661 1012-13 E-mail: [email protected]
CDM – full range of services. Reviewed and regretted to participate in the survey
7 Mr. Subrahmanyam / Mr. Mohan Reddy Zenith Energy Lt, Hyderabad
+91 98663 24164 [email protected] Mohan Reddy, Director Tel: +914023376630 / 31 Fax: +91 (40) 2332 2517 E-mail: [email protected]
Have under taken projects in CDM in cement for My Home Cements (Regn no. 1500). Questionnaire replied.
8 Mrs. Kalyani National Council of Cement an Building Materials,Gachchi Bowli, Hyderabad
040-23000344
No direct work for CDM project facilitation.
9 Shri S N M Khan, General Manager & Head-of-Centre, (Centre for Mining, Environment, Plant Engg &
34 KM Stone, Delhi-Mathura Road (NH-2), Ballabgarh – 121004 (Haryana); Phone-(0129) 4192241,

World Bank/CF Assist Barriers to CDM Project Development in Africa’s Cement Sector
Final Report
Econoler International A3-2
Sl.No Name and Organization Contact Brief Operation), National Council for Cement and Building Materials (NCB),
2244883;FAX-(0129) 2300465; Mobile-9891304265; E- mail: [email protected]
10 Mr. Saurabh Kumar, Secretary, BEE, New Delhi
011-26179699
Rajeev Garg has responded.
11 Mr. Ben Atkinson AgriEnergy Ltd, UK
Tel./ Fax: +44 (0) 1258 830556 E-mail: [email protected]
Spoke to Varun Gulati at India office
12
S. Rajha Gopalan, President & CEO Renco Technologies
Tel: + 91 44 2498 8950 E-mail: [email protected]
Spoke on phone
13 Dr. Vivek Kumar, Associate Fellow TERI
Tel: 2468 2100, 5150 4900 E-mail: [email protected]
14 Kalipada Chatterjee, Senior Advisor (Climate Change) Winrock International India
Tel.: +91-11-2669-3868 Fax.: +91-11-2669-3881 E-mail: [email protected]
15
Price Waterhouse Coopers Private Ltd
Dr. Surajit Bose Tel: (O) +91 (22) 5669 1500 Fax: (O) +91 (22) 5654 7804 E-mail: [email protected] Mr. Prashant Vikram Singh [email protected] 0124 3060554
Dr. Ram Babu is the contact in the PDDs , he has left and joined Cantor Co2 Surajit Bose has taken over and responded to the Questionnaire.
16 Mr. N. Balaji (Senior Manager) Deloitte Touche Tohmatsu India Pvt Ltd
Tel: +91 11 55622000, 55622081 Fax: +91 11 55622011-12 E-mail: [email protected]
17
Emerging Ventures India Pvt Ltd Mr. Kala Tel: +91 124 5042674 E-mail: [email protected]
18
CII – Green Business Centre Hyderabad
Mr S Raghupathy [email protected] 040 23112971 / 76
Responded. No direct facilitation for CDM projects.
19 CantorCO2e India Private Limited 10th Floor, Raheja Chambers Free Press Journal Marg Nariman Point Mumbai 400 021 email: [email protected]
CantorCO2e India Private LimitedOne Churchill Place Canary Wharf London E14 5RD UK
Tel: 44 20 7894 8333 Fax: 44 20 7894 8334 email: [email protected]
Atul has responded to the Questionnaire. Dr. Rambabu had developed projects in CDM while at PWC. No new projects developed at Cantor.
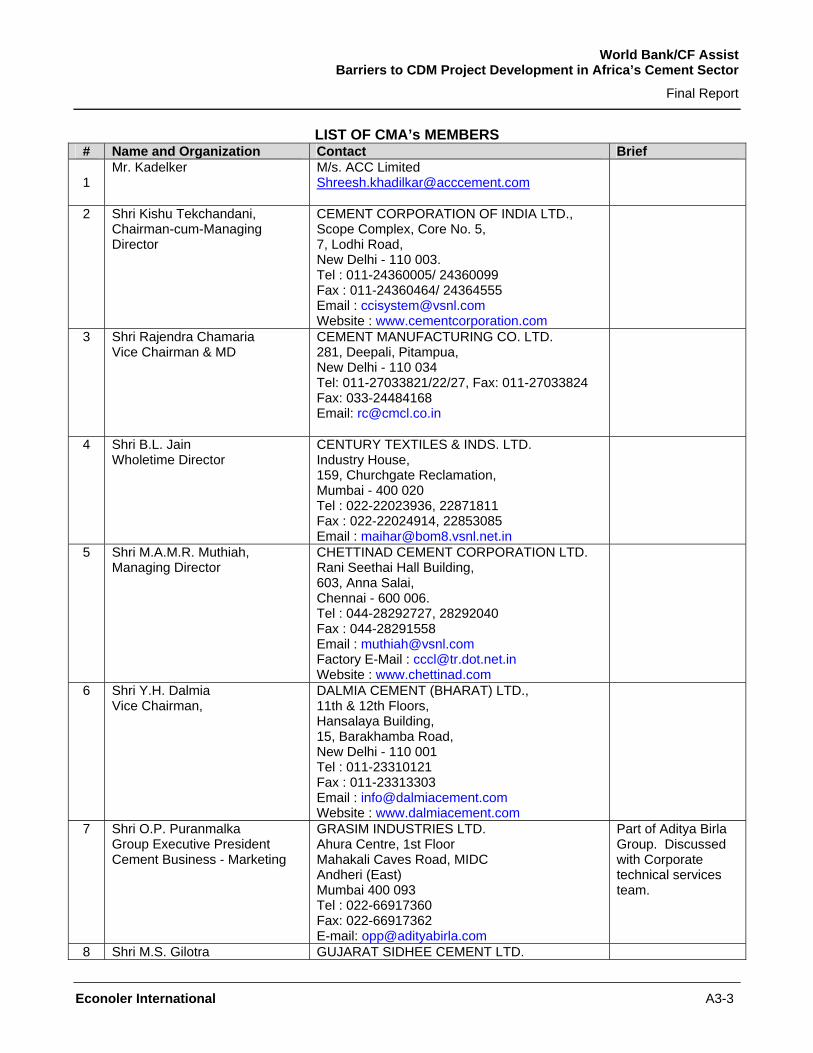
World Bank/CF Assist Barriers to CDM Project Development in Africa’s Cement Sector
Final Report
Econoler International A3-3
LIST OF CMA’s MEMBERS # Name and Organization Contact Brief 1
Mr. Kadelker
M/s. ACC Limited [email protected]
2 Shri Kishu Tekchandani, Chairman-cum-Managing Director
CEMENT CORPORATION OF INDIA LTD., Scope Complex, Core No. 5, 7, Lodhi Road, New Delhi - 110 003. Tel : 011-24360005/ 24360099 Fax : 011-24360464/ 24364555 Email : [email protected] Website : www.cementcorporation.com
3 Shri Rajendra Chamaria Vice Chairman & MD
CEMENT MANUFACTURING CO. LTD. 281, Deepali, Pitampua, New Delhi - 110 034 Tel: 011-27033821/22/27, Fax: 011-27033824 Fax: 033-24484168 Email: [email protected]
4 Shri B.L. Jain Wholetime Director
CENTURY TEXTILES & INDS. LTD. Industry House, 159, Churchgate Reclamation, Mumbai - 400 020 Tel : 022-22023936, 22871811 Fax : 022-22024914, 22853085 Email : [email protected]
5 Shri M.A.M.R. Muthiah, Managing Director
CHETTINAD CEMENT CORPORATION LTD. Rani Seethai Hall Building, 603, Anna Salai, Chennai - 600 006. Tel : 044-28292727, 28292040 Fax : 044-28291558 Email : [email protected] Factory E-Mail : [email protected] Website : www.chettinad.com
6 Shri Y.H. Dalmia Vice Chairman,
DALMIA CEMENT (BHARAT) LTD., 11th & 12th Floors, Hansalaya Building, 15, Barakhamba Road, New Delhi - 110 001 Tel : 011-23310121 Fax : 011-23313303 Email : [email protected] Website : www.dalmiacement.com
7 Shri O.P. Puranmalka Group Executive President Cement Business - Marketing
GRASIM INDUSTRIES LTD. Ahura Centre, 1st Floor Mahakali Caves Road, MIDC Andheri (East) Mumbai 400 093 Tel : 022-66917360 Fax: 022-66917362 E-mail: [email protected]
Part of Aditya Birla Group. Discussed with Corporate technical services team.
8 Shri M.S. Gilotra GUJARAT SIDHEE CEMENT LTD.

World Bank/CF Assist Barriers to CDM Project Development in Africa’s Cement Sector
Final Report
Econoler International A3-4
# Name and Organization Contact Brief Managing Director
NKM International House, 178, Backbay Reclamation, Mumbai - 400 020, Maharashtra Tel : 022-66365444, 32955563 Fax : 022-66365445 Email : [email protected] Website: www.mehtagroup.com
9 Shri P.A. Jadeja President
HMP CEMENTS LTD. 'HMP House', 4, Fairlie Place, Kolkata 700 001. Tel : 033-22210268 (9 Lines) Fax : 033-22486956 Email : [email protected]
10 Shri N. Srinivasan, Vice Chairman & Managing Director
THE INDIA CEMENTS LIMITED 'Dhun Building' 827, Anna Salai Chennai - 600 002 Tel : 044-28524004 Fax : 044-28520702 E-Mail : [email protected] Website: www.indiacements.co.in
Discussed the issues on phone.
11 Shri S. Parasrampuria Executive Director
INDORAMA CEMENT LIMITED 207, Vardhman Chambers Sector-17, Vashi Tel : 022-27896004-07 Fax : 022-27896020, 27896010 E-Mail : [email protected] Website : www.indorama.co.in
12 Shri O.N. Rai Director
J.K. UDAIPUR UDYOG LTD. Link House, 3, Bahadur Shah Zafar Marg, New Delhi - 110 002. Tel : 011-23311112-5 Fax : 011-23716607 Email : [email protected]
13 Shri Manoj Gaur Managing Director
JAIPRAKASH ASSOCIATES LTD. JA Annexe, 54, Basant Lok, Vasant Vihar, New Delhi - 110 057. Tel : 011-26141540, 26147411 Fax : 011-26148890 Email: [email protected]
14 Shri Mian Mushtaq Ahmad Managing Director
JAMMU & KASHMIR CEMENTS LTD. H.O. Nawa-Subh Building, Zero Bridge, P.Box No. 149, Srinagar - 190 001 Tel : 0194-2452293, 2479018 Fax : 0194-2473693 Email : [email protected]
15 Shri R.G. Bagla, Group Executive President
J.K. CEMENTS LTD. Kamla Tower,

World Bank/CF Assist Barriers to CDM Project Development in Africa’s Cement Sector
Final Report
Econoler International A3-5
# Name and Organization Contact Brief
Kanpur, Uttar Pradesh. Tel : 0512-2371478-81 Fax : 0512-2399854, 2394250 Email: [email protected]
16 Mrs. Vinita Singhania Managing Director
JK LAKSHMI CEMENT LTD. Nehru House, 4th Floor, 4, Bahadurshah Zafar Marg, New Delhi - 110 002. Tel : 011-23311411,51011116,23311112-4 Fax : 011-23722251, 23722021 Email : [email protected], [email protected]
17 Shri S.P. Sinha Chairman
KALYANPUR CEMENTS LTD. Maurya Centre, Tel : 0612-2221551, 2223336 Fax : 0612-2239884 Email : [email protected]
18 Shri K.V. Ganesan Director
LAFARGE INDIA PVT. LTD. Bakhtawar, 14th Floor 229, Nariman Point Mumbai - 400 021 Tel: 022-66306511 Fax: 022-66306510 Email: [email protected] Website: lafarge-india.com
19 Shri P.R.R. Rajha Chairman & Managing Director
MADRAS CEMENTS LTD. "Auras Corporate Centre" Tel : 044-28478666, 28478656 Fax : 044-28478676 Email : [email protected] Website: www.madrascements.com
20 Shri K.S. Srinivas, IAS Managing Director
MALABAR CEMENTS LTD. Walayar P.O., Palakkad Distt. - 678 624 Kerala. Tel : 0491-2862220 Fax : 0491-2862230 Email : [email protected] Website : www.malabarcements.com
21 Shri K.C. Jain Managing Director
MANGALAM CEMENT LTD. Mangalam House, 28, Adchini Mehrauli Road, New Delhi 110 017. Tel : 011-26968289 Fax : 011-26851720 Email : [email protected] Website: www.mangalamcement.com
22 Shri Mahendra Kumar Agarwal Managing Director
MEGHALAYA CEMENTS LTD. CE-25, Salt Lake City, Sector-1 Kolkata - 700 064 Tel: 033-23340666 / 0004 Fax: 033-23340505
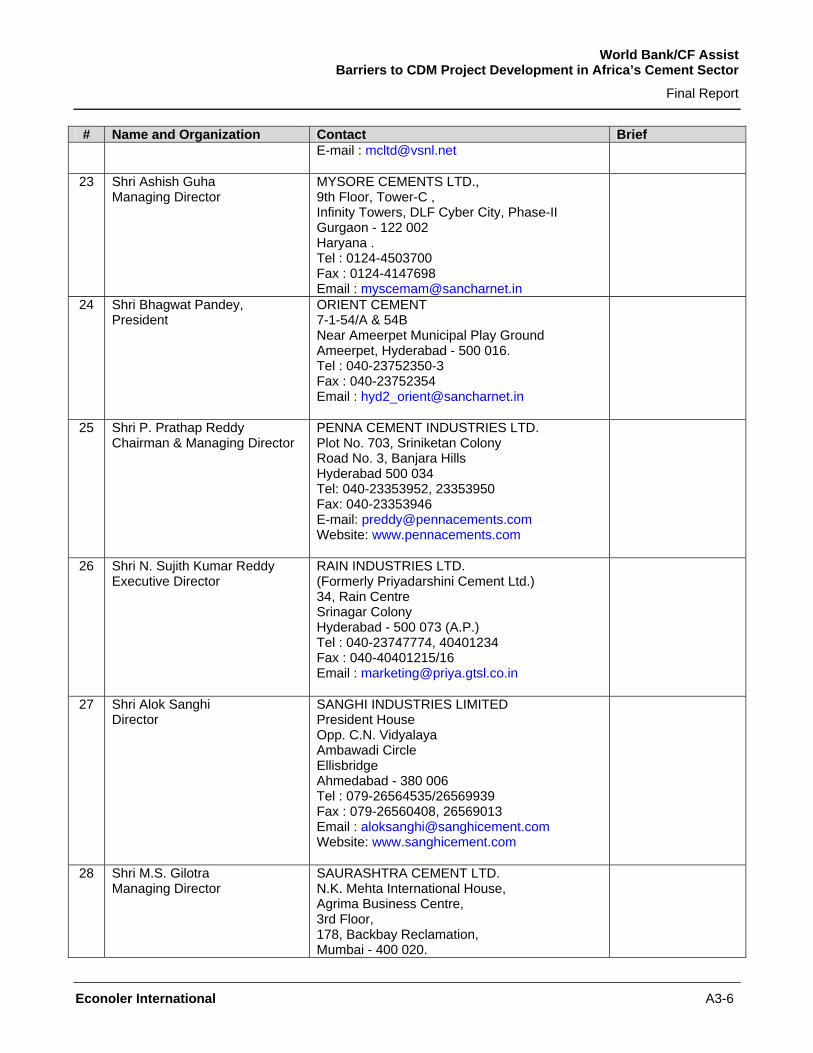
World Bank/CF Assist Barriers to CDM Project Development in Africa’s Cement Sector
Final Report
Econoler International A3-6
# Name and Organization Contact Brief E-mail : [email protected]
23 Shri Ashish Guha Managing Director
MYSORE CEMENTS LTD., 9th Floor, Tower-C , Infinity Towers, DLF Cyber City, Phase-II Gurgaon - 122 002 Haryana . Tel : 0124-4503700 Fax : 0124-4147698 Email : [email protected]
24 Shri Bhagwat Pandey, President
ORIENT CEMENT 7-1-54/A & 54B Near Ameerpet Municipal Play Ground Ameerpet, Hyderabad - 500 016. Tel : 040-23752350-3 Fax : 040-23752354 Email : [email protected]
25 Shri P. Prathap Reddy Chairman & Managing Director
PENNA CEMENT INDUSTRIES LTD. Plot No. 703, Sriniketan Colony Road No. 3, Banjara Hills Hyderabad 500 034 Tel: 040-23353952, 23353950 Fax: 040-23353946 E-mail: [email protected] Website: www.pennacements.com
26 Shri N. Sujith Kumar Reddy Executive Director
RAIN INDUSTRIES LTD. (Formerly Priyadarshini Cement Ltd.) 34, Rain Centre Srinagar Colony Hyderabad - 500 073 (A.P.) Tel : 040-23747774, 40401234 Fax : 040-40401215/16 Email : [email protected]
27 Shri Alok Sanghi Director
SANGHI INDUSTRIES LIMITED President House Opp. C.N. Vidyalaya Ambawadi Circle Ellisbridge Ahmedabad - 380 006 Tel : 079-26564535/26569939 Fax : 079-26560408, 26569013 Email : [email protected] Website: www.sanghicement.com
28 Shri M.S. Gilotra Managing Director
SAURASHTRA CEMENT LTD. N.K. Mehta International House, Agrima Business Centre, 3rd Floor, 178, Backbay Reclamation, Mumbai - 400 020.

World Bank/CF Assist Barriers to CDM Project Development in Africa’s Cement Sector
Final Report
Econoler International A3-7
# Name and Organization Contact Brief Tel : 022-66365444, 32955563 Fax : 022-66365445 Email : [email protected] website: www.mehtagroup.com
29 Shri H.M. Bangur Managing Director
SHREE CEMENT LTD. 21, Strand Road, Kolkata - 700 001. Tel : 033-22209601-6 Fax : 033-22434226 Email : [email protected] Website: www.shreecement.com
30 Shri B.B. Joshi Jt. Executive President
SHREE DIGVIJAY CEMENT CO. LTD. Digvijaygram Via Jamnagar - 361 140 Gujarat Tel : 0288-2344272-5 Fax : 0288-2344092 Email :[email protected] Website: www.adityabirla.com
31 Shri Edappadi K. Palaniswami Chairman & Managing Director
TAMIL NADU CEMENTS CORP. LTD. L.L.A. Building, 735, Anna Salai, Chennai - 600 002 Tel : 044-28525461, 28525471 Fax : 044-28523991, 28592726 Email : [email protected] Website : www.tancem.com
32 Mr. M. Maurizio Caneppele Managing Director
ZUARI CEMENT LTD., No. 1, "Alsana Plaza," 10th Main, Jeevan Bhima Nagar HAL III Stage Bangalore 560 075 Tel : 080-25207615/16 Fax : 080-25207625 Email : [email protected] Website: www.zcltd.com
Responded. No CDM projects developed and hence unable to answer the questionnaire.
33 Contact Person: Mr. R M Gupta Sr. Executive President [email protected]
Birla Plus Cement Behind G H T P P O Lehra Mohabat Bathinda PIN 151 111 Phone No. 0164 2756340 / 825 Fax No. 0164 2756316
Referred to Mr S Ram who was interviewed by Phone
34 Contact Person Mr. P S Mazumdar Technical [email protected]
Grasim Industries Limited Cement division South Reddipilayam Ariyalur Tamilnadu Pin; 621704
Responded to the Questionnaire.

World Bank/CF Assist Barriers to CDM Project Development in Africa’s Cement Sector
Final Report
Econoler International A4-1 (REF : # 5430)
APPENDIX 4 DATABASE OF THE INDIAN CDM PROJECTS IN THE CEMENT SECTOR
# UNFCCC ID
Title State Status Methodology 1st Period ktCO2e/yr
DOE Credits Buyers PDD Consultants Comments Start Date
Registration Date
1 454 Increasing the Additive Blend in cement production by Jaiprakash Associates Ltd.
- Rejected ACM5 34 DNV n.a. Emergent Ventures
26-oct-05
2 715 Blended Cement Project with Fly Ash – Lafarge India Private Limited
- Rejected ACM5 34 DNV n.a. PricewaterhouseCoopers
12-nov-05
3 861 ACEL Blended cement project at Sankrail grinding unit
- Rejected ACM5 24 DNV United K. Agrinergy 06-déc-05
4 863 Optimum utilisation of clinker for Pozzolana Portland Cement (PPC) production at Birla Plus Cement in Bathinda, Punjab
Punjab Rejected ACM5 54 TÜV-SÜD
n.a. Birla 25-août-06
5 183 "Optimal utilization of clinker" at Shree Cement Ltd. Beawar, Rajasthan
Rajasthan Registered ACM5 68 SGS United K. (ABN AMRO Bank), Germany (kfW)
Shree Cement 19-oct-05 20-févr-06
6 287 ACC Blended cement projects at New Wadi Plant, Tikaria Cemnet Plant, Chanda Cement Works (+ 3 more)
Karnataka & Maharashtra & Madhya Pradesh & Rajasthan & Jharkhand
Registered ACM5 405 SGS United K. (Agrinergy) Agrinergy 20-oct-05 21-mai-06
7 304 GACL Blended cement projects in India
Maharashtra & Gujarat & Himachal Pradesh & Punjab & Rajasthan
Registered ACM5 552 DNV United K. (Agrinergy) Agrinergy 21-oct-05 08-janv-07
8 314 Optimal Utilization of Clinker in PPC manufacturing at Birla Corporation Limited (BCL), Raebareli Unit
Uttar Pradesh
Registered ACM5 26 DNV n.a. Birla 03-nov-05 26-mai-06

World Bank/CF Assist Barriers to CDM Project Development in Africa’s Cement Sector
Final Report
Econoler International A4-2 (REF : # 5430)
# UNFCCC ID
Title State Status Methodology 1st Period ktCO2e/yr
DOE Credits Buyers PDD Consultants Comments Start Date
Registration Date
9 361 Optimum utilization of clinker by PCC production at Binani Cement Ltd, Rajasthan
Rajasthan Registered ACM5 22 SGS Germany (Electrabel) Binani Cement 09-nov-05 18-juin-06
10 438 Optimum utilisation of clinker by production of Pozzolana Cement at UltraTech Cement Ltd. (UTCL), Andhra Pradesh
Andhra Pradesh
Registered ACM5 42 DNV United K. (Noble carbon)
UltraTech Cement
30-oct-05 28-juil-06
11 456 Blended cement with increased blend at Orient cement’s Devapur and Jalgaon plants
Maharashtra & Andhra Pradesh
Registered ACM5 83 DNV United K. (Noble Carbon)
PricewaterhouseCoopers
08-nov-05 27-août-06
12 473 Optimal utilization of clinker: Substitution of Clinker by Fly ash in Portland Pozzolana Cement blend at OCL
Orissa Registered ACM5 13 DNV n.a. OCL India 15-nov-05 11-sept-06
13 548 Century Textiles & Industries Ltd blended cement projects at: Century cement, Manikgarh cement, Maihar cement
Chhattisgarh & Maharashtra & Madhya Pradesh
Registered ACM5 153 TÜV-SÜD
United K. (Agrinergy) Agrinergy 28-févr-06 26-oct-06
14 579 Optimal utilization of clinker: Substitution of Clinker by Slag in Portland Slag Cement at OCL, Rajgangpur, Sundargarh, Orissa
Orissa Registered ACM5 42 DNV n.a. OCL India 23-nov-05 13-nov-06
15 711 Mysore Cements Limited Portland Slag Cement project
Karnataka Registered ACM5 36 DNV n.a. Care Sustainability
22-nov-05 13-janv-07
16 712 “Optimal Utilization of Clinker” project at Dalmia Cement (Bharat) Limited (DCBL), Dalmiapuram , Tamilnadu
Tamil Nadu Registered ACM5 33 SGS n.a. Dalmia Cement Bharat
06-janv-06
18-févr-07

World Bank/CF Assist Barriers to CDM Project Development in Africa’s Cement Sector
Final Report
Econoler International A4-3 (REF : # 5430)
# UNFCCC ID
Title State Status Methodology 1st Period ktCO2e/yr
DOE Credits Buyers PDD Consultants Comments Start Date
Registration Date
17 746 Substitution of clinker with fly ash in Portland Pozzolana Cement (Blended Cement) at Lafarge India Pvt. Ltd. - Arasmeta Cement Plant
Chhattisgarh
Registered ACM5 69 DNV n.a. PricewaterhouseCoopers
29-déc-05 11-févr-07
18 n/a Increasing the Additive Blend in the Portland Slag Cement manufacturing by Indorama Cement Ltd.
Maharashtra At validation
ACM5 43 SGS n.a. Emergent Ventures
03-nov-05
19 n/a Optimal Utilization of Clinker in PPC manufacturing at Birla Corporation Ltd, Chittorgarh Unit
Rajasthan At validation
ACM5 43 DNV n.a. Birla 09-nov-05
20 n/a Optimal Utilization of Clinker in PPC manufacturing at Vasavadatta Cement
Karnataka At validation
ACM5 23 DNV n.a. Vasavadatta Cement
17-nov-05
21 n/a “Optimal Utilization of Clinker” project at J.K. Cement Limited (JKCL) at Nimbahera, Rajasthan
Rajasthan At validation
ACM5 150 TÜV-SÜD
n.a. Jk Cement 25-août-06
22 n/a GACL Blended cement project at Gujarat Unit
Gujarat At Validation
ACM5 317 DNV United K. Agrinergy 26-oct-06
23 n/a GACL Blended cement project at Himachal Unit
Himachal Pradesh
At Validation
ACM5 11 DNV United K. Agrinergy 27-oct-06
24 n/a GACL Blended cement project at Ropar Unit
Punjab At Validation
ACM5 18 DNV United K. Agrinergy 27-oct-06
25 n/a My Home project for increasing blend in cement production
Andhra Pradesh
At Validation
ACM5 105 TÜV-Nord
n.a. Zenith Energy Services
22-déc-06
26 302 Partial replacement of fossil fuel by biomass, for Pyro-Processing in cement plant of Shree Cements LTD at Beawar in Rajasthan
Rajasthan Registered ACM3 107 SGS n.a. Shree Cement 21-déc-05 18-mai-06
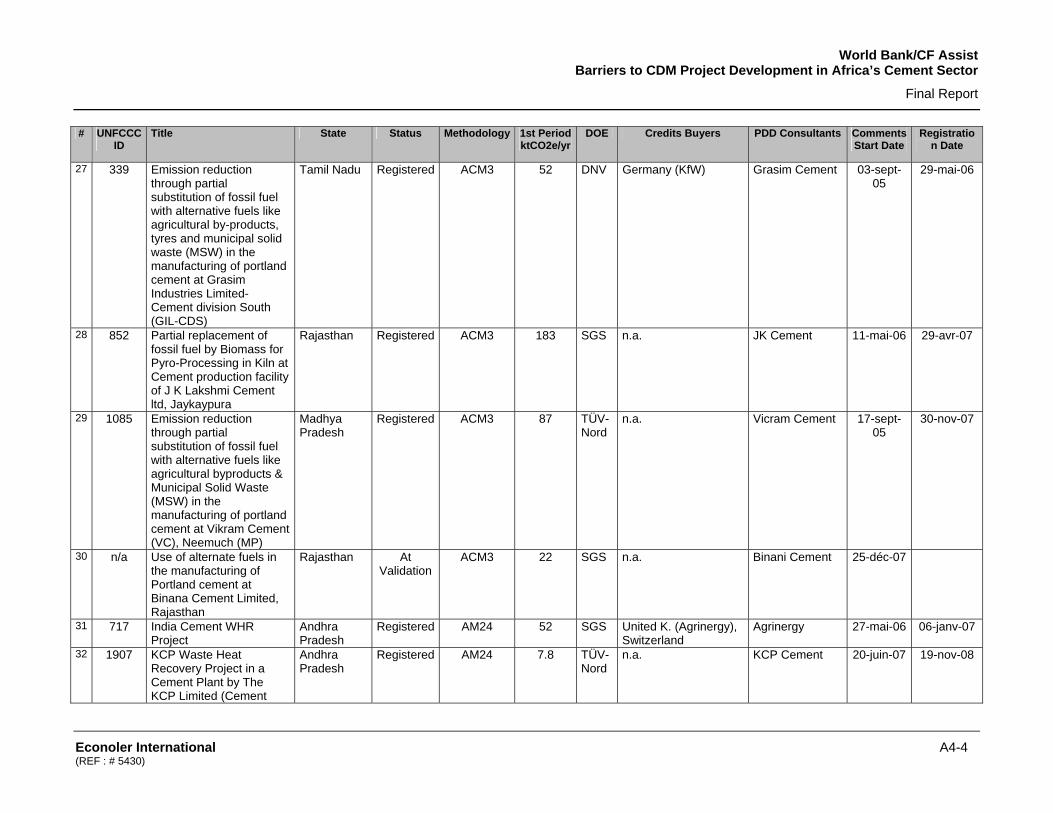
World Bank/CF Assist Barriers to CDM Project Development in Africa’s Cement Sector
Final Report
Econoler International A4-4 (REF : # 5430)
# UNFCCC ID
Title State Status Methodology 1st Period ktCO2e/yr
DOE Credits Buyers PDD Consultants Comments Start Date
Registration Date
27 339 Emission reduction through partial substitution of fossil fuel with alternative fuels like agricultural by-products, tyres and municipal solid waste (MSW) in the manufacturing of portland cement at Grasim Industries Limited-Cement division South (GIL-CDS)
Tamil Nadu Registered ACM3 52 DNV Germany (KfW) Grasim Cement 03-sept-05
29-mai-06
28 852 Partial replacement of fossil fuel by Biomass for Pyro-Processing in Kiln at Cement production facility of J K Lakshmi Cement ltd, Jaykaypura
Rajasthan Registered ACM3 183 SGS n.a. JK Cement 11-mai-06 29-avr-07
29 1085 Emission reduction through partial substitution of fossil fuel with alternative fuels like agricultural byproducts & Municipal Solid Waste (MSW) in the manufacturing of portland cement at Vikram Cement (VC), Neemuch (MP)
Madhya Pradesh
Registered ACM3 87 TÜV-Nord
n.a. Vicram Cement 17-sept-05
30-nov-07
30 n/a Use of alternate fuels in the manufacturing of Portland cement at Binana Cement Limited, Rajasthan
Rajasthan At Validation
ACM3 22 SGS n.a. Binani Cement 25-déc-07
31 717 India Cement WHR Project
Andhra Pradesh
Registered AM24 52 SGS United K. (Agrinergy), Switzerland
Agrinergy 27-mai-06 06-janv-07
32 1907 KCP Waste Heat Recovery Project in a Cement Plant by The KCP Limited (Cement
Andhra Pradesh
Registered AM24 7.8 TÜV-Nord
n.a. KCP Cement 20-juin-07 19-nov-08

World Bank/CF Assist Barriers to CDM Project Development in Africa’s Cement Sector
Final Report
Econoler International A4-5 (REF : # 5430)
# UNFCCC ID
Title State Status Methodology 1st Period ktCO2e/yr
DOE Credits Buyers PDD Consultants Comments Start Date
Registration Date
unit)
33 1292 Power generation from waste heat of new DRI kilns at JSPL
Chhattisgarh
Withdrawn ACM4 288 BV Cert
n.a. Jindal Steel & Power
14-mai-06
34 284 Waste Heat Recovery Power Project at JK Cement Works (Unit of JK Cement Ltd)
Rajasthan Registered ACM4 71 TÜV-SÜD
n.a. JK Cement 21-déc-05 15-mai-06
35 872 4.0 MW Power Plant Using Clinker Cooling Gas Waste Heat
Andhra Pradesh
Registered ACM4 17 DNV n.a. UltraTech Cement
04-mai-06 19-oct-07
36 n/a Waste Heat Recovery Power Project at cement plant of JK Cement Ltd, Mangrol, Chittorgarh Distt.Rajasthan, India
Chhattisgarh
At Validation
ACM4 66 TÜV-SÜD
n.a. JK Cement 06-mars-07
37 1068 Energy efficiency measures at cement production plant
Rajasthan Under review
AMS-II.D. 4.4 SGS n.a. Birla 01-nov-05
38 859 Vikram Cement: Energy efficiency by up-gradation of clinker cooler in cement manufacturing
Rejected AMS-II.D. 10 SGS n.a. Vikram Cement 19-août-06
39 954 GHG emission reduction by energy efficiency improvement of clinker cooler in cement manufacturing at Rajashree cement at District Gulbarga, Karnataka India
Karnataka Rejected AMS-II.D. 27 SGS n.a. Rajashree Cement
30-août-06
40 568 GHG Emission Reductions through Energy Efficiency Improvements
West Bengal
Registered AMS-II.D. 2.6 SGS n.a. Durapur Cement Works
13-oct-05 02-oct-06
41 685 Modification of Clinker Cooler for Energy Efficiency
Rajasthan Registered AMS-II.D. 12 SGS n.a. Binani Cement 14-févr-06 22-juin-07
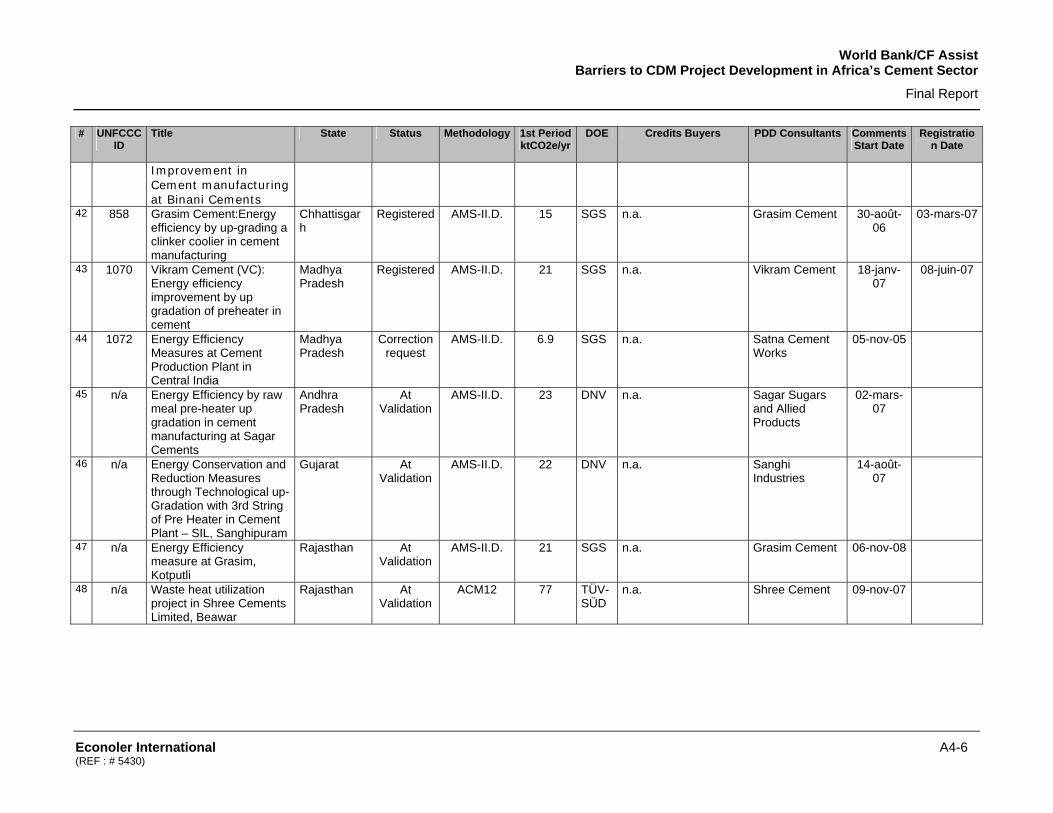
World Bank/CF Assist Barriers to CDM Project Development in Africa’s Cement Sector
Final Report
Econoler International A4-6 (REF : # 5430)
# UNFCCC ID
Title State Status Methodology 1st Period ktCO2e/yr
DOE Credits Buyers PDD Consultants Comments Start Date
Registration Date
Improvement in Cement manufacturing at Binani Cements
42 858 Grasim Cement:Energy efficiency by up-grading a clinker coolier in cement manufacturing
Chhattisgarh
Registered AMS-II.D. 15 SGS n.a. Grasim Cement 30-août-06
03-mars-07
43 1070 Vikram Cement (VC): Energy efficiency improvement by up gradation of preheater in cement
Madhya Pradesh
Registered AMS-II.D. 21 SGS n.a. Vikram Cement 18-janv-07
08-juin-07
44 1072 Energy Efficiency Measures at Cement Production Plant in Central India
Madhya Pradesh
Correction request
AMS-II.D. 6.9 SGS n.a. Satna Cement Works
05-nov-05
45 n/a Energy Efficiency by raw meal pre-heater up gradation in cement manufacturing at Sagar Cements
Andhra Pradesh
At Validation
AMS-II.D. 23 DNV n.a. Sagar Sugars and Allied Products
02-mars-07
46 n/a Energy Conservation and Reduction Measures through Technological up-Gradation with 3rd String of Pre Heater in Cement Plant – SIL, Sanghipuram
Gujarat At Validation
AMS-II.D. 22 DNV n.a. Sanghi Industries
14-août-07
47 n/a Energy Efficiency measure at Grasim, Kotputli
Rajasthan At Validation
AMS-II.D. 21 SGS n.a. Grasim Cement 06-nov-08
48 n/a Waste heat utilization project in Shree Cements Limited, Beawar
Rajasthan At Validation
ACM12 77 TÜV-SÜD
n.a. Shree Cement 09-nov-07

World Bank/CF Assist Barriers to CDM Project Development in Africa’s Cement Sector
Final Report
Econoler International A5-1 (REF : # 5430)
APPENDIX 5 QUESTIONNAIRE FOR CEMENT MANUFACTURERS IN SSA COUNTRIES
The World Bank through Carbon Finance Assist program (www.carbonfinance.org ) has mandated Econoler International (www.econolerint.com), a Canadian Company specialized in energy efficiency and CDM, to undertake a study to CDM projects in the Cement Sector.
Out of 31nos of CDM projects that have been registered from the cement industry worldwide, 22nos (~ 71%) are from the Indian cement industry. The balance 9 CDM projects in cement industry are from Argentina (1), China (3nos), Indonesia (2nos), Israel (1), Malaysia (1), and Uruguay (1).
The participation of Africa in CDM is very weak in terms of the number of projects and the volume of CERs. As on 20th June 2008, only 25 CDM projects (2.3%) registered by the CDM Executive Board (out of 1084) are located in Africa. In the cement sector, the share of projects located in Africa is almost nil while the cement plants installed in Africa belongs most often to the same International Cement group that are developing/implementing CDM projects in India and elsewhere.
This study will draw lessons learned from the success of CDM project in India and analyze the barriers and propose mitigations solutions that will help in building the capacity of the African cement industry to take up development of CDM projects. The Indian company Shri Shakti Alternative Energy Ltd (www.ssael.co.in) is assisting Econoler International in this study and will be conducting an analysis of the CDM projects in the cement industry in India to develop an understanding of the reasons for their tremendous success.
In this regard, we kindly solicit your valuable inputs and contribution by filling up this questionnaire and sending it back to Mr. Leon Biaou at Econoler International within one week.
Postal Address: 160, rue St-Paul, bureau 200, Québec (QC), Canada, G1K 3W1
Tel: 1(418) 692 2592 # 217 Fax: 1(418) 6924899
Email: [email protected]
Thank you for collaborating and spending your precious time on this survey.
Please, return the questionnaire either by fax or by email.
1. Name of the Company ……………………………………………………………………………………………...
2. Name of the contact person……………………………………………………………………………..................
3. Mailing address …………………………….…………………………………………………...............................
Telephone …………..……………………………………………Fax ……….....................................................
Mobile…..………………………………………..…………………………………………....................................
Email ………………………………………………………………………………………………………………….
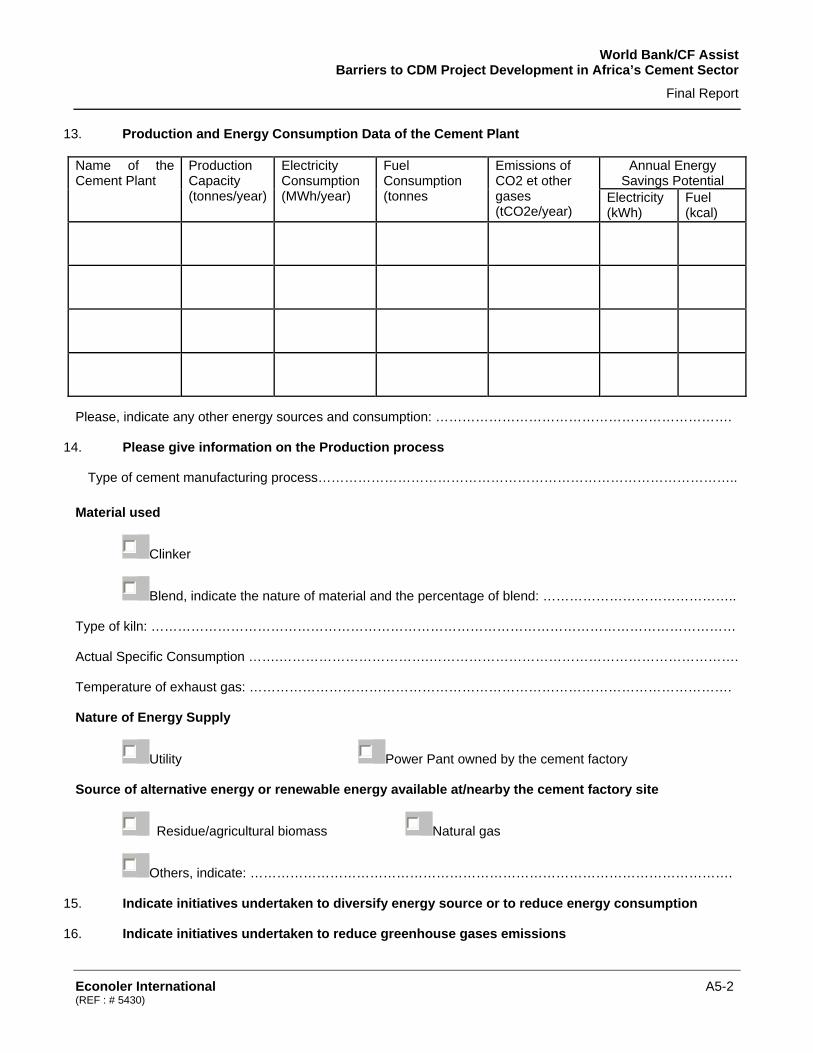
World Bank/CF Assist Barriers to CDM Project Development in Africa’s Cement Sector
Final Report
Econoler International A5-2 (REF : # 5430)
13. Production and Energy Consumption Data of the Cement Plant
Annual Energy Savings Potential
Name of the Cement Plant
Production Capacity (tonnes/year)
Electricity Consumption (MWh/year)
Fuel Consumption (tonnes
Emissions of CO2 et other gases (tCO2e/year)
Electricity (kWh)
Fuel (kcal)
Please, indicate any other energy sources and consumption: ………………………………………………………….
14. Please give information on the Production process
Type of cement manufacturing process…………………………………………………………………………………..
Material used
Clinker
Blend, indicate the nature of material and the percentage of blend: ……………………………………..
Type of kiln: ……………………………………………………………………………………………………………………
Actual Specific Consumption …….…………………………….…………………………………………………………….
Temperature of exhaust gas: ……………………………………………………………………………………………….
Nature of Energy Supply
Utility Power Pant owned by the cement factory
Source of alternative energy or renewable energy available at/nearby the cement factory site
Residue/agricultural biomass Natural gas
Others, indicate: ……………………………………………………………………………………………….
15. Indicate initiatives undertaken to diversify energy source or to reduce energy consumption
16. Indicate initiatives undertaken to reduce greenhouse gases emissions

World Bank/CF Assist Barriers to CDM Project Development in Africa’s Cement Sector
Final Report
Econoler International A5-3 (REF : # 5430)
17. Motivation for the CDM Project
Self
Industry association
Please indicate the name: ……………………………………………………………………..…………………...
Parent Company
Please, indicate the name :….……………………………………………………………………………………...
Chamber of commerce Government
Technology Supplier Consultant
Increase in energy costs Environmental Concerns
Other : …………………………………………………………………………………………………………………………
18. Please, described barriers faced or foreseen in the CDM projects development
19. How the barriers were overcome or will be overcome?
20. Your comments on the role of the CDM consultants in facilitating the whole process.
21. Your comments on the role of the Buyer in facilitating the whole process.
22. How did you pay or will you pay for the transaction costs of developing the CDM project?
Own Sources Borne by the Buyer
Was part of Consultant’s success fee
23. How did you fund or will you fund the investment costs related to the CDM Projects?
Own Sources Borrowings based on the CER delivery and ERPA
Upfront payment by the Buyer
24. Please provide any additional information that you feel would be useful for this study?
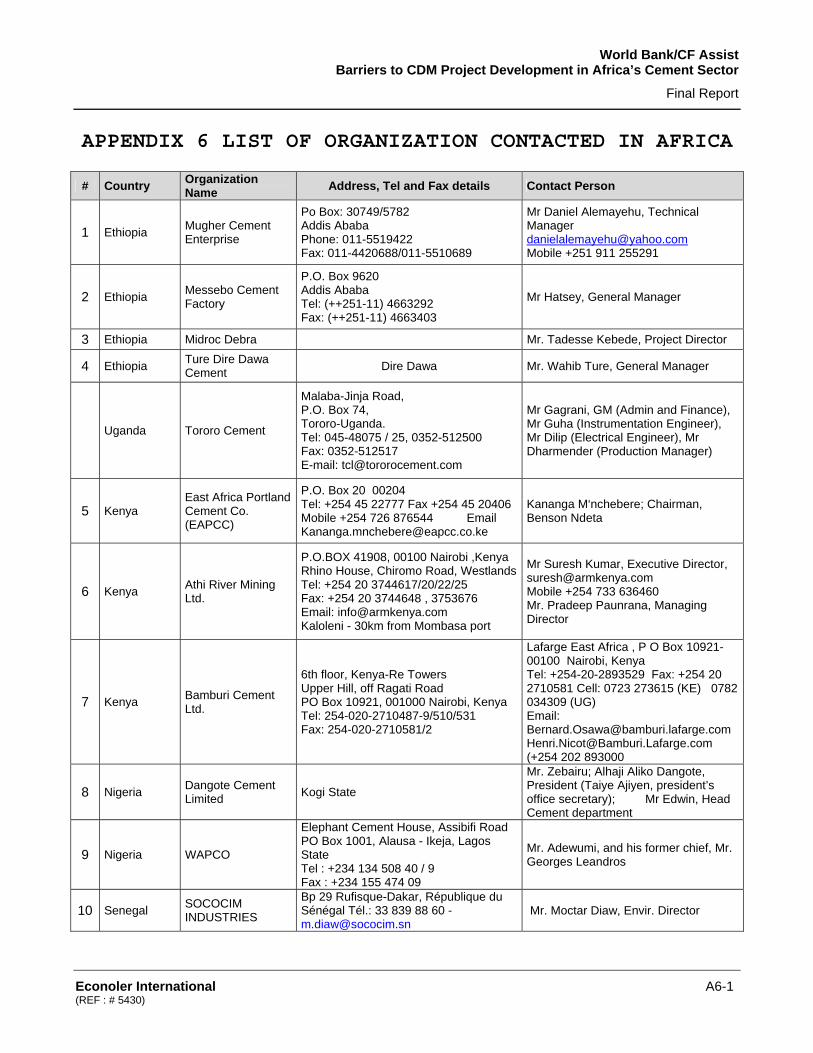
World Bank/CF Assist Barriers to CDM Project Development in Africa’s Cement Sector
Final Report
Econoler International A6-1 (REF : # 5430)
APPENDIX 6 LIST OF ORGANIZATION CONTACTED IN AFRICA
# Country Organization Name Address, Tel and Fax details Contact Person
1 Ethiopia Mugher Cement Enterprise
Po Box: 30749/5782 Addis Ababa Phone: 011-5519422 Fax: 011-4420688/011-5510689
Mr Daniel Alemayehu, Technical Manager [email protected] Mobile +251 911 255291
2 Ethiopia Messebo Cement Factory
P.O. Box 9620 Addis Ababa Tel: (++251-11) 4663292 Fax: (++251-11) 4663403
Mr Hatsey, General Manager
3 Ethiopia Midroc Debra Mr. Tadesse Kebede, Project Director
4 Ethiopia Ture Dire Dawa Cement Dire Dawa Mr. Wahib Ture, General Manager
Uganda Tororo Cement
Malaba-Jinja Road, P.O. Box 74, Tororo-Uganda. Tel: 045-48075 / 25, 0352-512500 Fax: 0352-512517 E-mail: [email protected]
Mr Gagrani, GM (Admin and Finance), Mr Guha (Instrumentation Engineer), Mr Dilip (Electrical Engineer), Mr Dharmender (Production Manager)
5 Kenya East Africa Portland Cement Co. (EAPCC)
P.O. Box 20 00204 Tel: +254 45 22777 Fax +254 45 20406Mobile +254 726 876544 Email [email protected]
Kananga M‘nchebere; Chairman, Benson Ndeta
6 Kenya Athi River Mining Ltd.
P.O.BOX 41908, 00100 Nairobi ,Kenya Rhino House, Chiromo Road, WestlandsTel: +254 20 3744617/20/22/25 Fax: +254 20 3744648 , 3753676 Email: [email protected] Kaloleni - 30km from Mombasa port
Mr Suresh Kumar, Executive Director, [email protected] Mobile +254 733 636460 Mr. Pradeep Paunrana, Managing Director
7 Kenya Bamburi Cement Ltd.
6th floor, Kenya-Re Towers Upper Hill, off Ragati Road PO Box 10921, 001000 Nairobi, Kenya Tel: 254-020-2710487-9/510/531 Fax: 254-020-2710581/2
Lafarge East Africa , P O Box 10921-00100 Nairobi, Kenya Tel: +254-20-2893529 Fax: +254 20 2710581 Cell: 0723 273615 (KE) 0782 034309 (UG) Email: [email protected] [email protected] (+254 202 893000
8 Nigeria Dangote Cement Limited Kogi State
Mr. Zebairu; Alhaji Aliko Dangote, President (Taiye Ajiyen, president’s office secretary); Mr Edwin, Head Cement department
9 Nigeria WAPCO
Elephant Cement House, Assibifi Road PO Box 1001, Alausa - Ikeja, Lagos State Tel : +234 134 508 40 / 9 Fax : +234 155 474 09
Mr. Adewumi, and his former chief, Mr. Georges Leandros
10 Senegal SOCOCIM INDUSTRIES
Bp 29 Rufisque-Dakar, République du Sénégal Tél.: 33 839 88 60 - [email protected]
Mr. Moctar Diaw, Envir. Director

World Bank/CF Assist Barriers to CDM Project Development in Africa’s Cement Sector
Final Report
Econoler International A6-2 (REF : # 5430)
# Country Organization Name Address, Tel and Fax details Contact Person
11 Senegal Ciments du Sahel Km 23 Rufisque, BP 96 Dakar Tel.: 33 839.87.27 [email protected]
M. Latfallah Layousse
12 Tanzania Mbeya Cement Ltd Mr. Bernard Osawa, Manager Alternative Fuels
13 Tanzania Tanzania Portland Cement Company Ltd. (Heidelberg)
Wazo Hill outside the capital Dar Es Salaam, P.O Box 1950- Tel: +255 22 263 0130/5 Fax: +255 22 263 0139
Mr Per-Ove Anderson, Technical Director Cell + 255 (0) 713 25 50 30 Phone : + 255 (0) 22 263 0130 [email protected]
14 Tanzania Tanga Cement
2nd & 3rd Floors 50 Mirambo Street PO Box 78478 Dar es Salaam, Tanzania Phone : +255 22 2120 135 Fax : +255 22 2135448 Email : [email protected]
Mr. Harpreet Duggal, Head – Strategic Planning
15 DR Congo Cimenterie Nationale
BP 12198 Kinsasha 1; [email protected] - Mobile: +243 815020176
Alphonse Mabondo Kembolo
16 DR Congo Cimenterie de Lukala
7598 Kinsasha; Mobile: +243 817008232; email: [email protected] Jean-Louis Iyolo
17 Benin SCB-Lafarge - Onigbolo
Lot C11, Résidence les Cocotiers, 01 BP 1557 Cotonou Tél. : (229) 21 30 61 81 Fax : (229) 21 30 61 83 [email protected] / [email protected]
Marius ELEGBEDE- Managing Director
18 Togo WACEM
BP 07 Tabligbo TOGO Tel:+ 228 334 03 94; Fax :+228 339 63 07 Mobile: + 228 945 40 40 Email : [email protected]
K. S. CHOWDARY, R&D Division
19 Togo CIMTOGO-SA Zone Industrielle Portuaire, B.P 1687 Lomé- Tel: +288 2 270 859; Fax: +228 2 227 132
Jean-Marc Junon / Jen François SANGLINE, Directeur Technique
20 Uganda Hima Cement Ltd
P.O. Box 7230 Kampala, Uganda [email protected] Tel: 006-031-213100/200 Fax: 006-041-345901
Mr. Allen Mate, Plant Manager
21 Niger Société Nigérienne de Cimenterie (SNC-SA)
Societe Nigerienne de Cimenterie S.A B.P. 335 Niamey, Niger Tel.: +227 20 74 26 02/92 Mobile: 96280014 Fax: (227)20741915
Ousmane IDI ANGO, Addl Managing Director E-mail: [email protected]
22 Cameroun Cimenterie du Cameroun
BP 1323 Douala Tél + 237 339 11 19 Fax + 237 339 09 84
Mr Noe IKOUE, Industrial and Technical Director Direct Line +237 339 75 23 Fax +237 339 75 23 Mobile +237 709 01 10 Email: [email protected].
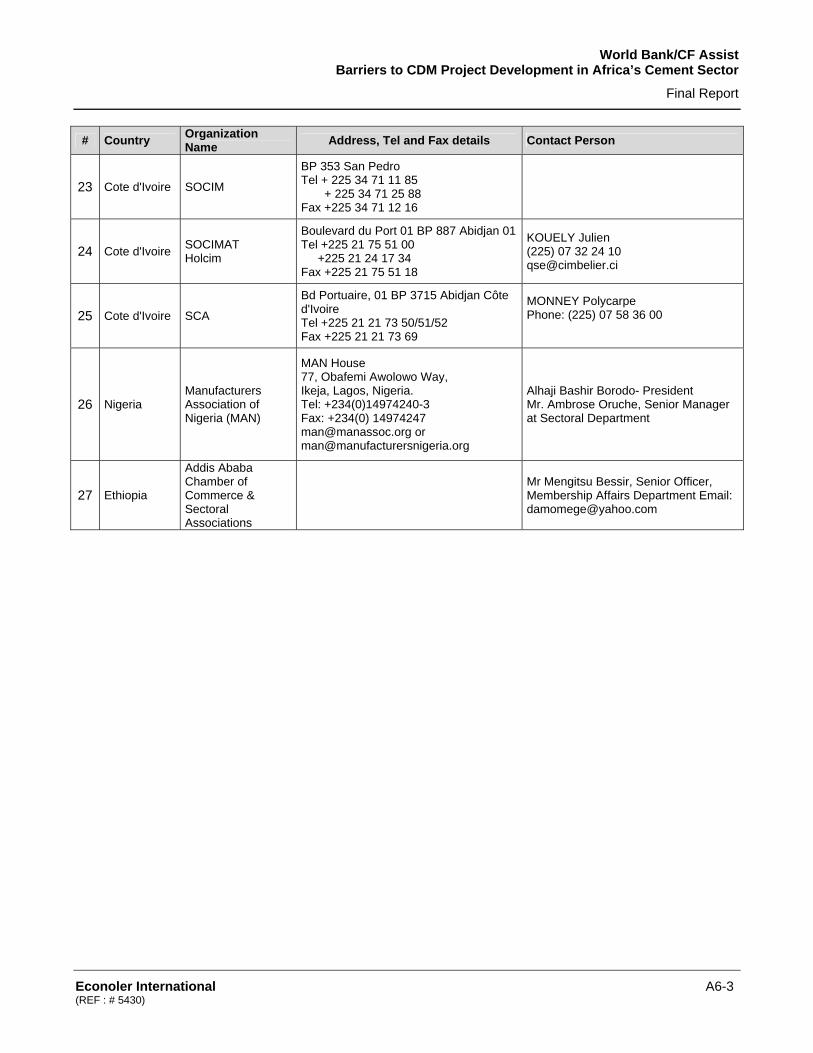
World Bank/CF Assist Barriers to CDM Project Development in Africa’s Cement Sector
Final Report
Econoler International A6-3 (REF : # 5430)
# Country Organization Name Address, Tel and Fax details Contact Person
23 Cote d'Ivoire SOCIM
BP 353 San Pedro Tel + 225 34 71 11 85 + 225 34 71 25 88 Fax +225 34 71 12 16
24 Cote d'Ivoire SOCIMAT Holcim
Boulevard du Port 01 BP 887 Abidjan 01Tel +225 21 75 51 00 +225 21 24 17 34 Fax +225 21 75 51 18
KOUELY Julien (225) 07 32 24 10 [email protected]
25 Cote d'Ivoire SCA
Bd Portuaire, 01 BP 3715 Abidjan Côte d'Ivoire Tel +225 21 21 73 50/51/52 Fax +225 21 21 73 69
MONNEY Polycarpe Phone: (225) 07 58 36 00
26 Nigeria Manufacturers Association of Nigeria (MAN)
MAN House 77, Obafemi Awolowo Way, Ikeja, Lagos, Nigeria. Tel: +234(0)14974240-3 Fax: +234(0) 14974247 [email protected] or [email protected]
Alhaji Bashir Borodo- President Mr. Ambrose Oruche, Senior Manager at Sectoral Department
27 Ethiopia
Addis Ababa Chamber of Commerce & Sectoral Associations
Mr Mengitsu Bessir, Senior Officer, Membership Affairs Department Email: [email protected]
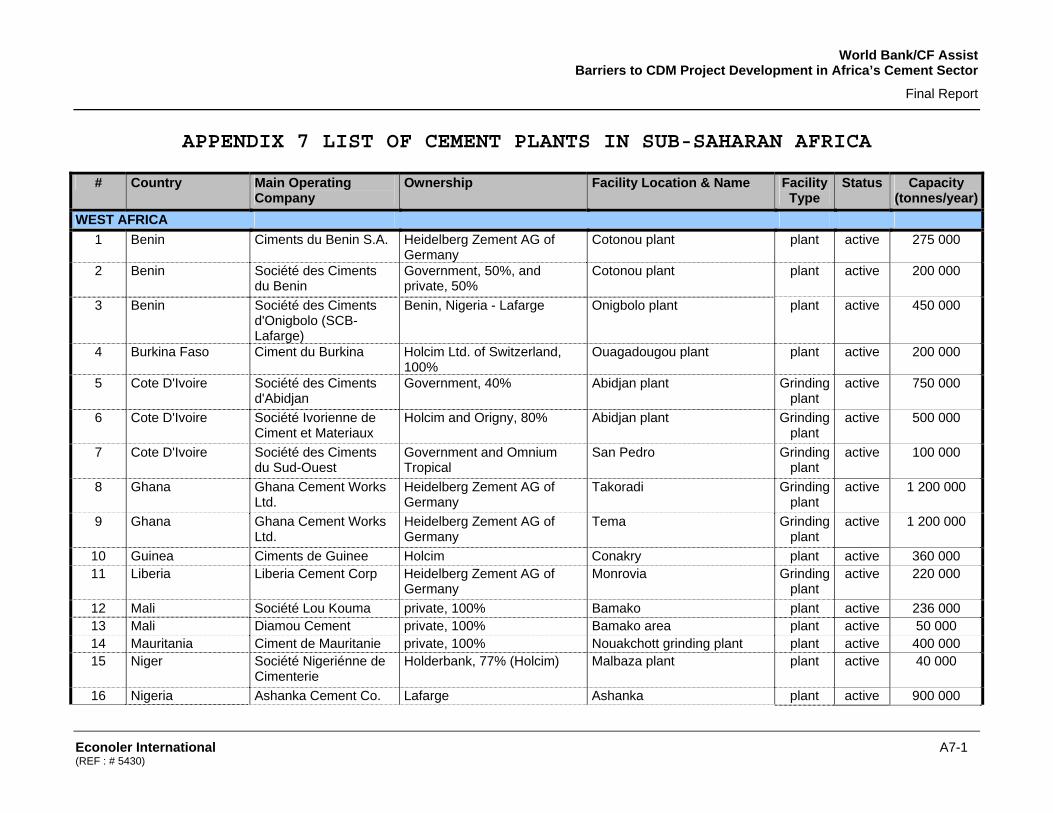
World Bank/CF Assist Barriers to CDM Project Development in Africa’s Cement Sector
Final Report
Econoler International A7-1 (REF : # 5430)
APPENDIX 7 LIST OF CEMENT PLANTS IN SUB-SAHARAN AFRICA
# Country Main Operating Company
Ownership Facility Location & Name Facility Type
Status Capacity (tonnes/year)
WEST AFRICA 1 Benin Ciments du Benin S.A. Heidelberg Zement AG of
Germany Cotonou plant plant active 275 000
2 Benin Société des Ciments du Benin
Government, 50%, and private, 50%
Cotonou plant plant active 200 000
3 Benin Société des Ciments d'Onigbolo (SCB-Lafarge)
Benin, Nigeria - Lafarge Onigbolo plant plant active 450 000
4 Burkina Faso Ciment du Burkina Holcim Ltd. of Switzerland, 100%
Ouagadougou plant plant active 200 000
5 Cote D'Ivoire Société des Ciments d'Abidjan
Government, 40% Abidjan plant Grinding plant
active 750 000
6 Cote D'Ivoire Société Ivorienne de Ciment et Materiaux
Holcim and Origny, 80% Abidjan plant Grinding plant
active 500 000
7 Cote D'Ivoire Société des Ciments du Sud-Ouest
Government and Omnium Tropical
San Pedro Grinding plant
active 100 000
8 Ghana Ghana Cement Works Ltd.
Heidelberg Zement AG of Germany
Takoradi Grinding plant
active 1 200 000
9 Ghana Ghana Cement Works Ltd.
Heidelberg Zement AG of Germany
Tema Grinding plant
active 1 200 000
10 Guinea Ciments de Guinee Holcim Conakry plant active 360 000 11 Liberia Liberia Cement Corp Heidelberg Zement AG of
Germany Monrovia Grinding
plant active 220 000
12 Mali Société Lou Kouma private, 100% Bamako plant active 236 000 13 Mali Diamou Cement private, 100% Bamako area plant active 50 000 14 Mauritania Ciment de Mauritanie private, 100% Nouakchott grinding plant plant active 400 000 15 Niger Société Nigeriénne de
Cimenterie Holderbank, 77% (Holcim) Malbaza plant plant active 40 000
16 Nigeria Ashanka Cement Co. Lafarge Ashanka plant active 900 000

World Bank/CF Assist Barriers to CDM Project Development in Africa’s Cement Sector
Final Report
Econoler International A7-2 (REF : # 5430)
# Country Main Operating Company
Ownership Facility Location & Name Facility Type
Status Capacity (tonnes/year)
plc 17 Nigeria Benue Cement Co. Benue State plant active 900 000 18 Nigeria United Cement Co of
Nigeria Holcim Calbar plant closed 2 000 000
19 Nigeria West Africa Portland Cement Co.
Lafarge Ewekoro plant active 1 500 000
20 Nigeria Dangote Cement Works
Ibese plant closed 2 300 000
21 Nigeria Nigeria Cement Co. Nkalagu plant closed 600 000 22 Nigeria Bendel Cement Co.
Ltd. Okepella plant closed 450 000
23 Nigeria West Africa Portland Cement Co.
Lafarge Shagamu plant active 600 000
24 Nigeria Cement Co. of Northern Nigeria
Sokoto plant active 500 000
25 Senegal Société Ouest Africaine des Ciments
private, 100% Rufisque plant active 1 600 000
26 Senegal Les Ciments du Sahel S.A. of Senegal
private, 100% Kirène plant active 600 000
27 Sierra Leone Sierra Leone Cement Corp. Ltd.
HeidlebergCement, 50% Freetown Grinding plant
active 110 000
28 Togo Ciments du Togo S.A. Heidelberg Zement AG of Germany
Lomé mill active 600 000
29 Togo West African Cement S.A.
Tabligbo mill active 400 000
CENTRAL AFRICA 30 Angola Nova Cimangola
S.A.R.L. Scanang Holding Co., 49%, Government, 39.8%, and Bank BAI, 9.5%
Luanda plant active 700 000
31 Burundi Burundi Cement Plant Bujumbura Plant active 20 000 32 Cameroon Cimenteries du
Cameroun Lafarge Group, 57% Bonaberi near Douala and
Figuil at Garoua Grinding
plant active 1 200 000
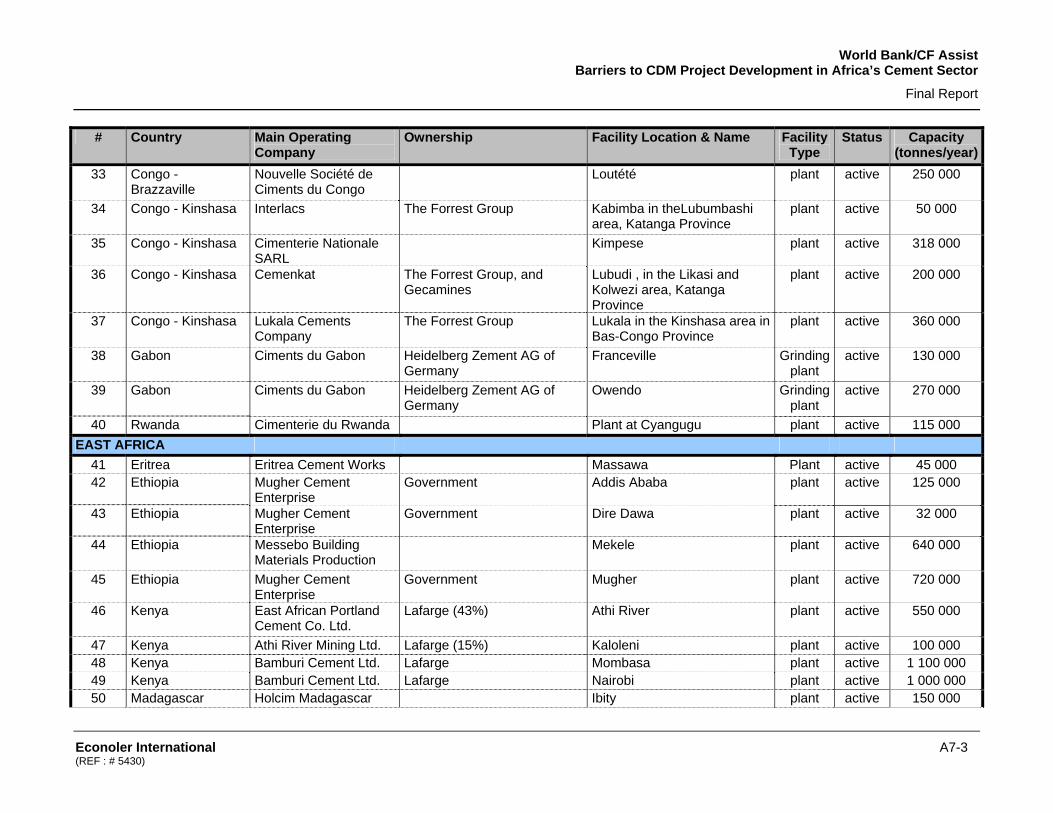
World Bank/CF Assist Barriers to CDM Project Development in Africa’s Cement Sector
Final Report
Econoler International A7-3 (REF : # 5430)
# Country Main Operating Company
Ownership Facility Location & Name Facility Type
Status Capacity (tonnes/year)
33 Congo - Brazzaville
Nouvelle Société de Ciments du Congo
Loutété plant active 250 000
34 Congo - Kinshasa Interlacs The Forrest Group Kabimba in theLubumbashi area, Katanga Province
plant active 50 000
35 Congo - Kinshasa Cimenterie Nationale SARL
Kimpese plant active 318 000
36 Congo - Kinshasa Cemenkat The Forrest Group, and Gecamines
Lubudi , in the Likasi and Kolwezi area, Katanga Province
plant active 200 000
37 Congo - Kinshasa Lukala Cements Company
The Forrest Group Lukala in the Kinshasa area in Bas-Congo Province
plant active 360 000
38 Gabon Ciments du Gabon Heidelberg Zement AG of Germany
Franceville Grinding plant
active 130 000
39 Gabon Ciments du Gabon Heidelberg Zement AG of Germany
Owendo Grinding plant
active 270 000
40 Rwanda Cimenterie du Rwanda Plant at Cyangugu plant active 115 000 EAST AFRICA
41 Eritrea Eritrea Cement Works Massawa Plant active 45 000 42 Ethiopia Mugher Cement
Enterprise Government Addis Ababa plant active 125 000
43 Ethiopia Mugher Cement Enterprise
Government Dire Dawa plant active 32 000
44 Ethiopia Messebo Building Materials Production
Mekele plant active 640 000
45 Ethiopia Mugher Cement Enterprise
Government Mugher plant active 720 000
46 Kenya East African Portland Cement Co. Ltd.
Lafarge (43%) Athi River plant active 550 000
47 Kenya Athi River Mining Ltd. Lafarge (15%) Kaloleni plant active 100 000 48 Kenya Bamburi Cement Ltd. Lafarge Mombasa plant active 1 100 000 49 Kenya Bamburi Cement Ltd. Lafarge Nairobi plant active 1 000 000 50 Madagascar Holcim Madagascar Ibity plant active 150 000

World Bank/CF Assist Barriers to CDM Project Development in Africa’s Cement Sector
Final Report
Econoler International A7-4 (REF : # 5430)
# Country Main Operating Company
Ownership Facility Location & Name Facility Type
Status Capacity (tonnes/year)
S.A. 51 Madagascar SA Nouvelle
Cimenterie Amboanio Mahajanga plant active 40 000
52 Malawi Portland Cement Co. Ltd.
Blantyre plant active 288 000
53 Malawi Portland Cement Co. Ltd.
Lafarge Changalume plant active 180 000
54 Malawi Shayona Cement Corp. Livwezi plant active 37 000 55 Mozambique Cimentos de
Moçambique, SARL Cimentos de Portugal SGPS, S.A. (CIMPOR)
Matola - active 380 000
56 Mozambique Cimentos de Moçambique, SARL
Cimentos de Portugal SGPS, S.A. (CIMPOR)
Nacala - active NA
57 Mozambique Cimentos de Moçambique, SARL
Cimentos de Portugal SGPS, S.A. (CIMPOR)
Dondo - active 380 000
58 Somalia Berbera Cement Agency
Berbera plant closed 200 000
59 Tanzania Mbeya Cement Co. Ltd.
LaFarge Group Mbeya plant active 250 000
60 Tanzania Tanga Cement Co. Ltd. Holcim Ltd., 60% Tanga plant active 500 000 61 Tanzania Tanzania Portland
Cement Co. Ltd. Heidelberg Zement AG of Germany
Wazo Hill plant active 500 000
62 Uganda Hima Cement Industries Ltd.
Bamburi Cement Ltd., 70% (Lafarge)
Kasese plant active 300 000
63 Uganda Tororo Cement Industries Ltd.
Tororo plant active 220 000
64 Zambia Chilanga Cement plc Lafarge, 51% Lusaka plant active 207 000 65 Zambia Chilanga Cement plc Lafarge, 51% Ndola plant active 310 000 66 Zimbabwe Portland Holdings Ltd. Pretoria Portland Cement Co.
Ltd. Bulawayo plant active 200 000
67 Zimbabwe Portland Holdings Ltd. Pretoria Portland Cement Co. Ltd.
Gwanda plant active 250 000
68 Zimbabwe Circle Cement Ltd. Lafarge Harare plant active NA
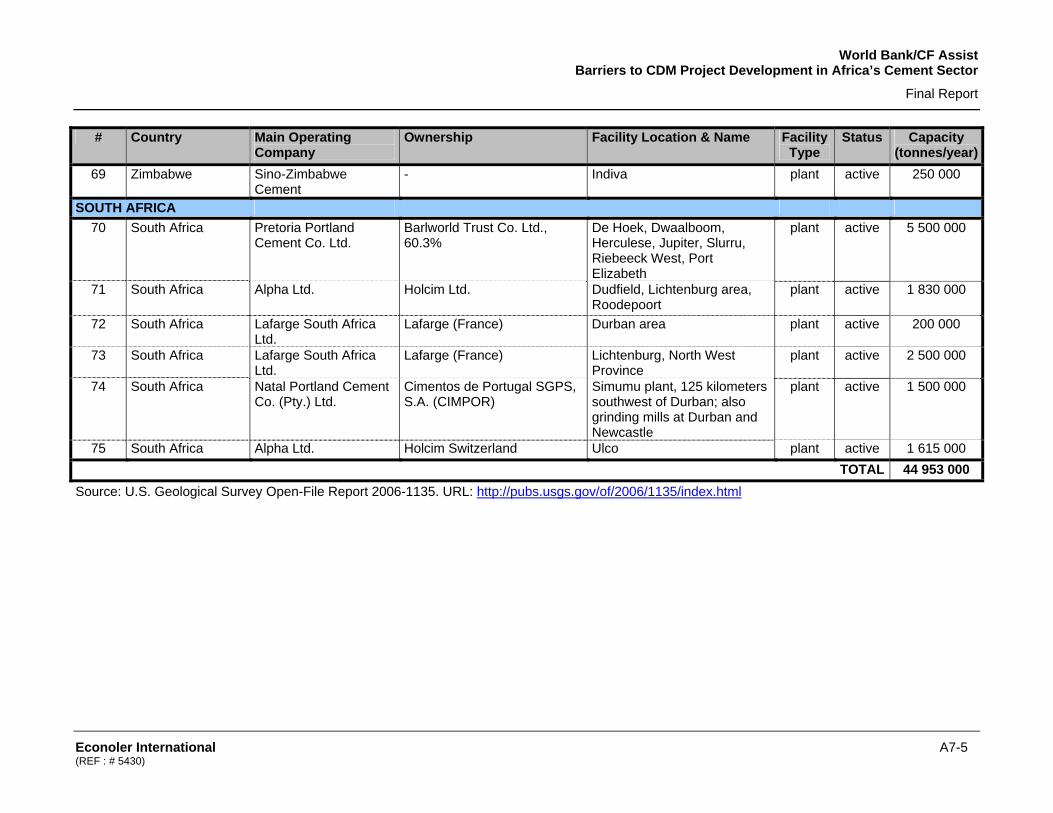
World Bank/CF Assist Barriers to CDM Project Development in Africa’s Cement Sector
Final Report
Econoler International A7-5 (REF : # 5430)
# Country Main Operating Company
Ownership Facility Location & Name Facility Type
Status Capacity (tonnes/year)
69 Zimbabwe Sino-Zimbabwe Cement
- Indiva plant active 250 000
SOUTH AFRICA 70 South Africa Pretoria Portland
Cement Co. Ltd. Barlworld Trust Co. Ltd., 60.3%
De Hoek, Dwaalboom, Herculese, Jupiter, Slurru, Riebeeck West, Port Elizabeth
plant active 5 500 000
71 South Africa Alpha Ltd. Holcim Ltd. Dudfield, Lichtenburg area, Roodepoort
plant active 1 830 000
72 South Africa Lafarge South Africa Ltd.
Lafarge (France) Durban area plant active 200 000
73 South Africa Lafarge South Africa Ltd.
Lafarge (France) Lichtenburg, North West Province
plant active 2 500 000
74 South Africa Natal Portland Cement Co. (Pty.) Ltd.
Cimentos de Portugal SGPS, S.A. (CIMPOR)
Simumu plant, 125 kilometers southwest of Durban; also grinding mills at Durban and Newcastle
plant active 1 500 000
75 South Africa Alpha Ltd. Holcim Switzerland Ulco plant active 1 615 000 TOTAL 44 953 000
Source: U.S. Geological Survey Open-File Report 2006-1135. URL: http://pubs.usgs.gov/of/2006/1135/index.html
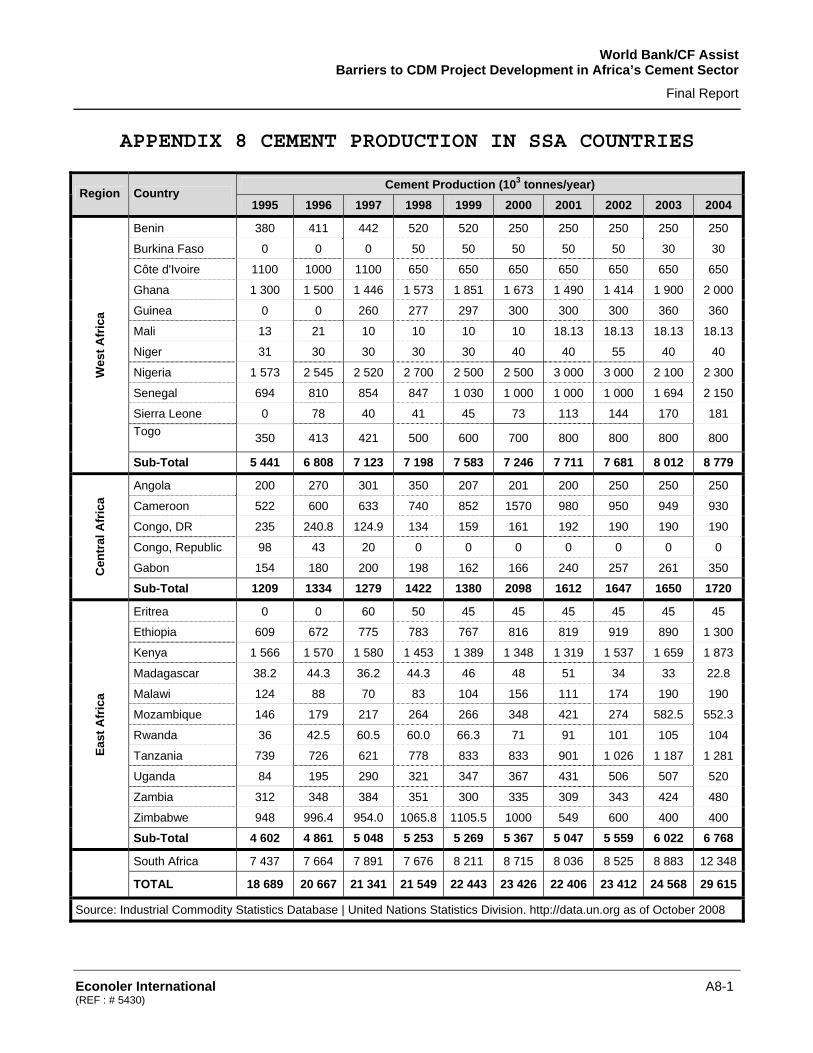
World Bank/CF Assist Barriers to CDM Project Development in Africa’s Cement Sector
Final Report
Econoler International A8-1 (REF : # 5430)
APPENDIX 8 CEMENT PRODUCTION IN SSA COUNTRIES
Cement Production (103 tonnes/year) Region Country
1995 1996 1997 1998 1999 2000 2001 2002 2003 2004
Benin 380 411 442 520 520 250 250 250 250 250
Burkina Faso 0 0 0 50 50 50 50 50 30 30
Côte d'Ivoire 1100 1000 1100 650 650 650 650 650 650 650
Ghana 1 300 1 500 1 446 1 573 1 851 1 673 1 490 1 414 1 900 2 000
Guinea 0 0 260 277 297 300 300 300 360 360
Mali 13 21 10 10 10 10 18.13 18.13 18.13 18.13
Niger 31 30 30 30 30 40 40 55 40 40
Nigeria 1 573 2 545 2 520 2 700 2 500 2 500 3 000 3 000 2 100 2 300
Senegal 694 810 854 847 1 030 1 000 1 000 1 000 1 694 2 150
Sierra Leone 0 78 40 41 45 73 113 144 170 181 Togo 350 413 421 500 600 700 800 800 800 800
Wes
t Afr
ica
Sub-Total 5 441 6 808 7 123 7 198 7 583 7 246 7 711 7 681 8 012 8 779
Angola 200 270 301 350 207 201 200 250 250 250
Cameroon 522 600 633 740 852 1570 980 950 949 930
Congo, DR 235 240.8 124.9 134 159 161 192 190 190 190
Congo, Republic 98 43 20 0 0 0 0 0 0 0
Gabon 154 180 200 198 162 166 240 257 261 350 Cen
tral
Afr
ica
Sub-Total 1209 1334 1279 1422 1380 2098 1612 1647 1650 1720
Eritrea 0 0 60 50 45 45 45 45 45 45
Ethiopia 609 672 775 783 767 816 819 919 890 1 300
Kenya 1 566 1 570 1 580 1 453 1 389 1 348 1 319 1 537 1 659 1 873
Madagascar 38.2 44.3 36.2 44.3 46 48 51 34 33 22.8
Malawi 124 88 70 83 104 156 111 174 190 190
Mozambique 146 179 217 264 266 348 421 274 582.5 552.3
Rwanda 36 42.5 60.5 60.0 66.3 71 91 101 105 104
Tanzania 739 726 621 778 833 833 901 1 026 1 187 1 281
Uganda 84 195 290 321 347 367 431 506 507 520
Zambia 312 348 384 351 300 335 309 343 424 480
Zimbabwe 948 996.4 954.0 1065.8 1105.5 1000 549 600 400 400
East
Afr
ica
Sub-Total 4 602 4 861 5 048 5 253 5 269 5 367 5 047 5 559 6 022 6 768
South Africa 7 437 7 664 7 891 7 676 8 211 8 715 8 036 8 525 8 883 12 348
TOTAL 18 689 20 667 21 341 21 549 22 443 23 426 22 406 23 412 24 568 29 615
Source: Industrial Commodity Statistics Database | United Nations Statistics Division. http://data.un.org as of October 2008

World Bank/CF Assist Barriers to CDM Project Development in Africa’s Cement Sector
Final Report
Econoler International (REF : # 5430)
BIBLIOGRAPHY
De Gouvello, C., Dayo F. B., and Thioye, M. 2008. Low-carbon Energy Projects for Development in Sub-Saharan Africa, Unveiling the Potential, Addressing the Barriers. The International Bank for Reconstruction and Development / The World Bank
Culverhouse, Stuart. 2006. Africa Building Foundations - Cement Companies in SSA. December 2006. As consulted at http://columbuscapitaladvisor.com/ in October 2008.
Ghosh, S.P. 2008. Indian Cement Industry from 20 to 21 st Century, presented at Stakeholder Discussion Forum: Building a sustainable cement sector in India, September 18th – 20th
Global Environment Centre. 2007. CER Estimation Toolkit, version 2 of March 2007
ICF. 2007. Analysis of activities implemented under the Nairobi Framework in Sub-Saharan Africa. Achievements, challenges and solutions. Final Report, October 2007.
ICICI. 2008. Equity Research Report: Cement Sector - BSE Sensex: 16481, April 2008
CII (Confederation of Indian Industry). 2004. Investors Manual for Energy Efficiency: Cement.
IEA (International Energy Agency). 2007. Tracking Industrial Energy Efficiency and CO2 Emissions.
IEA. 2006. Energy Efficiency and CO2 Emissions from the Global Cement Industry.
IRC (International Cement Review). 2007. Global Cement Report, 7th Edition. http://www.cemnet.com/publications/GlobalCementReport/default.aspx
Lafarge. 2007. Lafarge in Kenya and Uganda: a sustainable commitment. Press kit, October 2007.
Lafarge. 2007. Annual Report.
OECD. 2008. Africa in 2008: Breaking down the Growth (based on the African Economic Outlook 2008). Policy Insights No 64, April 2008.
TERI BCSD. 2008. Building a sustainable cement sector in India, Stakeholder Discussion Forum, New Delhi, 18th – 20th September 2008.
U.S. Geological Survey. 2006. Mineral Facilities of Africa and the Middle East. Open-File Report 2006-1135 at as consulted at http://pubs.usgs.gov/of/2006/1135/index.html in October 2008.
UNEP Risoe. 2009. CDM/JI Pipeline Analysis and Database. Version of 1st January 2009.
UNFCC (United Nations Framework Convention on Climate Change). 2008. PDD - WAPCO Blended Cement (BC) Project at: Sagamu and Ewekoro Cement Plants as submitted by WAPCO
UNFCC. 2008. PDD – SOCOCIM Partial Substitution of Coal by Jatropha Fruits and Biomass Residues in the Production of Portland Cement as submitted by SOCOCIM.
UNSD (United Nations Statistics Division). 2008. Industrial Commodity Statistics Database. http://data.un.org as of October 2008.
UNSD. 2008. United Nations Commodity Trade Statistics. Available online at: http://comtrade.un.org
WBCSD (World Business Council on Sustainable Development). 2002. Towards a Sustainable Cement Industry. Climate Change.
World Bank. 2008. State and Trends of the Carbon Market 2008.

Econoler International A8-1 (REF : # 5430)
160, rue Saint-Paul, bureau 200, Québec (Québec) G1K 3W1 Canada Tel. : +1 (418) 692-2592 Fax : +1 (418) 692-4899 92Hwww.econolerint.com www.econoler.ca