Cement industry in Poland
26
This project is funded by the European Union Cement industry in Poland Andrzej Werkowski, Expert GHG Inventory and MRV of Industrial Emissions Workshop, Tbilisi, 27-28 March 2017
Transcript of Cement industry in Poland

This project is funded by
the European Union
Cement industry in PolandAndrzej Werkowski, Expert
GHG Inventory and MRV of Industrial Emissions
Workshop, Tbilisi, 27-28 March 2017
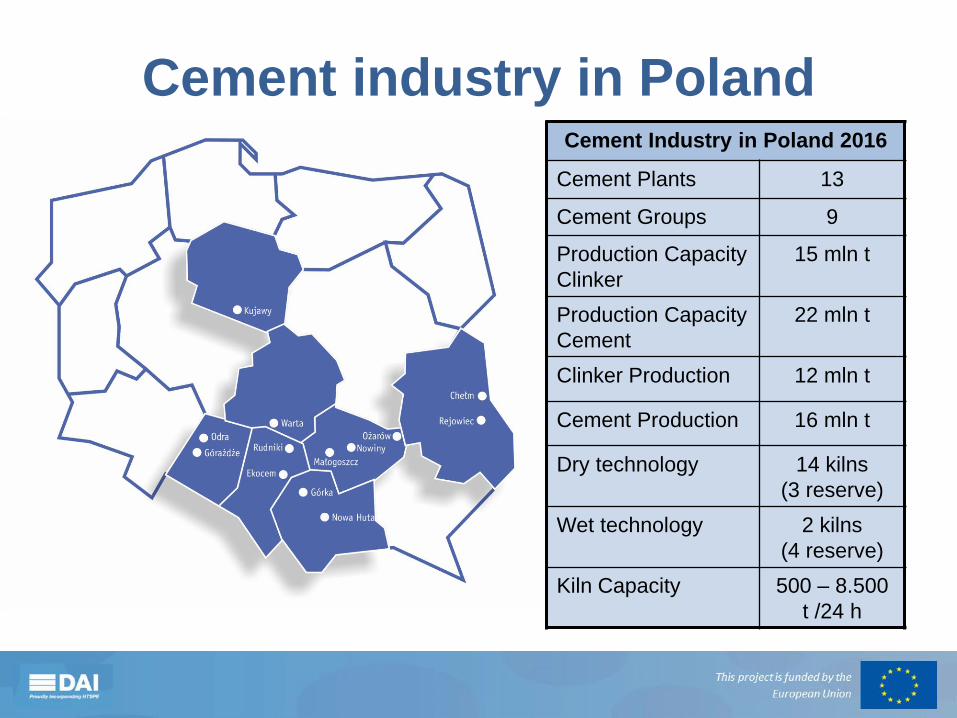
Cement industry in PolandCement Industry in Poland 2016
Cement Plants 13
Cement Groups 9
Production Capacity
Clinker
15 mln t
Production Capacity
Cement
22 mln t
Clinker Production 12 mln t
Cement Production 16 mln t
Dry technology 14 kilns
(3 reserve)
Wet technology 2 kilns
(4 reserve)
Kiln Capacity 500 – 8.500
t /24 h
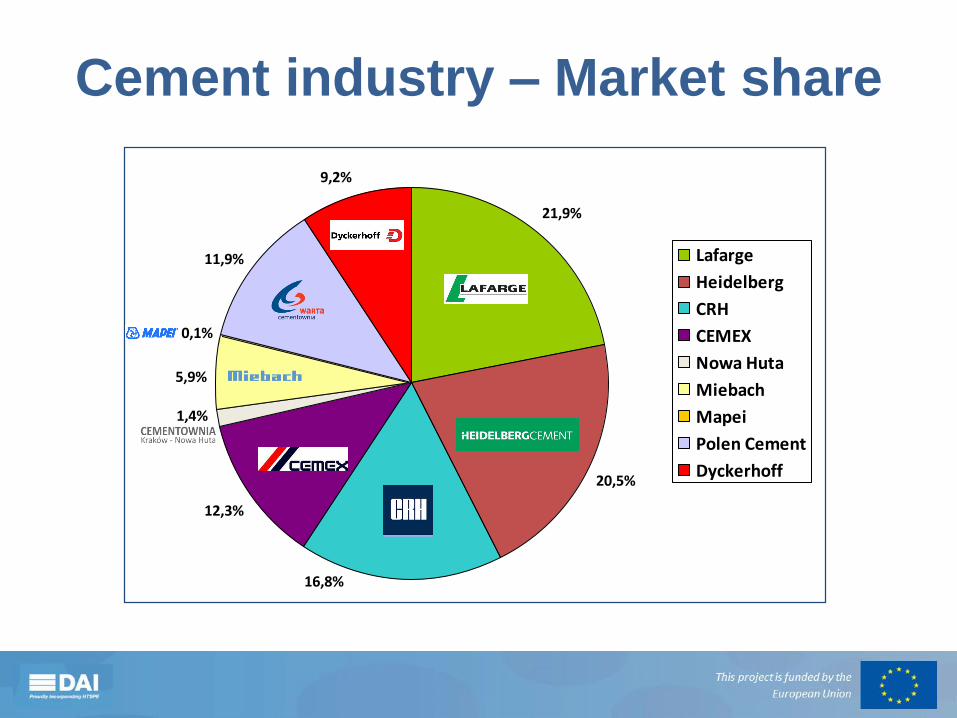
Cement industry – Market share
21,9%
20,5%
12,3%
0,1%
11,9%
9,2%
16,8%
1,4%
5,9%
Lafarge
Heidelberg
CRH
CEMEX
Nowa Huta
Miebach
Mapei
Polen Cement
Dyckerhoff

Cement Plants in Poland
• Górażdże
• Ekocem

Cement Plants in Poland
• Małogoszcz
• Kujawy

Cement Plants in Poland
• Ożarów
• Rejowiec

Cement Plants in Poland
Polen Cement
• Warta
• Odra
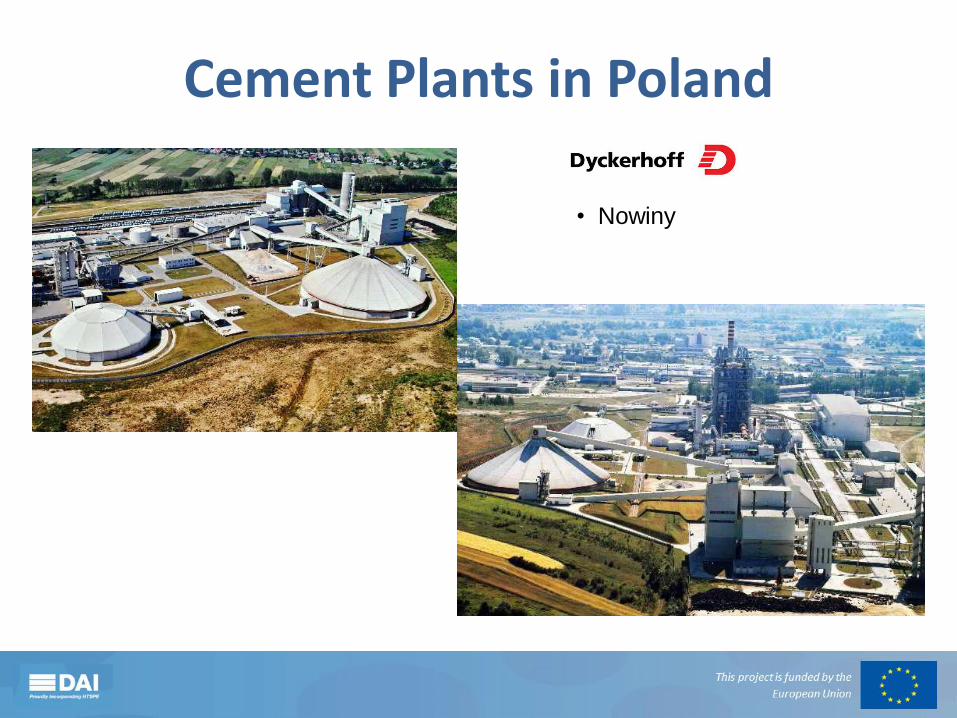
Cement Plants in Poland
• Nowiny

Cement Plants in Poland
• Chełm
• Rudniki

Cement Plants in Poland
Cement Plant Kraków – Nowa Huta

Cement Plants in Poland
• Górka (Aluminous cement)
Technology
• Over 98% of cement production in Poland is
produced using dry method and modern
technology meeting BAT requirements
• Most of production lines are equipped with novel
cyclon heat exchangers and calciners
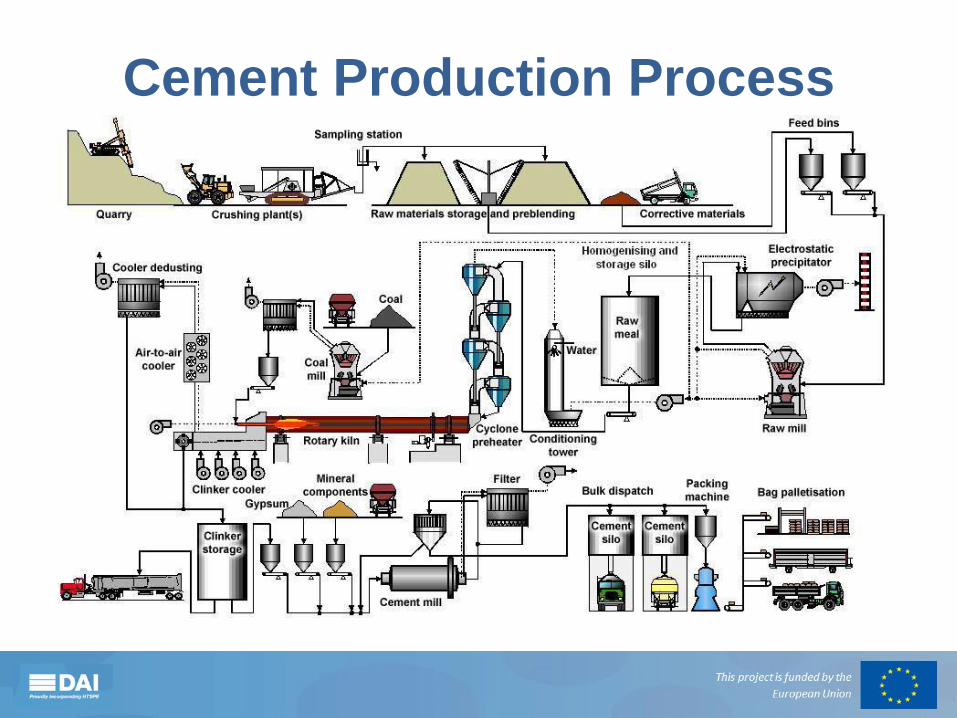
Cement Production Process

Cement industry in Poland Energy efficiency related factors
Consumption of: 2009 2010 2011 2012 2013
Coal[th Mg]
864 962 1 203 920 726
Alternative fuels[th Mg]
752 952 1 227 1 180 1 131
Electric energykWh/Mg cement
98 100 102 104 104
HeatkJ/kg clinker
3 692 3 712 3 828 3 766 3 722
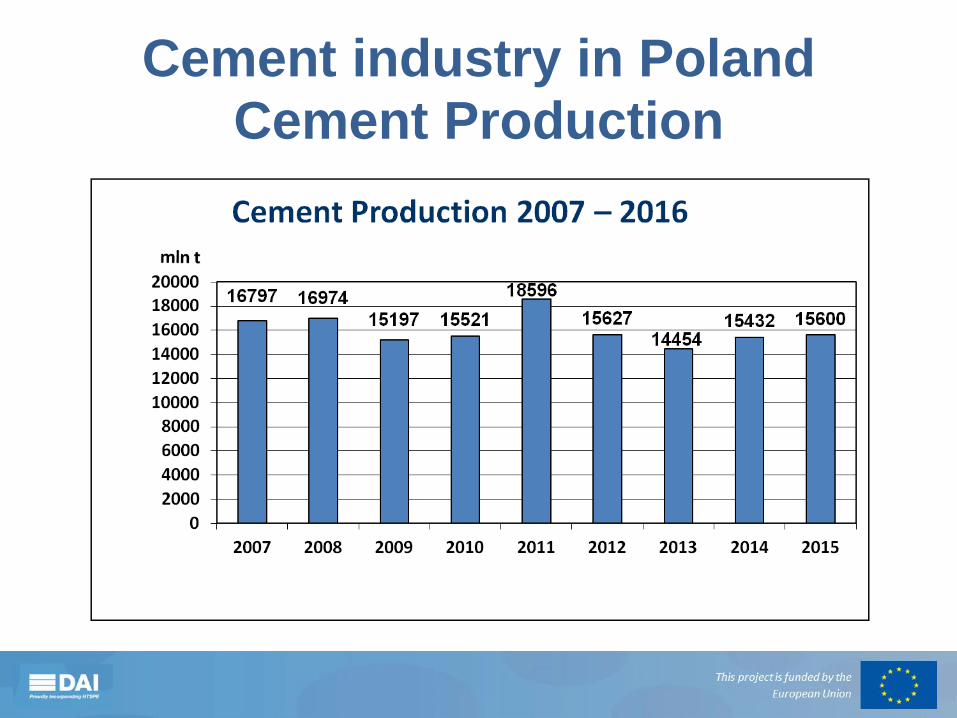
Cement industry in Poland
Cement Production

Cement industry in PolandCement and Clinker production

Cement industry in PolandCO2 emissions

Cement Production Energy consump[tion
Depending on raw materials and technology used cost of energy
represents 20% ÷ 40% of total variable cost of cement production

Cement industry – Alternative fuel
0
5
10
15
20
25
30
35
40
45
50
%
1990 2000 2005 2009 2010 2011 2012 2013
Heat from Alternative Fuel
World EU Poland
Alternative Fuel Mix
1,8%1,3% 1,7%
3,1%
6,4%
0,6%
85,1%
RDF Sewage waste
Used tires Waste from Power Plants
Coal processing waste Rubber waste
Other
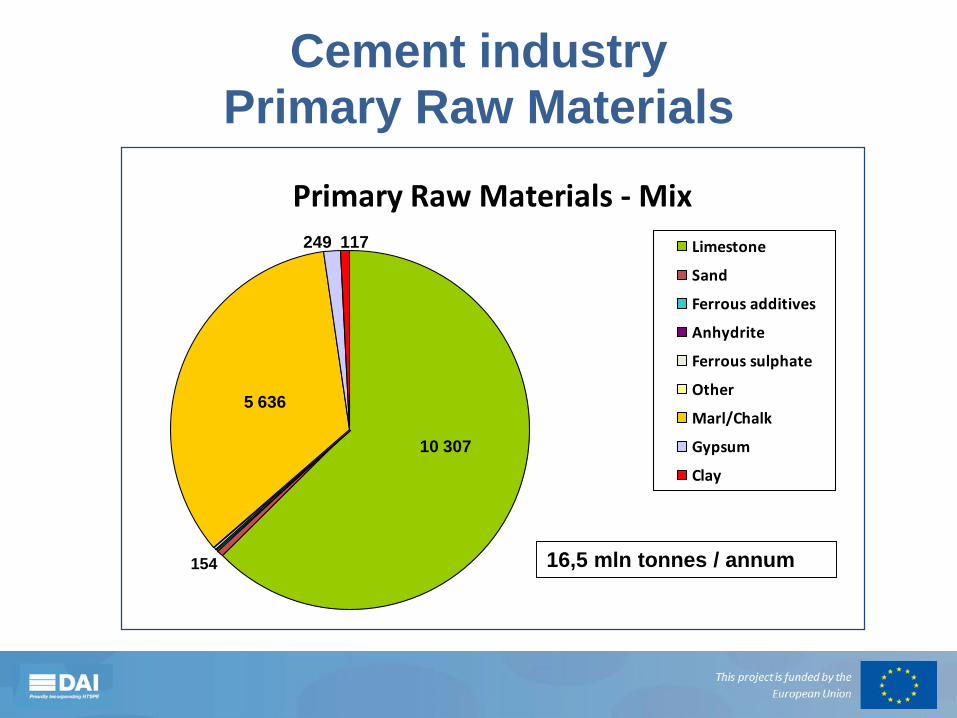
Cement industry Primary Raw Materials
Primary Raw Materials - Mix117249
10 307
5 636
Limestone
Sand
Ferrous additives
Anhydrite
Ferrous sulphate
Other
Marl/Chalk
Gypsum
Clay
16,5 mln tonnes / annum154

Cement industry Alternative Raw Materials
Secondary Raw Materials - Mix
1 264
1 602
124
483
Fly ash
Slag
Reagypsum
Ferrous dust
Fluidal ash
Bypass dust
Shale burned
Sand from fluidal bed
Other
89
3,6 mln tonnes / annum
Cement industry in PolandImportant facts
• Waste treatment benefits• In 2012 1,1 Mtonnes of waste were co-processed
in Poland (46% subsitution rate)
• The cement industry reached 60% substitution
level in 2016 (unofficial information yet)
• CO2 reduction• Use of waste-derived alternative fuels abated
emission of 1,8 Mtonne of CO2 in 2012
• At 60% substitution rate, the savings increase by
35% to 2,5 Mtonne of CO2 annually
Cement industry in PolandImportant facts
• Energy production and coal savings• Polish cement industry replaced over 700
ktonnes of coal in 2012
• With substitution level 60% in 2016 1mln tonnes
of coal were replaced
• The 1,2 Mtonnes RDF processed in 2012 by the
cement industry is equivalent to between 660 M
EUR and 1,2 bln EUR in Waste to Energy plant
expenditure
• In 2016 additional 500 ktonnes of RDF
processed led to further savings of 275 M EUR to
500 M EUR in WtE plants

Cement industry in Poland Important facts
• 2,5 bln € invested in cement industry over past
20 years
• 1 € invested in cement industry creates 2,8 € in
other sectors
• 25.000 jobs (directly and indirectly)
• 400 mln €/annum – taxes paid to central and
local budgets
• 6 mln tonnes/annum – use of alternative fuels
and secondary raw materials
Cement industry in Poland
Achievements & Threats
Polish Cement Industry:
Implemented privatization, restructuring and complex modernisation programs in 1990 – 2015
Invested in highly efficient, low energy consuming production technologies becoming one of the most modern and environmentally friendly industries in the EU
Successfully compete on the EU and global markets
Ready to further invest to maintain competitiveness and growing environmental requirements
Exposed to indirect CO2 emission negative effect due to coal-based fuel mix in Poland and growing energy prices (Polish energy sector will be coal-based still for long time)
Vulnerable to Carbon Leakage

How to contact The project team can be contacted at personal e-mail addresses
[email protected] and:
Clima East Office, c/o Milieu Ltd
Chaussée de Charleroi No. 1121060 Brussels (Belgium)
Tel: +32 2506 1000
Website:
English: www.climaeast.eu - Russian: http://russian.climaeast.eu/
Follow us on Facebook: look for CLIMA EAST PROJECT