Cement Bentonite Thin Diaphragm Wall - FRTR · PDF filewhen solidified create a...
30
DOE/EM-0551 Cement Bentonite Thin Diaphragm Wall Subsurface Contaminants Focus Area Prepared for U.S. Department of Energy Office of Environmental Management Office of Science and Technology September 2000
-
Upload
nguyentuyen -
Category
Documents
-
view
236 -
download
4
Transcript of Cement Bentonite Thin Diaphragm Wall - FRTR · PDF filewhen solidified create a...

DOE/EM-0551
Cement BentoniteThin Diaphragm
Wall
Subsurface Contaminants Focus Area
Prepared forU.S. Department of Energy
Office of Environmental ManagementOffice of Science and Technology
September 2000

Cement BentoniteThin Diaphragm
Wall
OST/TMS ID 2060
Subsurface Contaminants Focus Area
Demonstrated atDover Air Force Base
Delaware

iii
Purpose of this documentInnovative Technology Summary Reports are designed to provide potential users with theinformation they need to quickly determine whether a technology would apply to a particularenvironmental management problem. They are also designed for readers who may recommendthat a technology be considered by prospective users.
Each report describes a technology, system, or process that has been developed and testedwith funding from DOE’s Office of Science and Technology (OST). A report presents the fullrange of problems that a technology, system, or process will address and its advantages to theDOE cleanup in terms of system performance, cost, and cleanup effectiveness. Most reportsinclude comparisons to baseline technologies as well as other competing technologies.Information about commercial availability and technology readiness for implementation is alsoincluded. Innovative Technology Summary Reports are intended to provide summaryinformation. References for more detailed information are provided in an appendix.
Efforts have been made to provide key data describing the performance, cost, and regulatoryacceptance of the technology. If this information was not available at the time of publication, theomission is noted.
All published Innovative Technology Summary Reports are available on the OST Web site athttp://ost.em.doe.gov under “Publications.”

TABLE OF CONTENTS
1. SUMMARY page 1
2. TECHNOLOGY DESCRIPTION page 6
3. PERFORMANCE page 9
4. TECHNOLOGY APPLICABILITY AND ALTERNATIVES page 16
5. COST page 17
6. REGULATORY AND POLICY ISSUES page 20
7. LESSONS LEARNED page 21
APPENDICES
A. REFERENCES page 23
B. SITE CONDITIONS page 24
C. PERFORMANCE DETAIL page 25

1
SECTION 1SUMMARY
Technology Summary
Problem
Some of the most pressing environmental restoration needs at DOE, other government, and industrialsites involve cleanup or containment of radioactive material, heavy metals, and organic contaminants insoils and groundwater. In the past, wastes were buried in or dumped into unlined pits with the idea thatsurrounding soil would act as a natural barrier between the waste and the groundwater. Contaminantmigration from these sites is of concern; methods are needed to control the migration of contaminants inthe subsurface. Baseline remediation approaches for these sites consists of pump and treatment ofgroundwater and excavation, treatment (in some cases), and disposal of soils. These approaches can beexpensive and/or require numerous years for remediation.
Short-term and long-term containment can be achieved by emplacement of impermeable (physicalhydraulic control) barriers to divert groundwater flow or isolate subsurface contaminants. Emplacement ofphysical hydraulic control barriers in unstable soils, near foundations, and around undergroundobstructions can be problematic, cost prohibitive, and/or technically impractical.
How It Works
High-pressure jet grouting has been demonstrated as an innovative and cost-effective emplacementmethod for the construction of subsurface physical, containment barriers, known as thin-diaphragm walls.The walls are emplaced by using high-pressure jetting of slurry into native soils in the target zone andwhen solidified create a low-permeability zone of minimal thickness (Figure 1). Continuous containmentbarriers to isolate subsurface contaminants are created by placing a series of intersecting panels invarious geometries. Thin-diaphragm walls are emplaced by jetting through two relatively horizontal andopposing nozzles as the drill string is extracted without rotation. During injection, the high-pressure jetfluidizes or erodes a cavity in the soil into which the slurry solidifies.
Figure 1. Photograph of thin-diaphragm walls emplaced by using high-pressure jetting.
The jetting process consists of:

2
• Drilling a vertical bore hole to the desired depth;• Orienting the jetting nozzles in the desired direction;• Delivery of the grout fluid with a high-pressure pump through the jetting nozzles using the desired
parameters (~6000 psig and 90 gpm);• Extracting the drill string during jetting using a controlled removal rate and without rotation; and• Containerization and handling of the spoils at the surface.
Potential Markets
High-pressure jet grouting was originally developed in Japan and has been used for decades throughoutEurope and Asia as a means to stabilize soils for projects involving deep excavations near foundations orto improve the load-bearing capacity of the soil under existing or new foundations ("under pinning"). It hasbeen used for similar purposes in the United States for at least 15 years. A several-mile long barrier wasinstalled by Bruno Gemmi, Fondazoni Speciali in Parma Italy along the Po River using high-pressurejetting to stabilize the embankments.
More recently, high-pressure jet grouting has been considered for environmental applications as a meansto install walls for impermeable or permeable barriers. High-pressure jet grouting provides access to thesubsurface for injection of materials that either contain or treat the contaminants present in thesubsurface.
Thin-diaphragm walls are applicable in a variety of geologic settings and can be emplaced in a variety ofgeometric configurations to:
• control migration of contaminated groundwater from a source zone;• divert groundwater from flowing into a contaminated site;• emplace reactive materials for in situ treatment of groundwater; or• provide short- and perhaps long-term containment for waste materials present in pits, trenches, and
landfills.
Advantages Over Baseline
The baseline for emplacement of containment barriers is conventional trenching, which can be costly dueto a variety of factors and has depth limitations.
Advantages of high-pressure jet grouting for installation of containment barriers include:
• ability to grout a discrete zone in the subsurface;• stability of the soil matrix is maintained (worker safety issue);• ease and rapidity of installation;• ability to emplace walls in limited access areas (near foundations, bodies of water, congested
manufacturing environments and beneath existing utilities, etc;• lower cost than trenching because disposal of significant quantities of contaminated material is not
required;• lower cost than conventional jet grouting.
Limitations of high-pressure jet grouting include:
• A limited amount of excess soil and grout material, which may require handling and disposal, isreturned to the surface;
• ~150 ft practical depth limitation for emplacement (much greater depth limit than trenching).

3
Demonstration Summary
This report covers the period of 10/96 through 9/98. During fall 1997, a demonstration of high-pressure jetgrouting to emplace thin-diaphragm walls was conducted at the Groundwater Remediation FieldLaboratory (GRFL) National Test Site at the Dover Air Force Base (AFB). This demonstration wassponsored by the U. S. Department of Energy's (DOE) Office of Science and Technology, DuPont, U.S.Air Force/Armstrong Labs, and through the National Environmental Technology Test Sites (NETTS)Program.
Specific objectives of this project were to demonstrate:
• the constructability of a high-pressure, jet-grouted, thin-diaphragm containment barrier; and• the continuity (i.e. performance) of the barrier using a number of verification and monitoring
methods.
Phase I testing consisted of a demonstration of emplacement techniques creating four small barrier boxesto refine grouting parameters. Phase II consisted of emplacement of two cofferdams, each consisting oftwelve inter-connecting thin-diaphragm walls (or panels) using high-pressure jet grouting to form acofferdam ~ 34 feet in diameter (Figure 2). The cofferdams were constructed by jetting a standardcement/bentonite slurry 7 feet into the underlying clay confining unit at a depth of 36 feet below groundsurface (bgs). One cofferdam was covered with a geomembrane to prevent infiltration of precipitation.The integrity of the cofferdams were tested using pump tests, innovative pulse tests, flood tests, andgeophysical techniques.
Figure 2. Illustration of the cofferdam design showing emplacement locations.
Key Results
Key results of the demonstration include the following.

4
• Phase I demonstrated that the target hydraulic conductivity could be met, the barriers could bekeyed into an underlying confining layer, and grout formulas could be duplicated and emplaced.Geophysical, tracer, and hydraulic testing verified continuity and the presence of leaks, which wereobserved after the walls were excavated for visual confirmation.
• During Phase II, two cofferdams, consisting of twelve thin-diaphragm walls were emplaced to adepth of 43 feet. Each wall or panel ranged from 13 to 16 ft as measured, tip to tip as a singlebarrier. In lieu of an original double-wall design, a second cofferdam was then emplaced adjacentto the first for refinement of cost and performance data.
• Hydraulic testing showed no defects in the upper 25 feet (unsaturated zone) of the cofferdam; onedefect associated with a thin zone of higher hydraulic conductivity was observed in the lower 10 feetof the second cofferdam.
• Spoils during the wall emplacement were effectively controlled and managed.
• A guidance tool, consisting of accelerometers and a magnetometer measured location and directionof the nozzle assembly but not nozzle orientation. Interferences within the test area (proximity ofsheet piling nearby) and steel casing within the emplacement zone resulted in a partial failure of theguidance tool.
• The guidance tool was permanently mounted beneath the jetting-nozzle assembly; a wet connectwas developed so that data could be transmitted within the slurry to the surface.
• A specialized jetting-nozzle assembly demonstrated that nozzles biased to the bedding planes ofthe soil were more efficient and produced a more uniform wall with greater depth of penetration intothe formation.
Hydraulic testing of the wall performance demonstrated that it met the hydraulic conductivity performancegoal of 1.0 x 10⁻⁷ cm/sec. However, a "defect" at one location within the saturated zone, increased thebulk hydraulic conductivity to 2.52 x 10⁻⁶ cm/sec. The exact vertical location of the defect was notidentified, but it appears to be associated with a process upset or possibly a specific coarse-grained zone(cobble zone) encountered during the jetting operations.
The following findings are based on the geophysical testing performed on cofferdam #1 to verify the wall’scontinuity and performance as an impermeable barrier.
• Geophysical tomography methods using ground-penetrating radar (GPR) and electrical resistancetomography (ERT) were shown to be effective verification tools. However, they should be used inconjunction with hydraulic testing to ensure optimum monitoring.
• Cross bore-hole seismic and electromagnetic methods need to be refined further before they can beused as verification tools. Cross bore-hole GPR through transmission was a good indicator of thebarrier presence but information obtained was limited.
High-pressure jet grouting has recently been utilized or is in the planning stage for a number ofenvironmental projects across the U.S.
This demonstration involved the following team participants:
• DOE – co-sponsor;• DuPont – co-sponsor, emplacement and hydraulic testing team lead;• US Air Force – host site;• EPA – independent data validation;• Florida State University (FSU) – contracting agency;• Hayward Baker – vendor subcontract for grout emplacement;• Lawrence Berkeley National Laboratory – geophysical support;• Lawrence Livermore National Laboratory – geophysical support;• MSE Technology Applications – integrated project management and geophysical verification;• Sandia National Laboratories – hydraulic testing and tracer support;

5
• Westinghouse Savannah River Company – verification and monitoring team lead and geophysicalsupport; and
• Bruno Gemmi, Flondazoni Speciali, Parma, Italy.
Contacts
Technical
Richard LandisDuPont Engineering302-892-7452
Allen FurthHayward Baker, Inc.410-551-1980
Management
Skip ChamberlainDOE Subsurface Contaminants Focus Area301-903-7248
Scott McMullinDOE Savannah River Operations Office, Subsurface Contaminants Focus Area803-725-9596
Andrea HartMSE Technology Applications, Inc.406-494-7410
Other
All published Innovative Technology Summary Reports are available on the OST Web site at http://em-50.em.doe.gov under “Publications.” The Technology Management System, also available through theOST Web site, provides information about OST programs, technologies, and problems. The OSTReference # for Cement Bentonite Thin Diaphragm Wall is 2060.

6
SECTION 2TECHNOLOGY DESCRIPTION
Overall Process Definition
The goal of this project was to demonstrate the use of high-pressure jet grouting for emplacing thin-diaphragm walls as a means of establishing hydraulic control for environmental applications. Theanticipated product of the demonstration was an in-situ continuous barrier with a target hydraulicconductivity of 1 x 10⁻⁷ cm/sec or less. Specific objectives were to investigate the:
• constructability of a high-pressure jet-grouted containment barrier;• continuity of the barrier as built; and• appropriate methodology to verify and monitor the barrier integrity.
Thin-diaphragm walls are created by simultaneously jetting a slurry (in this case, cement/bentonite grout)at ~6,000 psi in two opposing directions without rotation of the drill string during extraction from thesubsurface. High-pressure jet grouting uses a high-energy fluid stream (i.e., slurry or water) to fluidize orerode a cavity in the soil. The jetting stream can be:
• a simple fluid (single-fluid jetting); or• shrouded by air to increase the depth of penetration into the soil (double-fluid jetting); or• a water stream shrouded by air as the high-pressure jetting stream with a third low-pressure nozzle
for grout jetting (triple fluid jetting).
For this demonstration project, the jet grouting was conducted under the following conditions.
• A double-fluid jet grouting system (air and cement/bentonite grout [Figure 3]) was used.• Jetting nozzles were horizontally opposed by 180 degrees, each having a 4-mm diameter port.• The two nozzle orientations were 5 degrees downward from horizontal.
Figure 3. Photograph of jetting rig at the demonstration site.

7
The jet grouting process consists of:
• drilling a vertical bore-hole to the desired depth;• diverting the fluid in the drillstring to the jetting nozzles;• pumping the jetting slurry at the desired flow rate and pressure;• extracting the drill string at a controlled rate with no rotation as the jetting occurs; and• delivery of excess soils and jetting materials to the surface through the annulus of the bore-hole and
the drill string; and• controlling the jetting spoils at the surface.
The key equipment components of a high-pressure jetting system are:
• small to medium-sized jetting rig that can control rotation and drill-string extraction rates (Figure 3);• data acquisition system to monitor the jetting parameters;• bulk materials handling and slurry-mixing system (Figure 4);• high-pressure pumping system (Figure 4);• jetting-nozzle assembly;• specialized drill string; and• spoils control equipment (vacuum trucks and a spoils control box).
Figure 4. Bulk materials handing, slurry mixing, and high pressure pumping systems.
System Operation
Thin-diaphragm wall emplacement consists of the following steps:
• Mixing a batch of slurry;• Drilling a bore-hole (roughly 6 inches in diameter) to the desired depth;• Pumping slurry during drilling at a low flow-rate and pressure;• Shutting the pump off after reaching the desired depth;

8
• Disconnecting the drill string and placing a ball bearing into the central casing to plug the fluid flowto the drill bit and diverting all the fluid flow to the jetting nozzles;
• Reconnecting the drill string;• Aligning the jetting nozzles;• Activating the high-pressure pump to the desired parameters; and• Withdrawing the drill string at the desired extraction without rotation.
Test emplacements were performed to determine the jetting parameters needed to satisfy the site-specificsoil conditions.
During emplacement, some spoils come to the surface with the volume of spoils being a function of:
• the soil texture;• the properties of the slurry; and• the amount of slurry pumped during the emplacement efforts.
For handling of the spoils, collection boxes were fabricated. The spoil material from the grouting operationwas collected in the spoil collection box, vacuumed into trucks and transported to the Dover AFB landfill.Unit weights of the spoil were determined using a “mud balance” and weighing the trucks before and aftercompleting each panel to determine the total spoils generated and the spoils to grout ratios.
To ensure that the jetting nozzles are within the target zone of tolerance, a directional-drilling guidance toolwas adapted to the jetting-nozzle assembly. This device, manufactured by Tensor, measures theinclination and heading of the jetting-nozzle assembly as well as the orientation of the jetting nozzles.Associated with the guidance tool is a “wet connect” that allowed an electrical connection to be madewithin the slurry. This connector (developed by Wireline) permits power to be supplied to the guidancetool from the surface power supply and data to be transferred from the guidance tool to the surfaceinstrumentation for monitoring.

9
SECTION 3PERFORMANCE
Demonstration Plan
The demonstration was conducted in 1997 at the GRFLNational Test Site located at Dover AFB, Delaware(Figure 5). The GRFL is a clean test site that providessupport infrastructure for evaluating DNAPL transport ingroundwater and soil and verifying remediation andmonitoring technologies (see Appendix B for additionaldescription of the site conditions).
The overall goal of this project was to demonstrate,verify, and monitor emplacement of thin-diaphragmbarrier walls for application at sites with contaminatedgroundwater and soils. A double-walled, 12-sided,circular thin-diaphragm wall cofferdam, keying into aconfining unit at depth, was to be emplaced for thedemonstration (see Figure 2).
Specific objectives included:
• emplacing a continuous thin-diaphragm wallbarrier that is acceptable to the regulatorycommunity;
• demonstrating that the barrier is keyed into a clayconfining layer at its base;
• demonstrating/validating the continuity andperformance of the barrier using various methods;and
• collecting cost data.
The barrier was to be constructed by jetting a cement/bentonite slurry with an in-situ target hydraulicconductivity of 1.0 x 10⁻⁷ centimeters per second (cm/sec). Test panels were to be jetted near theconstruction site to define jetting parameters for the cofferdams. A circular cofferdam, a double-walledpolygon with a radius of 17.39 feet containing 12 thin-diaphragm panels with an effective tip to tip panellength of approximately 9.3 feet, was designed. This design resulted in a panel-length safety factor ofapproximately 28 percent; therefore, 14 percent (1.8 feet) of the panel overlapped per side. To achievethis design, an approximate drill-string extraction rate of 162 cm/min (64 inches/min) was selected.
• Piezometers were to be installed in the cofferdam to monitor water levels inside and outside of thecofferdam to determine gradient across the cofferdam's walls.
• The cofferdam was to be covered by a geomembrane to minimize infiltration of precipitation (seeFigure 6).
• Conventional and innovative hydraulic tests were to be performed to determine the bulk hydraulicconductivity performance of the cofferdam.
• Geophysical methods were to be utilized to validate the continuity of the barrier.
Shallow BarrierLocation
Deep BarrierLocation
ExcavatedBarrier
Phase II
Cost Barrier Phase II
Barrier
Figure 5. GRFL Demonstration Site Map.

10
Figure 6. Photograph of the geomembranecover and piezometers.
The demonstration was planned in two stages:
• Phase I involved installation of test panels and small barrier boxes to refine the grouting parametersfor site-specific conditions. Verification and monitoring testing conducted during Phase I consistedof liquid and gas tracer tests (passive tracers, hydraulic pumping, gaseous tracer tests), geophysicaltests (cross-bore-hole electromagnetics, cross-bore-hole GPR, cross-bore-hole ERT, cross-bore-hole seismic), and excavation.
• Phase II involved emplacement of two large (30 ft diameter) cofferdams, each comprised of 12 thin-diaphragm walls, and verification of the emplaced cofferdams. The original design called forinstallation of one double-walled cofferdam, but after installation of the first cofferdam, a decisionwas made to install a separate, adjacent cofferdam. Phase II verification consisted of hydraulictests (cross-bore-hole GPR [reflection, transmission, and tomography], ERT, and seismic) andgeophysical tests.
Results
Phase I
During Phase I, several test panels were installed to refine the installation procedures using two grouttypes. Four small barrier boxes were constructed. Key features of the Phase I emplacements includesthe following.
• Grout A, 1:1 ratio of cement and water by weight and 2.5 wt% bentonite (hydrated) based on theweight of cement.
• Grout B, a standard cement-bentonite formula used for slurry walls: 1,670 lbs water, 280 lbs Type Icement, and 75 lbs sodium bentonite.
• Each panel was installed to a depth of ~ 15 ft bgs, keying into a shallow clay layer.
• Each panel was injected using 5,800 psi (400 bar) grout injection pressure, 100 psi (7 bar) air-injection pressure, and 400 L/min grout flow rate.
• Varying drill-string extraction rates of 50, 75, 100 and 125 cm/min were tested for each groutmixture.
The following Phase I performance objectives were realized during the demonstration (see Appendix C foradditional detail on performance objectives).

11
• The cement-bentonite grout formula and emplacement method used in the Italian project wasduplicated.
• Emplacement criteria include:
thickness of the thin diaphragm walls were > 4 inches; uniform grout throughout the thin-diaphragm wall volume; thin-diaphragm wall keyed into an underlying confining unit; and hydraulic conductivity of the thin-diaphragm wall of 1 x 10⁻⁷ cm/sec.
Quality criteria that were not satisfactorily met during the Phase I demonstration included:
• jet orientation at the completion of grouting for 9 panels was out of alignment beyond the specifiedcriteria; and
• verticality (at full panel depth) exceeded the specified criteria in 50% of the small box panels.
During Phase I, hydraulic injection and extraction testing and determination of a bulk hydraulic conductivityindicated a “go” decision for Phase II. Gaseous tracer tests indicated leaks associated with panel joints;however determination of whether the flaws were cracks, open seams, or very thin sections of the barriercould not be discerned. Geophysical imaging results include the following.
• Cross bore-hole ERT collected during one flood test indicate a leak between 1.8 and 4.2 m bgs.Excavation of the barrier after the test and examination of the walls revealed that the two panels didnot join completely in the upper left corner at a depth of about 3 m.
• Cross bore-hole GPR measurements indicated the presence of the barrier as a slower media forwave propagation in the vadose zone and as a faster media for wave propagation in the saturatedzone.
• Cross bore-hole electromagnetic measurements indicated a slight increase in the formationconductivity between the pre- and post-injection, which may be attributed to the barrier.
Excavation of the barrier wallswas conducted to visuallyconfirm the construction andthe geophysical, tracer, andhydraulic verificationtechniques (Figure 7).Generally, these verificationtechnologies suggested flawswere present at the locationswhere flaws were observedduring the excavation.
• The barrier holesidentified by the tracertesting were confirmedduring the excavation.
• GPR and ERT resultsshowing the location ofthe grouted panels wereconfirmed by theexcavation.
• Some of the hydraulic testing results were confirmed during the excavation; other hydraulic testingresults could not be confirmed due to the difficulty encountered in excavating the interior barrierpanels.
The results of the Phase I excavation also confirmed the planned barrier shape was achieved, with minordeviations only. The barrier construction records indicated an operational event that may have caused anincomplete joining of sections (this was the first barrier to be injected in this program). While no single
Figure 7. Excavated thin-diaphragm panelemplaced using high-pressure jet grouting.

12
technology could indicate the quality of a subsurface barrier in both unsaturated and saturated portions ofthe subsurface, the combined application of hydraulic testing, vapor tracer testing, and geophysicalmethodologies provided the essential performance parameters required to resolve barrier continuityconcerns with a reasonable level of confidence.
Phase II
Incorporating lessons learned during Phase I, test panels were installed using an innovative 5-degreedownward-aiming nozzle configuration and drill-string extraction rates (ranging from 81 to 244 cm/min).Based on these test emplacements, thin-diaphragm panels with maximum tip-to-tip lengths of 10 to 15feet and ~3 inches thick were emplaced.
Two issues arose during emplacement.
• The presence of an extremely hard zone at ~ 30 ft bgs, ranging from 1 to 7 feet thick, resulted inbore-hole deviations up to 3 degrees (target limit of <0.5 degrees).
• Remnants of steel casing on the guidance tool caused what was thought to be erroneous readingsby the magnetometer.
After completion of the first cofferdam and based on the field observations attributed to the hard layer andremnants of steel casings, a decision was made to relocate the second cofferdam some distance away todevelop cost and performance data.
For verification testing, data were first collected from the array of monitoring piezometers over a 12-dayperiod to establish background groundwater flow patterns. Several flood tests were then conducted tomeasure the bulk hydraulic conductivity of the cofferdam. Flood tests were conducted by injecting waterinto monitoring well FT-7 at the center of the cofferdam at 4, 8.5, 10, 12, and 15.2 gpm. Piezometerslocated inside and outside thecofferdam were monitored during theflood test. Each flood test was runsufficiently long so that steady-stateconditions were met (Figure 8).
The bottom 3 curves shown inFigure 8 (FT-1, FT-3, FT-5) aremonitoring wells located outside ofthe cofferdam; the top curve (FT-7)is the injection well and the middlecurves (FT-2, FT-4, FT-6) arelocated inside the cofferdam.
The average hydraulic conductivity(Kwall) of the cofferdam below thewater table, calculated using Darcy'sLaw, was estimated to be 2.52 x 10⁻⁶
cm/sec.
Figure 8: A graph of the water levels in the
monitoring wells during a 8.5 gpm flood test.
Using the average bulk hydraulic conductivity, the cofferdam wall area likely to be defective wasdetermined, assuming that
(1) the depth of the cofferdam is 36 feet,(2) the hydraulic conductivity of the defect equals that of the aquifer, and(3) the flow through the aquitard is inconsequential.
8
10
12
14
16
18
20
22
24
26
28
30
32
0 5 10 15 20 25 30 35 40 45 50 55 60 65 70 75 80 85 90 95 100 105 110 115 120
Time (Hours)
Wat
er L
evel
s (F
eet)
FT-1FT-2FT-3FT-4FT-5FT-6FT-7

13
Given:
• the length of each panel in the cofferdam (9.3 feet),• the thickness of each panel in the cofferdam (0.5 feet),• the hydraulic conductivity of the aquifer (1 x 10⁻³ cm/sec or 2.83 ft/day), and• the hydraulic conductivity of the wall (2.4 x 10⁻⁷ cm/sec or 0.0007 ft/day),
the area potentially "defective" (i.e. with hydraulic conductivity greater than 10-7 cm/sec) was estimated at~ 9 ft2. With a total panel surface area of approximately 4017 ft2, the calculated "defective" surface areaof the cofferdam is ~ 1.23%. The wall surface area meeting the target hydraulic conductivity of 10-7
cm/sec is estimated to be 99.77%.
To delineate the type and location of "defects", an innovative pulsed hydraulic test was conducted. Theintent of the pulse test was to create a pressure pulse within the cofferdam and to measure whether or notit was attenuated by the cofferdam's walls. The pressure pulse was generated in the central monitoringwell (FT-7) by using a timing circuit to open and close a solenoid valve connected to a water source.From the solenoid valve, hard piping was run and attached to a packer and foot-valve assembly locatedslightly below the water table. High-frequency differential pressure transducers were then installed in allwells to capture the pressure pulse. All the transducers were connected to a recording device and thesystem was activated (Figures 9 - 12).
Figure 9. Graph of FT-7 showing the initial pressure pulse below the packer in the centralinjection well, (1.0 psig full scale, 1mm/sec).
Figure 10. Graph showing the typical pressure pulse for one of the internal monitoring wells (FT-2, FT-4, Ft-6 and 0.10 psig full scale, 1mm/sec).

14
Figure 11. Graph of FT-1 showing the typical pressure pulse in an external well that was nottotally attenuated by the walls of the cofferdam, (0.025 psig full scale, 1mm/sec).
Figure 12. Graph showing the typical pressure pulse for two of the external monitoring wells (FT-3and FT-5) where the initial pressure pulse was totally attenuated, (0.50 psig full scale, 1mm/sec).
Based upon these results, it appears that a "defect" is located near the FT-1 external monitoring wellbecause a pressure rise correlating with the pulse was measured at FT-1. Note the sensitivity of thepressure transducers as shown by noise recorded on the above graphs due to acoustic impact of C-5Aaircraft taking off from the base. The "defect" within the saturated zone is associated with an increasedbulk hydraulic conductivity of 2.52 x 10⁻⁶ cm/sec. The vertical location of the "defect" was not identified,but appears to be associated with a process upset and possibly a coarse-grained zone (cobble zone)encountered during jetting operations.
Manual quality assurance techniques did not recognize the process upset during the time of itsoccurrence.
As the drill string and jetting assembly encountered this coarse-grained zone, it was pushed outside of thetarget's zone of tolerance (+/- 0.5 degree of vertical). Further, due to subsurface magnetic anomalies nearthe test site, the nozzle orientation capability of the guidance tool was compromised, as it uses amagnetometer for this function. This resulted in some of the panels being jetted slightly out of thetargeted angular orientation (+/- 1 degree of the target). However, based upon the guidance tool's abilityto measure inclination and heading, an "as built" cofferdam diagram could be created. The "as built"cofferdam indicated that potential discontinuities at the interfaces between some of the panels could bepresent. Based upon this determination, five extra panels were emplaced at these interfaces to remedypotential discontinuities on the second cofferdam (see Figure 5).
Five geophysical techniques were used to verify the extent and shape of the thin-diaphragm wall on thefirst cofferdam:
• cross bore-hole seismic reflection;• cross bore-hole GPR reflection;• cross bore-hole GPR through transmission;• cross bore-hole GPR tomography; and• ERT.

15
Cross bore-hole seismic reflection was used to determine the location of the barrier below the water table.A potential reflected wave form from the barrier was not apparent due to limited moveout data acquiredwith 12 channels.
Cross bore-hole GPR reflection was used to determine the location of the barrier above the water table.No changes between the pre and post-grout emplacement data were identified.
Zero-offset cross bore-hole GPR through transmission was used as an indicator that barrier material hadbeen injected and resulted in a change to subsurface conditions. The data do not provide information onthe barrier wall thickness or location, rather they indicate whether a change has occurred due to the groutthat slowed the GPR wave. There was good correlation with the presence of the barrier materials abovethe water table.
Cross bore-hole GPR tomography was used to image the barrier assuming a sufficient amount of datacould be collected for suitable resolution. Velocity distribution cross-sections indicate a low velocityanomaly approximately midway between the two bore-holes, vertically oriented, and ~ 0.5 m thick (Fig. 13).
Figure 13. GPR velocity distribution produced from tomography data.
ERT was used to image the thin-diaphragm wall by comparing images of electrical resistivity before andafter barrier installation. Comparison of ERT images before and after installation confirm that the barrier:
• was emplaced approximately as planned;• is a continuous cylinder extending from the clay-sand boundary to near the surface; and• is uniform from top to bottom.
There was little evidence of grout material being spread beyond the intended wall configuration.
0.0 2.5 5.0 7.5 10.0
12
10
8
6
4
2
0
Distance From Borehole GP-21 (m)
0.075 0.125 0.175 0.225 0.275
GPR Velocity (m/ns)
Ground Surface
Water Table
BarrierWall

16
SECTION 4TECHNOLOGY APPLICABILITY AND ALTERNATIVES
Competing Technologies
Alternative remediation strategies include excavation followed by ex situ treatment and disposal ortraditional pump and treat processes. Thin-diaphragm barriers are competitive with other groundwaterflow-control technologies such as:
• standard excavation for slurry wall;• sheet piling;• geomembrane liners;• hydraulic fracturing; and• vibrating beam.
Other innovative technology alternatives that create barriers include deep soil mixing andfrozen soil barrier technology.
Technology Applicability
High-pressure jet grouting has been used for decades to create columnar-type pillars to underpinfoundations, but only recently has the emplacement of thin diaphragm walls for hydraulic control been ofinterest. Thin-diaphragm walls are emplaced to act as a barrier, with the grouted materials producing abarrier of lower hydraulic conductivity than the surrounding soil. Thin-diaphragm walls may be used as:
• part of a containment strategy to control contaminated groundwater from migrating from a sourcezone;
• a groundwater flow diversion tool;• a reactive treatment barrier; or• short- and perhaps long-term containment for buried waste in pits, trenches, and landfills.
Thin-diaphragm walls can be utilized to either contain the subsurface contaminants or divert groundwaterflow around the contaminants. Thin-diaphragm walls are applicable to sites requiring a containmentbarrier placed:
• in unconsolidated soils (sands, gravels, silts);• in unstable soils (flowing sands);• near foundations or water bodies;• in limited access areas (under buildings, in basements); and• near underground or overhead utilities.
Patents/Commercialization/Sponsor
High-pressure jet grouting is commercially available from several vendors and has been used in theconstruction industry for decades. This specific demonstration was conducted by Hayward Baker, Inc.

17
SECTION 5COST
Methodology
Cost analysis was conducted by MSE Technology Applications, in cooperation with DuPont.
• The cost analysis is representative of two single-wall cofferdam barriers similar to those emplacedas described in earlier sections of this report.
• The costs do not include site characterization, engineering design, verification and monitoring,material compatibility tests, or overhead.
• Spoil volumes used are the actual spoil volumes created during the demonstration.
Two scenarios are presented:
• the demonstration site emplacement (Table 1); and• emplacement at a site containing low-level radioactive soils (Table 2).
Cost Analysis
• Emplacement of the thin-diaphragm panels was accomplished at a production rate of roughly 4panels per day with a drilled depth of 43 feet and a jetted length of 40 feet. Assuming the effectivewidth of each panel was 9.3 feet, roughly 1490 ft2 was jetted per day.
• Assuming a unit rate of ~ $10,000 per day for equipment and crew, an estimated unit price persquare foot is ~ $6.71/ft2. This cost does not include the cement or bentonite materials,mobilization/demobilization, spoils disposal, or costs associated with the guidance tool.
• The total cement-bentonite slurry material cost was approximately $2,200.
• Mobilization and demobilization cost was $13,000; however, the equipment was relatively local. Amore typical mob/demob cost would be $25,000.
• The spoils volume generated during the emplacement operation was at a ratio of 60 percent that ofthe jetted volume resulting in ~ 40 yd3 of spoils generated. The spoils generated during this projectwere clean and disposed of on site as fill.
• The typical rental fee for the guidance tool is ~ $1,500 per day.
Cost Conclusions
An estimated cost to emplace a thin-diaphragm wall cofferdam at the Dover AFB test site is $8.21/ft2, notincluding mobilization and demobilization. Costs for emplacement at a low-level radioactive waste site aresignificantly higher.

18
Table 1. Cost Estimates for Thin-Diaphragm Wall Emplacement – Dover AFB
Task Description Estimated Quantity CostTask 1 - Preparation
Off-site mobilization 1 lump sum $16,189.69Crew/equipment set-up 1 shift $8,793.75Crane service 1 shift $3,281.25Crew/equipment tear down 1 shift $8,793.75Crane service 1 shift $3,281.25Freight $15,750.00Fabrication of spoils collection box $1,312.50Fabrication of check valve $1,312.50Task 1 Subtotal $58,714.69
Task 2 – Emplacement Materials and SuppliesCement 1280 bags $12,852.00Bentonite 525 bags $5,133.52Excavate/haul spoils 10 shifts $15,625.0030 c.y. containers 3 each $1,968.75Vacuum system 15 shifts $27,562.50Frac tank 15 shifts $4,921.88
Task 2 Subtotal $68,063.64
Task 3 – Emplacement LaborJet grouting crew – production 10 shifts $87,937.50Jet grouting crew – test 2 shifts $17,587.50Operated backhoe 3 shifts $2,559.38Task 3 Subtotal $108,084.38
Task 4 – SupportSpread spoils at landfill (Phase II) 1 lump sum $1,745.63Trash dumpster removal 1 each $656.25Portable toilet 2 each $656.25Tent with table and chairs 1 each $656.25Plastic liner 45 each $1,479.56Task 4 Subtotal $5,190.94
TOTAL COSTS: $240,053.64
19
Table 2. Cost Estimates for a Thin-Diaphragm Wall Barrier at a Class A Low-level Radioactive Site
Task Description Estimated Quantity CostTask 1 - Preparation
Off-site mobilization 1 lump sum $16,189.69Crew/equipment set-up 1 shift $8,793.75Crane service 1 shift $3,281.25Crew/equipment tear down 1 shift $8,793.75Crane service 1 shift $3,281.25Freight $15,750.00Fabrication of spoils collection box $1,312.50Fabrication of check valve $1,312.50Task 1 Subtotal $58,714.69
Task 2 – Emplacement Materials and SuppliesCement 1280 bags $12,852.00Bentonite 525 bags $5,133.52Excavate/haul test panel spoils 2 shifts $3,125.0030 c.y. containers 3 each $1,968.75Vacuum system 24 shifts $44,100.00Frac tank 24 shifts $7,875.00
Task 2 Subtotal $75,054.27
Task 3 – Emplacement Labora
Jet grouting crew – production 21 shifts $184,668.75Jet grouting crew – test 2 shifts $17,587.50Operated backhoe 3 shifts $2,559.38Task 3 Subtotal $204,815.63
Task 4 – SupportSpread spoils at landfill (Phase II) 1 lump sum $780.94Trash dumpster removal 1 each $656.25Portable toilet 2 each $656.25Tent with table and chairs 1 each $656.25Plastic liner 45 each $1,479.56Task 4 Subtotal $4,226.25
Task 5 – Waste Management/DisposalLoad/transport hot spoils 300 c.y. $96,375.00Disposal of hot spoils at Envirocare, UT 300 c.y. $53,250.00Task 5 Subtotal $149,625.00
Task 6 – Decontaminationb
Decontaminate drilling rig and equipment 16 hours $1,977.20Task 6 Subtotal $1,977.20
TOTAL COSTS: $494,413.03a shifts based on safety level B – 48% hourly efficiency outputb shifts based on 68% hourly efficiency output

20
SECTION 6REGULATORY AND POLICY ISSUES
Regulatory Considerations
• Regulatory considerations for emplacement of thin diaphragm walls will be similar to standard soil-bentonite slurry wall technology (see Evaluation of Subsurface Engineered Barriers at Waste Sites,EPA 542-R-98-005). The primary concern focuses on ensuring the hydraulic conductivity targets forthe barrier.
• Quality assurance procedures such as measuring verticality, location and orientation of the drillstring may be required.
• Specific permits for this technology must be worked out with the appropriate regulators.
An underground injection permit may be required. Comprehensive Environmental Recovery, Compensation, and Liability Act (CERCLA) or
Resource Conservation and Recovery Act (RCRA) permitting may be required. Thisdemonstration was conducted at a clean site; the nine CERCLA criteria were not addressed.
A National Environmental Protection Act (NEPA) review may be required at Federal facilities.
• Permits may vary based on wall construction as an impermeable versus a permeable, reactivebarrier.
Safety, Risks, Benefits, and Community Reaction
Worker Safety
• Potential worker safety risks include those associated with standard construction operations as wellas those associated with work at a contaminated site and with potentially hazardous chemicals.
• Pressures used are high enough to require extreme caution. All equipment must be checkedregularly and must contain safety features such as pressure relief valves. Careful monitoring of thefield operations assures safety to the workers and public.
• All field personnel must be 40-h Occupational Safety and Health Administration trained as requiredin 29 Code of Federal Regulations (CFR) 1910.120 for hazardous waste operations.
Community Safety
• High-pressure grout jetting does not produce any routine release of contaminants.
• No unusual safety concerns are associated with the transport of equipment to and from the site.
Environmental Impact
• The widely used thin diaphragm wall materials (cement and bentonite) are safe in the environment.
• No additional impacts will be produced over that already under way as a result of site remediation.Equipment is transported to the site and then removed after the barrier is created.
Socioeconomic Impacts and Community Reaction
• High-pressure jet grouting has minimal impact to the economic or labor force. It has been used tostabilize soils for projects involving deep excavations or to improve the load-bearing capacity of thesoil under existing or new for decades.

21
SECTION 7LESSONS LEARNED
Implementation Considerations
Grout flow, pressures, volumes, and withdrawal rates (once established) were consistent throughout theproject. The primary issue during Phase II was related to rod verticality, jet orientation, air flow, and spoilreturn ratios.
• Rod verticality tolerance of 1% of depth proved very difficult to achieve, due to the presence ofcobbles.
• Difficulties with the directional tool orientation of the jets resulted in 15 of 24 panels emplacedbeyond the 2 degree tolerance allowed, due to magnetic anomalies present at the site. However,manual alignment of the jets proved that the panels could be emplaced within the 2 degreetolerance with 13 of 24 panels maintaining an exact alignment.
• Plugging of the nozzles and air flow was problematic, but overcome in part by sealing the nozzleswith rubber washers and duct tape. However, sitting in the hole for prolonged periods, such aswhile breaking rods, resulted in blockages. An air-flow meter was very useful in indicating pluggednozzles.
• Spoil/Grout ratios varied from 0.6 to 1.8 during Phase I and the Phase II test panels. Lower ratiosindicate that more grout is remaining in the ground and therefore replacing soil, potentially resultingin longer or thicker panels. Ratios of 0.7 to 1.2 (ave. ~1.0) were observed while jetting the firstcofferdam in Phase II. During jetting of the second cofferdam, ratios between 0.4 and 0.9 (ave.,0.6) were observed.
During this demonstration a "defect" in the wall, which appears to be associated with a process upset andpossibly related to a coarse-grained zone (cobble zone) encountered during jetting operations, wasidentified. Drilling and bouncing of the jetting rig occurred at the time the "defect" was created. It isrecommended that an automated data acquisition system be utilized to continuously record jettingparameters. And the selected site must be well characterized to minimize unexpected geologicconditions.
Technology Limitations and Needs for Future Development
A demonstration at a contaminated site is needed. Based on observations during the demonstration,applied development is needed related to the:
• guidance tool, and• nozzle orientation.
The guidance tool was quite effective in measuring the location of the jetting nozzles; however, its ability tomeasure the orientation of the jetting nozzles with a magnetometer was ineffective due to magneticanomalies associated with the test site. Orientation was accomplished manually by aligning the nozzles atthe surface with preset targets and then lowering them to the bottom of the hole without rotating them.The nozzle orientation was then rechecked at the surface with the targets after jetting was complete andany deviations were recorded. While effective, this method was time consuming.
Additional refinement to the electrical connector between the surface systems and the permanentlymounted guidance tool (“wet connect”) located beneath the jetting nozzle assembly is needed to improvethe connection. During the demonstration, sometimes "wet connect" did not make a good connection dueto cement particulates in the slurry. Proven oil-field applications utilize bentonite drilling fluids.

22
Adaptation of a gyro-based guidance tool, such that it was small enough to be slid down the inside of thecenter drill string, may enable elimination of the wet connect (hard-wire the tool). The guidance tool couldthen be self-aligning by what is known as a “mule shoe” once the tool comes to rest on the bottom.
A more reliable guidance tool could enhance the “as built” barrier and allow the design specification to berelaxed. Finally, although not tested in the field, theoretically, the angle of the grouting nozzle could alsobe changed from 180 degrees, thereby, increasing the opportunity for panel overlap.
Technology Selection Considerations
Based upon the results of this demonstration, high-pressure jetting appears to be a cost effective meansto emplace physical hydraulic control barriers in unconsolidated materials. This is especially true foremplacement of physical hydraulic control barriers in unstable soils, near foundations, and aroundunderground obstructions that can be problematic, cost prohibitive, and/or technically impractical.

23
APPENDIX AREFERENCES
Daily, W. and A. Ramirez. 1998. Electrical Imaging of Engineered Hydraulic Barriers. Project Report.
Leahy, P. 1982. Groundwater Resources of the Piney Point and Cheswold Aquifers in Central Delawareas Determined by a Flow Model. Delaware Geological Survey, Bulletin No. 16.
MSE Technology Applications, Inc. 1998. Final Report – Cement Bentonite Thin Diaphragm Wall Jet-Grouting Demonstration Project. Dover, Delaware. HMP-52. Prepared for the U.S. Departmentof Energy, Federal Energy Technology Center.
MSE Technology Applications, Inc. 1998. Final Report – Cement Bentonite Thin Diaphragm Wall Jet-Grouting Demonstration Project. Dover, Delaware. Attachments A through T. HMP-52.Prepared for the U.S. Department of Energy, Federal Energy Technology Center.
Mueser Rutledge Consulting Engineers. 1998. Jet Grouting Test Program, Dover Air Force Base,Delaware. Project Report. Prepared by Mueser Rutledge Consulting Engineers for DuPontEngineering. New York, New York. March 1998.
U.S. Environmental Protection Agency. 1998. Evaluation of Subsurface Engineered Barriers at WasteSites, EPA 542-R-98-005.

24
APPENDIX B SITE CONDITIONS
Site Conditions
Dover AFB is a National Priorities List site and has a history of fuels and solvents contamination. A base-wide remedial investigation was performed through the Installation Restoration Program with resultsindicating the primary contaminants of concern include jet fuel, perchloroethylene, trichloroethylene, anddichloroethylene. This demonstration was conducted at the Groundwater Remediation Field Laboratory(GRFL), which is an uncontaminated site.
The GRFL at Dover AFB is a well characterized, clean site. Dover AFB is generally level with little spatialvariation and ranges in surface elevation from 10 to 35 feet above mean sea level. The AFB is underlainby sediments of Cretaceous to Recent age, forming a wedge of sediments thickening to the southeast.The Pleistocene Columbia and Lynch Heights Formations are composed of medium to fine sands withgravelly sand, silt, and clay lenses. The Columbia Formation is characterized by a fining upwardsequence of silty poorly sorted sands. The Lynch Heights Formation overlies the Columbia Formation andis composed of a coarsening upward sequence of silty sands. Discontinuous clay lenses are common inthe Lynch Formation and occasional gravelly sand lenses are also present.
Underlying the Columbia Formation is the upper unit of the Calvert Formation (Miocene). This unitgenerally consists of gray, firm, dense marine clays with thin laminations of silt and fine sand. Theunderlying Calvert Formation is composed of marine, estuarine, and delta plain silty clays and forms anaquitard.
The site consists of two aquifers, separated by a 26 to 39 foot thick clay layer located 30 to 43 ft bgs. Thewater table is ~ 26 ft bgs. The upper unconfined aquifer is composed of a heterogeneous sand withoccasional lenses of gravel and clay with an average hydraulic conductivity ranging from 2.8 x 10⁻³ to 1.2 x10⁻² cm/sec. The vertical hydraulic conductivity of the aquitard is estimated between 2.7 x 10⁻⁸ to 1 x 10⁻⁷
cm/sec (Leahy 1982).

25
APPENDIX C PERFORMANCE DETAIL
Emplacement Performance Methods and Limits
During barrier emplacement, a construction quality assurance (CQA) program was designed to monitorconstruction activities with full-time, on-site inspections and independent field and laboratory testing.Water was monitored for information purposes; the grout mix was monitored for acceptance. Duringemplacement, grout rod depth, grout rod verticality, jet orientation, drill-hole location, grout rod withdrawalrate, grout flow-rate and volume, grout pressure, air pressure, spoil return, and spoil volume were allmonitored. During the test panel excavation, samples of the completed panels were obtained andsubmitted for laboratory testing.
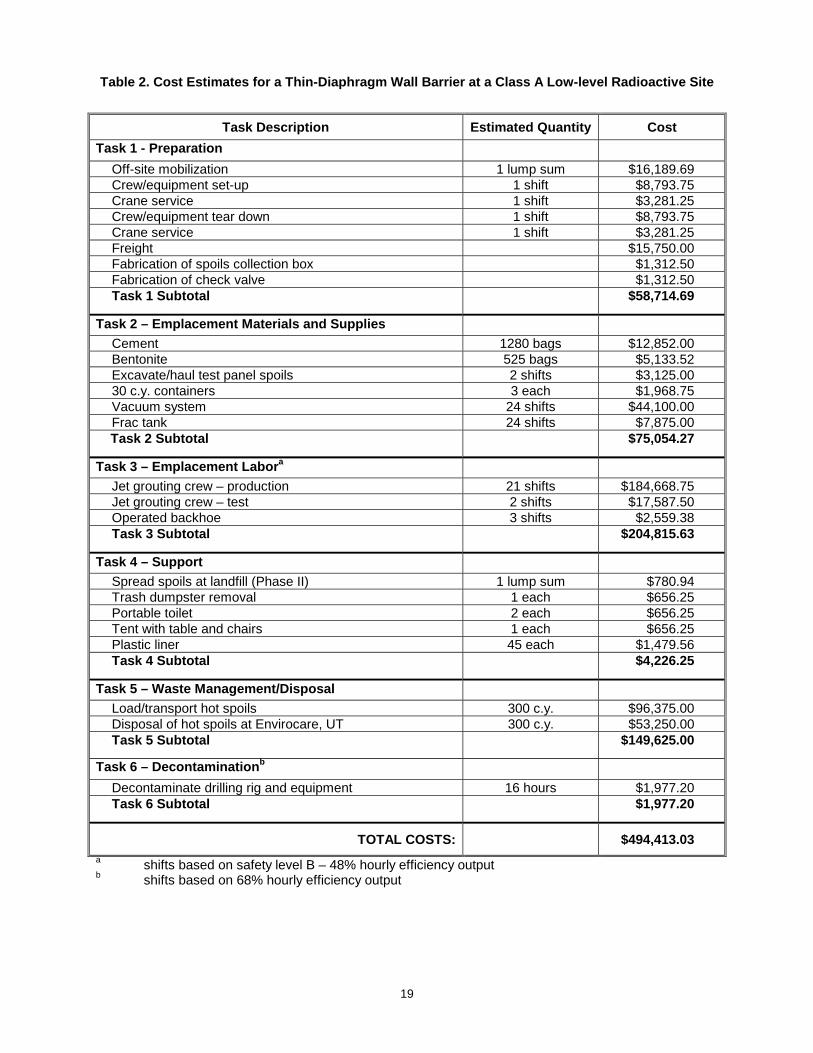
Table C-1 shows the measurement methods and detection/quantification limits required to evaluate themajor parameters as planned. Table C-2 identifies the planned acceptable (possible) ranges for the majorparameters. During Phase II, the planned measurement methods and limits, and the planned acceptableranges for the major parameters were similar to those used for Phase I with minor changes based onlessons learned.
Table C-1. Measurement methods and limits
Measurement Method Reference Detection/Quantitation Limit
VerticalityDrilling Rig Smart Level TM (Inclinometer) 0.1% of depth
Drill String Tensor Drill Locator ±0.1 degree off vertical
Nozzle Orientation Tensor Directional DrillingGuidance tool
±5 degrees off optimum nozzleorientation
Depth of Penetration Measurement of Drill String ±1 inch
Effective Panel Geometry Excavate and Physically Measure ±1 inch
Grout Injection Pressure In-Line Pressure Transducer orAnalog Gauge
±100 psi
Air Injection Pressure In-Line Pressure Transducer orAnalog Gauge
±5 psi
Jet Tool Retraction Rate Jet Rig Extraction Control ±5 cm/min
Grout Flow Rate Flow Meter ±5 L/min
26
Table C-2. Range of measurement values
Measurement Possible Range of Values Comments
VerticalityDrilling Rig ±2% of depth
Drill String ±2 degrees off vertical
Nozzle Orientation ±10 degrees 5 degrees off optimum nozzleorientation
Depth of Penetration ±1 foot
Effective Panel Penetration(panel width)
2 to 10 feet Will make double passes with jettool in clay key
Grout Injection Pressure 4,000 to 8,000 psi
Air Injection Pressure 75 to 125 psi Air use will facilitate panelemplacement
Jet Tool Retraction Rate 0 to 150 cm/min Adjustable extraction rate set on jetrig
Grout Flow Rate 0 to 500 L/min
Grout Testing Results
A grouted sample from the jetted test panel was tested for hydraulic conductivity and strength. Threesamples were collected and results summarized in Table C-3. Hydraulic conductivity was also determinedon two randomly selected neat grout samples (Table C-3).
Table C-3. Jetted test panel results
Sample Hydraulic Conductivity(cm/sec)
Compressive Strength(psi)
Total Density(pfc)
Neat Grout #1 4.9 x 10⁻⁶ -- 69.3Neat Grout #2 1.3 x 10⁻⁶ -- 67.7Panel Grout #1 1.3 x 10⁻⁷ 109.9 117.4Panel Grout #2 2.6 x 10⁻⁷ 79.4 116.7Panel Grout #3 3.3 x 10⁻⁷ 75.1 114.0