Syntaxin clusters assemble reversibly at sites of secretory granules ...
Cellular/Molecular
A Syntaxin 1, G�o, and N-Type Calcium Channel Complex ata Presynaptic Nerve Terminal: Analysis byQuantitative Immunocolocalization
Qi Li,* Anthony Lau,* Terence J. Morris,* Lin Guo, Christopher B. Fordyce, and Elise F. StanleyCellular and Molecular Biology Division, Toronto Western Research Institute, University Health Network, Toronto, Ontario, M5T 2S8 Canada
Presynaptic CaV2.2 (N-type) calcium channels are subject to modulation by interaction with syntaxin 1 and by a syntaxin 1-sensitive G�O
G-protein pathway. We used biochemical analysis of neuronal tissue lysates and a new quantitative test of colocalization by intensitycorrelation analysis at the giant calyx-type presynaptic terminal of the chick ciliary ganglion to explore the association of CaV2.2 withsyntaxin 1 and G�O. CaV2.2 could be localized by immunocytochemistry (antibody Ab571) in puncta on the release site aspect of thepresynaptic terminal and close to synaptic vesicle clouds. Syntaxin 1 coimmunoprecipitated with CaV2.2 from chick brain and chickciliary ganglia and was widely distributed on the presynaptic terminal membrane. A fraction of the total syntaxin 1 colocalized with theCaV2.2 puncta, whereas the bulk colocalized with MUNC18 –1. G�O, whether in its trimeric or monomeric state, did not coimmunopre-cipitate with CaV2.2, MUNC18 –1, or syntaxin 1. However, the G-protein exhibited a punctate staining on the calyx membrane with anintensity that varied in synchrony with that for both Ca channels and syntaxin 1 but only weakly with MUNC18 –1. Thus, syntaxin 1appears to be a component of two separate complexes at the presynaptic terminal, a minor one at the transmitter release site with CaV2.2and G�O, as well as in large clusters remote from the release site with MUNC18 –1. These syntaxin 1 protein complexes may play distinctroles in presynaptic biology.
Key words: calcium channel; presynaptic; N-type; CaV2.2; �1B subunit; syntaxin; G-protein; G�O; transmitter release site; n-sec-1;MUNC18 –1; intensity correlation analysis; intensity correlation quotient; colocalization; immunocytochemistry
IntroductionN-type (CaV2.2) Ca channels are known to play an important
role in the gating of transmitter release at presynaptic terminals.Previous reports have demonstrated that this channel type can beinhibited via two pathways that involve syntaxin 1 and G-protein.Modulation of the channels by syntaxin 1 was demonstrated bycoexpression in oocytes or cell lines (Bezprozvanny et al., 1995;Wiser et al., 1996; Degtiar et al., 2000; Jarvis and Zamponi,2001a,b; Lu et al., 2001). Evidence for syntaxin 1-dependent Cachannel inhibition in intact nerve terminals has recently beenindicated in synaptosomes (Bergsman and Tsien, 2000) and wasshown directly by the effect of syntaxin 1 cleavage with botulinumtoxin C1 on the presynaptic Ca current (Stanley, 2003).
N-type Ca channels are known to be inhibited via trimericG-proteins, and this inhibition has been demonstrated directly inthe presynaptic nerve terminal with both G-protein receptor li-gands (Yawo and Chuhma, 1993; Takahashi et al., 1998; Mi-
rotznik et al., 2000) and intracellular GTP analogs (Stanley andMirotznik, 1997; Mirotznik et al., 2000). We have recently shownat the chick calyx presynaptic terminal that this inhibitory path-way uses a PTX-sensitive member of the G�O/i family, most likelyG�O (Mirotznik et al., 2000). This modulation pathway is ofparticular interest because of its potential for the rapid control ofsynaptic transmission (for review, see Hille, 1994; Ikeda andDunlap, 1999; Jarvis and Zamponi, 2001b). We noted thatbotulinum-mediated cleavage of syntaxin essentially eliminatedthe inhibition of presynaptic Ca channels via the G�O-gatedpathway (Stanley and Mirotznik, 1997). The above findingscould be explained if syntaxin 1 was a key element of a proteincomplex at the transmitter release site that included N-type Cachannels and G�O. The primary motivation for this study was totest this hypothesis.
We used two main experimental approaches. Conventionalcoimmunoprecipitation (coIP) and pull-down assays were usedto test for stable protein complexes. In addition, we used the largechick ciliary ganglion calyx terminal for high-resolution immu-nocytochemistry, combined with a novel method to test for pro-tein colocalization by staining intensity correlation. Conven-tional colocalization is based on a dye-overlay method such as thesuperimposition of antibody (Ab) 1, colored red, on Ab 2, col-ored green, to give yellow. Although simple, this technique onlyprovides an indication of the coexistence of two proteins. It doesnot address the more fundamental question of whether the inten-
Received Jan. 30, 2004; revised March 8, 2004; accepted March 12, 2004.This work was supported by Canadian Institutes of Health Research awards MOP38091 and 57716 and a Canada
Research Chair to E.F.S. We thank Drs. Shuzo Sugita, Lyanne Schlichter, and Rajesh Khanna for comments, GeraldZamponi (University of Calgary) for constructs, and Maureen McEnery (Case Western Reserve University, School ofMedicine) for antibodies.
*Q.L., A.L., and T.J.M. contributed equally to this work.Correspondence should be addressed to Dr. Elise F. Stanley, MP14 –320, Toronto Western Research Institute, 399
Bathurst Street, Toronto, Ontario, M5T 2S8 Canada. E-mail: [email protected]:10.1523/JNEUROSCI.0346-04.2004
Copyright © 2004 Society for Neuroscience 0270-6474/04/244070-12$15.00/0
4070 • The Journal of Neuroscience, April 21, 2004 • 24(16):4070 – 4081

sity of staining for the two proteins vary in synchrony, as wouldbe predicted if they are components of the same complex. Wedeveloped an immunostain analysis method based on relativestaining intensities for such a test. We used this method to dem-onstrate that at the nerve terminal syntaxin is a part of two dif-ferent complexes: one associated with the N-type channel andG�O at the release site, as predicted, and a second much moreprominent complex with MUNC18 that appears to be remotefrom the release sites.
Materials and MethodsAntibodiesCalcium channel. Antibodies were prepared commercially (Research Ge-netics) against peptides synthesized according to a published sequencefor the “synprint” region of the chick CaV2.2 � subunit II–III loop (Luand Dunlap, 1999) (GenBank accession number: AF173015). The aminoacid (AA) sequences and our Ab (Ab) codes and binding titers (BT) are:KHHRHRDKEKLGEQEKG Ab571 (AA 871– 888; BT �204800) andGAEAPRKHHRHRDKEKL Ab572 (AA 866 – 882; BT � 2666). Experi-ments were performed with Ab571, unless specified.
Primary antibodies. Mouse monoclonal antibodies used in this studywere: G�O, G�OAB-1 (Lab Vision, Freemont, CA); syntaxin (Sigma, St.Louis, MO); G�, MUNC18 (BD Transduction Lab, San Diego, CA), andSV2, Na/K pump (Developmental Studies Hybridoma Bank, Iowa City,IA). Affinity-purified polyclonal antibodies were: neurofilaments,AB1991 (Chemicon, Temecula, CA); MUNC18 (ABR); syntaxin (Sig-ma); SV2 (Stressgen, Vancouver, British Columbia, Canada); CaV2.1,CW65 (Fletcher et al., 2001), CaV2.2, CW21 (also termed CW14; Mc-Enery et al., 1997). CW65 and CW21 were gifts from M. McEnery (CaseWestern Reserve University, Cleveland, OH).
BiochemistryTissue lysates. A 15 d chick embryo brain was homogenized on ice for 30min in lysis buffer: 25 mM Tris, pH 7.5, 150 mM NaCl, 100 mM NaF, 5 mM
EDTA, 1 mM Na3VO4 1 mM, and 1% Triton X-100 and protease inhibi-tors: 1 �g/ml leupeptin, 2 �g/ml aprotinin, and 1 mM PMSF. This wasfollowed by centrifugation for 15 min at 15,000 � g. Protein concentra-tions were determined with Bio-Rad (Hercules, CA) protein assay re-agent (catalog #500 – 0006). Chick ciliary ganglion lysates were preparedas for chick brain using 150 ganglia per preparation.
Western blots. Western blots were performed using standard proce-dures. Briefly, each lane was loaded with 50 �g of tissue lysate, exceptwhere specified. Samples were run on SDS-PAGE and transferred toImmobilon-P transfer membranes (Millipore, Bedford, MA) at 25 Vovernight. The membranes were blocked for 1 hr in 5% skim milk pow-der in TBST at room temperature. All Ab incubations were for 1 hr atroom temperature. Primary Ab (standard technique) concentrationswere as follows: rabbit polyclonal anti-MUNC18, 1:1000; anti-CaV2.1CW65, 1:100; Ab571, 1:200; and anti-CaV2.2 CW21, 1:100. Monoclonalanti-MUNC18, 1:3000; anti-syntaxin, 1:1000; anti-Na/K pump, 1:1000;and G�OAB-1, 1:800. Secondary Ab concentrations were: goat anti-mouse conjugated to horseradish peroxidase (HRP; Stressgen) 1: 4000,goat anti-rabbit IgG HRP (Stressgen) 1:5000. Blots were probed withEnhanced Chemiluminescence reagent (NEN Life Science) before expo-sure with photographic film.
Immunoprecipitation. Fresh chick brain lysate (0.5–1.0 mg) in 300 �lof lysis buffer was precleared by a 1 hr incubation with protein A beads(Pierce, Rockford, IL) for polyclonal and protein A/G-agarose beads(Oncogene, Cambridge, MA) for monoclonal antibodies and were thenspun at low frequency for �1 min. In experiments with GTP�S, thecleared chick brain lysate was incubated with 200 �M GTP�S for 10 minat room temperature followed by 20 min on ice. Controls were incubatedwithout GTP�S. The lysate was incubated overnight with 1 �g of Ab571,3 �g of rabbit anti-MUNC18 –1, or 0.5 �g of G�O AB-1 Ab, respectively,to capture Ab–protein complexes. Normal rabbit IgG (Sigma) was usedfor controls. Fresh protein A or protein A/G-agarose beads (20 �l origi-nal bead slurry per sample) were incubated with lysate–antibody mixtureat 4°C for 2 hr. Protein bound beads were washed three times with lysis
buffer. The immunoprecipitates were boiled in 2� SDS sample bufferbefore SDS-PAGE.
Glutathione S-transferase–syntaxin 1A synthesis and purification. Syn-taxin constructs in pGEX-4T-3 vectors (from G. Zamponi, University ofCalgary) were transformed in Escherichia coli BL21 cells (Novagen, Mad-ison, WI). Proteins were purified using standard procedures. Briefly,protein expressed in BL21 was released by sonication and incubated withglutathione Sepharose beads followed by washing with PBST buffer. Thebound glutathione S-transferase (GST)–syntaxin protein was elutedfrom the Sepharose beads using 10 mM glutathione (Sigma). Proteinssamples were concentrated with Centriprep columns (catalog #YM-10;Amicon, Beverly, MA) followed by SDS-PAGE and immunoblot. Forsome experiments we used purified syntaxin protein only by removingthe GST carrier with protease cleavage using 4 �g/ml thrombin.
Experimental preparationsChick calyx preparation. This preparation has been described in detailpreviously (Stanley and Goping, 1991; Stanley, 1991; Sun and Stanley,1996; Mirotznik et al., 2000). Briefly, ciliary ganglia are dissected from15 d chick embryos and dissociated in a combination of enzymes thatpreserve functional calyx nerve terminals. The ganglia are trituratedgently, and the cells and cell fragments are allowed to adhere to glasscoverslips at 37°C for further experimentation.
Hippocampal neuron culture. Postnatal rat hippocampal neurons wereprepared as previously described (Brewer, 1997), with some modifica-tions. Briefly, hippocampi were dissected from 2–3 d-old rats and incu-bated in 2 mg/ml papain (Worthington, Freehold, NJ) at 30°C for 30min. The tissue was triturated using flame-polished Pasteur pipettes inNeurobasal A/B27 [2% B27 supplement (v/v), 2 mM L-glutamine, and0.05 mg/ml gentamycin, Life Technologies, Grand Island, NY], and theneurons were separated on an Optiprep (Life Technologies) density gra-dient. The neuron-enriched layer was plated on poly-D-lysine-coated(Sigma) German glass coverslips (Bellco Glass, Vineland, NJ) at 4 � 10 4
cells/coverslip, in 12-well plates and maintained in Neurobasal A/B27.Cultures were fed at 4 d in culture (DIC) at which time one-half of themedia was removed and replaced with an equal volume of fresh me-dia. Cultures were grown in Neurobasal A/B27 and used at 8 –10 DICwhen neuron purity was �85%, as assessed by MAP-2-positiveimmunofluorescence.
Fluorescence microscopyImmunostaining. Dissociated chick ciliary ganglion cells were fixed in(mM): cyclohexylamine, 150; EGTA, 20; MgCl2, 20; PIPES, 20; and para-formaldehyde, 2.5% w/v for 45 min. Fixation was stopped in Tris buffer(mM: Tris, 150; MgCl2, 20; and NaN3, 20) for 1 hr and then Ab buffer(mM: NaCl, 500; MgCl2, 10; NaN3, 10; and Tris, 20 with BSA 0.1% w/v)for 1 hr at room temperature. Nonspecific background staining wasblocked with Ab buffer containing 5% normal donkey serum for 30 minbefore staining. Hippocampal cultures were fixed in 4% paraformalde-hyde for 20 min at 20°C then permeabilized in 0.25% Triton X-100 inPBS for 5 min. The cultures were washed with PBS three times andtreated with 5% BSA in PBS for 2 hr before Ab application.
Primary antibodies were diluted in Ab buffer before application asfollows: Ab571 1:200; SV2 monoclonal, 1:1; MUNC18 polyclonal, 1:50;syntaxin monoclonal, 1:200; and G�O monoclonal, 1:100. All secondaryantibodies (Jackson ImmunoResearch, West Grove, PA) were used at a1:200 dilution in Ab buffer. Incubation was either overnight at 4°C or atroom temperature for 1–2 hr, for both primary and secondary antibod-ies. In the pretty-poly technique (for a detailed description of the methodsee: Morris and Stanley, 2003) antibodies were used at: anti-SV2 1:100;Ab571, 1:50; and ant-Na/K pump, 1:50.
Immunostaining with two rabbit polyclonal antibodies, combinedwith standard secondary Ab staining with a mouse monoclonal antibody(mAb) was performed as described in detail (Morris and Stanley, 2003).
Microscopy. The calyx synapses were imaged on a Zeiss Axioplan up-right microscope using a 100�, 1.4 numerical aperture lens and standardFITC–Texas Red fluorescence cubes with a black and white (B/W) ZeissAxiocam 1300 � 10 30 pixel B/W camera. Z stack image pairs were cap-tured at an interplane distance of 200 nm. Images were deblurred off-line
Li et al. • Presynaptic Calcium Channel Complex J. Neurosci., April 21, 2004 • 24(16):4070 – 4081 • 4071

by an iterative deconvolution protocol (Zeiss)using a theoretical point-spread function andwere pseudocolored for presentation. Regionsof interest (ROIs), either the release face of thecalyx terminal or the surface membrane re-gions of isolated calyces, were identified by eyebased primarily on the location of syntaxinstaining, which we have previously shownhighlights the surface membrane region (Stan-ley and Mirotznik, 1997).
Intensity correlation analysisRationale. The standard test for the colocaliza-tion of two proteins by immunocytochemistrygenerally involve tagging the first, protein A,one color (usually green), and the second, pro-tein B, a different and contrasting color (usu-ally red). Each color is imaged separately, andproteins are deemed to be colocalized in areasstained with the combined color when the twoimages are overlain (in this case, red plusgreen � yellow), a method that can be termedthe “dye-overlay” method. This method is bothsimple and widely used but has a number ofdrawbacks. The images are subject to both thecharacteristics of the display method and theperception of the investigator (with thismethod the pre-overlay images are generallyfirst adjusted for threshold, brightness, andcontrast). Furthermore, the dye-overlap methodis in essence a binary test of whether the two stainsoccur in the same or in different regions. It doesnot address the much more fundamental ques-tion of whether the two target proteins are ele-ments of a common complex.
In the present study we take advantage of thehigh resolution in the z as well as x and y axesafter iterative deconvolution deblurring tocompare the intensities of staining for two tar-get proteins by intensity correlation analysis(ICA). We suppose that if two proteins areparts of the same complex then their stainingintensities should vary in synchrony, whereas ifthey are on different complexes or structuresthey will exhibit asynchronous staining. Weterm these dependent and segregated staining,respectively. The ICA method is illustrated herewith control tissue staining examples andmathematical models of predicted stainingpatterns.
ICA imaging method. Only image segmentsthat were free of pixel saturation were used inthis analysis. The light paths with the two filtersets were carefully adjusted to ensure the align-ment of light emitted from a point in the sam-ple through different filter sets. All compari-sons were made from pairs of single imageplanes after iterative deconvolution deblurringof the entire image stack through the cell or cellfragment. Image layers selected for analysiswere converted into 8-bit monochromatic im-ages. Fluorescence intensity was quantified inmatched ROIs for each pair of images (e.g., thesynaptic release face) and converted into a dataset of paired (dye A/dye B) intensity pairs (MetaMorph version 4.5;Universal Imaging Corporation, West Chester, PA). Mean backgroundstaining was measured from an area outside the cell regions and wassubtracted from each file. Staining intensity pairs were plotted and ana-lyzed using Origin 7.0 ( Microcal Software, Northampton, MA). Image
sets were analyzed after removing pixel staining pairs with double 0-levelintensity values, reflecting nonstained areas, which can markedly skewthe data.
Control images. To develop the method, we first generated three con-trol double-stained images. In the first we stained the calyx nerve termi-
Figure 1. Intensity correlation analysis, experimental models. Each panel in A, C, and E shows a calyx nerve terminal stainedwith two antibodies with the overlay on the left and the individual B/W image pairs on the right. Each panel in B, D, and F showsintensity correlation plots on the left together with the respective plots of stain A (center) and B (right) pixel intensities againsttheir (A � a)(B � b) values (see Results, Intensity correlation analysis). A, B, Experimental example of dependent staining: calyxnerve terminal stained for SV2 with monoclonal (red, left panel; B/W center panel) and polyclonal (green, left panel; B/W rightpanel) tagged antibodies. ICQ�0.48, psign test �0.001. C, D, Experimental example of segregated staining. Calyx terminal stainedfor SV2 (red, left panel; B/W center panel) and Na/K pump (green, left panel; B/W right panel). ICQ � �0.19, psign test � 0.001.E, F, Experimental example of complex staining. A calyx nerve terminal stained with a mAb against SV2 (red, left panel; B/W centerpanel) and polyclonal antibody against neurofilament (green, left panel; B/W right panel). Scale bars, 5 �m.
4072 • J. Neurosci., April 21, 2004 • 24(16):4070 – 4081 Li et al. • Presynaptic Calcium Channel Complex

nal with both monoclonal and polyclonal anti-bodies against the same target protein, SV2 (anintegral protein of the secretory vesicle) (Fig.1 A). As expected, this resulted in an image inwhich the staining intensities of the two dyesvaried in close synchrony, yielding an exampleof an image where the staining of dyes A and Bwere highly dependent. In the second controlwe stained for two target proteins that areknown to be in relatively distinct compart-ments of the cell and exhibit a segregated pat-tern of staining (SV2 vs Na–K pump, a surfacemembrane marker) (Fig. 1C). The third testcase exhibited a complex staining pattern withpatches of both distinct and overlapping stain-ing (SV2 vs neurofilaments) (Fig. 1 E). In eachcase we normalized the intensity values for eachstain and plotted the intensities of stain Aagainst stain B for each pixel (Fig. 1 B,D,F, leftpanels). The dependent staining in Figure 1 Aresulted, as would be expected, in a highly cor-related plot. The control image with the oppo-site, segregated, staining (Fig. 1 D) resulted,however, in a more complex relationship inwhich the data tended to cluster along bothaxes. Finally, the image with the more complexstaining gave a scatterplot with a mixture ofthese features (Fig. 1 F). To develop a methodto analyze such staining intensity scatter plots,we next devised a set of simulated intensityscatter plots in which we could define the stain-ing relationships.
Simulated staining intensity plots. We gener-ated staining patterns (Fig. 2 A–D, left panels)in which the two intensities vary randomly (A),in a dependent manner (B), and in a segregatedmanner (C). In addition, we generated a modelin which one staining intensity was randomand its pair was segregated (D).
ICA. The ICA method is based on the prin-ciple that for any set of values the sum of thedifferences from the mean equal zero, i.e.,�N(Ai � a) � 0, where a is the mean of thedistribution with N values of Ai. In our case N isthe number of pixels, and Ai is the staining in-tensity for each pixel. It follows that for N pixelsassociated with two sets of random staining in-tensities (Ai and Bi), the sum of the product oftheir differences will also tend to zero, thus�N(Ai � a)(Bi � b) � 0. However, this is notthe case if the two intensities are dependent(when the product tends to be a positive value)or if they are segregated (when the producttends to be a negative value). Thus, with depen-dent staining �N(Ai � a)(Bi � b) � 0, whereaswith segregated staining �N(Ai � a)(Bi � b) � 0.
We used this property to test for dependentor segregated staining. In practice, we set up afive column spreadsheet (Origin; Microcal).We inserted the paired pixel staining intensityvalues for dye A and B from our ROIs into thefirst pair of columns. A scatterplot of the rawpixel values was used to test for any obviousdata limitations requiring correction by adjust-ment of the threshold (lowest value of the dis-tribution). The A and B staining intensity col-umns were then normalized to a 0 –1.0 range inthe third and fourth columns, and the arith-metic means of each column (a, b) were deter-
Figure 2. Intensity correlation analysis, simulated models. In each of rows 1A through 1D the left panel shows a scatterplot of1000 paired Ai versus Bi staining intensities (normalized to 1.0), whereas the center and right panels show plots of individual Ai andBi staining intensities against their respective calculated (Ai � a)(Bi � b) values. A, Intensity plot of simulating random staining.Plot of random A and random B intensity values. ICQ � 0.023; psign test � 0.05. B, Intensity plot of simulating dependent staining.A and B are two sets of 1000 random numbers modified by the relation: Xi � Xi*C, where X is A or B, respectively, and C is a serialnumber incrementing from 0.001–1.000. ICQ�0.39; psign test �0.001. C, Intensity plot model simulating segregated staining.Each of 1000 pairs of two sets of random numbers AR, BR were modified by the relations: Ai � AR/(1 2*BR) and Bi � BR/(1 2*AR). ICQ � �0.269, psign test � 0.001. D, Intensity plot model simulating random A staining distribution but with segregatedB staining. A is a set of 1000 random numbers. B is a second set of 1000 random numbers, BR, modified by the relation: Bi �BR/(1A) ICQ � �0.12; psign test � 0.001. E, Effect of thresholding. Each of the distributions in Figure 1 A–C, center panel weremodified by deleting the data pairs with the lowest 33% of A values to simulate the effect of thresholding one data set. The A andB data sets were normalized, and the (A � a)(B � b) and ICQ values were recalculated. ICQ values: left, random distributions0.003, psign test � 0.05; center, dependent distribution 0.250, psign test � 0.001; right, segregated distribution �0.287,psign test � 0.001. Note the retention of the key features of the non-thresholded plots.
Li et al. • Presynaptic Calcium Channel Complex J. Neurosci., April 21, 2004 • 24(16):4070 – 4081 • 4073
mined. A scatterplot of the normalized A versus B staining intensitiesprovides the first clues to their staining relationship (Fig. 1 B, left panel).The (Ai � a)(Bi � b) relationship was calculated for each pixel in the fifthcolumn. ICA plots were then generated for each variable against its (Ai �a)(Bi � b) value (Fig. 1 B, center, right panels).
ICA analysis of the simulated staining patterns. ICA plots for randomvalues of A and B (Fig. 2 A, left panel) generated a symmetrical hourglass-shaped scatterplots (Fig. 2 A, middle, right panels) with its waist definedby the distribution means. Plots for the simulated dependent (Fig. 2 B,middle, right panels) or segregated (Fig. 2C, middle, right panels) stain-ing patters generated hourglass figures that were markedly skewed to-ward positive or negative values, respectively. The ICA scatterplots tendto emphasize the high-intensity pixels for each variable providing evi-dence for a one-sided staining relationships such as when A is randombut B is segregated from A, as illustrated in Figure 2 D.
ICA analysis of the control images. ICA plots were generated for thecontrol staining images. Consistent with the simulated data, the corre-lated staining (Fig. 1 A) yielded an hourglass figure with a positive skew(Fig. 1 B, center, right panels), whereas the segregated staining gave onewith a negative skew (Fig. 1 D). The image from Figure 1 F generated acomplex pattern with plumes of points projecting from the hourglass.Errors can be introduced if the original images are poorly deblurred. Thebest way to deal with the issue of residual background staining is to raisethe staining threshold. Such an adjustment decreases the number of pix-els but, at least in the simulated data does not alter the fundamentalstaining relationships (Fig. 2 E).
Intensity correlation quotient. We devised an easily calculated and sta-tistically testable quotient to provide an overall index of whether thestaining intensities are associated in a random, a dependent or a segre-gated manner. Although the �N(Ai � a)(Bi � b) value is an indication ofthese relationships, its usefulness is compromised by the complexity ofanalysis because the individual (Ai � a)(Bi � b) values were in all casesnon-normally distributed (Shapiro–Wilk test). However, we found thatthe nonparametric sign test provides an excellent, simple, and practicalanalysis method. This test uses solely the polarity of each (Ai � a)(Bi � b)value and has the intrinsic advantage of removing any bias in the test forpixels of particularly high or low staining intensity.
For each image we counted the number of pixels that generated posi-tive or negative (Ai � a)(Bi � b) values. A ratio of the number of positivevalues to the total number of pixel pairs is a fraction that reflects thedegree of dependency. The intensity correlation quotient (ICQ) was gen-erated by subtracting 0.5 from this value (to distribute the quotients tothe �0.5 to 0.5 range). With random (or mixed) staining ICQ � �0;dependent staining 0 � ICQ � 0.5, and for segregated staining 0 �ICQ � �0.5. The normal approximation of the sign test was used to testif these values were significantly different from 0. The sign test analysiscorrectly predicted dependent, segregated, and random correlations forall of the simulated staining models, including the random–segregatedmodel (Fig. 2).
We next tested the ICQ method on the control staining pairs in Figure1. The ICQ values were 0.48 ( psign test � 0.001) for the dependent datain Figure 1 B, and �0.19 ( psign test � 0.001) for the segregated staining inFigure 1 D, consistent with predictions. The plot in Figure 1 F generatedan ICQ of 0.017 that was not significantly different from 0 (psign test �0.1). This ICQ value most likely results from regions with both depen-dent and segregated stained areas in this image. The interpretation of thisfinding for this specific set of Ab stains is beyond the scope of this report.
Statistical analysis. Values are presented as mean SE. Tests for sig-nificance are with Student’s t test ( p) or by means of the normal approx-imation of the sign test (psign test).
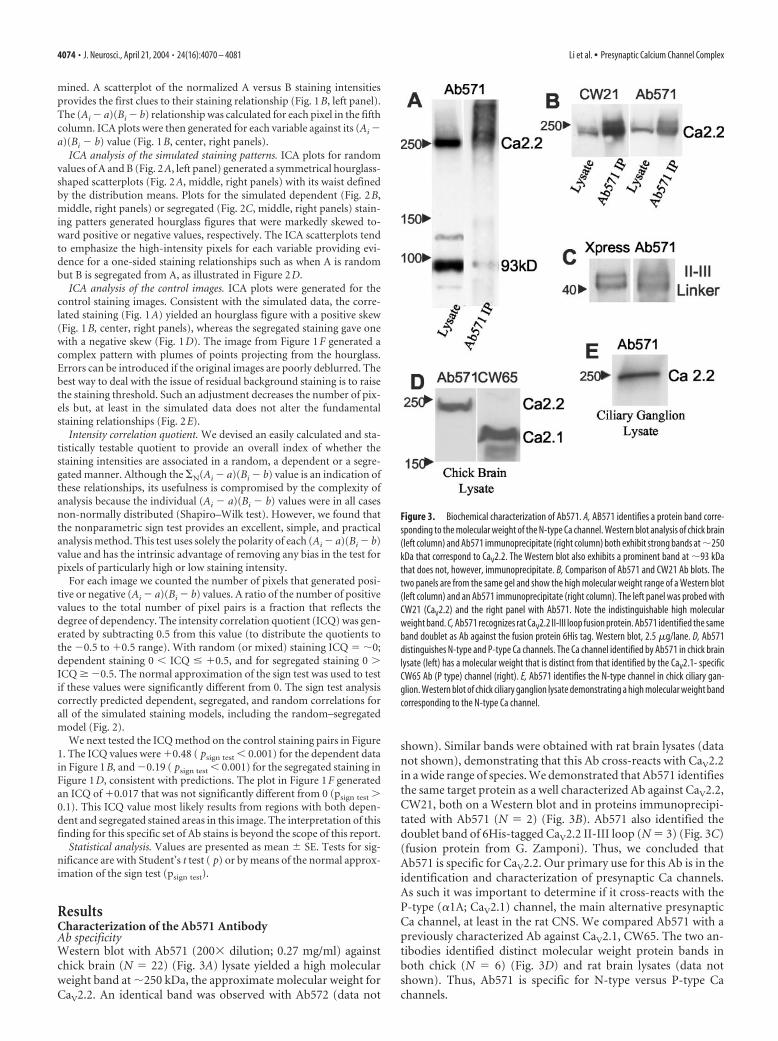
ResultsCharacterization of the Ab571 AntibodyAb specificityWestern blot with Ab571 (200� dilution; 0.27 mg/ml) againstchick brain (N � 22) (Fig. 3A) lysate yielded a high molecularweight band at �250 kDa, the approximate molecular weight forCaV2.2. An identical band was observed with Ab572 (data not
shown). Similar bands were obtained with rat brain lysates (datanot shown), demonstrating that this Ab cross-reacts with CaV2.2in a wide range of species. We demonstrated that Ab571 identifiesthe same target protein as a well characterized Ab against CaV2.2,CW21, both on a Western blot and in proteins immunoprecipi-tated with Ab571 (N � 2) (Fig. 3B). Ab571 also identified thedoublet band of 6His-tagged CaV2.2 II-III loop (N � 3) (Fig. 3C)(fusion protein from G. Zamponi). Thus, we concluded thatAb571 is specific for CaV2.2. Our primary use for this Ab is in theidentification and characterization of presynaptic Ca channels.As such it was important to determine if it cross-reacts with theP-type (�1A; CaV2.1) channel, the main alternative presynapticCa channel, at least in the rat CNS. We compared Ab571 with apreviously characterized Ab against CaV2.1, CW65. The two an-tibodies identified distinct molecular weight protein bands inboth chick (N � 6) (Fig. 3D) and rat brain lysates (data notshown). Thus, Ab571 is specific for N-type versus P-type Cachannels.
Figure 3. Biochemical characterization of Ab571. A, AB571 identifies a protein band corre-sponding to the molecular weight of the N-type Ca channel. Western blot analysis of chick brain(left column) and Ab571 immunoprecipitate (right column) both exhibit strong bands at �250kDa that correspond to CaV2.2. The Western blot also exhibits a prominent band at �93 kDathat does not, however, immunoprecipitate. B, Comparison of Ab571 and CW21 Ab blots. Thetwo panels are from the same gel and show the high molecular weight range of a Western blot(left column) and an Ab571 immunoprecipitate (right column). The left panel was probed withCW21 (CaV2.2) and the right panel with Ab571. Note the indistinguishable high molecularweight band. C, Ab571 recognizes rat CaV2.2 II-III loop fusion protein. Ab571 identified the sameband doublet as Ab against the fusion protein 6His tag. Western blot, 2.5 �g/lane. D, Ab571distinguishes N-type and P-type Ca channels. The Ca channel identified by Ab571 in chick brainlysate (left) has a molecular weight that is distinct from that identified by the CaV2.1- specificCW65 Ab (P type) channel (right). E, Ab571 identifies the N-type channel in chick ciliary gan-glion. Western blot of chick ciliary ganglion lysate demonstrating a high molecular weight bandcorresponding to the N-type Ca channel.
4074 • J. Neurosci., April 21, 2004 • 24(16):4070 – 4081 Li et al. • Presynaptic Calcium Channel Complex

Western blots with Ab571 consistentlygave a second prominent band at �93 kDa(Fig. 3A, left column), suggesting eitherthe presence of a Ca channel fragment orcross-reaction with a different antigen.We examined this binding further becausea major different antigen might limit theusefulness of the Ab for both biochemicaland immunocytochemical uses. The pro-tein was unlikely to be a Ca channel frag-ment because it was not precipitated byAb572. The 93 kDa band was markedlyreduced after a low-frequency spin(1000 � g) of the chick brain lysate beforeAb addition (data not shown). This find-ing strongly suggests that the contaminantis an antigen associated with a dense cellorganelle, most likely the nucleus. This hy-pothesis was supported by the finding thatnuclei were routinely stained when Ab571was used at high concentration in immuno-cytochemistry (data not shown). Fortu-nately, the 93 kDa band was greatly reducedwhen Ab571 target proteins were immuno-precipitated (Fig. 3A, right column), sug-gesting that in the nondenatured brain lysatethe contaminating protein antigen is physi-cally sequestered from Ab access. We did notcharacterize this antigen further. The mini-mal contaminating bands obtained whenAb571 was used to IP chick brain suggeststhat this Ab can serve as a tool for coIP ofproteins that complex with the N-type Cachannel. Even if this Ab precipitated a nu-clear protein complex, it is highly unlikelythat any component would correspond to apresynaptic protein.
Localization of the Ca channel atnerve terminalsHippocampal neuron cultures. Staining ofhippocampal neuron cultures with Ab571yielded small bright puncta that coursedalong the same tracks as stains for thenerve terminal-associated protein syn-taxin (Fig. 4A), or SV2, an integral mem-brane protein of the secretory vesicle (Fig.4B). However, because these structuresare very small it is not possible to discern ifthe staining patterns reflect actual proteinassociations. Rat brain neurons use severalCa channel types, notably the P type, togate transmitter release. Hence, at leastsome of the secretory vesicle clustersstained with SV2 but not associated withan Ab571 puncta may well be associatedwith nerve terminals that use an alterna-tive Ca channel type.
Dissociated chick ciliary ganglion.Ab571 identified a �250 kDa band inchick ciliary ganglion lysate (N � 6) (Fig.3E) as in the chick brain lysate, confirming
Figure 4. Ab571 staining localized release sites at the chick ciliary ganglion calyx nerve terminal. A, Primary hippocampalneuron culture stained with Ab571 (green) and monoclonal anti-syntaxin (red). Note Ca channel puncta are along the sametrajectories as the syntaxin staining, consistent with the synaptic contacts formed by a nerve fiber process onto an underlyingpostsynaptic neuron (data not shown). B, As for A except double-stained with monoclonal anti-SV2 (red). Some colocalization ofthe two dyes was noted in both A and B, but puncta of single stained syntaxin, SV2, or Ca channels were also evident. C, An opticalsection through a calyx presynaptic terminal attached to postsynaptic ciliary neuron stained for Ca channels (Ab571; green, toppanel) and both Ab571 and synaptic vesicle clusters (SV2; red, bottom panel). A diagram (not to scale) of the synapse is presentedin the bottom panel. D, Calyx terminal stained with Ab571 (top left panel) rabbit polyclonal SV2 (top center panel), and Na–K pump(top right panel) using the pretty-poly multiple polyclonal immunostaining technique (see Results). The next three (middle row)panels show colocalization of Ab517 and SV2 (left panel, middle row), Ab571 and Na–K pump (center panel, middle row), and SV2and Na–K pump (right panel, middle row). The bottom panel is a triple overlay of the three stains. The ciliary neuron is above thecalyx. Note the Ca channel clusters on the transmitter release face aspect and the secretory vesicle clouds overlapping the channelsand distal from the release site. The staining in the image has been adjusted digitally to enhance the resolution of the threestructures. Some distortion of sizes (such as surface membrane thickness) is a result of both the membrane coursing through theimage plane at an angle and of limitations in the resolution of the light microscope. Scale bars: A, B, 5 �m; C,D, 2 �m.
Li et al. • Presynaptic Calcium Channel Complex J. Neurosci., April 21, 2004 • 24(16):4070 – 4081 • 4075

that the N-type Ca channel could be identified in this tissue.Ab571 immunostaining of dissociated chick ciliary ganglion neu-rons (Stanley and Goping, 1991) with Ab571 resulted in low in-tensity, but above background, stain of the ciliary neuron cyto-plasm (data not shown). This staining could be accounted for bythe local synthesis of Ca channels because these neurons also useN-type Ca channels at their presynaptic nerve terminals (Gray etal., 1992; White et al., 1997).
The calyx nerve terminal has two main advantages that com-bine to make it the preparation of choice for Ca channel/releasesite protein staining experiments at a fast transmitting synapse.First, virtually all the presynaptic Ca channels are N-type (Stanleyand Atrakchi, 1990; Yawo and Chuhma, 1993) and second, thelarge size of this terminal permits the differentiation of specificregions of the terminal within the resolution of the light micro-scope (Stanley and Mirotznik, 1997; Mirotznik et al., 2000; Chenet al., 2002).
Ab571 stained the calyx nerve terminals in small bright punctathat were located in the presynaptic release face region (Fig. 4C,top panel) as well as some puncta that appeared to be locatedwithin the terminal itself (as was confirmed by costaining with asurface membrane marker, the Na–K pump; data not shown).
Ab571 stained puncta associate with synaptic vesicle clusters.Synaptic vesicle clouds (localized with anti-SV2) were associatedwith many Ca channel clusters (Fig. 4C). To confirm that theseCa channel clusters were located in the presynaptic region, wetriple-stained calyx terminals with a monoclonal for Na–Kpumps to mark the surface membrane, and two rabbit polyclonalantibodies against the other two targets, Ab571and SV2, using thepretty-poly technique (Morris and Stanley, 2003). This demon-strated clearly that the Ab571 stains puncta on the release faceaspect of the calyx abutting intracellular synaptic vesicle clouds(Fig. 4D).
The immunostaining results, together with the biochemicalanalysis of Ab571 binding, confirm that this Ab can be used tolocalize Ca channels at the release sites in these presynaptic nerveterminals.
Syntaxin 1 localizationSyntaxin 1 associates with MUNC18We have previously demonstrated that syntaxin 1 is widely dis-tributed at the nerve terminal and is both on the Schwann cellaspect (the nonsynaptic face) as well as the synaptic aspect thatabuts the ciliary neuron (Stanley and Mirotznik, 1997), althoughstaining was consistently more intense on the synaptic aspect.Several recent studies have concluded that syntaxin forms astrong association with MUNC18 –1 (Pevsner et al., 1994), a pro-tein that has been hypothesized to bind to syntaxin after vesicularfusion (Dulubova et al., 1999, 2003). Our findings were consis-tent with a syntaxin 1/MUNC18 –1 complex in that chick brainsyntaxin 1 coimmunoprecipitated with MUNC18 (Fig. 5A). Weused immunocytochemistry to test if these two proteins wereassociated at the presynaptic terminal (Fig. 5B). A visual inspec-tion of the staining pairs suggested colocalization of the proteinsat the surface membrane. We used the ICA method to test for astaining relation between syntaxin and MUNC18 (Fig. 5C) (seeMaterials and Methods). The (A � a)(B � b) plots were stronglyskewed toward positive values (Fig. 5C, middle and bottom pan-els), consistent with a highly dependent staining pattern. Fur-thermore, the calculated ICQ values were consistently positiveand highly significant (0.21 0.03; p � 0.001; N � 6). Thisanalysis provides compelling evidence that staining for syntaxin 1
varies in synchrony with that for MUNC18 –1, consistent withthe formation of a complex within the nerve terminal.
Syntaxin 1 association with Ca channelsAb571 immunoprecipitation of N-type Ca channels from chickbrain lysate coprecipitated syntaxin 1 (Fig. 6A). Immobilizedchick brain Ca channels could also be used to pull down syntaxin1 fusion protein (Fig. 6A). Interestingly, the addition of either of
Figure 5. Syntaxin association with MUNC18. A, Immunoprecipitation of MUNC18 fromchick brain lysate coprecipitates syntaxin 1 (right column). The left column is a bead control. B,An optical section through a calyx nerve terminal synapse stained for MUNC18 (B/W top panel;green, bottom panel) and syntaxin 1 (B/W center panel; red, bottom panel). The release sitemembrane has been isolated for colocalization analysis. Scale bar, 5 �m. C, Intensity correlationanalysis for syntaxin staining compared with MUNC18. Top panel, Scatter plot of pixel stainingintensities for MUNC18 and syntaxin 1. Center and bottom panels, ICA plots of MUNC18 –1 andsyntaxin 1 staining intensities against their respective (A � a)(B � b) values. ICQ � 0.34;p
sign test� 0.001.
4076 • J. Neurosci., April 21, 2004 • 24(16):4070 – 4081 Li et al. • Presynaptic Calcium Channel Complex

two syntaxin 1 fusion protein variants reduced the intensity of thecoprecipitated native syntaxin 1 band. This finding raises thepossibility that the Ca channel–syntaxin coprecipitation reflects,at least in part, a complex that is formed in vitro during the
incubation of the antibodies with the ly-sate. Hence, it cannot be concluded withconfidence from such results alone thatthis complex actually exists in situ.
To obtain further insight into the asso-ciation of these proteins, we examinedtheir location at the transmitter releaseface of the calyx presynaptic nerve termi-nal by immunocytochemistry. Calyx ter-minals were costained with Ab571 andmonoclonal anti-syntaxin 1 antibodies.We considered the possibility that Ab571might be prevented from localizing syn-taxin 1-bound Ca channels because boththe Ab and syntaxin 1 bind to a similarregion of the II-III loop (Vance et al.,1999). This possibility is rendered unlikelyby the findings that syntaxin 1-complexedCa channel was immunoprecipitated byAb571 (Fig. 6A,B) and that pretreatmentwith Ab571 did not block binding of syn-taxin 1-glutathione S-transferase, as testedby fusion protein coIP (N � 3) (Fig. 6C).Hence, it appears that syntaxin 1 andAb571 do not occlude each other fromtheir respective binding sites. Syntaxin 1staining was widely distributed across thenerve terminal, and it was not possible todetermine by visual inspection alonewhether the protein was colocalized withthe Ca channels (Fig. 6). We performed amore detailed analysis of the release faceregion by ICA. Although in some termi-nals there was evidence of a dependent re-lation between Ca channel and syntaxin 1(Fig. 6D,E), this was not consistent(ICQ � 0.07 0.04, 0.1 � p � 0.05;N � 9). However, at all terminals exam-ined, the pixels with high Ca channelstaining intensity were invariably associ-ated with at least some syntaxin staining(Fig. 6E, left panel). This was even moreevident in the (A � a)(B � b) plot inwhich a dependent staining pattern wasevident in the Ab571 scatterplot but notthe syntaxin 1 plot (Fig. 6E, center andright panels, respectively). As discussedabove, we interpret these findings to con-clude that the release face Ca channels areassociated with syntaxin 1 but, conversely,that the majority of the syntaxin 1 is notassociated with the channels.
G�O association with the presynapticCa channelG�O is not a stable component of a Cachannel protein complexWe used immunoprecipitation withAb571 to test if G�O is part of a complexwith the Ca channel in either its mono-
meric, � subunit, or trimeric �/�� state. The latter was examinedby performing the precipitations in the presence or absence ofGTP�S, a sterically restricted tonic G-protein activator. G�O did
Figure 6. Syntaxin 1 association with Ca channels. A, Western blot of chick brain lysate (left lane) together with blots of Ab571immunoprecipitates (columns 1– 4) probed with Ab571 (top panel) or syntaxin 1 (bottom panel). Native syntaxin 1 (#1), GST-syntaxin 1 (#2), and syntaxin 1 fusion protein (#3) added to the lysate all coprecipitated with CaV2.2. Column 4 is a bead control. B,Ab571 coprecipitates syntaxin 1 from chick ciliary ganglion lysate. C, Ab571 does not occlude syntaxin 1 binding to a Ca channelII-III loop fusion protein. Left column, Western blot of (rat) syntaxin 1-glutathione S-transferase fusion protein (5 �g). Columns1–3, II-III loop fusion protein IP, syntaxin 1-glutathione S-transferase co-IP. Column 1, Syntaxin 1-glutathione S-transferase (5 �gthroughout) co-IP with 6His-tagged II-III loop (5 �g) using Xpress Ab. Column 2, as in (column 1) but after pretreatment of the II-IIIloop fusion protein with Ab571. Column 3, bead control as in column 2 but without Xpress Ab. D, E, As in Figure 5B,C but comparingthe intensities of Ca channel (green, left panel; B/W center panel) and syntaxin 1 (red, left panel; B/W right panel) staining. Notethe very wide range of syntaxin 1 pixel intensities at low Ca channel staining intensities plus the tail region at the higher Ca channelstaining intensities. Scale bar, 5 �m. ICQ � 0.11; psign test � 0.01.
Li et al. • Presynaptic Calcium Channel Complex J. Neurosci., April 21, 2004 • 24(16):4070 – 4081 • 4077

not coIP with the Ca channel, whether inthe resting G�� bound, or GTP�S-activated G��-free state (Fig. 7A). Similarresults were obtained when the brain ly-sate was solubilized with 3-[(3-chol-amidopropyl)dimethylammonio]-1-propanesulfonate (data not shown).
G�O is associated with presynapticCa channelsCalyx terminals were stained with bothAb571 and G�O. Because G-protein stainsboth the presynaptic and postsynapticsynapse membranes (Mirotznik et al.,2000), we restricted our colocalizationanalysis to fully isolated calyx nerve termi-nals (Fig. 7B). A visual inspection of thestains on the membrane provided sugges-tive evidence for a colocalization of G�O
with Ca channels. However, the ICA anal-ysis was consistently in favor of such anassociation, both with respect to the stain-ing amplitude (A � a)(B � b) plots (Fig.7C) and positive ICQ values (all p �0.001) in five calyces (0.12, 0.13,0.10, 0.15, 0.10; mean 0.12 0.01,p
t test� 0.001). Thus, despite the lack of
evidence for a biochemical link betweenthe Ca channel and G�O, the immunocy-tochemical evidence suggests that thesetwo proteins vary in synchrony on the ca-lyx membrane and are likely componentsof the same complex. The G� Ab couldnot be used for immunocytochemistryand hence precluded a test colocalizationwith the Ca channel.
G�O association with syntaxinWe next tested for a biochemical associa-tion of syntaxin 1 with G�O. However,neither immunoprecipitation of syntaxin nor of G�O succeededin the coIP of the other protein (data not shown). Staining for G�O
and syntaxin yielded visual evidence for colocalization on the surfacemembrane (Fig. 8A). In addition, a strongly dependent staining pat-tern on the calyx membrane was indicated both by positively skewedICA scatter plots (Fig. 8B) and by positive ICQ values in three calyces(0.19, 0.21, 0.25; psign test � 0.001).
G�O association with MUNC18Our results indicate a high degree of colocalization of syntaxin 1with MUNC18 on the calyx membrane and, in addition thatsyntaxin 1 also correlated with G�O. We therefore tested whetherG�O was also associated with MUNC18. However, the two pro-teins did not coprecipitate (N � 4, data not shown), and positiveICQ values were obtained only in four of eight calyces, with anaverage ICQ value that was not significantly different from 0(0.07 0.04, 0.1 � p � 0.05; N � 8). These results argueagainst a strong association between MUNC18 and G�O in thecalyx membrane.
DiscussionIn earlier reports (Stanley and Mirotznik, 1997; Mirotznik et al.,2000) we suggested that presynaptic Ca channels, syntaxin 1,
and G�O are components of a common functional complex atthe presynaptic nerve terminal release site. The present studywas initiated to test this idea using biochemical and morpho-logical approaches. Our findings provide support for an N-type Ca channel–G�O–syntaxin complex at the intact terminaland, further, identify a second prominent syntaxin 1 complexwith MUNC18 –1.
This study was made possible by the high affinity and selectiveAb571 that we have shown to identify CaV2.2 (N-type, �1B Cachannels) on the basis of molecular weight, II-III loop bindingsite, by comparison with a previously well characterized Ab andby selectivity from CaV2.1 (Fig. 3). Furthermore, Ab571 selec-tively immunoprecipitates N-type Ca channels (Fig. 3A,B) andcoprecipitates associated proteins (Fig. 6 A,B), whereas immu-nostaining with Ab571 localizes N-type Ca channel clusters atboth chick and rat nerve terminals (Fig. 4A–C). The Ca channelswere located on the synaptic aspect of the calyx nerve terminalsurface membrane and associated with secretory vesicles clusters(Fig. 4D).
The development of the ICA–ICQ costaining analysis is a keyelement of this study. ICA analysis involves generating scatter-plots of stain A or stain B against the product of the difference ofeach pixel A and B intensities from their respective means. The
Figure 7. Association of G�O with the Ca channel. A, Immunoprecipitation of G�O coprecipitated G� from chick brain lysate inthe absence (left column) but not in the presence (second column) of the G-protein activator GTP�S. Immunoprecipitation ofCaV2.2 failed to coprecipitate G�O with or without GTP�S. B, Isolated calyx terminal stained for CaV2.2 (green, top image; bottomleft B/W image) and G�O (red, top image; bottom right B/W image). Membrane regions used for quantitative analysis areidentified. Scale bar, 2 �m. C The G�O staining intensity ( B) is compared with that for CaV2.2 with the method as described inFigure 5B,C. Note the positively skewed intensity versus (A � a)(B � b) plots, consistent with dependent staining. ICQ �0.15;psign test � 0.001.
4078 • J. Neurosci., April 21, 2004 • 24(16):4070 – 4081 Li et al. • Presynaptic Calcium Channel Complex

resulting plots emphasize the high intensity stained pixels andallow us to identify protein pairs that vary in synchrony, ran-domly, or independently within the cell. This technique is distin-guished from the usual dye-overlap method by its focus on thevariations in protein concentrations across the cell and not sim-ply their locations. Perhaps the worst limitation of the dye-overlapmethod is that when one protein target is distributedacross most or all of the cell, a second protein will be identified ascolocalized even when its distribution is totally random with re-spect to the first. The ICA method avoids this mistake because ifa randomly distributed protein overlaps with a broadly stainingone, it will not be reported as associated because it does not varyin synchrony (simulation data not shown). We also present theICQ, which serves as a statistically testable, single-value assess-ment of the relationship between the stained protein pairs. Al-though more naive than the ICA, its simplicity and utility make itan attractive tool for general use. We plan to develop a moresophisticated analysis based on the actual (A � a)(B � b) values(as apart from just their polarity) in due course. The ICA–ICQanalysis represents a powerful complement to standard biochem-ical IP tests for the analysis of protein complexes. The strength ofthe IP approach lies in identifying proteins bound in high-affinitycomplexes. However, it has disadvantages in missing any low-affinity associations (because of the necessary washing steps) andin the requirement for solubilization of the tissue, effectivelyeliminating virtually all clues not only to the location of the com-plex within the intact cell, but even from which cell or tissue typethe complex originates. Other limitations include differentiat-ing natural complex from those formed in vitro during lysateincubation (Fig. 6 A). ICA–ICQ analysis, on the other hand,has advantages in identifying potential low-affinity proteincomplexes and in retaining information on the cellular andsubcellular location. Its limitations include the failure to dis-tinguish two proteins that are parts of a molecular complexfrom two that are components of a common (small) organelle.
Other limitations, such as the occlusionof Ab binding sites because of the pro-tein interactions and an inability to dis-tinguish direct from indirect protein–protein binding, are common to both IPand ICA techniques.
Our study focuses on syntaxin 1, whichis known to associate with a number ofcytoplasmic and membrane proteins. Anumber of reports have concluded thatsyntaxin 1 can exist in an open, active con-figuration, as well as a closed inactive onestabilized by MUNC18 –1 (Hata et al.,1993; Kee et al., 1995; Misura et al., 2000).To test for a syntaxin 1/MUNC18 –1 com-plex in situ we stained for MUNC18 andsyntaxin 1 and performed a quantitativeanalysis of staining dependency. We findthat these proteins exhibit a strong stain-ing intensity correlation (Fig. 5). This in-dicates that syntaxin 1 and MUNC18 varyin synchrony and suggests that the major-ity of presynaptic syntaxin 1 exists in achaperoned and possibly inactive form(Pevsner et al., 1994; Garcia et al., 1995;Hata and Sudhof, 1995).
We next examined the association ofsyntaxin 1 with the N-type Ca channel.
Considerable evidence supports direct binding of these two pro-teins in vitro (Saisu et al., 1991; Yoshida et al., 1992; David et al.,1993; Sheng et al., 1994; Schmid et al., 1995; Vance et al., 1999)and their association has been demonstrated previously at thepresynaptic terminal (Bouvier et al., 1996; Seagar and Takahashi,1998). We first used Ab571 to confirm that syntaxin 1 coimmu-noprecipitates with the N-type Ca channel in both chick brainand ciliary ganglion lysates (Fig. 6A,B). Immunocytochemicalstaining demonstrated that syntaxin 1 was consistently present inregions of high Ca channel staining. Previous studies have alsonoted a colocalization of syntaxin with the presynaptic Ca chan-nel but that the distribution of syntaxin extends beyond that ofthe release sites (Bouvier et al., 1996; Raciborska et al., 1998). Ourfindings suggest that this syntaxin 1 is in a nonrelease site com-plex with MUNC18 –1. At the release site syntaxin 1 is in a com-plex with N-type channel, a link that may play a role in the regu-lation of presynaptic Ca channel properties (see Introduction). Itis unlikely that syntaxin tethers the Ca channel to the release sitesince its cleavage does not cause the large membrane particles atfreeze-fractured frog neuromuscular terminals, previously at-tributed to Ca channels, to drift away (Stanley et al., 2003). None-theless, syntaxin 1 appears to play an important role in the for-mation of the secretory vesicle docking site itself (Stanley et al.,2003).
We next examined the association of G�O, a prime candidateas the modulator of Ca channels (Mirotznik et al., 2000), with thepresynaptic channels. We performed numerous IP trials to testfor a molecular complex that included G�O and CaV2.2. Invari-ably, precipitation of either protein invariably failed to co-IP theother, whether or not the G-protein � subunit was in its resting(trimeric) or activated (monomeric) state. Thus, under our con-ditions we were unable to demonstrate a stable complex betweenG�O and the N-type Ca channel, as reported (McEnery et al.,1994). In contrast, double staining of the calyx nerve terminals
Figure 8. Association of G�O with syntaxin 1 on the nerve terminal membrane. A, Optical section through an isolated calyxpresynaptic nerve terminal stained for syntaxin 1 (red, left panel; B/W center panel) and G�O (green, left panel; B/W right panel).Scale bar, 5 �m. B, Intensity correlation plots of G�O with respect to syntaxin (Fig. 5B,C). Note the positively skewed intensityversus (A � a)(B � b) plots, consistent with dependent staining. ICQ � 0.25; psign test � 0.001.
Li et al. • Presynaptic Calcium Channel Complex J. Neurosci., April 21, 2004 • 24(16):4070 – 4081 • 4079

for G�O and CaV2.2 yielded evidence of highly synchronousstaining, consistent with the conclusion that at the presynapticnerve terminal membrane G�O is a component of Ca channelcomplex. Thus, it remains possible that our solubilization proto-cols used for IP were more stringent than that used by McEnery etal. (1994), effectively dissociating an existing low-affinitycomplex.
These findings provide additional insight into the interrela-tionship between the presynaptic Ca channel and two proteinsknown to play a prominent role in its modulation. Our hypoth-esis of a tri-protein complex was supported by both an associa-tion between the presynaptic Ca channel with both syntaxin 1and the G-protein, a finding supported further by the colocaliza-tion of G-protein with syntaxin 1. In addition, our findings pro-vide evidence for two syntaxin 1 complexes in the nerve terminal.The first one is associated with the Ca channel at the transmitterrelease site, as would be expected for both a role in vesicle fusionand also in the modulation of the channel itself. The observationthat G-protein modulation of presynaptic Ca channels is dis-rupted by syntaxin 1 cleavage (Stanley and Mirotznik, 1997) isconsistent with the idea that the localization of the G-protein tothe Ca channel requires syntaxin 1 and that these proteins form afunctional complex for channel modulation. However, by farthe majority of the syntaxin 1 protein appears to be in associ-ation with MUNC18 at a location that is distinct from the Cachannel and, by inference, the release site. We do not know therole of the putative syntaxin 1–MUNC18 –1 complex. It couldreflect a syntaxin pool reserve for rapid transmitter turnoveror may serve a separate role in nerve terminal function.
ReferencesBergsman JB, Tsien RW (2000) Syntaxin modulation of calcium channels in
cortical synaptosomes as revealed by botulinum toxin C1. J Neurosci20:4368 – 4378.
Bezprozvanny I, Scheller RH, Tsien RW (1995) Functional impact of syn-taxin on gating of N-type and Q-type calcium channels. Nature(Lond)378:623– 626.
Bouvier JA, Charvin N, Boudier JL, Fathallah M, Tagaya M, Takahashi M,Seagar M (1996) Distribution of components of the SNARE complex inrelation to transmitter release sites at the frog neuromuscular junction.Eur J Neurosci 8:545–552.
Brewer GJ (1997) Isolation and culture of adult rat hippocampal neurons.J Neurosci Methods 71:143–155.
Chen S, Zheng X, Schulze KL, Morris T, Bellen H, Stanley EF (2002) En-hancement of presynaptic calcium current by cysteine string current. JPhysiol (Lond) 538:383–389.
David P, El Far O, Martin-Mouto N, Poupon MF, Takahashi M, Seagar MJ(1993) Expression of synaptotagmin and syntaxin associated withN-type calcium channels in small cell lung cancer. FEBS Lett326:135–139.
Degtiar VE, Scheller RH, Tsien RW (2000) Syntaxin modulation of slowinactivation of N-type calcium channels. J Neurosci 20:4355– 4367.
Dulubova I, Sugita S, Hill S, Hosaka M, Fernandez I, Sudhof TC, Rizo J(1999) A conformational switch in syntaxin during exocytosis: role ofmunc18. EMBO J 18:4372– 4382.
Dulubova I, Yamaguchi T, Arac D, Li H, Huryeva I, Min SW, Rizo J, SudhofTC (2003) Convergence and divergence in the mechanism of SNAREbinding by Sec1/Munc18-like proteins. Proc Natl Acad Sci USA100:32–37.
Fletcher CF, Tottene A, Lennon VA, Wilson SM, Dubel SJ, Paylor R, HosfordDA, Tessarollo L, McEnery MW, Pietrobon D, Copeland NG, Jenkins NA(2001) Dystonia and cerebellar atrophy in Cacna1a null mice lacking P/Qcalcium channel activity. FASEB J 15:1288 –1290.
Garcia EP, McPherson PS, Chilcote TJ, Takei K, De Camilli P (1995)
rbSec1A and B colocalize with syntaxin 1 and SNAP-25 throughout theaxon, but are not in a stable complex with syntaxin. J Cell Biol129:105–120.
Gray DB, Bruses JL, Pilar GR (1992) Developmental switch in the pharma-cology of Ca 2 channels coupled to acetylcholine release. Neuron8:715–724.
Hata Y, Slaughter CA, Sudhof TC (1993) Synaptic vesicle fusion complexcontains unc-18 homologue bound to syntaxin. Nature (Lond)366:347–351.
Hata Y, Sudhof TC (1995) A novel ubiquitous form of Munc-18 interactswith multiple syntaxins. Use of the yeast two-hybrid system to studyinteractions between proteins involved in membrane traffic. J Biol Chem270:13022–13028.
Hille B (1994) Modulation of ion channels by G-protein coupled receptors.Trends Neurosci 17:531–535.
Ikeda SR, Dunlap K (1999) Voltage-dependent modulation of N-type cal-cium channels: role of G protein subunits. Adv Second Messenger Phos-phoprotein Res 1999 131–151.
Jarvis SE, Zamponi GW (2001a) Distinct molecular determinants governsyntaxin 1A-mediated inactivation and G-protein inhibition of N-typecalcium channels. J Neurosci 21:2939 –2948.
Jarvis SE, Zamponi GW (2001b) Interactions between presynaptic Ca 2
channels, cytoplasmic messengers and proteins of the synaptic vesiclerelease complex. Trends Pharmacol Sci 22:519 –525.
Kee Y, Lin RC, Hsu S-C, Scheller RH (1995) Distinct domains of syntaxinare required for synaptic vesicle fusion complex formation and dissocia-tion. Neuron 14:991–998.
Lu Q, Dunlap K (1999) Cloning and functional expression of novel N-typeCa(2) channel variants. J Biol Chem 274:34566 –34575.
Lu Q, AtKisson MS, Jarvis SE, Feng ZP, Zamponi GW, Dunlap K (2001)Syntaxin 1A supports voltage-dependent inhibition of alpha1B Ca 2
channels by G�� in chick sensory neurons. J Neurosci 21:2949 –2957.McEnery MW, Snowman AM, Snyder SH (1994) The association of endog-
enous Go alpha with the purified omega-conotoxin GVIA receptor. J BiolChem 269:5– 8.
McEnery MW, Haase H, Vance CL, Dubel SJ, Morano I, Copeland TD, ChoiY (1997) Beta1B subunit of voltage-dependent Ca 2 channels is pre-dominant isoform expressed in human neuroblastoma cell line IMR32.FEBS Lett 420:74 –78.
Mirotznik RR, Zheng X, Stanley EF (2000) G-Protein types involved in cal-cium channel inhibition at a presynaptic nerve terminal. J Neurosci20:7614 –7621.
Misura KM, Scheller RH, Weis WI (2000) Three-dimensional structure ofthe neuronal-Sec1-syntaxin 1a complex. Nature (Lond) 404:355–362.
Morris TJ, Stanley EF (2003) A simple method for immunocytochemicalstaining with multiple rabbit polyclonal antibodies. J Neurosci Methods127:149 –155.
Pevsner J, Hsu S-C, Scheller RH (1994) n-Sec1: A neural-specific syntaxin-binding protein. Proc Natl Acad Sci USA 91:1445–1449.
Raciborska DA, Trimble WS, Charlton MP (1998) Presynaptic protein in-teractions in vivo: evidence from botulinum A, C, D, and E action at frogneuromuscular junction. Eur J Neurosci 10:2617–2628.
Saisu H, Ibaraki K, Yamaguchi T, Sekine Y, Abe T (1991) Monoclonal anti-bodies immunoprecipitating omega-conotoxin- sensitive calcium chan-nel molecules recognize two novel proteins localized in the nervous sys-tem. Biochem Biophys Res Commun 181:59 – 66.
Schmid R, Seydl K, Baumgartner W, Groschner K, Romanin C (1995) Tryp-sin increases availability and open probability of cardiac L- type Ca 2
channels without affecting inactivation induced by Ca 2. Biophys J69:1847–1857.
Seagar M, Takahashi M (1998) Interactions between presynaptic calciumchannels and proteins implicated in synaptic vesicle trafficking and exo-cytosis. J Bioenerg Biomembr 30:347–356.
Sheng Z-H, Rettig J, Takahashi M, Catterall WA (1994) Identification of asyntaxin-binding site on N-type calcium channels. Neuron 13:1303–1313.
Stanley EF (1991) Single calcium channels on a cholinergic presynapticnerve terminal. Neuron 7:585–591.
Stanley EF (2003) Syntaxin I modulation of presynaptic calcium channel inac-tivation revealed by botulinum toxin C1. Eur J Neurosci 17:1303–1305.
Stanley EF, Atrakchi AH (1990) Calcium currents recorded from a verte-
4080 • J. Neurosci., April 21, 2004 • 24(16):4070 – 4081 Li et al. • Presynaptic Calcium Channel Complex

brate presynaptic nerve terminal are resistant to the dihydropyridine ni-fedipine. Proc Natl Acad Sci USA 87:9683–9687.
Stanley EF, Goping G (1991) Characterization of a calcium current in avertebrate cholinergic presynaptic nerve terminal. J Neurosci 11:985–993.
Stanley EF, Mirotznik RR (1997) Cleavage of syntaxin prevents G-protein regulation of presynaptic calcium channels. Nature (Lond)385:340 –343.
Stanley EF, Reese TS, Wang GZ (2003) Molecular scaffold reorganization atthe transmitter release site with vesicle exocytosis or botulinum toxin C1.Eur J Neurosci 18:2403–2407.
Sun XP, Stanley EF (1996) An ATP-activated, ligand gated ion channelon a cholinergic presynaptic nerve terminal. Proc Natl Acad Sci USA93:1859 –1863.
Takahashi T, Kajikawa Y, Tsujimoto T (1998) G-Protein-coupled modula-tion of presynaptic calcium currents and transmitter release by a GABABreceptor. J Neurosci 18:3138 –3146.
Vance CL, Begg CM, Lee WL, Dubel SJ, Copeland TD, Sonnichsen FD, McEn-ery MW (1999) N-type calcium channel/syntaxin/SNAP-25 complexprobed by antibodies to II-III intracellular loop of the alpha1B subunit.Neuroscience 90:665– 676.
White MG, Crumling MA, Meriney SD (1997) Developmental changes incalcium current pharmacology and somatostatin inhibition in chick para-sympathetic neurons. J Neurosci 17:6302– 6313.
Wiser O, Bennett MK, Atlas D (1996) Functional interaction of syntaxinand SNAP-25 with voltage sensitive L- and N-type Ca 2 channels. EMBOJ 15:4100 – 4110.
Yawo H, Chuhma N (1993) Preferential inhibition of omega-conotoxin-sensitive presynaptic Ca 2 channels by adenosine autoreceptors. Nature(Lond) 365:256 –258.
Yoshida A, Oho C, Omori A, Kuwahara R, Ito T, Takahashi M (1992)HPC-1 is associated with synaptotagmin and omega-conotoxin receptor.J Biol Chem 267:24925–24928.
Li et al. • Presynaptic Calcium Channel Complex J. Neurosci., April 21, 2004 • 24(16):4070 – 4081 • 4081
![Calcium Homeostasis in Articular Chondrocytes of Two ... · Introduction: Intracellular calcium concentration ([Ca2+] i) is a critical para-meter in cellular homeostasis, including](https://static.fdocuments.net/doc/165x107/5f05a9497e708231d414126a/calcium-homeostasis-in-articular-chondrocytes-of-two-introduction-intracellular.jpg)