Cellular Levels, Excretion, and Synthesis Rates of Cyclic - Journal of
7
Vol. 149, No. 3 JOURNAL OF BACTERIOLOGY, Mar. 1982, p. 801-807 0021-9193/82/030801-07$02.00/0 Cellular Levels, Excretion, and Synthesis Rates of Cyclic AMP in Escherichia coli Grown in Continuous Culture ABDUL MATIN* AND MIMI K. MATIN Department of Medical Microbiology, Stanford University School of Medicine, Stanford, California 94305 Received 3 August 1981/Accepted 12 October 1981 Changes in dilution rate did not elicit large and systematic changes in cellular cyclic AMP levels in Escherichia coli grown in a chemostat under carbon or phosphate limitation. However, the technical difficulties of measuring low levels of cellular cyclic AMP in the presence of a large background of extracellular cyclic AMP precluded firm conclusions on this point. The net rate of cyclic AMP synthesis increased exponentially with increasing dilution rate through either the entire range of dilution rates examined (phosphate limitation) or a substantial part of the range (lactose and glucose limitations). Thus, it is probable that growth rate regulates the synthesis of adenylate cyclase. The maximum rate of net cyclic AMP synthesis was greater under lactose than under glucose limitation, which is consistent with the notion that the uptake of phosphotransferase sugars is more inhibitory to adenylate cyclase than the uptake of other carbon substrates. Phosphate-limited cultures exhibited the lowest rate of net cyclic AMP synthesis, which could be due to the role of phosphorylated metabolites in the regulation of adenylate cyclase activity. Under all growth conditions examined, >99.9% of the cyclic AMP synthesized was found in the culture medium. The function of this excretion, which consumed up to 9% of the total energy available to the cell and which evidently resulted from elaborate regulatory mechanisms, remains entirely unknown. In a previous study (12), we showed that two bacteria exhibited markedly higher rates of syn- thesis of several enzymes of intermediary me- tabolism when grown at low dilution rates (D) in a chemostat under carbon, nitrogen, or phos- phorus limitation. Such an increase in rates of enzyme synthesis in slowly growing bacteria appears to be a general phenomenon (9, 10, 12), and we speculated (12) that this may be a consequence of increased cellular cyclic AMP levels at low growth rates. This speculation was consistent with the available evidence that an inverse relationship exists between growth rate and cellular cyclic AMP levels of bacterial and mammalian cells (2, 13-15) and that in mammali- an cells contact inhibition of growth is accompa- nied by a rise in cellular cyclic AMP levels (14, 15). In fact, extensive studies in mammalian cells, spurred by these observations, have led to the postulation that cellular cyclic AMP levels play a central role in growth regulation and neoplastic transformation (14, 15). However, the evidence for an inverse rela- tionship between cellular cyclic AMP levels and growth rates was obtained with batch cultures, which are not suitable for such studies. The environmental conditions in such cultures change continuously and drastically with time, leading to significant changes in cellular cyclic AMP levels even during the logarithmic phase (1), and a change in growth rate can only be achieved by qualitative changes in the environ- ment, which may have effects independent of growth rate. Thus, continuous culture (chemos- tat) studies of the effect of growth rate on cyclic AMP levels are of interest. This technique per- mits microbial growth under steady-state condi- tions and wide changes in growth rate with only a slight alteration in the concentration of a growth-limiting nutrient. While our studies were in progress, Harman and Botsford (5) and Wright et al. (26) published their chemostat work dealing with cyclic AMP in bacteria. The studies reported here include two growth conditions-lactose and phosphate limi- tations-not examined by these workers, and the results differ from their findings in some respects. MATERIALS AND METHODS Organism and culture conditions. Escherichia coli K- 12 was obtained from our departmental culture collec- tion. The basal salts solution employed was very similar to that described previously (12), except for the following modifications. The NaCl concentration used was 0.03 g/liter, and phosphate-limited media con- tained 0.17 g of K2 HPO4 3H20 per liter and 0.011 g of KH2PO4 (anhydrous) per liter. The glucose-limited 801 on November 28, 2018 by guest http://jb.asm.org/ Downloaded from
Transcript of Cellular Levels, Excretion, and Synthesis Rates of Cyclic - Journal of

Vol. 149, No. 3JOURNAL OF BACTERIOLOGY, Mar. 1982, p. 801-8070021-9193/82/030801-07$02.00/0
Cellular Levels, Excretion, and Synthesis Rates of CyclicAMP in Escherichia coli Grown in Continuous Culture
ABDUL MATIN* AND MIMI K. MATIN
Department of Medical Microbiology, Stanford University School of Medicine, Stanford, California 94305
Received 3 August 1981/Accepted 12 October 1981
Changes in dilution rate did not elicit large and systematic changes in cellularcyclic AMP levels in Escherichia coli grown in a chemostat under carbon orphosphate limitation. However, the technical difficulties of measuring low levelsof cellular cyclic AMP in the presence of a large background of extracellular cyclicAMP precluded firm conclusions on this point. The net rate of cyclic AMPsynthesis increased exponentially with increasing dilution rate through eitherthe entire range of dilution rates examined (phosphate limitation) or a substantialpart of the range (lactose and glucose limitations). Thus, it is probable that growthrate regulates the synthesis of adenylate cyclase. The maximum rate of net cyclicAMP synthesis was greater under lactose than under glucose limitation, which isconsistent with the notion that the uptake of phosphotransferase sugars is moreinhibitory to adenylate cyclase than the uptake of other carbon substrates.Phosphate-limited cultures exhibited the lowest rate of net cyclic AMP synthesis,which could be due to the role of phosphorylated metabolites in the regulation ofadenylate cyclase activity. Under all growth conditions examined, >99.9% of thecyclic AMP synthesized was found in the culture medium. The function of thisexcretion, which consumed up to 9% of the total energy available to the cell andwhich evidently resulted from elaborate regulatory mechanisms, remains entirelyunknown.
In a previous study (12), we showed that twobacteria exhibited markedly higher rates of syn-thesis of several enzymes of intermediary me-tabolism when grown at low dilution rates (D) ina chemostat under carbon, nitrogen, or phos-phorus limitation. Such an increase in rates ofenzyme synthesis in slowly growing bacteriaappears to be a general phenomenon (9, 10, 12),and we speculated (12) that this may be aconsequence of increased cellular cyclic AMPlevels at low growth rates. This speculation wasconsistent with the available evidence that aninverse relationship exists between growth rateand cellular cyclic AMP levels of bacterial andmammalian cells (2, 13-15) and that in mammali-an cells contact inhibition of growth is accompa-nied by a rise in cellular cyclic AMP levels (14,15). In fact, extensive studies in mammaliancells, spurred by these observations, have led tothe postulation that cellular cyclic AMP levelsplay a central role in growth regulation andneoplastic transformation (14, 15).However, the evidence for an inverse rela-
tionship between cellular cyclic AMP levels andgrowth rates was obtained with batch cultures,which are not suitable for such studies. Theenvironmental conditions in such cultureschange continuously and drastically with time,leading to significant changes in cellular cyclic
AMP levels even during the logarithmic phase(1), and a change in growth rate can only beachieved by qualitative changes in the environ-ment, which may have effects independent ofgrowth rate. Thus, continuous culture (chemos-tat) studies of the effect of growth rate on cyclicAMP levels are of interest. This technique per-mits microbial growth under steady-state condi-tions and wide changes in growth rate with onlya slight alteration in the concentration of agrowth-limiting nutrient.While our studies were in progress, Harman
and Botsford (5) and Wright et al. (26) publishedtheir chemostat work dealing with cyclic AMP inbacteria. The studies reported here include twogrowth conditions-lactose and phosphate limi-tations-not examined by these workers, andthe results differ from their findings in somerespects.
MATERIALS AND METHODS
Organism and culture conditions. Escherichia coli K-12 was obtained from our departmental culture collec-tion. The basal salts solution employed was verysimilar to that described previously (12), except for thefollowing modifications. The NaCl concentration usedwas 0.03 g/liter, and phosphate-limited media con-tained 0.17 g of K2 HPO4 3H20 per liter and 0.011 g ofKH2PO4 (anhydrous) per liter. The glucose-limited
801
on Novem
ber 28, 2018 by guesthttp://jb.asm
.org/D
ownloaded from

802 MATIN AND MATIN
media contained 0.5 g of glucose per liter; lactose-limited media contained 0.5 g of lactose per liter; andphosphate-limited media contained 1.5 g of lactose perliter. The carbon source and phosphates were auto-claved separately and added aseptically to the basalsalts. The bacteria were grown at 37°C (+0.5°C) in aNew Brunswick C-30 Bioflo chemostat with a workingvolume of 350 ml. The pH was automatically main-tained (11, 12) at 6.8 ± 0.1 by the addition of 5%Na2CO3 solution. The aeration rate was 0.5 liter/min,and agitation was maintained between 350 and 400rpm. The cells were allowed to grow at a given D valuefor at least five volume changes (approximately sevengenerations) before being considered to be in thesteady state. Biomass was monitored by optical densi-ty measurement, and the optical density units wereconverted to protein values by use of a standard curvethat related these two parameters; according to ourprevious studies (12), the optical density-to-proteinratio changes very little in response to D in bacteria.The steady-state biomass varied from 0.17 to 0.19 andfrom 0.21 to 0.35 mg of protein per ml of culture undercarbon and phosphate limitations, respectively.
Stock cultures were maintained on lactose and glu-cose agar plates of the same composition as those usedin chemostat cultivation, except that agar (20 g/liter)was added.
Culture sampling and assay of cyclic AMP. Theconnection of a repeating dispenser pipette (Minipet;Manostat, New York, N.Y.) to the sampling port ofthe chemostat made it feasible to remove rapidlyaliquots of steady-state cultures. For total culturecyclic AMP determination, 1-ml aliquots were collect-ed in tubes containing 1 ml of 1.2 N HCl04. Todetermine intracellular cyclic AMP, 5-ml aliquots weredispensed over prewashed 0.45-p.m membrane filters(Millipore Corp., Bedford, Mass. kept over a vacuum.The filters were allowed to drain thoroughly, whichrequired 2 min, and then quickly transferred to tubescontaining 4 ml of 0.6 N HC104. For reasons discussedbelow, washing of the filters was omitted. However,since the extracellular fluid was found to contain alarge amount of cyclic AMP, it was necessary toestimate the amount of extracellular fluid that re-mained on the filters under these conditions. This wasdone by filtering cell suspensions containing a knownamount of 3H-labeled cyclic AMP and determining thecounts that remained on the filter. The filters retainedca. 20 p.l of extracellular fluid and, accordingly, thecorresponding amount of cyclic AMP was subtractedfrom the amount of the nucleotide recovered from thefilters (see Table 2). In several experiments, culturefiltrates were also analyzed; the results agreed closelywith the values predicted by total cell culture measure-ments. A known amount of 3H-labeled cyclic AMPwas added to each sample to check the recovery of thecyclic nucleotide during chromatographic purification(see below). Each sample was analyzed at least induplicate, and often in quadruplicate; average valueswith standard deviations are presented.
After mixing in a Vortex mixer for 3 min, thepreparations were centrifuged at 3,000 x g for 15 minat 4°C, and I ml of the supernatant was layered on aglass column (0.4 by 15 cm) containing HCl-treatedDowex 5OW x 4 - H+ resin of 200 to 400 mesh (Bio-Rad Laboratories, Richmond, Calif.). The column waseluted in two volumes of distilled water (3 and 6 ml.
respectively), the second eluate containing the cyclicAMP. Nearly all of the radioactive cyclic AMP thathad been added at the time of harvest (see above) waspresent in this fraction, indicating that the recovery ofcyclic AMP from the column was very close to 100%.Two milliliters of this fraction were dried in a stream ofwarm air and redissolved in 0.8 ml of 50 mM sodiumacetate buffer (pH 6.2). Control experiments, in whichknown amounts of cyclic AMP were subjected todrying and resuspension, showed that no loss of thenucleotide occurred during this step.
Cyclic AMP was assayed by the radioimmunoassayof Steiner et al. (22). The assay protocol was followedexactly according to the recommendation of the assaykit supplier (New England Nuclear Corp., Boston,Mass.), except that, to increase the sensitivity of theassay (6), 5 pL. of a freshly prepared mixture of aceticanhydride and triethylamine (1:2 vol/vol) was added toeach assay tube; this modification increases the sensi-tivity of the assay to 5 fmol. Five known concentra-tions of cyclic AMP ranging from 5 to 100 fmol wereincluded in each assay, and the resulting standardcurve was used to determine the cyclic AMP concen-tration in the samples. The results were corrected forthe labeled cyclic AMP added at the time of harvest(see above). To calculate the concentration of cyclicAMP in the cells, it was assumed that 1 mg of cellprotein corresponded to 5.4 pL. of cell water (25).The net rate of cyclic AMP synthesis (P) was
calculated by the equation:
Z x DP = (1)
where Z is the steady-state total cyclic AMP content ofthe culture, x is the steady-state cell biomass inmilligrams of protein, and D is the dilution rate. Thespecific rate of consumption of the limiting substrate(q) was calculated by the following equation:
SR - S4= ~ XD
where SR is the concentration of the growth-limitingsubstrate in the inflow medium, s is the residualsteady-state concentration of this substrate in theculture medium (assumed to be zero), and x and D areas defined for equation 1.
RESULTS
Cellular cyclic AMP levels. Initial experimentsshowed that an excess of cyclic AMP was pre-sent in the extracellular fluid under the variousgrowth conditions employed, so that washing ofthe filters used in estimating cellular cyclic AMPlevels appeared to be necessary. However,washing involves further disturbance of the cul-ture steady state and could therefore influencethe cellular cyclic AMP levels. A control experi-ment was done to check this possibility. Orga-nisms were grown under glucose limitation atvarious D values, and each steady-state culturewas sampled repeatedly by filtering 5-ml ali-quots through several separate filters. These
J. BACTERIOL.
(2)
on Novem
ber 28, 2018 by guesthttp://jb.asm
.org/D
ownloaded from
CYCLIC AMP CONTENT AT DIFFERENT GROWTH RATES
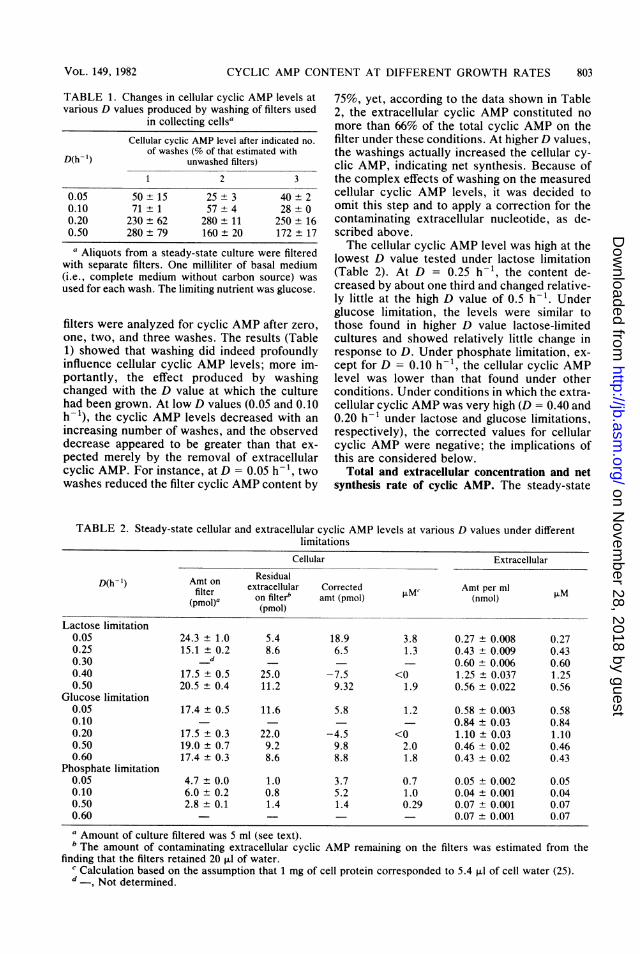
TABLE 1. Changes in cellular cyclic AMP levels atvarious D values produced by washing of filters used
in collecting cellsaCellular cyclic AMP level after indicated no.
of washes (% of that estimated withD(h- 1) unwashed filters)
1 2 3
0.05 50±15 25±3 40±20.10 71 ±1 57±4 28±00.20 230±62 280± 11 250 ± 160.50 280±79 160± 20 172 ± 17
a Aliquots from a steady-state culture were filteredwith separate filters. One milliliter of basal medium(i.e., complete medium without carbon source) wasused for each wash. The limiting nutrient was glucose.
filters were analyzed for cyclic AMP after zero,one, two, and three washes. The results (Table1) showed that washing did indeed profoundlyinfluence cellular cyclic AMP levels; more im-portantly, the effect produced by washingchanged with the D value at which the culturehad been grown. At low D values (0.05 and 0.10h-1), the cyclic AMP levels decreased with anincreasing number of washes, and the observeddecrease appeared to be greater than that ex-pected merely by the removal of extracellularcyclic AMP. For instance, at D = 0.05 h-1, twowashes reduced the filter cyclic AMP content by
TABLE 2. Steady-state cellular and extracellular cyclimitat
75%, yet, according to the data shown in Table2, the extracellular cyclic AMP constituted nomore than 66% of the total cyclic AMP on thefilter under these conditions. At higherD values,the washings actually increased the cellular cy-clic AMP, indicating net synthesis. Because ofthe complex effects of washing on the measuredcellular cyclic AMP levels, it was decided toomit this step and to apply a correction for thecontaminating extracellular nucleotide, as de-scribed above.The cellular cyclic AMP level was high at the
lowest D value tested under lactose limitation(Table 2). At D = 0.25 h-1, the content de-creased by about one third and changed relative-ly little at the high D value of 0.5 h-1. Underglucose limitation, the levels were similar tothose found in higher D value lactose-limitedcultures and showed relatively little change inresponse to D. Under phosphate limitation, ex-cept for D = 0.10 h-1, the cellular cyclic AMPlevel was lower than that found under otherconditions. Under conditions in which the extra-cellular cyclic AMP was very high (D = 0.40 and0.20 h-1 under lactose and glucose limitations,respectively), the corrected values for cellularcyclic AMP were negative; the implications ofthis are considered below.
Total and extracellular concentration and netsynthesis rate of cyclic AMP. The steady-state
clic AMP levels at various D values under different
Cellular Extracellular
D(h1) Amt on Residual
filter extracellular Corrected p.mC Amt per ml(pmol)a on filter' amt (pmol) (nmol)
(pmol)Lactose limitation
0.05 24.3 ± 1.0 5.4 18.9 3.8 0.27 + 0.008 0.270.25 15.1 ± 0.2 8.6 6.5 1.3 0.43 ± 0.009 0.430.30 d 0.60 0.006 0.600.40 17.5 ± 0.5 25.0 -7.5 <0 1.25 + 0.037 1.250.50 20.5 ± 0.4 11.2 9.32 1.9 0.56 ± 0.022 0.56
Glucose limitation0.05 17.4 ± 0.5 11.6 5.8 1.2 0.58 + 0.003 0.580.10 - - 0.84 ± 0.03 0.840.20 17.5 ± 0.3 22.0 -4.5 <0 1.10 ± 0.03 1.100.50 19.0 ± 0.7 9.2 9.8 2.0 0.46 ± 0.02 0.460.60 17.4 ± 0.3 8.6 8.8 1.8 0.43 ± 0.02 0.43
Phosphate limitation0.05 4.7 ± 0.0 1.0 3.7 0.7 0.05 + 0.002 0.050.10 6.0 ± 0.2 0.8 5.2 1.0 0.04 + 0.001 0.040.50 2.8 ± 0.1 1.4 1.4 0.29 0.07 + 0.001 0.070.60 - - 0.07 0.001 0.07a Amount of culture filtered was 5 ml (see text).b The amount of contaminating extracellular cyclic AMP remaining on the filters was estimated from the
finding that the filters retained 20 ,u1 of water.c Calculation based on the assumption that 1 mg of cell protein corresponded to 5.4 VI of cell water (25).d , Not determined.
VOL . 149, 1982 803
on Novem
ber 28, 2018 by guesthttp://jb.asm
.org/D
ownloaded from

804 MATIN AND MATIN
levels of total cyclic AMP in culture variedmarkedly with the D value under all three indi-vidual limitations (Fig. 1). The maximum levelof cyclic AMP was exhibited at an intermediateD value in carbon-limited cultures, at D = 0.2h-1 in glucose-limited cultures, and at D = 0.4h- 1 in lactose-limited cultures. Under phosphatelimitation, the total culture cyclic AMP ap-peared to increase with increasing D, but themagnitude of the change was small. The highestpeak level of total culture cyclic AMP was foundunder lactose limitation, and the lowest wasfound under phosphate limitation. At all D val-ues and regardless of the nature of limitation,>99.9% of the total cyclic AMP synthesized wasfound in the extracellular fluid (Fig. 1 and Table1). Previous batch culture studies have createdthe impression that excretion of cyclic AMPoccurs primarily in the stationary phase ofgrowth (17), but these studies show that exten-sive excretion occurs during logarithmic growthas well.The effect of D value on the rate of net cyclic
AMP synthesis (equation 1) under the threelimitations is shown in Fig. 2. In all three cases,there was an exponential increase in this rate inresponse to culture D, but the range of D valuesto which this response extended varied with thetype of limitation. Under glucose limitation, theexponential response was confined to D valuesbelow 0.2 h-1, with the rate remaining essential-ly constant at ca. 0.25 ,umol h-1 (mg of pro-tein)-1 above this D value. Under lactose limita-tion, the exponential increase continued up to D= 0.4 h-1, declining somewhat above this Dvalue, and under phosphate limitation the expo-nential increase appeared to extend to the entirerange of D values tested. The highest rate ofsynthesis was observed at D = 0.4 h-1 under
02
21
21
U
o:l:D
1.3 0.13
1,I 0 11
0.9- 0.09
0.7 -0.07
0.5 _/ - 0.05
03 0.2 0.4 06 003
0s
-lJ
iQ)
-LJ
21
DILUTION RATE ('h-)
FIG. 1. Steady-state levels of total cyclic AMP in
culture at various D values under glucose (0), lactose(A), or phosphate (L) limitation. The values given are
for a steady-state cell biomass equivalent to 1 mg ofcell protein per ml of culture.
I.01F-
a:
2Icr-0wNU) -~en 4I -H0z _
U)a-n
( )CU
oC-U
-J
oC0
C)c
0.51
0.21
0.1
D.05j
1.02
0.01L
0
L 0.2 0.4 0.6 0.E
z
0.1 L
£E00.05 E
s-aD0I0
0.02 wwIH o
0.01 -
(na-E
0.005 <
uC-)
0.002 ii
0.0013
DILUTION RATE (hl)FIG. 2. Steady-state rates of cyclic AMP synthesis
at various D values under glucose (0), lactose (A). orphosphate (L1) limitation.
lactose limitation (0.5 pLmol hV1 [mg of pro-tein]-'), and this rate was twofold higher thanthe peak rate of synthesis under glucose limita-tion. Phosphate-limited cells had the lowest rateof synthesis, approximately 3 to 10% of the rateof carbon limited cultures at corresponding Dvalues.Energy requirement for cyclic AMP synthesis.
It was intriguing that under all growth conditionsexamined, almost all of the cyclic AMP synthe-sized was excreted into the medium. The pro-portion of the total available energy that thisexcretion represented was calculated for select-ed instances. It was assumed for these calcula-tions that oxidation of 1 mol of glucose generat-ed 26 mol of ATP (i.e., the organism possessedtwo proton translocating loops [7]) and thatsynthesis of a complete molecule of ATP (orcyclic AMP) from glucose required 14 mol ofATP (3).The specific rate of glucose consumption was
calculated from equation 2. At D = 0.2 h-1, thisvalue was 3.1 pLmol of glucose h-' (mg ofprotein)-'. Yield calculations showed that 44%of the carbon source was used in energy genera-tion under these conditions, the rest being as-similated; thus, 1.36 v.mol of glucose h-1 (mg ofprotein)-I was actually used in energy genera-tion. Consequently, ATP at this D value wasproduced at a rate of (1.36 x 26) = 35.36 pmol of
J. BACTERIOL.
on Novem
ber 28, 2018 by guesthttp://jb.asm
.org/D
ownloaded from

CYCLIC AMP CONTENT AT DIFFERENT GROWTH RATES 805
ATP h-1 (mg of protein)-1. The rate of netcyclic AMP synthesis (Fig. 2) under these condi-tions was 0.224 pLmol of cyclic AMP h-1 (mg ofprotein)-', which must have required (0.224 x14) = 3.14 ,umol of ATP h-1 (mg of protein)-'.Hence, approximately 9% of the total energyproduced was used for cyclic AMP synthesisunder these conditions. Similar calculationsshowed that at D = 0.05 h-1, under glucoselimitation, cyclic AMP synthesis consumed 5%of the total energy available to the cell and 8% atD = 0.4 h-1 under lactose limitation. The valuesrepresent only the energy demand for net cyclicAMP synthesis; depending on the extent towhich cyclic AMP phosphodiesterase was activeunder these conditions, the actual rate and con-sequently the energy demand for cyclic AMPsynthesis would be higher.
DISCUSSIONA major objective of this study was to deter-
mine the relationship between growth rate andcellular cyclic AMP levels in E. coli. However,the presence of an enormous background ofextracellular cyclic AMP under all conditionstested complicated these measurements. Wash-ing of the filters used in cellular cyclic AMPassays altered the results profoundly in waysthat depended on the antecedent D value of theculture and had to be abandoned. Instead, wecorrected the measured values for contaminat-ing extracellular cyclic AMP that remained onthe filter. Two findings indicate, however, thatthis method may not be reliable. First, we foundthat at D = 0.40 h-1 (lactose limitation) and 0.20h-1 (glucose limitation), where the extracellularcyclic AMP levels were very high (Table 2), theapplication of the correction gave zero or evenslightly negative values for cellular cyclic AMP.Second, Buettner et al. (2), who also omitted thewashing step in cellular cyclic AMP measure-ment, reported a much lower value for contami-nation by extracellular cyclic AMP. Their recon-stitution experiments, which involved the use ofan adenylate cyclase-negative mutant, showedthat the contaminating extracellular cyclic AMPconstituted no more than 2 to 3% of the cellularcyclic AMP on the filter. Yet, if our correctionmethod is applied to their data (Fig. 2, 200-minpoint), a contribution by extracellular cyclicAMP equal to some 55% of the cellular nucleo-tide would be indicated. Both of these consider-ations suggest that, for unknown reasons, thecorrection method used here leads to an under-estimation of cellular cyclic AMP levels.These uncertainties preclude firm conclusions
about cellular cyclic AMP levels. It seems clear,however, that changes in D do not elicit largeand systematic changes in cellular cyclic AMPlevels in E. coli. A similar conclusion was drawn
by Wright et al. (26) for this organism grownunder glucose or ammonium limitation. Theseworkers did wash the filters employed in cellularcyclic AMP measurements, but reported no con-trol studies on the effect of washing on thesemeasurements. For this reason and in the light ofour results, their findings should also be consid-ered tentative. We conclude that none of theavailable evidence permits unambiguous conclu-sions about the relationship between cellularcyclic AMP levels and growth rate in bacteria:the chemostat studies suffer from technical diffi-culties arising from the presence of a high back-ground of extracellular cyclic AMP, and thebatch culture studies are unsatisfactory becauseof insufficient control of several variables, asdiscussed above.Two conclusions appear certain, however: at
all growth rates and under all conditions tested,>99.9% of the cyclic AMP synthesized is ex-creted into the medium, and the net rate ofcyclic AMP synthesis increases with increasinggrowth rates, regardless of the nature of limita-tion. In this respect, our results confirm those ofWright et al. (26) and Harman and Botsford (5).The former showed excretion of a large amountof cyclic AMP by E. coli grown under glucose,succinate, or ammonium limitation, and the lat-ter showed increased synthesis rates of cyclicAMP in response to increasing D in a phosphodi-esterase-deficient mutant of Salmonella typhi-murium, although they found a linear relation-ship between this increase and the D valuewhich we did not find.The advantage to the organism of elevating
the rate of cyclic AMP synthesis in response toincreasing growth rate, when nearly all of thenucleotide synthesized was excreted into themedium, is not at all clear. This excretion con-sumed up to 9% of the total energy ration of the6ell and thus represented a substantial drain onits resources. When the selective pressures thatimperil the survival in nature of even a slightlywasteful organism (4, 27) are considered, it mustbe assumed that the excretion of cyclic AMP hasa salutary effect. What this effect may be re-mains entirely unknown. This excretion, espe-cially if it is symptomatic of excretion of othercompounds as well (8), also casts doubt on thevalidity of the Pirt method (20) for the calcula-tion of energy of maintenance and theoreticalmaximal growth yields. This method assumesthat all of the energy produced is coupled togrowth or maintenance processes and that theamount of energy not linked to growth processesis independent of growth rate. This is clearly nottrue for the energy consumed in cyclic AMPsynthesis: it can have neither a growth nor amaintenance function, nor does it appear to beconstant.
VOL. 149, 1982
on Novem
ber 28, 2018 by guesthttp://jb.asm
.org/D
ownloaded from
806 MATIN AND MATIN
Harman and Botsford (5) pointed out thattheir finding of a direct relationship between thecyclic AMP synthesis rate and culture D couldnot be explained solely on the basis of thecurrent view of the regulation of cyclic AMPsynthesis. This view holds that adenylate cy-clase is the main locus of this regulation and thatthe activity of this enzyme is inhibited by theuptake into the cells of carbon substrates, partic-ularly that of sugars of the phosphotransferasesystem (16, 18, 19). Such a mechanism wouldpredict enhanced synthesis rates of the nucleo-tide at low D values by carbon-limited cultures,i.e., the precise opposite of what was observed.They suggested that the specific activity of aden-ylate cyclase increases with the growth rate (5).If it is assumed that adenylate cyclase remainedthe primary locus of the regulation of cyclicAMP synthesis during nutrient-limited growth ofour wild-type strain, our results appear to beconsistent with this postulation. Experimentsare now in progress to determine whether aden-ylate cyclase levels decrease in carbon-limitedorganisms as they are grown at progressivelylower D values. If variation in the specificactivity of adenylate cyclase at different D val-ues is indeed the cause of the observed rates ofcyclic AMP synthesis, then our data show thatat very low growth rates (<0.3 h-1) glucose is abetter inducer of this enzyme than is lactose.The fact that phosphate-limited cultures ex-
hibited markedly depressed rates of cyclic AMPsynthesis compared with carbon-limited culturescould be interpreted as being consistent with theview that the phosphorylated form of enzyme Iof the phosphotransferase system stimulatesadenylate cyclase activity (16, 21). Phosphatelimitation forces the bacteria to dispense withnonessential phosphorylated metabolites fromcellular pools (23, 24). Since phosphorylatedenzyme I of phosphotransferase system has noevident role during growth on lactose, whichwas the carbon source employed, it is reason-able to assume that its pool levels would be lowunder phosphate limitation and to suspect thatthis accounted for the lower rates of cyclic AMPsynthesis under these conditions. However, analternate interpretation is that saturating levelsof the carbon substrate (lactose) present at all Dvalues under these conditions directly inhibitedadenylate cyclase activity. Studies are now inprogress to distinguish between these possibili-ties.
ACKNOWLEDGMENTSWe thank Brad Keith, John Weiss, and John Adams who, as
undergraduate research students, helped substantially in thecollection of these data.
This research was supported by grants from the AmericanCancer Society (suballocation of institutional grant IN-32Q toStanford University and special grant 875 to A.M.).
LITERATURE CITED
1. Bernlohr, R. W., M. K. Haddox, and N. D. Goldberg.1974. Cyclic guanosine 3' ,5'-monophosphate in Esche-richia coli and Bacilluis licheniformis. J. Biol. Chem.249:4329-4331.
2. Buettner, M. J., E. Spitz, and H. V. Rickenberg. 1973.Cyclic adenosine 3'.5'-monophosphate in Escherichiacoli. J. Bacteriol. 114:1068-1073.
3. Forrest, W. W., and D. J. Walker. 1971. The generationand utilization of energy during growth. Adv. Microb.Physiol. 5:213-274.
4. Harder, W., J. G. Kuenen, and A. Matin. 1977. Microbialselection in continuous culture. J. Appl. Bacteriol. 43:1-24.
5. Harman, J. G., and J. L. Botsford. 1979. Synthesis ofadenosine 3',5'-cyclic monophosphate in Salmonella ty-phimurium growing in continuous culture. J. Gen. Micro-biol. 110:243-246.
6. Harper, J. F., and G. Brooker. 1975. Femtomole sensitiveradioimmunoassay for cyclic AMP and cyclic GMP after2' 0 acetylation by acetic anhydride in aqueous solution.J. Cyclic Nucleotide Res. 1:207-218.
7. Jones, C. W. 1977. Aerobic respiratory systems in bacte-ria. Symp. Soc. Gen. Microbiol. 27:23-59.
8. Landwall, P., and T. Holme. 1977. Removal of inhibitorsof bacterial growth by dialysis culture. J. Gen. Microbiol.103:345-352.
9. Leefeldt, R. H., and A. Matin. 1980. Growth and physiolo-gy of Thiobacillus novellus under nutrient-limited mixo-trophic conditions. J. Bacteriol. 142:645-650.
10. Matin, A. Microbial regulatory mechanisms at low nutri-ent concentrations as studied in chemostat. Life Sci. Res.Rep. 13:323-339.
11. Matin, A., and J. C. Gottschal. 1976. Influence of dilutionrate on NAD(P) and NAD(P)H concentrations and ratiosin a Pseudomonas sp. grown in continuous culture. J.Gen. Microbiol. 94:333-341.
12. Matin, A., A. Grootjans, and H. Hogenhuis. 1976. Influ-ence of dilution rate on enzymes of intermediary metabo-lism in two fresh water bacteria grown in continuousculture. J. Gen. Microbiol. 94:323-332.
13. Otten, J., G. S. Johnson, and 1. Pastan. 1971. Cyclic AMPlevels in fibroblasts: relationship to growth rate andcontact inhibition of growth. Biochem. Biophys. Res.Commun. 44:1192-1198.
14. Pastan, I., and G. S. Johnson. 1974. Cyclic AMP in thetransformation of fibroblasts. Adv. Cancer Res. 19:303-329.
15. Pastan, I., G. S. Johnson, and W. B. Anderson. 1975. Roleof cyclic nucleotides in growth control. Annu. Rev.Biochem. 44:491-522.
16. Peterkofsky, A. 1978. Transmembrane signalling of Esc he-richia coli adenylate cyclase via a cascade reaction withsugar transport systems. Adv. Cyclic Nucleotide Res.9:611-619.
17. Peterkofsky, A., and C. Gazdar. 1971. Glucose and metab-olism of adenosine 3',5'-cyclic monophosphate in Esche-richia coli. Proc. Natl. Acad. Sci. U.S.A. 68:2794-2798.
18. Peterkofsky, A., and C. Gazdar. 1973. Measurements ofadenosine 3',5'-cyclic monophosphate in intact Esche-richia coli B. Proc. Natl. Acad. Sci. U.S.A. 70:2149-2152.
19. Peterkofsky, A., J. Harwood, and C. Gazdar. 1975. Induc-ibility of sugar sensitivity of adenylate cyclase of E. (oliB. J. Cyclic Nucleotide Res. 1:11-20.
20. Pirt, S. J. 1975. Principles of microbe and cell cultivation.p. 63-80. John Wiley & Sons, Inc., New York.
21. Saier, M. H., Jr. 1977. Bacterial phosphoenolpyru-vate:sugar phosphotransferase system: structural, func-tional, and evolutionary interrelationships. Bacteriol.Rev. 41:856-871.
22. Steiner, A. L., C. W. Parker, and D. M. Kipnis. 1972.Radioimmunoassay of cyclic nucleotides. J. Biol. Chem.274:1106-1113.
23. Tempest, D. W. 1970. The place of continuous culture in
J BACTE RIOL
on Novem
ber 28, 2018 by guesthttp://jb.asm
.org/D
ownloaded from
CYCLIC AMP CONTENT AT DIFFERENT GROWTH RATES 807
microbial research. Adv. Microb. Physiol. 4:223-250.24. Tempest, D. W., J. L. Meers, and C. M. Brown. 1970.
Influence of environment on the content and compositionof microbial free amino acid pools. J. Gen. Microbiol.64:171-185.
25. Winkler, H. H., and T. H. Wilson. 1966. The role ofenergy coupling in the transport of p-galactosides byEscherichia coli. J. Biol. Chem. 241:2200-2211.
26. Wright, L. F., D. P. Milne, and C. J. Knowles. 1979. Theregulatory effects of growth rate and cyclic AMP levels oncarbon catabolism and respiration in Escherichia coli K-12. Biochim. Biophys. Acta 583:73-80.
27. Zamenhoff, S., and H. H. Elchhorn. 1967. Study of micro-bial evolution through loss of biosynthetic functions:establishment of "defective" mutants. Nature (London)216:456-458.
VOL. 149, 1982
on Novem
ber 28, 2018 by guesthttp://jb.asm
.org/D
ownloaded from


![Excretion [2015]](https://static.fdocuments.net/doc/165x107/55d39c87bb61eb05278b46dd/excretion-2015-55d47f0693bf7.jpg)