Cell-surface protein-protein interaction analysis with ... · Cell-surface protein-protein...
12
Cell-surface protein-protein interaction analysis with time-resolved FRET and snap-tag technologies: application to GPCR oligomerization Maurel Damien 1 2 , Comps-Agrar Laetitia 1 , Brock Carsten 1 , Rives Marie-Laure 1 , Bourrier Emmanuel 2 , Ayoub Mohammed Akli 1 , Bazin Hervé 2 , Tinel Norbert 2 , Durroux Thierry 1 , Pr zeau é Laurent 1 , Trinquet Eric 2 , Pin Jean-Philippe 1* IGF, Institut de g nomique fonctionnelle 1 é CNRS : UMR5203, INSERM : U661, Universit Montpellier I é , Universit Montpellier II - Sciences et é Techniques du Languedoc, 141, Rue de la Cardonille 34094 MONTPELLIER CEDEX 5,FR Cis Bio International 2 Cis Bio International, Site de Marcoule 30204 Bagnols sur Ceze Cedex,FR * Correspondence should be adressed to: Jean-Philippe Pin <[email protected]> Abstract Cell surface proteins play key roles in cell-cell communication. They assemble into hetero-complexes that include different receptors and effectors. Demonstrating and manipulating such protein complexes will certainly offer new ways for new therapeutics. Here we developed reagents to quantitatively analyze in a high throughput format protein-protein interaction at the surface of living cells. Using this approach we examined whether G-protein coupled receptors (GPCRs) are monomers or assemble into dimers or larger oligomers, a matter of intense debates. We bring new evidence for the oligomeric state of both class A and class C GPCRs. We also report a different quaternary structure of the GPCRs for the two major neurotransmitters. Whereas metabotropic glutamate receptors assemble into strict dimers, the GABA receptor spontaneously form dimers of heterodimers offering a way to modulate G-protein coupling efficacy. This B approach will be useful to systematically analyze the dynamics of cell surface protein complexes in living cells. MESH Keywords Animals ; Biophysics ; methods ; COS Cells ; Cell Membrane ; metabolism ; Cercopithecus aethiops ; Dimerization ; Fluorescence Resonance Energy Transfer ; methods ; Humans ; Models, Biological ; Protein Interaction Mapping ; methods ; Protein Structure, Quaternary ; Receptors, G-Protein-Coupled ; metabolism ; Receptors, GABA-B ; chemistry ; Surface Properties ; gamma-Aminobutyric Acid Author Keywords GPCR ; Biophysique ; FRET ; Dimerization ; GABA Cell-cell communication involves cell surface proteins such as receptors, cell adhesion molecules, channels and transporters. Among these proteins, the G-protein-coupled receptors (GPCRs) form the largest family of membrane signaling molecules and represent the major target for drug development . Although these 7 transmembrane helix proteins can activate heterotrimeric G proteins in a monomeric form , much 1 2–5 interest arise from their possible assembly into larger complexes , . GPCRs may not only oligomerize, but also associate with other membrane 67 proteins such as channels, enzymes, other receptor types and transporters. Such complexes are proposed to allow faster signaling, specific cross-talks, or specific responses. However, such organization of GPCRs remains a matter of intense debate , . Even if such oligomers 38–10 exist, their stoichiometry - i.e. dimers versus higher-order oligomers - is not known. Today resonance energy transfer (RET) technologies are widely used to validate the proximity between proteins in living cells , . These 11 12 approaches are based on the fusion of FRET compatible GFP variants, or Luciferase and GFP for bioluminescence RET (BRET). However, the fusion proteins are often over-expressed in transfected cells such that FRET can occur within intracellular compartments where proteins accumulate, making difficult the demonstration that RET results from a direct interaction of the proteins at the cell surface. To overcome this problem, few studies took advantage of the use of antibodies carrying fluorophores to specifically label surface proteins , . Another 13 14 limitation of the commonly used RET techniques is the low signal to noise ratio due to the overlap between the emission spectra of donors and acceptors, and intrinsic fluorescence of the cells. Time-resolved FRET (TR-FRET) approach based on the use of europium cryptate as donors, and alexafluor647 or d2 as acceptors, offers a much higher signal to noise ratio for two main reasons. First, the long life-time of the europium allows the measurement of FRET emission when all natural fluorophores are switched off ( ), and second, this donor fluorophore 15 supp Fig. Aa has a very limited emission at 665nm where the acceptor emission is measured ( ). Association of TR-FRET with antibodies has 15 supp Fig. Ab therefore been used to validate the existence of GPCR oligomers at the surface of living cells , , . However, the bivalent nature of 13 14 16 antibodies could well stabilize large complexes. Moreover, the size (150 kDa, 160 in length) ( ) and multiple labeling of these proteins Å Fig. 1a can easily increase FRET resulting from random collision. Here we used the newly developed snap-tag technology to specifically label surface proteins with TR-FRET compatible fluorophores , . 17 18 Snap-tag derives from the O -guanine nucleotide alkyltransferase that covalently reacts with benzyl-guanines (BG) ( ). This tag, two third 6 Fig 1b the size of GFP ( ), can be specifically and covalently labeled with any fluorophore carried by the benzyl-group of BG. By generating Fig 1a non-permeant BG derivatives compatible with TR-FRET measurement, we confirm here the oligomeric assembly of both class A and class C GPCRs. Using an optimized quality control system that allows the specific labeling of a single subunit in a dimer, we show moreover that the
-
Upload
trinhhuong -
Category
Documents
-
view
221 -
download
0
Transcript of Cell-surface protein-protein interaction analysis with ... · Cell-surface protein-protein...

Cell-surface protein-protein interaction analysis with time-resolved FRET andsnap-tag technologies: application to GPCR oligomerization
Maurel Damien 1 2 , Comps-Agrar Laetitia 1 , Brock Carsten 1 , Rives Marie-Laure 1 , Bourrier Emmanuel 2 , Ayoub Mohammed Akli 1 , Bazin Hervé 2 , Tinel Norbert 2 , Durroux Thierry 1 , Pr zeaué Laurent 1 , Trinquet Eric 2 , Pin Jean-Philippe 1 *
IGF, Institut de g nomique fonctionnelle 1 é CNRS : UMR5203, INSERM : U661, Universit Montpellier Ié , Universit Montpellier II - Sciences eté Techniques du Languedoc, 141, Rue de la Cardonille 34094 MONTPELLIER CEDEX 5,FR
Cis Bio International 2 Cis Bio International, Site de Marcoule 30204 Bagnols sur Ceze Cedex,FR * Correspondence should be adressed to: Jean-Philippe Pin <[email protected]>
Abstract
Cell surface proteins play key roles in cell-cell communication. They assemble into hetero-complexes that include different receptors and
effectors. Demonstrating and manipulating such protein complexes will certainly offer new ways for new therapeutics. Here we developed
reagents to quantitatively analyze in a high throughput format protein-protein interaction at the surface of living cells. Using this
approach we examined whether G-protein coupled receptors (GPCRs) are monomers or assemble into dimers or larger oligomers, a
matter of intense debates. We bring new evidence for the oligomeric state of both class A and class C GPCRs. We also report a different
quaternary structure of the GPCRs for the two major neurotransmitters. Whereas metabotropic glutamate receptors assemble into strict
dimers, the GABA receptor spontaneously form dimers of heterodimers offering a way to modulate G-protein coupling efficacy. ThisB
approach will be useful to systematically analyze the dynamics of cell surface protein complexes in living cells.
MESH Keywords Animals ; Biophysics ; methods ; COS Cells ; Cell Membrane ; metabolism ; Cercopithecus aethiops ; Dimerization ; Fluorescence Resonance Energy
Transfer ; methods ; Humans ; Models, Biological ; Protein Interaction Mapping ; methods ; Protein Structure, Quaternary ; Receptors, G-Protein-Coupled ; metabolism ; Receptors,
GABA-B ; chemistry ; Surface Properties ; gamma-Aminobutyric Acid
Author Keywords GPCR ; Biophysique ; FRET ; Dimerization ; GABA
Cell-cell communication involves cell surface proteins such as receptors, cell adhesion molecules, channels and transporters. Among these
proteins, the G-protein-coupled receptors (GPCRs) form the largest family of membrane signaling molecules and represent the major target for
drug development . Although these 7 transmembrane helix proteins can activate heterotrimeric G proteins in a monomeric form , much1 2–5
interest arise from their possible assembly into larger complexes , . GPCRs may not only oligomerize, but also associate with other membrane6 7
proteins such as channels, enzymes, other receptor types and transporters. Such complexes are proposed to allow faster signaling, specific
cross-talks, or specific responses. However, such organization of GPCRs remains a matter of intense debate , . Even if such oligomers3 8–10
exist, their stoichiometry - i.e. dimers versus higher-order oligomers - is not known.
Today resonance energy transfer (RET) technologies are widely used to validate the proximity between proteins in living cells , . These11 12
approaches are based on the fusion of FRET compatible GFP variants, or Luciferase and GFP for bioluminescence RET (BRET). However, the
fusion proteins are often over-expressed in transfected cells such that FRET can occur within intracellular compartments where proteins
accumulate, making difficult the demonstration that RET results from a direct interaction of the proteins at the cell surface. To overcome this
problem, few studies took advantage of the use of antibodies carrying fluorophores to specifically label surface proteins , . Another13 14
limitation of the commonly used RET techniques is the low signal to noise ratio due to the overlap between the emission spectra of donors and
acceptors, and intrinsic fluorescence of the cells. Time-resolved FRET (TR-FRET) approach based on the use of europium cryptate as donors,
and alexafluor647 or d2 as acceptors, offers a much higher signal to noise ratio for two main reasons. First, the long life-time of the europium
allows the measurement of FRET emission when all natural fluorophores are switched off ( ), and second, this donor fluorophore15 supp Fig. Aa
has a very limited emission at 665nm where the acceptor emission is measured ( ). Association of TR-FRET with antibodies has15 supp Fig. Ab
therefore been used to validate the existence of GPCR oligomers at the surface of living cells , , . However, the bivalent nature of13 14 16
antibodies could well stabilize large complexes. Moreover, the size (150 kDa, 160 in length) ( ) and multiple labeling of these proteinsÅ Fig. 1a
can easily increase FRET resulting from random collision.
Here we used the newly developed snap-tag technology to specifically label surface proteins with TR-FRET compatible fluorophores , .17 18
Snap-tag derives from the O -guanine nucleotide alkyltransferase that covalently reacts with benzyl-guanines (BG) ( ). This tag, two third6 Fig 1b
the size of GFP ( ), can be specifically and covalently labeled with any fluorophore carried by the benzyl-group of BG. By generatingFig 1a
non-permeant BG derivatives compatible with TR-FRET measurement, we confirm here the oligomeric assembly of both class A and class C
GPCRs. Using an optimized quality control system that allows the specific labeling of a single subunit in a dimer, we show moreover that the

metabotropic glutamate (mGlu) receptors assemble into strict dimers, whereas the GABA receptors can form dimers of dimers. This approachB
will be useful to rapidly and quantitatively analyze in a high throughput format other cell surface signaling complexes in living cells allowing
the rapid identification of molecules, antibodies or other protein partners affecting these complexes.
RESULTSLabeling of surface receptors with TR-FRET compatible fluorophores
Among the large GPCR family, receptors activated by GABA (the GABA receptors) are composed of two distinct subunits, GABAB B1
where agonists bind and GABA that activates G-proteins ( ). Of note, GABA possesses an intracellular retention sequence in itsB2 19 Fig. 1a B1
C-terminal tail that prevents it from reaching the cell surface, unless associated with GABA through a coiled coil interaction of theirB2
C-terminal tails , . These receptors constitute therefore a excellent model to test new approaches to quantify protein-protein interactions at20 21
the cell surface.
A snap-tag was introduced at the N-terminal end of GABA subunits. Both fusion proteins were correctly expressed and showed noB
alteration of their functional properties ( ). We next prepared BG derivatives carrying either an europium cryptate (BG-K) (supp Fig. B supp
), or the acceptor d2 (BG-d2) on the benzyl group. A clear specific labeling can be detected with these BG derivativesmaterials and supp Fig. C
when ST-GABA is at the cell surface after co-expression with GABA , or when its intracellular retention signal is mutated ( ). InB1 B2 Fig. 1c e–
contrast, no specific labeling could be observed in cells expressing ST-GABA alone ( ), unless cells are permeabilized. Similar dataB1 Fig. 1d
were obtained with the intracellular protein God fused to ST ( ). Fluorescence imaging also confirmed that only the cell surfaceFig. 1d
ST-proteins are labeled ( ). Specific bound fluorescence was used to estimate the number of snap-tags labeled under these conditions. ByFig. 1e
comparing these values with the total amount of binding sites at the cell surface, we found that both BG derivatives label all surface receptors
over a wide range of receptor expression ( ).Fig. 1f
Detection of cell surface GABA heteromers with combined snap-tags and TR-FRETB
The ST-fusion versions of GABA and GABA when then used to examine whether ST could be used to detect protein-proteinB1 B2
interaction at the cell surface. Large TR-FRET signals could be measured in cells expressing ST-GABA and flag-GABA after labeling withB1 B2
BG-K and anti-flag antibodies carrying the d2 acceptor ( ). The same was obtained with the BG-d2 and an anti-flag labeled with theFig. 2a
europium-cryptate, demonstrating that TR-FRET can be used to monitor protein-protein interactions with snap-tag fusion proteins. The
simplicity of the approach allowed us to examine the possible interaction of the flag-tagged GABA receptor with a number of other cellB
surface snap-tag fusions ( ). In most cases, no significant TR-FRET signals were measured ( ) despite a similar expression of allFig. 2b Fig. 2b
constructs, demonstrating the specificity of this assay (data not shown).
To avoid the use of antibodies, we also show that GABA heteromers can be detected in cells expressing ST-GABA and ST-GABAB B1 B2
after double labeling the cells with both BG-K and BG-d2. In that case, conditions were defined to make sure of the equivalent labeling of the
snap-tags with either fluorophores. To that aim, a sub-optimal concentration of BG-K was used (5 M) with an increasing concentration ofμBG-d2, and the optimal ratio of both BG concentrations was determined as that giving rise to maximal TR-FRET ( ). Of note, this signalFig. 2c
measured as the specific emission at 665 nm, was directly proportional to the amount of receptors at the cell surface ( ). Under theseFig. 2d
conditions, the TR-FRET efficacy can be defined as the ratio between the acceptor emission, and the amount of donor fluorophores linked to
the receptor. Of interest, the TR-FRET efficacy is constant over a wide range of receptor density at the cell surface ( ), demonstrating thatFig. 2e
this FRET signal does not result from random collision of the labeled proteins, but from their physical interaction.
Oligomeric state of other GPCRs and other cell surface proteins
Although class C GPCRs are well recognized as stable dimers, the possible oligomeric state of class A GPCRs is still a matter of intense
debate , . Using N-terminal snap-tag versions of several GPCRs including V2 and Via vasopressin, 2-adrenergic, A1 adenosine, thrombin8 9 βreceptor (protease activated receptor 1), as well as the class B GPCR for PACAP and CD4, a membrane receptor with a single TM also known
to form dimers, we show here that large FRET signals can be measured, in the same range in terms of efficacy to that observed between both
subunits of the GABA dimer ( ). The 2 3 fold variations observed in the FRET efficacy depending on the receptor being studied isB Fig. 3a,b –
compatible with distance variations between the fluorophores due to the snap-tag fusion to the N-terminus of the receptors (see , forsupp. Fig. F
the relation between distances and FRET efficacy). However, we cannot exclude the possibility that for the receptors showing a lower FRET
intensity, that only a fraction of the receptors are associated in homodimers. However, because of the linear relationship between the TR-FRET
intensity and the amount of receptors at the cell surface ( and data not shown), the proportion of homodimers is likely constant over theFig. 3a
range of expression level examined. These data further demonstrate that GPCR can form dimers at the cell surface that can be easily detected
with this approach.
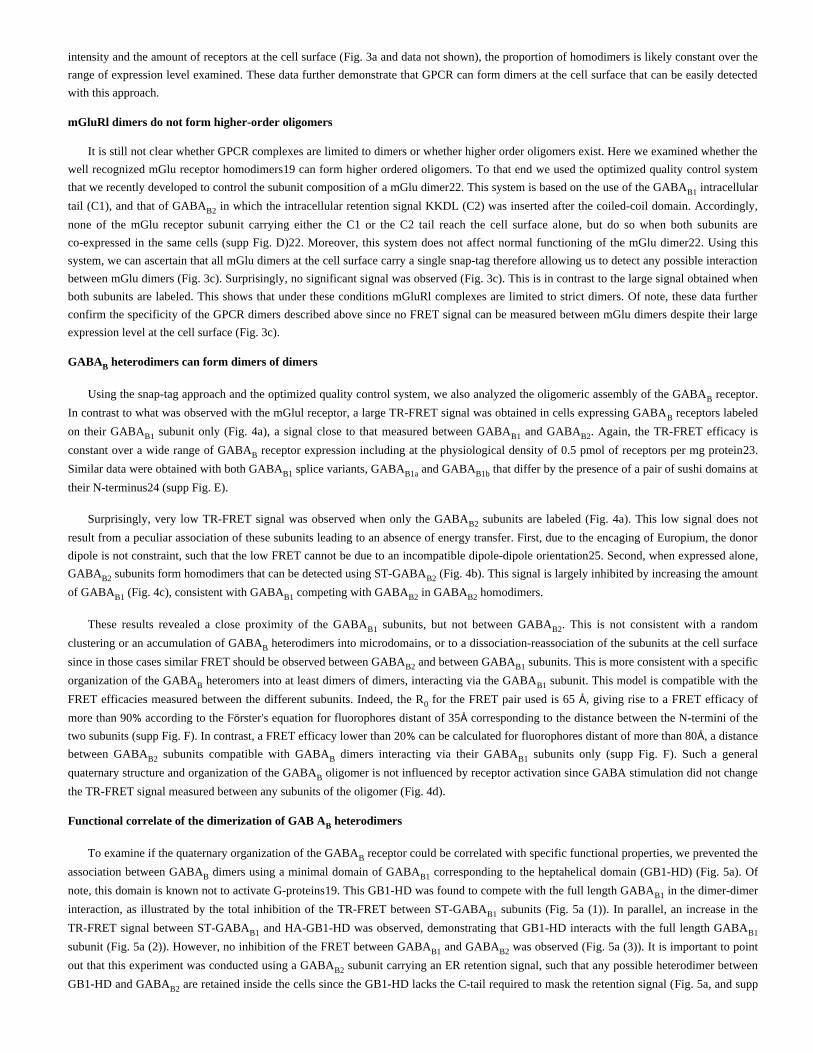
mGluRl dimers do not form higher-order oligomers
It is still not clear whether GPCR complexes are limited to dimers or whether higher order oligomers exist. Here we examined whether the
well recognized mGlu receptor homodimers can form higher ordered oligomers. To that end we used the optimized quality control system19
that we recently developed to control the subunit composition of a mGlu dimer . This system is based on the use of the GABA intracellular22 B1
tail (C1), and that of GABA in which the intracellular retention signal KKDL (C2) was inserted after the coiled-coil domain. Accordingly,B2
none of the mGlu receptor subunit carrying either the C1 or the C2 tail reach the cell surface alone, but do so when both subunits are
co-expressed in the same cells ( ) . Moreover, this system does not affect normal functioning of the mGlu dimer . Using thissupp Fig. D 22 22
system, we can ascertain that all mGlu dimers at the cell surface carry a single snap-tag therefore allowing us to detect any possible interaction
between mGlu dimers ( ). Surprisingly, no significant signal was observed ( ). This is in contrast to the large signal obtained whenFig. 3c Fig. 3c
both subunits are labeled. This shows that under these conditions mGluRl complexes are limited to strict dimers. Of note, these data further
confirm the specificity of the GPCR dimers described above since no FRET signal can be measured between mGlu dimers despite their large
expression level at the cell surface ( ).Fig. 3c
GABA heterodimers can form dimers of dimersB
Using the snap-tag approach and the optimized quality control system, we also analyzed the oligomeric assembly of the GABA receptor.B
In contrast to what was observed with the mGlul receptor, a large TR-FRET signal was obtained in cells expressing GABA receptors labeledB
on their GABA subunit only ( ), a signal close to that measured between GABA and GABA . Again, the TR-FRET efficacy isB1 Fig. 4a B1 B2
constant over a wide range of GABA receptor expression including at the physiological density of 0.5 pmol of receptors per mg protein .B 23
Similar data were obtained with both GABA splice variants, GABA and GABA that differ by the presence of a pair of sushi domains atB1 B1a B1b
their N-terminus ( ).24 supp Fig. E
Surprisingly, very low TR-FRET signal was observed when only the GABA subunits are labeled ( ). This low signal does notB2 Fig. 4a
result from a peculiar association of these subunits leading to an absence of energy transfer. First, due to the encaging of Europium, the donor
dipole is not constraint, such that the low FRET cannot be due to an incompatible dipole-dipole orientation . Second, when expressed alone,25
GABA subunits form homodimers that can be detected using ST-GABA ( ). This signal is largely inhibited by increasing the amountB2 B2 Fig. 4b
of GABA ( ), consistent with GABA competing with GABA in GABA homodimers.B1 Fig. 4c B1 B2 B2
These results revealed a close proximity of the GABA subunits, but not between GABA . This is not consistent with a randomB1 B2
clustering or an accumulation of GABA heterodimers into microdomains, or to a dissociation-reassociation of the subunits at the cell surfaceB
since in those cases similar FRET should be observed between GABA and between GABA subunits. This is more consistent with a specificB2 B1
organization of the GABA heteromers into at least dimers of dimers, interacting via the GABA subunit. This model is compatible with theB B1
FRET efficacies measured between the different subunits. Indeed, the R for the FRET pair used is 65 , giving rise to a FRET efficacy of0 Å
more than 90 according to the F rster s equation for fluorophores distant of 35 corresponding to the distance between the N-termini of the% ö ’ Åtwo subunits ( ). In contrast, a FRET efficacy lower than 20 can be calculated for fluorophores distant of more than 80 , a distancesupp Fig. F % Åbetween GABA subunits compatible with GABA dimers interacting via their GABA subunits only ( ). Such a generalB2 B B1 supp Fig. F
quaternary structure and organization of the GABA oligomer is not influenced by receptor activation since GABA stimulation did not changeB
the TR-FRET signal measured between any subunits of the oligomer ( ).Fig. 4d
Functional correlate of the dimerization of GAB A heterodimersB
To examine if the quaternary organization of the GABA receptor could be correlated with specific functional properties, we prevented theB
association between GABA dimers using a minimal domain of GABA corresponding to the heptahelical domain (GB1-HD) ( ). OfB B1 Fig. 5a
note, this domain is known not to activate G-proteins . This GB1-HD was found to compete with the full length GABA in the dimer-dimer19 B1
interaction, as illustrated by the total inhibition of the TR-FRET between ST-GABA subunits ( (1)). In parallel, an increase in theB1 Fig. 5a
TR-FRET signal between ST-GABA and HA-GB1-HD was observed, demonstrating that GB1-HD interacts with the full length GABAB1 B1
subunit ( (2)). However, no inhibition of the FRET between GABA and GABA was observed ( (3)). It is important to pointFig. 5a B1 B2 Fig. 5a
out that this experiment was conducted using a GABA subunit carrying an ER retention signal, such that any possible heterodimer betweenB2
GB1-HD and GABA are retained inside the cells since the GB1-HD lacks the C-tail required to mask the retention signal ( , and B2 Fig. 5a supp

). The absence of clear competition between full-length GABA and GB1-HD for interaction with GABA was expected because theFig. G B1 B2
GABA heterodimer is strongly stabilized by i) the coiled-coil interaction of the C-terminal tails and ii) the direct interaction of the largeB
extracellular domains , two contacts being absent in a GABA -GB1-HD dimer.19 B2
Under these conditions, when most dimers of GABA heterodimers were dissociated ( ), and even though the same amount of the GB Fig. 5b
protein-activating subunit GABA were found at the cell surface (data not shown), maximal agonist-mediated response was twice thatB2
measured under control condition ( ). No such effect was observed after over-expression of CD4 that did not inhibit the associationFig. 5b
between GABA dimers ( and data not shown). This brings a functional correlate to the quaternary structure of this GABA receptor andB Fig. 5b
suggests that the association of GABA dimers into dimers of dimers offers a way to modulate G-protein coupling efficacy.B
DISCUSSION
Here, we presented a new approach to analyze protein-protein interaction at the cell surface based on a combination of TR-FRET and
snap-tag technologies. We validated this approach using well recognized GPCR dimers, the GABA and mGlu1 receptors, and confirm thatB
both class A and B receptors also form dimers or larger oligomers at the cell surface. When associated with a quality control system allowing
the labeling of a single subunit, we show that whereas only strict dimers of mGluR1 could be observed, the GABA receptor assembles into atB
least dimers of dimers.
Although FRET and BRET have been widely used to analyze the oligomeric state of membrane proteins, the low signal to noise ratio made
difficult the use of such techniques in screening assays. Moreover, it was still difficult to prove that the signals obtained originate from the cell
surface. Indeed, even though a nice and saturable BRET signal could be measured between GABA in the presence of GABA ( ),B1 B2 supp Fig. H
we could not exclude that this signal originate from intracellular GABA homodimers . Although, imaging techniques and total internalB1 26
reflection fluorescence microscopy can be used to examine FRET at the plasma membrane, such approaches are not compatible with systematic
and quantitative assessments of the interaction. In contrast, the TR-FRET snap-tag technology, by allowing an easy assessment of the protein
proximity at the cell surface enables a clear demonstration of the specificity of the interaction. Indeed, the assay was conducted in 96 well
plates, and can easily be adapted to 384 plates as many other TR-FRET cellular assays. Of note, a very low emission of the acceptor is
observed when non-interacting proteins are being studied, showing that even with over-expressed proteins, very low FRET occurs due to
random collision at the cell surface. This suggests that the high non-specific by slander FRET or BRET measured with GFP or Rluc fused“ ”membrane proteins likely originate from the intracellular proteins.
Within the last 10 years, a large number of studies reported that GPCRs can form oligomers, but it was still not known whether such
complexes were limited to dimers or whether higher-order oligomers could form , , . By taking advantage of an optimized quality control6 7 27
system, we show here that mGlul dimers cannot on their own self associate, demonstrating that a dimeric organization of these receptors is
sufficient for function. One of course cannot exclude the possibility that, in their native environment, these mGlu dimers can associate into
larger complexes through interaction with scaffolding proteins. To our surprise however, we found that the GABA receptor heterodimer canB
form larger oligomers through GABA interaction. Because no close proximity between GABA subunits was observed, it is likely that theseB1 B2
oligomers are limited to dimers of dimers. Accordingly, as for any other GPCR homodimer such a quaternary organization of the GABAB
receptor possesses two agonists binding sites, and two possible G-protein coupling domains. Importantly, this organization of the GABAB
receptor can be observed over a wide range of receptor density at the cell surface, including that reported for this receptor in the brain . Since23
the receptor density is expected to be even higher in the specific micro domains where this receptor is targeted in neurons (dendritic spines and
pre-synaptic terminals), this makes likely that what is observed here in transfected cells can also occur unless specific interactingin vivo,
proteins absent in HEK or COS cells prevent this.
By preventing GABA heterodimers to associate, using a minimal domain of GABA , we also provide a functional evidence in favor ofB B1
the dimer of dimer organization of the GABA receptor. Our data are consistent with a lower G protein-coupling efficacy of the GABAB B
receptor when associated into dimers of dimers. Of interest, such a dimerization of the GABA heterodimer reproduces what has been recentlyB
shown for GPCR homodimers. Indeed, in GPCR homodimers, a single subunit can activate a G-protein at a time , . Since GPCR2 28–30
monomers can effectively activate G-proteins , then two separated monomers are expected to activate more G-proteins than a homodimer.2–5
This has been recently demonstrated for both rhodopsin and the neurotensinl receptor . Such a process could be a way to modulate coupling2 30
efficacy or to allow simultaneous coupling to both G protein-dependent and G protein-independent pathways, but more work isin vivo,
required to validate this proposal.
In conclusion, we showed here that the combined use of snap-tag and TR-FRET allows a rapid, easy and quantitative assessment of cell
surface protein interactions. This approach confirmed the oligomeric assembly of GPCRs at the cell surface and allowed us to analyze the

stoichiometry of class C GPCR oligomers. This technology will certainly be useful to study the dynamics of any cell surface protein
complexes, and to identify drugs that modulate these.
MethodsPlasmids and site-directed mutagenesis
Plasmids encoding the wild-type GABA , GABA and mGlul subunits epitope-tagged at their N-terminus with HA and Flag after theB1 B2
signal peptide of the mGlu5 receptor were described previously . SNAP-tag sequence (obtained from the pSST26m plasmid from Covalys,16
Geneva, Switzerland) was subcloned in these plasmids at the level a unique Mlul restriction site located in the linker downstream of the HA or
flag tag. The upstream Mlu-I site was then mutated to conserve a unique Mlu-I site between the SNAP-tag and the GABA coding sequence.B
These plasmides were then used to introduce the coding sequence of various membrane proteins in phase with the snap-tag, these include the
coding sequences of mGlul, V2 and V1a vasopressin, 2-adrenergic, Al adenosine, PACAP, protease-activating 1 (thrombin receptor), andβprolactine receptors and that of CD4. The HA-GB1-HD truncated construct was made after insertion of a second Mlu-I site at the level of
codons for residues 5774 in the HA-GABAB1 sequence. The fragment between the two Mlu-I sites was then removed, and a stop codon was
introduced at position 875 using a Quick-Change strategy (Stratagene).®
Cell culture and transfection
HEK-293 or COS-7 cells were cultured in Dulbecco s modified Eagle s medium supplemented with 10 FCS and transfected by’ ’ %electroporation as described previously . Culture medium, PCS, and other products used for cell culture were purchased from14
GIBCO/BRL/Life Technologies (Cergy Pontoise, France). Ten million cells were transfected with plasmid DNA expressing the proteins of
interest as indicated in the figures and completed to a total amount of 10 g plasmid DNA with pRK5 empty vector.μ
ELISA assay for quantification of cell surface expression
Cells were fixed with 4 paraformaldehyde and then blocked with phosphate-buffered saline 1 fetal calf serum. After a 30 min% + %incubation, the anti-HA monoclonal antibody (clone 3F10, Roche Bioscience, Basel, Switzerland) or anti-Flag-M2 monoclonal antibody
(Sigma-Aldrich, St. Louis, MO, USA), both conjugated with horseradish peroxidase, was applied for 30 min at 0.5 mg/1 and cells were
washed. Bound antibody was detected by chemoluminescence using SuperSignal substrate (Pierce, Rockford, IL, USA) and a Wallac Victor2
counter (Molecular Devices, Sunnyvale, CA, USA). Validation of this assay has already been reported , .16 29
Intracellular calcium measurements
Twenty-four hours after transfection with plasmids encoding the indicated GABA subunits and a chimeric protein Gqi9, HEK-293 cellsB
were washed with HBSS buffer (20 mM Hepes, 1 mM MgSO , 3,3 mM Na CO , 1,3 mM CaCl , 0,1 BSA, 2,5 mM probenecid) and loaded4 2 3 2 %
with 1 M Ca -sensitive fluorescent dye Fluo-4 a.m. (Molecular Probes, Eugene, OR, USA) for 1 h at 37 C. After a wash, cells wereμ 2+ °incubated with 50 l of buffer and 50 l of 2X-GABA solution at various concentrations was added after 20 s of recording. Fluorescenceμ μsignals (excitation 485 nm, emission 525 nm) were measured by using the fluorescence microplate reader Flexstation (Molecular Devices,
Sunnyvale, CA, USA) at sampling intervals of 1.5 s for 60 s. Data were analyzed with the program Soft Max Pro (Molecular Devices,
Sunnyvale, CA, USA). Dose-response curves were fitted using Prism (GraphPad software, San Diego, CA, USA).
Confocal imaging
HEK-293 cells were transfected with the indicated plasmids as described above. Snap-tag labeling was performed with 1 M BG-d2.μCoverslips were mounted with Gel/Mount (Biomeda, Foster City, CA). Confocal imaging was performed with a Plan-Apochromat 63 /1.4 oil×objective and Immersol 518F (Carl Zeiss, Jena, Germany). GFP was excited at 488 nm and detected through a 505 530 nm band pass filter.–d2 was excited at 633 nm and detected through a 650 nm long pass filter. Pinholes were adjusted to yield optical slices of < 0.5 nm.
Binding assay
Cells were incubated with increasing concentrations of radioactive tracer (0.48 nM to 10 nM of H -CGP54626, a radioactive antagonist of[3 ]GABA receptor) for 4 hours at 4 C. For each concentrations of tracer, non specific binding was determined by addition of GABA (1mM).B °
After incubation, cells were washed with Tris-KREBS buffer (20 mM Tris pH 7.4, 118 mM NaCl, 5.6 mM glucose, 1.2 mM KH PO , 1.2 mM2 4
MgSO , 4,7 mM KC1, 1.8 mM CaCl ) in order to eliminate the excess of free radioactive ligand. Cells were then lysed using NaOH at 0.1 M4 2
for 10 min and transfered in flasks containing scintillant (OptiPhase Supermix, Perkin Elmer). Radioactivity was counted on a Beta counter
Cobra (Hewlett Packard). Fitting parameters for saturation experiments were determined using a non-linear curve-fitting routine to the Hill
equation B Bmax L /( L Kd) where Bmax is the maximal binding, L is the concentration of labeled ligand and Kd the equilibrium= [ ] [ ] +dissociation constant for the labeled ligand.
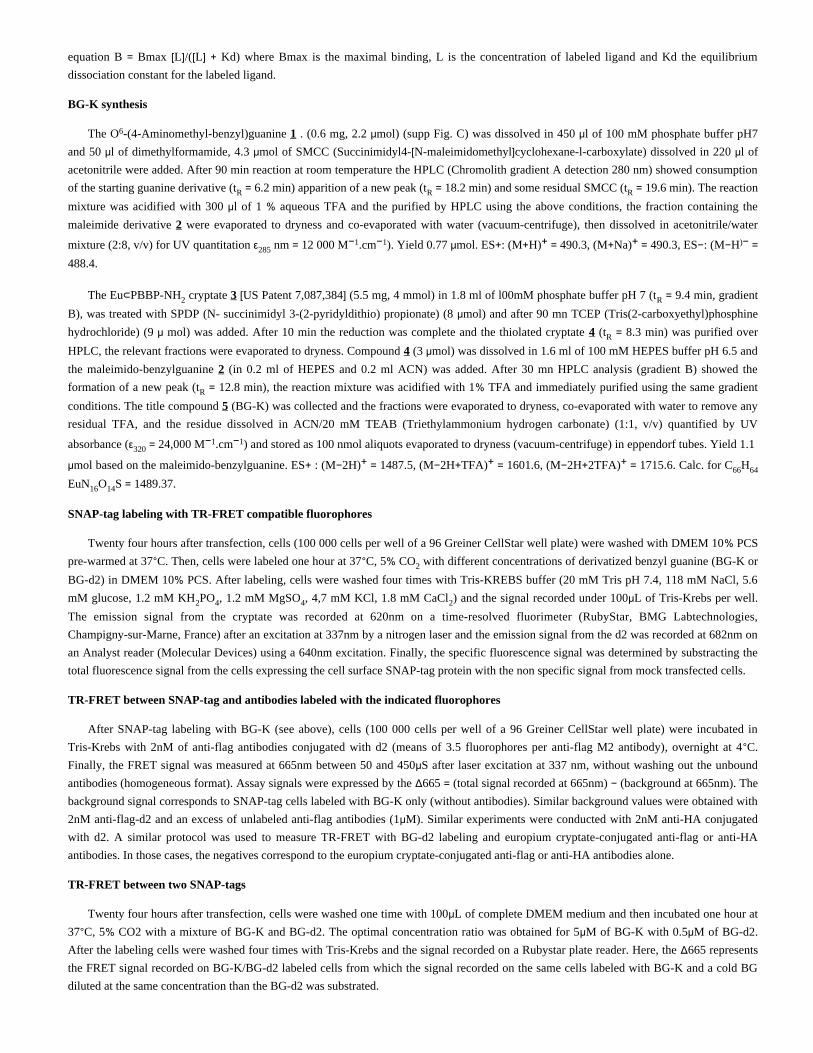
BG-K synthesis
The O -(4-Aminomethyl-benzyl)guanine . (0.6 mg, 2.2 mol) ( ) was dissolved in 450 l of 100 mM phosphate buffer pH76 1 μ supp Fig. C μand 50 l of dimethylformamide, 4.3 mol of SMCC (Succinimidyl4- N-maleimidomethyl cyclohexane-l-carboxylate) dissolved in 220 l ofμ μ [ ] μacetonitrile were added. After 90 min reaction at room temperature the HPLC (Chromolith gradient A detection 280 nm) showed consumption
of the starting guanine derivative (t 6.2 min) apparition of a new peak (t 18.2 min) and some residual SMCC (t 19.6 min). The reactionR = R = R =
mixture was acidified with 300 l of 1 aqueous TFA and the purified by HPLC using the above conditions, the fraction containing theμ %maleimide derivative were evaporated to dryness and co-evaporated with water (vacuum-centrifuge), then dissolved in acetonitrile/water 2
mixture (2:8, v/v) for UV quantitation nm 12 000 M .cm ). Yield 0.77 mol. ES : (M H) 490.3, (M Na) 490.3, ES : (M H ε285 = 1− 1− μ + + + = + + = − − )− =
488.4.
The Eu PBBP-NH cryptate US Patent 7,087,384 (5.5 mg, 4 mmol) in 1.8 ml of l00mM phosphate buffer pH 7 (t 9.4 min, gradient⊂ 2 3 [ ] R =
B), was treated with SPDP (N- succinimidyl 3-(2-pyridyldithio) propionate) (8 mol) and after 90 mn TCEP (Tris(2-carboxyethyl)phosphineμhydrochloride) (9 mol) was added. After 10 min the reduction was complete and the thiolated cryptate (t 8.3 min) was purified overμ 4 R =
HPLC, the relevant fractions were evaporated to dryness. Compound (3 mol) was dissolved in 1.6 ml of 100 mM HEPES buffer pH 6.5 and 4 μthe maleimido-benzylguanine (in 0.2 ml of HEPES and 0.2 ml ACN) was added. After 30 mn HPLC analysis (gradient B) showed the 2
formation of a new peak (t 12.8 min), the reaction mixture was acidified with 1 TFA and immediately purified using the same gradientR = %
conditions. The title compound (BG-K) was collected and the fractions were evaporated to dryness, co-evaporated with water to remove any 5
residual TFA, and the residue dissolved in ACN/20 mM TEAB (Triethylammonium hydrogen carbonate) (1:1, v/v) quantified by UV
absorbance ( 24,000 M .cm ) and stored as 100 nmol aliquots evaporated to dryness (vacuum-centrifuge) in eppendorf tubes. Yield 1.1 ε320 = 1− 1−
mol based on the maleimido-benzylguanine. ES : (M 2H) 1487.5, (M 2H TFA) 1601.6, (M 2H 2TFA) 1715.6. Calc. for C Hμ + − + = − + + = − + + = 66 64
EuN O S 1489.37.16 14 =
SNAP-tag labeling with TR-FRET compatible fluorophores
Twenty four hours after transfection, cells (100 000 cells per well of a 96 Greiner CellStar well plate) were washed with DMEM 10 PCS%pre-warmed at 37 C. Then, cells were labeled one hour at 37 C, 5 CO with different concentrations of derivatized benzyl guanine (BG-K or° ° % 2
BG-d2) in DMEM 10 PCS. After labeling, cells were washed four times with Tris-KREBS buffer (20 mM Tris pH 7.4, 118 mM NaCl, 5.6%mM glucose, 1.2 mM KH PO , 1.2 mM MgSO , 4,7 mM KCl, 1.8 mM CaCl ) and the signal recorded under 100 L of Tris-Krebs per well.2 4 4 2 μ
The emission signal from the cryptate was recorded at 620nm on a time-resolved fluorimeter (RubyStar, BMG Labtechnologies,
Champigny-sur-Marne, France) after an excitation at 337nm by a nitrogen laser and the emission signal from the d2 was recorded at 682nm on
an Analyst reader (Molecular Devices) using a 640nm excitation. Finally, the specific fluorescence signal was determined by substracting the
total fluorescence signal from the cells expressing the cell surface SNAP-tag protein with the non specific signal from mock transfected cells.
TR-FRET between SNAP-tag and antibodies labeled with the indicated fluorophores
After SNAP-tag labeling with BG-K (see above), cells (100 000 cells per well of a 96 Greiner CellStar well plate) were incubated in
Tris-Krebs with 2nM of anti-flag antibodies conjugated with d2 (means of 3.5 fluorophores per anti-flag M2 antibody), overnight at 4 C.°Finally, the FRET signal was measured at 665nm between 50 and 450 S after laser excitation at 337 nm, without washing out the unboundμantibodies (homogeneous format). Assay signals were expressed by the 665 (total signal recorded at 665nm) (background at 665nm). TheΔ = −background signal corresponds to SNAP-tag cells labeled with BG-K only (without antibodies). Similar background values were obtained with
2nM anti-flag-d2 and an excess of unlabeled anti-flag antibodies (1 M). Similar experiments were conducted with 2nM anti-HA conjugatedμwith d2. A similar protocol was used to measure TR-FRET with BG-d2 labeling and europium cryptate-conjugated anti-flag or anti-HA
antibodies. In those cases, the negatives correspond to the europium cryptate-conjugated anti-flag or anti-HA antibodies alone.
TR-FRET between two SNAP-tags
Twenty four hours after transfection, cells were washed one time with 100 L of complete DMEM medium and then incubated one hour atμ37 C, 5 CO2 with a mixture of BG-K and BG-d2. The optimal concentration ratio was obtained for 5 M of BG-K with 0.5 M of BG-d2.° % μ μAfter the labeling cells were washed four times with Tris-Krebs and the signal recorded on a Rubystar plate reader. Here, the 665 representsΔthe FRET signal recorded on BG-K/BG-d2 labeled cells from which the signal recorded on the same cells labeled with BG-K and a cold BG
diluted at the same concentration than the BG-d2 was substrated.
Ackowledgements:
The authors whish to thank Mrs C. Vol (IGF, Montpellier) for her expert assistance for the GPCR functional assays, Mr. F. Maurin (CBI,
Bagnols/C ze) for his participation in the synthesis of BG derivatives. The authors would like to express their special thanks to Prof Kai Johnssonè(EPFL, Lausanne, Switzerland) for his support to this project, his critical reading of the manuscript and for providing us with snap-tag tools. The
authors also thank Drs. P. Rondard IGF, Montpellier, France) and Ralf Jockers (Institut Cochin, Paris, France) for their comments on the
manuscript. Confocal Imaging was performed at the Montpellier, with the helpCentre de Ressources en Imagerie Cellulaire, Imagerie Cellulaire,
of N. Lautredou. This work was made possible thanks to the screening facilities of the Institut F d ratif de Recherche n 3 (IFR3). This work wasé é °supported by the Centre National de la Recherche Scientifique (CNRS), the Institut National de la Sant et de la Recherche M dicale (INSERM),é éCisBio International, and by grants from the French Ministry of Research, Action Concert e Incitative Biologic Cellulaire Mol culaire eté “ éStructural (ACI-BCMS 328), the Agence Nationale de la Recherche (ANR-05-PRIB-02502, ANR-BLAN06-3_135092 and ANR-05-NEUR-035),”and by an unrestricted grant from Senomyx (La Jolla, CA, USA).
Footnotes:
and LCA executed most of the experiments and participated in the writing of the manuscript, developed theAuthors contributions: DM CB
system to control subunit composition, and performed the confocal experiments, performed the experiments with mGlul receptor and theMLR
initial experiments with class A receptors, and synthesized the BG derivatives, MA participated in the BRET experiments, NT and ETEB HB
supervised the work at CisBio, and supervised some aspects of the work at the IGF, supervised the project and wrote the manuscript.TD LP JPP
References: 1. Bockaert J , Pin JP Molecular tinkering of G protein-coupled receptors: an evolutionary success. Embo J. 18: 1723- 1729 1999; 2. Bayburt TH , Leitz AJ , Xie G , Oprian DD , Sligar SG Transducin activation by nanoscale lipid bilayers containing one and two rhodopsins. J Biol Chem. 282: 14875- 14881
2007; 3. Chabre M , le Maire M Monomeric G-protein-coupled receptor as a functional unit. Biochemistry. 44: 9395- 9403 2005; 4. Ernst OP , Gramse V , Kolbe M , Hofmann KP , Heck M Monomeric G protein-coupled receptor rhodopsin in solution activates its G protein transducin at the diffusion limit.
Proc Natl Acad Sci USA. 104: 10859- 10864 2007; 5. Whorton MR A monomeric G protein-coupled receptor isolated in a high-density lipoprotein particle efficiently activates its G protein. Proc Natl Acad Sci U S A. 104: 7682-
7687 2007; 6. Bouvier M Oligomerization of G-protein-coupled transmitter receptors. Nat Rev Neurosci. 2: 274- 286 2001; 7. Milligan G G-protein-coupled receptor heterodimers: pharmacology, function and relevance to drug discovery. Drug Discov Today. 11: 541- 549 2006; 8.. Bouvier M , Heveker N , Jockers R , Marullo S , Milligan G BRET analysis of GPCR oligomerization: newer does not mean better. Nat Methods. 4: 3- 4 2007; 9. James JR , Oliveira MI , Carmo AM , Iaboni A , Davis SJ A rigorous experimental framework for detecting protein oligomerization using bioluminescence resonance energy
transfer. Nat Methods. 3: 1001- 1006 2006; 10. Meyer BH FRET imaging reveals that functional neurokinin-1 receptors are monomeric and reside in membrane microdomains of live cells. Proc Natl Acad Sci U S A. 103:
2138- 2143 2006; 11. Pfleger KD , Eidne KA Illuminating insights into protein-protein interactions using bioluminescence resonance energy transfer (BRET). Nat Methods. 3: 165- 174 2006; 12. Selvin PR The renaissance of fluorescence resonance energy transfer. Nat Struct Biol. 7: 730- 734 2000; 13. McVey M Monitoring receptor oligomerization using time-resolved fluorescence resonance energy transfer and bioluminescence resonance energy transfer. The human delta
-opioid receptor displays constitutive oligomerization at the cell surface, which is not regulated by receptor occupancy. J Biol Chem. 276: 14092- 14099 2001; 14. Maurel D Cell surface detection of membrane protein interaction with homogeneous time-resolved fluorescence resonance energy transfer technology. Anal Biochem. 329: 253- 262 2004; 15. Bazin H , Trinquet E , Mathis G Time resolved amplification of cryptate emission: a versatile technology to trace biomolecular interactions. J Biotechnol. 82: 233- 250 2002; 16. Kniazeff J Closed state of both binding domains of homodimeric mGlu receptors is required for full activity. Nat Str Mol Biol. 11: 706- 713 2004; 17. Keppler A , Pick H , Arrivoli C , Vogel H , Johnsson K Labeling of fusion proteins with synthetic fluorophores in live cells. Proc Natl Acad Sci USA. 101: 9955- 9959 2004; 18. Keppler A A general method for the covalent labeling of fusion proteins with small molecules in vivo. Nat Biotechnol. 21: 86- 89 2003; 19. Pin JP Allosteric functioning of dimeric Class C G-protein coupled receptors. FEBS J. 272: 2947- 2955 2005; 20. Brock C , Boudier L , Maurel D , Blahos J , Pin JP Assembly-dependent surface targeting of the heterodimeric GABAB Receptor is controlled by COPI but not 14-3-3. Mol
Biol Cell. 16: 5572- 5578 2005; 21. Margeta-Mitrovic M , Jan YN , Jan LY A trafficking checkpoint controls GABA(B) receptor heterodimerization. Neuron. 27: 97- 106 2000; 22. Brock C Activation of a Dimeric Metabotropic Glutamate Receptor by Inter-Subunit Rearrangement. J Biol Chem. 282: 33000- 33008 2007; 23. Bischoff S Spatial distribution of GABA(B)R1 receptor mRNA and binding sites in the rat brain. J Comp Neurol. 412: 1- 16 1999; 24. Kaupmann K Expression cloning of GABA(B) receptors uncovers similarity to metabotropic glutamate receptors. Nature. 386: 239- 246 1997; 25. Selvin PR , Hearst JE Luminescence energy transfer using a terbium chelate: improvements on fluorescence energy transfer. Proc Natl Acad Sci U S A. 91: 10024- 10028 1994; 26. Villemure JF Subcellular distribution of GABA(B) receptor homo- and hetero-dimers. Biochem J. 388: 47- 55 2005; 27. Lopez-Gimenez JF , Canals M , Pediani JD , Milligan G The alpha 1b-adrenoceptor exists as a higher-order oligomer: effective oligomerization is required for receptor
maturation, surface delivery, and function. Mol Pharmacol. 71: 1015- 1029 2007; 28. Damian M , Martin A , Mesnier D , Pin JP , Ban resè JL Asymmetric conformational changes in a GPCR dimer controlled by G-proteins. EMBO J. 25: 5693- 5702 2006;
29. Hlavackova V Evidence for a single heptahelical domain being turned on upon activation of a dimeric GPCR. EMBO J. 24: 499- 509 2005; 30. White JF Dimerization of the class A G protein-coupled neurotensin receptor NTS1 alters G protein interaction. Proc Natl Acad Sci USA. 104: 12199- 12204 2007;
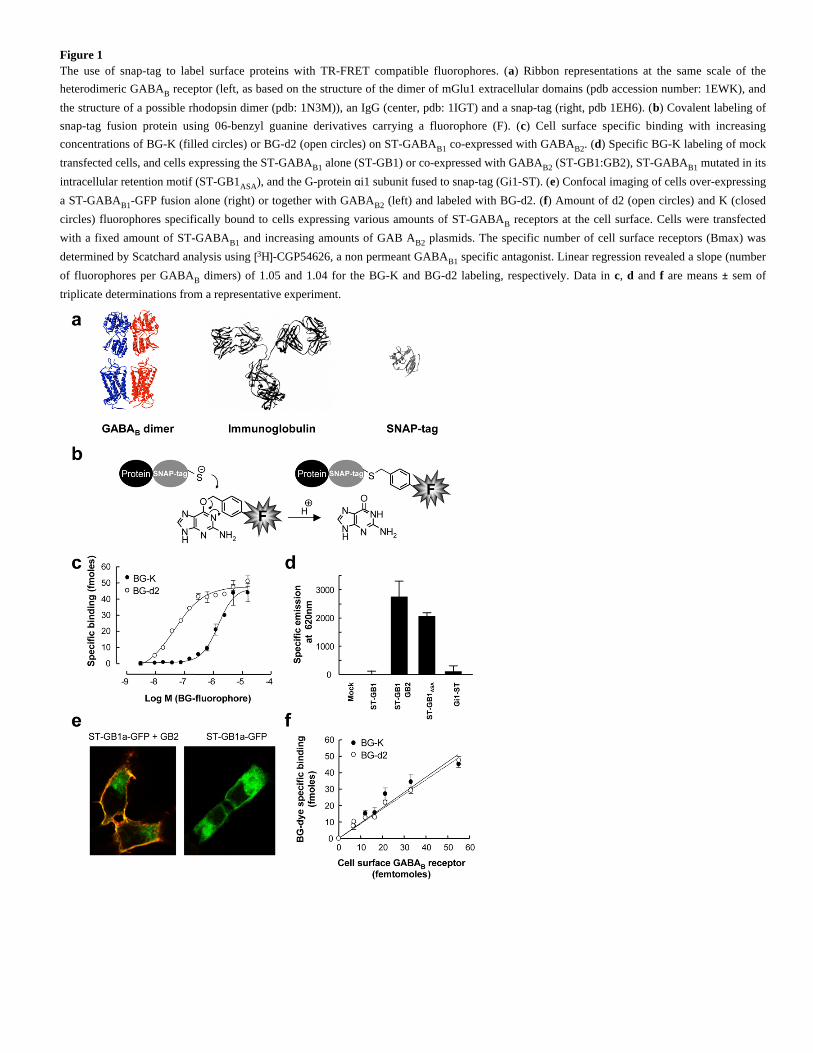
Figure 1The use of snap-tag to label surface proteins with TR-FRET compatible fluorophores. ( ) Ribbon representations at the same scale of thea
heterodimeric GABA receptor (left, as based on the structure of the dimer of mGlu1 extracellular domains (pdb accession number: 1EWK), andB
the structure of a possible rhodopsin dimer (pdb: 1N3M)), an IgG (center, pdb: 1IGT) and a snap-tag (right, pdb 1EH6). ( ) Covalent labeling ofb
snap-tag fusion protein using 0 -benzyl guanine derivatives carrying a fluorophore (F). ( ) Cell surface specific binding with increasing6 c
concentrations of BG-K (filled circles) or BG-d2 (open circles) on ST-GABA co-expressed with GABA . ( ) Specific BG-K labeling of mockB1 B2 d
transfected cells, and cells expressing the ST-GABA alone (ST-GB1) or co-expressed with GABA (ST-GB1:GB2), ST-GABA mutated in itsB1 B2 B1
intracellular retention motif (ST-GB1 ), and the G-protein i1 subunit fused to snap-tag (Gi1-ST). ( ) Confocal imaging of cells over-expressingASA α e
a ST-GABA -GFP fusion alone (right) or together with GABA (left) and labeled with BG-d2. ( ) Amount of d2 (open circles) and K (closedB1 B2 f
circles) fluorophores specifically bound to cells expressing various amounts of ST-GABA receptors at the cell surface. Cells were transfectedB
with a fixed amount of ST-GABA and increasing amounts of GAB A plasmids. The specific number of cell surface receptors (Bmax) wasB1 B2
determined by Scatchard analysis using H -CGP54626, a non permeant GABA specific antagonist. Linear regression revealed a slope (number[3 ] B1
of fluorophores per GABA dimers) of 1.05 and 1.04 for the BG-K and BG-d2 labeling, respectively. Data in , and are means sem ofB c d f ±
triplicate determinations from a representative experiment.

Figure 2Detection of GABA heteromers at the cell surface using snap-tag and TR-FRET. ( ) FRET intensity between d2-labeled anti-flag antibodies andB a
BG-K labeled snap-tags in cells expressing increasing amounts of surface ST-GABA and flag-GABA receptors. FRET is measured as theB1 B2
specific d2 emission at 665nm after excitation of europium cryptate at 337 nm, the background signal measured in the absence of d2-antibodies
being substracted. The FRET intensity is represented according to the total number of receptors expressed at the cell surface, ( ) TR-FRET wasb
measured between flag-GABA receptors labeled with d2-antibodies, and the indicated HA-snap-tag fusion proteins labeled with BG-K. DataB
were obtained with the same amount of snap-tag proteins at the cell surface as measured with anti-anti-HA ELISA, and a constant amount of
flag-GABA receptors. Positive control (left column) was performed with cells expressing ST-GABA and flag-GABA . ( ) FRET intensity wasB B1 B2 c
measured in cells expressing ST-GABA and ST-GABA with varying concentration of BG-d2 and 5 M BG-K. ( ) FRET intensity is directlyB1 B2 μ d
proportional to the amount of ST-GABA subunits at the cell surface. The number of snap-tags was deduced from the Bmax of H -CGP54626. (e)[3 ]FRET efficacy as determined by the ratio of the specific d2 emission at 665 nm resulting from FRET, and the fluorescence intensity (at 620 nm) of
the specifically bound BG-K, is plotted as a function of the amount of snap-tags at the cell surface deduced from the Bmax of H -CGP54626.[3 ]Data in ( ) and ( ) are means sem of triplicate determinations from a typical experiments. Data in ( ) and ( ) are triplicate determinations from 4a b ± d e
independent experiments.

Figure 3Detection of cell surface protein oligomers using snap-tag fusions and TR-FRET. ( ) Both TR-FRET intensity and HA-ELISA were measured fora
various expression levels of either GABA (filled squares) or V2 vasopressin (open squares) HA-ST-fusions. ( ) Experiments were conducted asB b
in ( ) for various other cell surface proteins, and means TR-FRET intensity over the ELISA signal (representing the slope) are presented. Negativea
control (right column mGlu1 dimer ) was performed using a mGlu1 receptor dimer carrying a single ST (see ( )). ( ) FRET intensity was plotted“ ” c c
as a function of the amount of mGlu1 receptor at the cell surface, when both subunits are fused to snap-tag (filled symbols) or when only one
subunit per dimer is labeled (open symbols). To control the subunit composition of the mGlu1 receptor dimer, each subunit carries the C-terminal
tail of either GABA (C1 in blue) with its natural intracellular retention signal (blue ball) or GABA (C2 in red) in which an intracellularB1 B2
retention signal was added (red ball). Coiled-coil interaction between Cl and C2 prevents intracellular retention of both proteins such that neither
subunit reach the surface alone, but do so when co-expressed together ( ).supp Fig. D
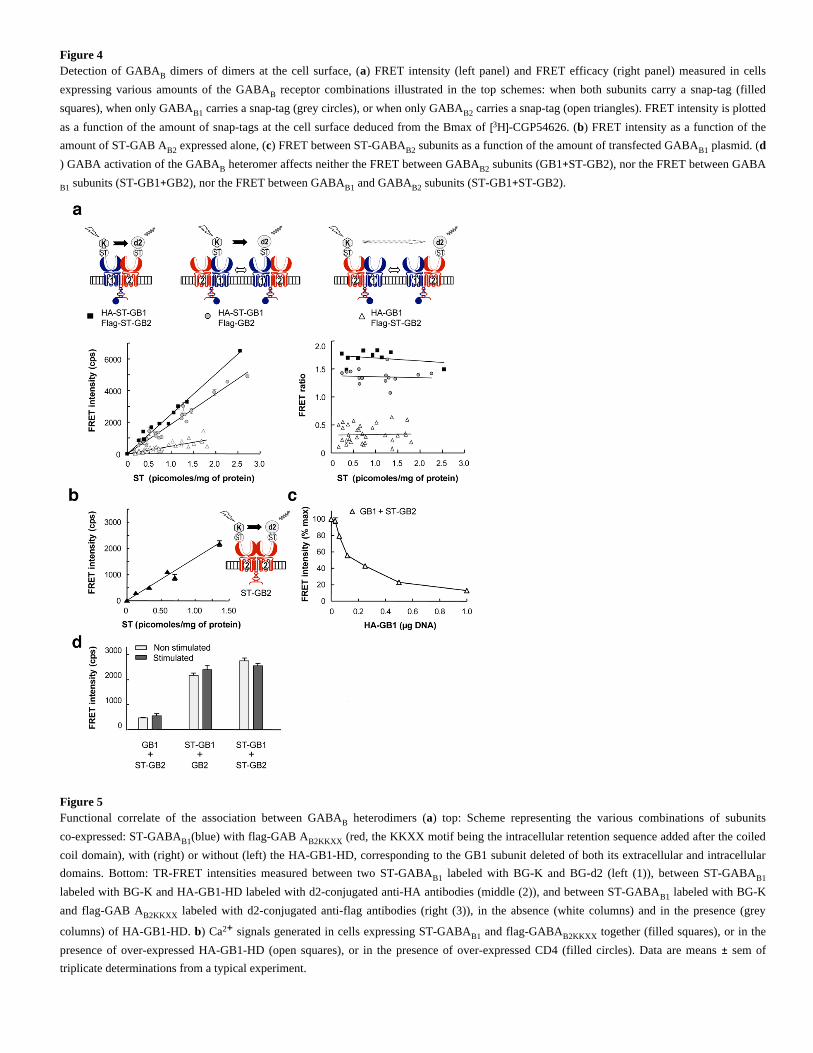
Figure 4Detection of GABA dimers of dimers at the cell surface, ( ) FRET intensity (left panel) and FRET efficacy (right panel) measured in cellsB a
expressing various amounts of the GABA receptor combinations illustrated in the top schemes: when both subunits carry a snap-tag (filledB
squares), when only GABA carries a snap-tag (grey circles), or when only GABA carries a snap-tag (open triangles). FRET intensity is plottedB1 B2
as a function of the amount of snap-tags at the cell surface deduced from the Bmax of H -CGP54626. ( ) FRET intensity as a function of the[3 ] b
amount of ST-GAB A expressed alone, ( ) FRET between ST-GABA subunits as a function of the amount of transfected GABA plasmid. (B2 c B2 B1 d
) GABA activation of the GABA heteromer affects neither the FRET between GABA subunits (GB1 ST-GB2), nor the FRET between GABAB B2 +
subunits (ST-GB1 GB2), nor the FRET between GABA and GABA subunits (ST-GB1 ST-GB2).B1 + B1 B2 +
Figure 5Functional correlate of the association between GABA heterodimers ( ) top: Scheme representing the various combinations of subunitsB a
co-expressed: ST-GABA (blue) with flag-GAB A (red, the KKXX motif being the intracellular retention sequence added after the coiledB1 B2KKXX
coil domain), with (right) or without (left) the HA-GB1-HD, corresponding to the GB1 subunit deleted of both its extracellular and intracellular
domains. Bottom: TR-FRET intensities measured between two ST-GABA labeled with BG-K and BG-d2 (left (1)), between ST-GABAB1 B1
labeled with BG-K and HA-GB1-HD labeled with d2-conjugated anti-HA antibodies (middle (2)), and between ST-GABA labeled with BG-KB1
and flag-GAB A labeled with d2-conjugated anti-flag antibodies (right (3)), in the absence (white columns) and in the presence (greyB2KKXX
columns) of HA-GB1-HD. ) Ca signals generated in cells expressing ST-GABA and flag-GABA together (filled squares), or in theb 2+B1 B2KKXX
presence of over-expressed HA-GB1-HD (open squares), or in the presence of over-expressed CD4 (filled circles). Data are means sem of±triplicate determinations from a typical experiment.