Cell Stem Cell Short Article - Harvard University · Cell Stem Cell Short Article Small...
11
Cell Stem Cell Short Article Small Molecule-Mediated TGF- b Type II Receptor Degradation Promotes Cardiomyogenesis in Embryonic Stem Cells Erik Willems, 1,3, * Joaquim Cabral-Teixeira, 1 Dennis Schade, 1,3,4 Wenqing Cai, 1,2 Patrick Reeves, 5 Paul J. Bushway, 1 Marion Lanier, 3,4 Christopher Walsh, 6 Tomas Kirchhausen, 5 Juan Carlos Izpisua Belmonte, 6,7 John Cashman, 3,4 and Mark Mercola 1,3, * 1 Muscle Development and Regeneration Program 2 Graduate School of Biomedical Sciences Sanford-Burnham Medical Research Institute, La Jolla, CA 92037, USA 3 ChemRegen Inc., San Diego, CA 92130, USA 4 Human Biomolecular Research Institute, San Diego, CA 92121, USA 5 Department of Cell Biology, Immune Disease Institute, Harvard Medical School, Boston, MA 02115, USA 6 Gene Expression Laboratory, Salk Institute for Biological Studies, La Jolla, CA 92037, USA 7 Center of Regenerative Medicine in Barcelona, 08003 Barcelona, Spain *Correspondence: [email protected] (E.W.), [email protected] (M.M.) http://dx.doi.org/10.1016/j.stem.2012.04.025 SUMMARY The cellular signals controlling the formation of cardi- omyocytes, vascular smooth muscle, and endothe- lial cells from stem cell-derived mesoderm are poorly understood. To identify these signals, a mouse em- bryonic stem cell (ESC)-based differentiation assay was screened against a small molecule library result- ing in a 1,4-dihydropyridine inducer of type II TGF-b receptor (TGFBR2) degradation-1 (ITD-1). ITD an- alogs enhanced proteasomal degradation of TGFBR2, effectively clearing the receptor from the cell surface and selectively inhibiting intracellular signaling (IC 50 0.4–0.8 mM). ITD-1 was used to eval- uate TGF-b involvement in mesoderm formation and cardiopoietic differentiation, which occur sequen- tially during early development, revealing an essen- tial role in both processes in ESC cultures. ITD-1 selectively enhanced the differentiation of uncom- mitted mesoderm to cardiomyocytes, but not to vascular smooth muscle and endothelial cells. ITD-1 is a highly selective TGF-b inhibitor and reveals an unexpected role for TGF-b signaling in controlling cardiomyocyte differentiation from multipotent cardiovascular precursors. INTRODUCTION The ability to control stem cell cardiogenesis is critical to realize the promise of pluripotent stem cells as a source of cells for replacement therapies. Moreover, an improved understanding of the signals that regulate replication and differentiation of cardiac progenitors might reveal mechanisms that underlie the limited potential of the adult heart to replace muscle cells after injury and ultimately could lead to strategies for in vivo regen- eration therapies (Sturzu and Wu, 2011). An important approach to defining the signals that drive stem cell cardiogenesis has been to mimic embryological mechanisms for mesoderm induc- tion and cardiogenic patterning (Burridge et al., 2012). Although successful in revealing the underlying mechanisms of early differentiation events, little is known about the signals that drive later steps of cardiogenesis that may be key to achieving thera- peutic regeneration. Unbiased screening of small molecules in phenotypic assays can overcome some of the limitations of embryology studies and is thus an alternate approach to study gene, protein, or pathway function in complex biological systems (Willems et al., 2011). Here, we describe a large-scale, image-based screen to identify novel small molecule probes that would stimulate the specification of cardiac cells from uncommitted mesoderm in embryonic stem cells (ESCs). One of the most active compounds was a 1,4-dihydropyridine, which we named inducer of TGF-b type II receptor degradation (ITD). ITD and its analogs promote cardiomyocyte differentiation specifically via degradation of the TGF-b type II receptor (TGFBR2), revealing a role for TGF-b itself as a repressor of cardiomyocyte fate. Moreover, ITDs comprise selective TGF-b inhibitors that do not block the closely related Activin A signaling pathway and represent reagents for exploring TGF-b function in various biological contexts such as embryonic development and models of disease. RESULTS A Cardiogenesis Screen Identifies a Novel TGF-b-Selective Inhibitor A mouse ESC (mESC) assay using an image-based Myh6-GFP reporter readout was screened between days 2 and 6 of differ- entiation, as uncommitted mesoderm (T/Bra + ) cells become specified as cardiac. The assay identified a 1,4-dihydropyridine, which we named ITD-1 (inducer of TGF-b type II receptor degra- dation-1). ITD-1 optimally promoted cardiogenesis and beating cell clusters when added from day 3 to day 5 of differentiation (Figures 1A–1C and Movie S1 available online). In contrast, 242 Cell Stem Cell 11, 242–252, August 3, 2012 ª2012 Elsevier Inc.
Transcript of Cell Stem Cell Short Article - Harvard University · Cell Stem Cell Short Article Small...

Cell Stem Cell
Short Article
Small Molecule-Mediated TGF-b Type II ReceptorDegradation Promotes Cardiomyogenesisin Embryonic Stem CellsErik Willems,1,3,* Joaquim Cabral-Teixeira,1 Dennis Schade,1,3,4 Wenqing Cai,1,2 Patrick Reeves,5 Paul J. Bushway,1
Marion Lanier,3,4 Christopher Walsh,6 Tomas Kirchhausen,5 Juan Carlos Izpisua Belmonte,6,7 John Cashman,3,4
and Mark Mercola1,3,*1Muscle Development and Regeneration Program2Graduate School of Biomedical Sciences
Sanford-Burnham Medical Research Institute, La Jolla, CA 92037, USA3ChemRegen Inc., San Diego, CA 92130, USA4Human Biomolecular Research Institute, San Diego, CA 92121, USA5Department of Cell Biology, Immune Disease Institute, Harvard Medical School, Boston, MA 02115, USA6Gene Expression Laboratory, Salk Institute for Biological Studies, La Jolla, CA 92037, USA7Center of Regenerative Medicine in Barcelona, 08003 Barcelona, Spain
*Correspondence: [email protected] (E.W.), [email protected] (M.M.)http://dx.doi.org/10.1016/j.stem.2012.04.025
SUMMARY
The cellular signals controlling the formation of cardi-omyocytes, vascular smooth muscle, and endothe-lial cells from stem cell-derivedmesoderm are poorlyunderstood. To identify these signals, a mouse em-bryonic stem cell (ESC)-based differentiation assaywas screened against a small molecule library result-ing in a 1,4-dihydropyridine inducer of type II TGF-breceptor (TGFBR2) degradation-1 (ITD-1). ITD an-alogs enhanced proteasomal degradation ofTGFBR2, effectively clearing the receptor from thecell surface and selectively inhibiting intracellularsignaling (IC50 �0.4–0.8 mM). ITD-1 was used to eval-uate TGF-b involvement in mesoderm formation andcardiopoietic differentiation, which occur sequen-tially during early development, revealing an essen-tial role in both processes in ESC cultures. ITD-1selectively enhanced the differentiation of uncom-mitted mesoderm to cardiomyocytes, but not tovascular smooth muscle and endothelial cells.ITD-1 is a highly selective TGF-b inhibitor and revealsan unexpected role for TGF-b signaling in controllingcardiomyocyte differentiation from multipotentcardiovascular precursors.
INTRODUCTION
The ability to control stem cell cardiogenesis is critical to realize
the promise of pluripotent stem cells as a source of cells for
replacement therapies. Moreover, an improved understanding
of the signals that regulate replication and differentiation of
cardiac progenitors might reveal mechanisms that underlie the
limited potential of the adult heart to replace muscle cells after
injury and ultimately could lead to strategies for in vivo regen-
242 Cell Stem Cell 11, 242–252, August 3, 2012 ª2012 Elsevier Inc.
eration therapies (Sturzu and Wu, 2011). An important approach
to defining the signals that drive stem cell cardiogenesis has
been to mimic embryological mechanisms for mesoderm induc-
tion and cardiogenic patterning (Burridge et al., 2012). Although
successful in revealing the underlying mechanisms of early
differentiation events, little is known about the signals that drive
later steps of cardiogenesis that may be key to achieving thera-
peutic regeneration.
Unbiased screening of small molecules in phenotypic assays
can overcome some of the limitations of embryology studies
and is thus an alternate approach to study gene, protein, or
pathway function in complex biological systems (Willems et al.,
2011). Here, we describe a large-scale, image-based screen to
identify novel small molecule probes that would stimulate the
specification of cardiac cells from uncommitted mesoderm in
embryonic stem cells (ESCs). One of themost active compounds
was a 1,4-dihydropyridine, which we named inducer of TGF-b
type II receptor degradation (ITD). ITD and its analogs promote
cardiomyocyte differentiation specifically via degradation of
the TGF-b type II receptor (TGFBR2), revealing a role for TGF-b
itself as a repressor of cardiomyocyte fate. Moreover, ITDs
comprise selective TGF-b inhibitors that do not block the closely
related Activin A signaling pathway and represent reagents for
exploring TGF-b function in various biological contexts such as
embryonic development and models of disease.
RESULTS
A Cardiogenesis Screen Identifies a NovelTGF-b-Selective InhibitorA mouse ESC (mESC) assay using an image-based Myh6-GFP
reporter readout was screened between days 2 and 6 of differ-
entiation, as uncommitted mesoderm (T/Bra+) cells become
specified as cardiac. The assay identified a 1,4-dihydropyridine,
which we named ITD-1 (inducer of TGF-b type II receptor degra-
dation-1). ITD-1 optimally promoted cardiogenesis and beating
cell clusters when added from day 3 to day 5 of differentiation
(Figures 1A–1C and Movie S1 available online). In contrast,

Cell Stem Cell
TGFBR2 Degradation Drives ESC Cardiogenesis
ITD-1 completely abolished cardiogenesis when added before
mesoderm induction, i.e., days 1–3 of differentiation (Figures
1B and 1C), suggesting a biphasic effect of ITD-1 during differen-
tiation of mESCs, inhibiting mesoderm early and inducing
cardiac fate later.
Dihydropyridines are well-known calcium channel blockers,
so we asked whether this mechanism was responsible for
any of the ITD-1 activities, but no evidence was found
for a role through calcium inhibition (Figure S1). To facilitate
target identification of ITD-1, a panel of tyrosine kinase
inhibitors was screened in the day 3–5 cardiogenic window,
revealing that blocking Activin A and/or TGF-b signaling upre-
gulated cardiogenesis significantly (Table S1). HEK293T cells
were transfected with a Smad4 response element driving lucif-
erase (SBE4-Luc) to test whether ITD-1 blocked Activin A/
Nodal and/or TGF-b signaling, which utilize the same intracel-
lular signaling cascade through Smad4. ITD-1 strongly inhibited
TGF-b2 signaling with similar efficacy (92% versus 99%,
respectively) but with lower potency compared to SB-431542,
a ACVR1B/TGFBR1 kinase inhibitor (IC50 = 850 nM versus
70 nM, respectively) and was a weak and partial inhibitor of
Activin A signals (Figures 1D, 1E, and 1M). Toxicity was not
responsible for the observed inhibitory activity of ITD-1, and
other developmentally important pathways such as Wnt or
BMP signaling were not inhibited by ITD-1 (Figure S2). To
understand whether TGF-b2 and Activin A inhibition was
through a shared target, we pursued a chemical biology
approach asking whether or not we could generate ITD-1
analogs that would selectively target the TGF-b pathway and
not the Activin A pathway. Optically pure (+)- and (�)-enantio-
mers of ITD-1 (chiral center at the 4-position) showed that the
inhibitory effect was well separated stereochemically for
TGF-b2, but not for Activin A, suggesting a highly selective
mechanism for TGF-b2 inhibition, distinct from that of the
weak Activin A inhibition (Figures 1F, 1G, and 1M). This finding
prompted a screen of ITD-1 analogs to increase the selectivity
for TGF-b2 relative to Activin A. From more than 200 analogs,
one highly selective candidate, named ITDts (ITD TGF-b selec-
tive), retained TGF-b2 inhibition activity but lost Activin A inhibi-
tion activity even at 5 mM (Figures 1H–1K and 1M). Interestingly,
a structural homolog of ITDts, ITD-2, where only the 4-CF3group was replaced by a 4-CH3 group, retained the weak
activity against Activin A (Figures 1H–1K and 1M).
We next evaluated whether ITD-1 is functionally selective in
a defined stem cell system. We used Cripto�/� mESCs, which
lack the essential coreceptor needed to respond to Nodal, to
remove any confounding effects that endogenous Nodal might
have if stimulated in response to exogenous Activin A or
TGF-b. ITD-1 (5 mM) effectively blocked induction of the Activin
A/Nodal/TGF-b target gene Lefty1 in response to TGF-b2 but
not to Activin A (Figure 1L). Because ITD-1 is functionally selec-
tive, we therefore used it in subsequent biological studies but
confirmed key results with ITDts, which has poorer chemical
stability in cell culture media.
ITD-1 Blocks TGF-b Signaling at the Receptor LevelThe TGF-b signaling pathway was then probed at multiple levels
to determine the point of inhibition. ITD-1 did not block the kinase
activity of either type I (TGFBR1) or type II (TGFBR2) TGF-b
C
receptors (Figures S3A and S3B), but ITD-1 potently blocked
phosphorylation of the effector SMAD2/3 proteins induced by
TGF-b2 and only minimally in response to Activin A (Figures 1N
and 1O), corroborating the findings that ITD-1 is selective for
TGF-b. Consequently, ITD-1 reduced transcriptional levels of
Lefty1 in Cripto�/� mESCs and needed �3 hr more to inhibit
Lefty1 expression compared to SB-431542 (Figure 1P). These
results demonstrate that ITD-1 targets the TGF-b pathway
at the receptor level but uses a different and more selective
mechanism compared to kinase inhibitors such as SB-431542
(Figure 1Q, Table S2).
ITD-1 Specifically Targets TGFBR2 to the ProteasomeThe above findings prompted us to investigate some of the
dynamic processes of receptor internalization, degradation,
and recycling that regulate the ability of the receptor to signal
(Chen, 2009). After binding the TGF-b ligand, TGFBR2 associ-
ates with TGFBR1, and the resulting ligand-receptor complex
is internalized, as a requisite for signaling. By using an overex-
pressed extracellularly HA-tagged TGFBR2-mCherry fusion
protein (HA-TGFBR2-mCherry), which is internalized in the pres-
ence of TGF-b2 ligand, we found that ITD-1 did not block imme-
diate internalization of TGFBR2, in contrast to SB-431542, which
abolished internalization (Figure S3C). We then asked whether
ITD-1 interfered with receptor recycling and/or degradation
through the lysosome or proteasome (Di Guglielmo et al.,
2003). ITD-1 did not affect TGFBR1 when overexpressed in
HEK293T (Figures 2A and 2B), but strongly downregulated
TGFBR2 protein levels (Figures 2C and 2D). ITD-1 similarly
decreased endogenous TGFBR2 levels in several human cell
lines, demonstrating that the ITD-1 effect was not an artifact of
overexpression (Figures 2E, 2F, S4A, and S4B).
To distinguish whether ITD-1 decreased cell surface or total
TGFBR2 levels, we developed a flow cytometry assay with the
HA-TGFBR2-mCherry vector that allowed the cell surface (extra-
cellular HA-tag immunostaining) and total (mCherry fluores-
cence) TGFBR2 levels to be measured independently in the
same experiment. Both HA-tag and mCherry levels declined in
response to ITD-1, indicating that ITD-1 cleared TGFBR2 from
the cell surface and targeted it for degradation (Figure 2G). The
effect of ITD-1 was also observed on endogenous cell surface
TGFBR2 and was selective, as shown by the fact that ITD-1
did not affect other tyrosine kinase receptors (Figures S4C–
S4F). ITD-1 diminished both the number of cells with TGFBR2
receptor, and the number of receptors per cell in a dose-depen-
dent manner (Figures 2H and 2I). ITD-1 downregulated HA-
TGFBR2 and TGFBR2-mCherry with nearly the same potency
(IC50 = 1.05 and 1.31 mM, respectively), suggesting a common
mechanism, although the maximal depletion of HA-TGFBR2
was greater (Emax = �80% versus �50%), consistent with the
fact that ITD-1 acts by enhancing degradation rather than by
blocking synthesis, which would affect cell surface and intracel-
lular receptor pools equally (Figure 2I). At least 6 hr were needed
for ITD-1 to reduce TGFBR2 levels, with amaximum reduction by
24 hr of treatment (Figure 2J).
To gain insight in the degradation mechanism of ITD-1, cells
were treated with lysosome or proteasome inhibitors. ITD-1
reduced the levels of TGFBR2-mCherry fluorescence per cell,
resulting in an increased number of TGFBR2-mCherrylo cells at
ell Stem Cell 11, 242–252, August 3, 2012 ª2012 Elsevier Inc. 243
P
TranscriptionSmad 2/3/4
Activin A/Nodal
signaling
TGF-βsignaling
ITD-1
SB-431542
LY-364947
A83-01
SB-525334
SB-431542
LY-364947
A83-01
SB-525334
R = 0.65
ITD-1
ITD-2
ITDts
100 80
60 40
% TGF-β2 Inhibition
20
%A
ctA
In
hib
itio
n
0
-20
-40
-60
-80
-60 -40 -20 0
20
40
60
80
100 D E H
I K L
0.0001 0.001 0.01 0.1 1 100
20
40
60
80
100
120
0.001 0.01 0.1 1 100
20
40
60
80
100
120
ITD-2ITDts
ITD-1
M
ITD-1
ITD-1(-)/ITD-1(+)
ITD-2 ITDts
F G
J
TGF-β2Activin AITD-1 5µM
SB 5µMITD-1 5µM
SB 5µM
Lefty1
e
xp
re
ss
io
n le
ve
l 1400
1200
1000
800
600
400
200
0
140
120
100
80
60
40
20
0
Activin A TGF-β2
Compound IC50 ( M) Emax (% Inh) IC50 ( M) Emax (% Inh)
ITD-1 1.51 ± 0.52 65 ± 2 0.85 ± 0.30 92 ± 2ITD-1(-) 2.52 ± 0.94 51 ± 5 6.90 ± 0.34 38 ± 4ITD-1(+) 1.00 ± 0.32 57 ± 5 0.46 ± 0.14 97 ± 1ITD-2 2.60 ± 2.2 53 ± 4 0.86 ± 0.15 93 ± 1ITDts 3.50 ± 3.10 21 ± 10 0.73 ± 0.41 93 ± 1SB 0.17 ± 0.02 99 ± 1 0.07 ± 0.01 99 ± 1
100
90
80 70
60
50
40
30
20
10
0
SB
IT
D-1
IT
D-1
(+
)
IT
D-2
IT
Dts
ITD-2ITDts
ITD-1
Concentration (µM)
Concentration (µM)
Concentration (µM)
0.001 0.01 0.1 1 100
20
40
60
80
100
120
ITD-1(-)ITD-1(+)ITD-1
%S
BE
4A
ctiv
atio
n
by
Ac
tiv
inA
0.0001 0.001 0.01 0.1 1 100
20
40
60
80
100
120
ITD-1(-)ITD-1(+)ITD-1
Concentration (µM)
%S
BE
4A
ctiv
atio
n
by
TG
F-β2
%S
BE
4A
ctiv
atio
n
by
Ac
tiv
inA
%S
BE
4A
ctiv
atio
n
by
TG
F-β2
%S
BE
4A
ctiv
atio
n
by
Ac
tiv
inA
%S
BE
4A
ctiv
atio
n
by
TG
F-β2
0.0001 0.001 0.01 0.1 1 100
20
40
60
80
100
120
SB
Concentration (µM)
ITD-1
%S
BE
4A
ctiv
atio
n
by
Ac
tiv
inA
0.001 0.01 0.1 1 100
20
40
60
80
100
120
SB
Concentration (µM)
ITD-1
d0 d2 d4 d6 d10
Add
com
poun
d
Re-ad
d
com
poun
d
Reado
ut:
Myh6-G
FP
imag
ingmESC
platin
gRem
ove
com
poun
d
ITD-1 (5µM) Exposure Window
Myh6
-G
FP
L
ev
el (F
old
o
ve
r D
MS
O)
d1-3
d2-4
d3-5
d4-6
d5-7
d6-8
d7-9
30
25
20
15
10
5
0
Im
ag
e-b
as
ed
SMAD2SMAD3
pSMAD2/3
GAPDActivin ATGF-β2
ITD-1 5µMSB 5µM
Activin ATGF-β2
ITD-1 5µMSB 5µM
pSMAD2pSMAD3
Ph
osp
ho
rylatio
n
in
hib
itio
n level (%
)
020406080
100120
Lefty1 m
RN
A exp
ressio
n
Time of compound exposure (h)
SFMTGF-β2TGF-β2 + SB 5µMTGF-β2 + ITD-1 5µM1.4
1.2
1.0
0.8
0.6
0.4
0.2
0 5 10 15 20 25
ITD-1 Day 1-3DMSO ITD-1 Day 3-5
N O P Q
A B C
Cell Stem Cell
TGFBR2 Degradation Drives ESC Cardiogenesis
244 Cell Stem Cell 11, 242–252, August 3, 2012 ª2012 Elsevier Inc.

Cell Stem Cell
TGFBR2 Degradation Drives ESC Cardiogenesis
the expense of TGFBR2-mCherryhi cells (Figure 2K, left), and this
effect was rescued by the proteasome inhibitors MG132 and
Bortezomib (Figure 2K, right) but not by the lysosome inhibitor
Chloroquine (CQ) (Figure 2K, middle), as clearly demonstrated
by the ratio of TGFBR2-mCherryhi to TGFBR2-mCherrylo cells
(Figure 2L). Additional support for induced degradation as the
mechanism of ITD-1 action was the robust structure activity rela-
tionship (SAR) between TGFBR2 degradation and inhibition of
TGF-b2 SBE4-Luc activity (R2 > 0.8) (Figure 2M). Because
TGFBR2 was targeted to the proteasome, we examined ubiqui-
tination of TGFBR2 but found no evidence of mono- or polyubi-
quitination (Figure S5). Taken together, the ITD class of mole-
cules comprises selective TGF-b inhibitors that function by
diverting TGFBR2 to the proteasome through an ubiquitin-inde-
pendent mechanism.
Mesoderm Induction in ESCs Requires TGF-bInhibition of mesoderm formation by ITD-1 (Figures 1B and 1C)
indicated that TGF-b was essential for this process, which was
unexpected because prior studies had implicated only the
TGF-b family member Nodal, Wnt, and BMP (Burridge et al.,
2012). Although TGF-b addition can mimic the native role of
Nodal in generating mesoderm and heart cells in ESCs, it is
not known to normally do so in either embryos or ESC cultures
(Behfar et al., 2002). ITD-1 was therefore used to study the
role of TGF-b in mesoderm induction. ESC cultures were
exposed to ITD-1 from day 1 of differentiation and analyzed
for germ layer segregation (Figures 3A–3C). qRT-PCR analysis
of mesoderm, endoderm, and ectoderm markers at day 5 of
differentiation indicated that ITD-1 given at day 1 of differentia-
tion induced ectoderm at the expense of mesoderm (Figure 3B).
Consequently, on day 10 of differentiation, markers for meso-
derm tissues such as heart, endothelium, smooth muscle, and
blood were all downregulated, whereas neural markers were up-
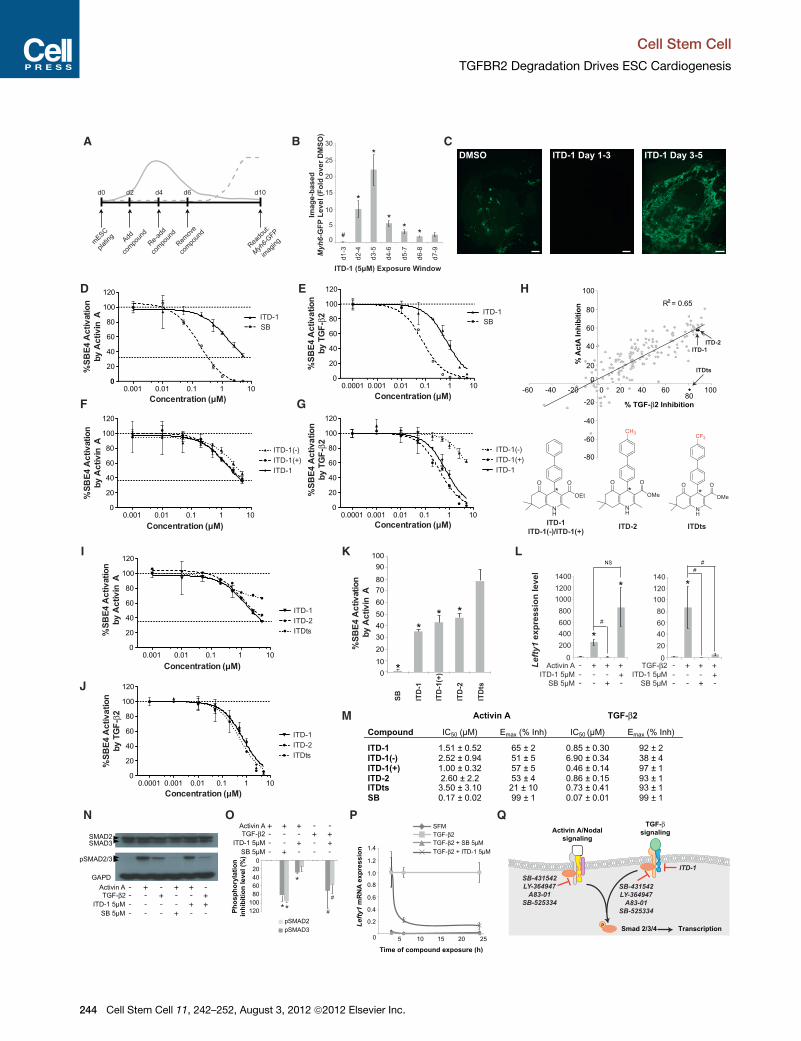
Figure 1. High Content Screen in mESCs Identified a Cardiogenic TGF
(A) ThemESC screening assay used to identify compounds that affect cardiac fate
emerging cardiomyocytes.
(B and C) Myh6-GFP levels quantified by image analysis in mESC after treating w
cardiac fate suppression at d1–d3 and promotion at later time windows. #p < 0.
compared to DMSO (B). Error bars represent standard error of the mean (SEM). R
bars represent 25 mm (C).
(D and E) Inhibition of Smad4 response element-luciferase (SBE4-Luc) activity i
kinase inhibitor SB-431542 (SB) in response to the TGF-b family members Activ
(F and G) SBE4-Luc dose-response curves for ITD-1 and its enantiomers in pres
(H) SAR analysis of more than 200 ITD-1 analogs screened at 5 mM against TG
selectivity for TGF-b2. One confirmed compound (ITDts) and a structurally simil
shown. Asterisk indicates chiral center.
(I and J) Dose-response curves for ITDts, ITD-2, and ITD-1 against Activin A (I) a
(K) Histogram plot representing the residual Activin A activity after treating with 5 m
compared to DMSO vehicle.
(L) Functional inhibition of Activin A and TGF-b2 signaling by ITD-1, read out by
TGF-b2 control; #p < 0.05 compared to Activin A/TGF-b2 alone; NS, not significa
(M) Overview of IC50 values for Activin A/TGF-b2 inhibition and Emax values (shown
average ± SEM.
(N and O) Representative western blot for SMAD2/3, p-SMAD2/3, and GAPD i
p-SMAD2/3 protein level quantification, normalized for GAPD and total SMAD2/
compared to TGF-b2.
(P) Lefty1 mRNA time course analysis in a serum-free Cripto�/� mESC assay
medium alone.
(Q) Schematic representation of the selectivity and targets of known small molec
Error bars represent SEM. See also Movie S1.
C
regulated (Figure 3C). A T-GFP mESC reporter line was then
used to quantify mesoderm inhibition by ITD-1 compared
to small molecule inhibitors of TGF-b and Activin A/Nodal
(SB-431542 and LY-364947), Wnt (IWP), and BMP signaling
(Dorsomorphin, DM), which are known to drive mesoderm
(Figures 3D and 3E). Inhibition of Wnt and Activin A/TGF-b path-
ways diminished the number of mesoderm cells, similarly to
ITD-1 (Figures 3D and 3E), suggesting that all three factors are
involved. However, BMP inhibition did not affect mesoderm as
documented previously (Yuasa et al., 2005). ITD-1 did not inhibit
Wnt signaling (Figures S2B–S2E), and because ITD-1 retained
weak activity against Activin A/Nodal signaling, it was evaluated
in the Cripto�/� mESC assay, revealing that ITD-1 selectively
blocked mesoderm induced by TGF-b but not by Activin A
(Figures 3F and 3G). To confirm the specific involvement of
TGF-b, the chemical tools described above were applied to
correlate mesoderm inhibition with TGF-b signaling inhibition.
Enantiomeric separation in the T-GFP assay was similar to
TGF-b2 signaling inhibition (Figure 3H) and ITDts also reduced
the number of T-GFP-positive cells (Figure 3I). Moreover, the
correlation between both activities was very strong as shown
through SAR analysis (Figure 3J). The ITD class of molecules
thus exposed an essential and specific role for TGF-b during
mesoderm formation in ESCs.
TGFBR2 Degradation Specifically Promotes CardiacLineages in ESCThe procardiac effect of ITD-1 between days 3 and 5 of mESC
differentiation suggested a specific and unappreciated role for
TGF-b in regulating cardiac cell fate (Figures 1B, 1C, 4A, and
4B). SAR analyses showed a strong correlation between
TGF-b inhibition and cardiomyocyte differentiation (R2 = 0.78),
comparable to that between cardiogenesis and mesoderm inhi-
bition (Figures 4C and 4D). Moreover, analysis of Myh6-GFP
-b Selective Inhibitor
at themesodermpatterning stage. Solid line,mesodermdynamics; dotted line,
ith 5 mM ITD-1 over different time windows, normalized to vehicle alone. Note
05 for downregulation compared to DMSO vehicle, *p < 0.05 for upregulation
epresentative day 10Myh6-GFP images of the biphasic effect of ITD-1. Scale
n HEK293T cells through a dose response of ITD-1 and the ACVR1/TGFBR1
in A (D) and TGF-b2 (E).
ence of Activin A (F) or TGF-b2 (G).
F-b2 and Activin A in the SBE4-Luc assay to identify compounds with high
ar analog (ITD-2) are indicated with arrows. Structures of key compounds are
nd TGF-b2 (J) in the SBE4-Luc assay.
M of the indicated compounds, normalized to Activin A alone (100%). *p < 0.05
Lefty1 mRNA levels in Cripto�/� mESCs. *p < 0.05 compared to no Activin A/
nt.
as percent inhibition) of key compounds in the SBE4-Luc assay represented as
n ITD-1-treated HEK293T cells after stimulation with TGF-b or Activin A (N).
3, plotted as percent inhibition (O), *p < 0.05 compared to Activin A; #p < 0.05
after TGF-b2 treatment in the presence of ITD-1 or SB. SFM, serum-free
ule inhibitors in respect to ITD-1 (see also Table S2).
ell Stem Cell 11, 242–252, August 3, 2012 ª2012 Elsevier Inc. 245

0.099 0.045
0.06399.80 102 103 104 105
0
102
103
104
105 2.02 61.8
15.121.10 102 103 104 105
0
102
103
104
105
0 102 103 104 105
0
102
103
104
105 0.53 28.3
15.455.8
TGFBR2-mCherry
2R
BF
GT
-A
H
Empty Vector DMSO ITD-1 5µM
A B C D
E F G
HJ
K
L
DMSO ITD-1 5µM
TGFBR2
ACTB
TG
FB
R2
0.5µ
gT
GF
BR
2 0.
1µg
TG
FB
R2
2µg
TG
FB
R2-
mC
2µg
PG
K-G
FP
TG
FB
R2
0.5µ
gT
GF
BR
2 0.
1µg
TG
FB
R2
2µg
TG
FB
R2-
mC
2µg
PG
K-G
FP
0 102 103 104 105
0
102
103
104
105 DMSOITD-1 5µM
0 102 103 104 105
0
102
103
104
105 ITD-1 5µMITD-1 5µM+CQ 10µM
0 102 103 104 105
0
102
103
104
105 ITD-1 5µMITD-1 5µM+MG 0.1µM/BZ 5nM
ec
ne
cs
er
oul
fo
tu
A
TGFBR2-mCherry
Low High Low High Low High
TG
FB
R1
0.1µ
gT
GF
BR
1 0n
g
TG
FB
R1
0.5µ
gT
GF
BR
1 2µ
g
PG
K-G
FP
TG
FB
R1
0.1µ
gT
GF
BR
1 0n
g
TG
FB
R1
0.5µ
g
TG
FB
R1
2µg
PG
K-G
FP
DMSO ITD-1 5µM
TGFBR1
GAPD
DMSO ITD-1 5µM
TG
FB
R1
0.1µ
g
TG
FB
R1
0ng
TG
FB
R1
0.5µ
g
TG
FB
R1
2µg
PG
K-G
FP
TG
FB
R1
P
ro
te
in
L
ev
el
(N
orm
alize
d to
G
AP
D)
90 80 70 60 50 40 30 20 10 0
DMSO ITD-1 5µM
TG
FB
R2
0.5µ
g
TG
FB
R2
0.1µ
g
TG
FB
R2
2µg
TG
FB
R2-
mC
2µg
PG
K-G
FP
** *
TG
FB
R2
P
ro
te
in
L
ev
el
(N
orm
alize
d to
A
CT
B)
0.35 0.3
0.25 0.2
0.15 0.1
0.05 0
HA-TGFBR2
TGFBR2-mCherry
% T
GF
BR
2 P
ositive C
ells
Time of ITD-1 treatment (h)
0
20
40
60
80
100
120
0 5 10 15 20 25 30
M
R = 0.82
ITD-2
ITDts
ITD-1ITD-1(+)
ITD-1(-)
IC50 for TGF-β2 Inhibition
% H
A-T
GF
BR
2 P
ositive C
ells
0.1 1 10 100
80
70
60
50
40
30
20
10
0
IHA-TGFBR2 TGFBR2-mCherry
IC = 1.05µM
IC = 1.31µM
ITD-1 Concentration (µM)
90 80 70 60 50 40 30 20 10 0
0 1 2 3 4 5 6
% T
GF
BR
2 P
ositive C
ells
0 102 103 104 1050
20
40
60
80
100
0 102 103 104 1050
20
40
60
80
100
0 102 103 104 1050
20
40
60
80
100
0 102 103 104 1050
20
40
60
80
100
0 102 103 104 1050
20
40
60
80
100
0 102 103 104 1050
20
40
60
80
100
ITD-1(-) ITD-1(+)ITD-1
DMSO 1 µM 3 µM 5 µMLegend:
tn
uo
Cl
le
C
2R
BF
GT
-A
H
tn
uo
Cll
eC
yr
re
hC
m-
2R
BF
GT
Fluorescence intensity
ITD-1
293T DLD1 A549
TG
FB
R2
P
ro
te
in
L
ev
el
(N
orm
alize
d to
AC
TB
) 1.2
1
0.8
0.6
0.4
0.2
0
*
+- +- +-
**
TGFBR2
ACTB
ITD-1
293T DLD1 A549+- +- +-
HA
-T
GF
BR
2
CQ 10µM
BZ 5nM
ITD-1 5µM
MG 0.1µM
-
-
-
-
+
-
-
-
-
-
-
+
+
-
-
-
-
-
-
+ +
+
-
-
+
+
-
-
+
+
-
-
0.18
0.16
0.14
0.12
0.10
0.08
0.06
0.04
0.02
0Ra
tio
H
ig
h/L
ow
T
GF
BR
2-m
Ch
erry
C
ells
+
0.20
*
#
#
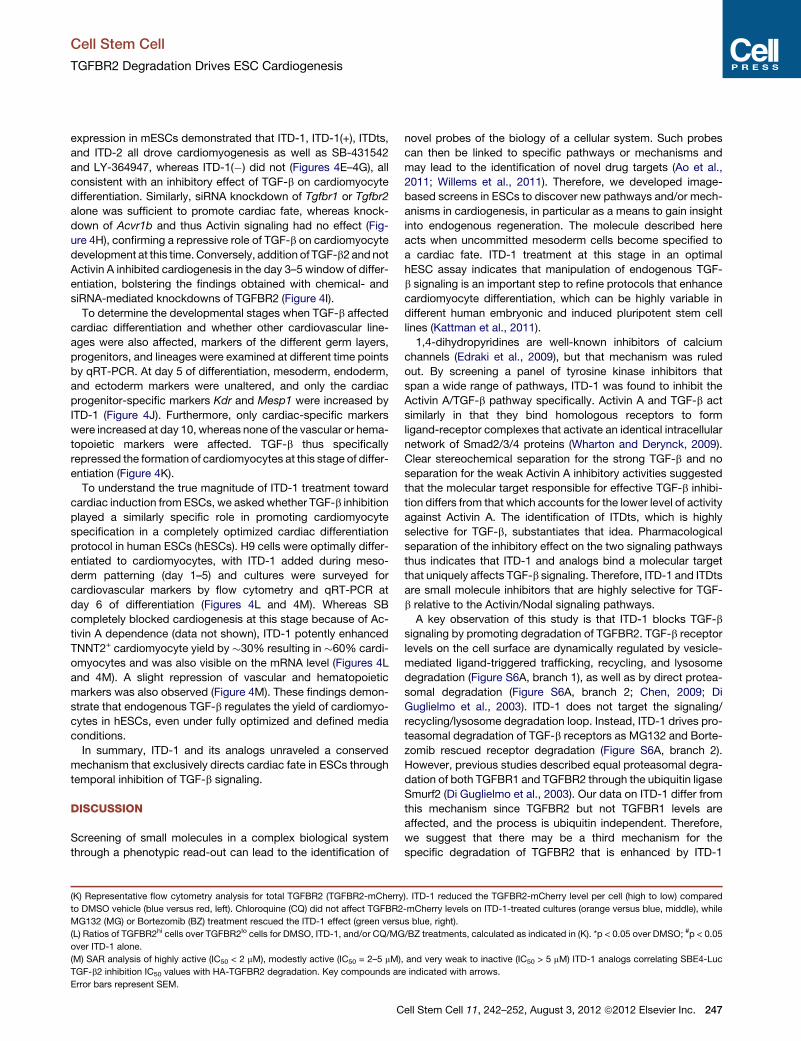
Figure 2. ITD-1 Uniquely Targets TGFBR2 to the Proteasome
(A and B) TGFBR1 protein levels in HEK293T cells, transiently transfected with different amounts of TGFBR1 plasmid and treated for 24 hr with 5 mM ITD-1.
A representative western blot for TGFBR1 with GAPD as normalizing marker (A) and TGFBR1 protein level quantification, normalized for GAPD (B), are shown.
(C and D) Similarly, TGFBR2 and a TGFBR2-mCherry fusion (TGFBR2-mC) were overexpressed and detected by western blot (C) and quantified relative to ACTB
(D) after 24 hr of treatment with 5 mM ITD-1.
(E and F) Endogenous protein levels of TGFBR2 in HEK293T, DLD1, and A549 cells, with or without 5 mM ITD-1. HA-TGFBR2 is shown as blotting control (E).
TGFBR2 protein level quantification, normalized for ACTB (F).
(G) A flow cytometry approach, using an extracellularly HA-tagged TGFBR2-mCherry fusion protein, quantified membrane associated (HA-TGFBR2) as well as
total levels of TGFBR2 (TGFBR2-mCherry) upon ITD-1 treatment. Control and ITD-1-treated samples are shown.
(H and I) Flow cytometry analysis showing the dose-dependent decrease of total (TGFBR2-mCherry) and extracellular TGFBR2 (HA-TGFBR2) for the indicated
compounds. Representative histograms (H) and dose-response curves based on the percentage of TGFBR2+ cells are shown (I).
(J) Time course analysis of ITD-1 on the percentage of TGFBR2+ cells assessed by flow cytometry with analysis for extracellular (HA-TGFBR2) and total
(TGFBR2-mCherry) TGFBR2.
Cell Stem Cell
TGFBR2 Degradation Drives ESC Cardiogenesis
246 Cell Stem Cell 11, 242–252, August 3, 2012 ª2012 Elsevier Inc.
Cell Stem Cell
TGFBR2 Degradation Drives ESC Cardiogenesis
expression in mESCs demonstrated that ITD-1, ITD-1(+), ITDts,
and ITD-2 all drove cardiomyogenesis as well as SB-431542
and LY-364947, whereas ITD-1(�) did not (Figures 4E–4G), all
consistent with an inhibitory effect of TGF-b on cardiomyocyte
differentiation. Similarly, siRNA knockdown of Tgfbr1 or Tgfbr2
alone was sufficient to promote cardiac fate, whereas knock-
down of Acvr1b and thus Activin signaling had no effect (Fig-
ure 4H), confirming a repressive role of TGF-b on cardiomyocyte
development at this time. Conversely, addition of TGF-b2 andnot
Activin A inhibited cardiogenesis in the day 3–5 window of differ-
entiation, bolstering the findings obtained with chemical- and
siRNA-mediated knockdowns of TGFBR2 (Figure 4I).
To determine the developmental stages when TGF-b affected
cardiac differentiation and whether other cardiovascular line-
ages were also affected, markers of the different germ layers,
progenitors, and lineages were examined at different time points
by qRT-PCR. At day 5 of differentiation, mesoderm, endoderm,
and ectoderm markers were unaltered, and only the cardiac
progenitor-specific markers Kdr and Mesp1 were increased by
ITD-1 (Figure 4J). Furthermore, only cardiac-specific markers
were increased at day 10, whereas none of the vascular or hema-
topoietic markers were affected. TGF-b thus specifically
repressed the formation of cardiomyocytes at this stage of differ-
entiation (Figure 4K).
To understand the true magnitude of ITD-1 treatment toward
cardiac induction from ESCs, we askedwhether TGF-b inhibition
played a similarly specific role in promoting cardiomyocyte
specification in a completely optimized cardiac differentiation
protocol in human ESCs (hESCs). H9 cells were optimally differ-
entiated to cardiomyocytes, with ITD-1 added during meso-
derm patterning (day 1–5) and cultures were surveyed for
cardiovascular markers by flow cytometry and qRT-PCR at
day 6 of differentiation (Figures 4L and 4M). Whereas SB
completely blocked cardiogenesis at this stage because of Ac-
tivin A dependence (data not shown), ITD-1 potently enhanced
TNNT2+ cardiomyocyte yield by �30% resulting in �60% cardi-
omyocytes and was also visible on the mRNA level (Figures 4L
and 4M). A slight repression of vascular and hematopoietic
markers was also observed (Figure 4M). These findings demon-
strate that endogenous TGF-b regulates the yield of cardiomyo-
cytes in hESCs, even under fully optimized and defined media
conditions.
In summary, ITD-1 and its analogs unraveled a conserved
mechanism that exclusively directs cardiac fate in ESCs through
temporal inhibition of TGF-b signaling.
DISCUSSION
Screening of small molecules in a complex biological system
through a phenotypic read-out can lead to the identification of
(K) Representative flow cytometry analysis for total TGFBR2 (TGFBR2-mCherry
to DMSO vehicle (blue versus red, left). Chloroquine (CQ) did not affect TGFBR2
MG132 (MG) or Bortezomib (BZ) treatment rescued the ITD-1 effect (green versu
(L) Ratios of TGFBR2hi cells over TGFBR2lo cells for DMSO, ITD-1, and/or CQ/MG
over ITD-1 alone.
(M) SAR analysis of highly active (IC50 < 2 mM), modestly active (IC50 = 2–5 mM)
TGF-b2 inhibition IC50 values with HA-TGFBR2 degradation. Key compounds ar
Error bars represent SEM.
C
novel probes of the biology of a cellular system. Such probes
can then be linked to specific pathways or mechanisms and
may lead to the identification of novel drug targets (Ao et al.,
2011; Willems et al., 2011). Therefore, we developed image-
based screens in ESCs to discover new pathways and/or mech-
anisms in cardiogenesis, in particular as a means to gain insight
into endogenous regeneration. The molecule described here
acts when uncommitted mesoderm cells become specified to
a cardiac fate. ITD-1 treatment at this stage in an optimal
hESC assay indicates that manipulation of endogenous TGF-
b signaling is an important step to refine protocols that enhance
cardiomyocyte differentiation, which can be highly variable in
different human embryonic and induced pluripotent stem cell
lines (Kattman et al., 2011).
1,4-dihydropyridines are well-known inhibitors of calcium
channels (Edraki et al., 2009), but that mechanism was ruled
out. By screening a panel of tyrosine kinase inhibitors that
span a wide range of pathways, ITD-1 was found to inhibit the
Activin A/TGF-b pathway specifically. Activin A and TGF-b act
similarly in that they bind homologous receptors to form
ligand-receptor complexes that activate an identical intracellular
network of Smad2/3/4 proteins (Wharton and Derynck, 2009).
Clear stereochemical separation for the strong TGF-b and no
separation for the weak Activin A inhibitory activities suggested
that the molecular target responsible for effective TGF-b inhibi-
tion differs from that which accounts for the lower level of activity
against Activin A. The identification of ITDts, which is highly
selective for TGF-b, substantiates that idea. Pharmacological
separation of the inhibitory effect on the two signaling pathways
thus indicates that ITD-1 and analogs bind a molecular target
that uniquely affects TGF-b signaling. Therefore, ITD-1 and ITDts
are small molecule inhibitors that are highly selective for TGF-
b relative to the Activin/Nodal signaling pathways.
A key observation of this study is that ITD-1 blocks TGF-b
signaling by promoting degradation of TGFBR2. TGF-b receptor
levels on the cell surface are dynamically regulated by vesicle-
mediated ligand-triggered trafficking, recycling, and lysosome
degradation (Figure S6A, branch 1), as well as by direct protea-
somal degradation (Figure S6A, branch 2; Chen, 2009; Di
Guglielmo et al., 2003). ITD-1 does not target the signaling/
recycling/lysosome degradation loop. Instead, ITD-1 drives pro-
teasomal degradation of TGF-b receptors as MG132 and Borte-
zomib rescued receptor degradation (Figure S6A, branch 2).
However, previous studies described equal proteasomal degra-
dation of both TGFBR1 and TGFBR2 through the ubiquitin ligase
Smurf2 (Di Guglielmo et al., 2003). Our data on ITD-1 differ from
this mechanism since TGFBR2 but not TGFBR1 levels are
affected, and the process is ubiquitin independent. Therefore,
we suggest that there may be a third mechanism for the
specific degradation of TGFBR2 that is enhanced by ITD-1
). ITD-1 reduced the TGFBR2-mCherry level per cell (high to low) compared
-mCherry levels on ITD-1-treated cultures (orange versus blue, middle), while
s blue, right).
/BZ treatments, calculated as indicated in (K). *p < 0.05 over DMSO; #p < 0.05
, and very weak to inactive (IC50 > 5 mM) ITD-1 analogs correlating SBE4-Luc
e indicated with arrows.
ell Stem Cell 11, 242–252, August 3, 2012 ª2012 Elsevier Inc. 247
0
10
20
30
40
50
60
70
80
0 1 2 3 4 5 6
% T
-G
FP
P
os
itiv
e C
ells
Concentration ( M)
DM
SB
IWP
ITD-1
LY
0
10
20
30
40
50
60
70
80
90
0 1 2 3 4 5 6
% T
-G
FP
P
ositive C
ells
Concentration ( M)
ITD-1
ITD-2
ITDts
GF
A
D
H
I
C
J
TGF-β2
E
0
10
20
30
40
50
60
70
80
0 1 2 3 4
%T
-G
FP
P
os
itiv
e C
ells
Concentration ( M)
ITD-1(+)ITD-1(-)ITD-1
R = 0.77
-20
0
20
40
60
80
100
-20 0 20 40 60 80
% M
eso
derm
In
hib
itio
n
β2 Inhibition
ITD-1
ITD-1(-)
ITD-1(+)
ITD-2
ITDts
100
d4
T-GFP FC
d10d7d5d3d1d0
ESC Plating
RT-qPCR RT-qPCR
MesodermInhibition
B
mR
NA
le
ve
ls
(F
old
o
ve
r D
MS
O)
Day 515
10
5
1
-5
-10
-15
-20
T Kdr
Mesp1
Sox17
Sox1
Myh6
mR
NA
le
ve
ls
(F
old
o
ve
r D
MS
O)
Day 1018
14
10
6
21
-2
-6-8
16
12
8
4
-4
Cdh5
Acta2
CD34
Pax6
T-GFP
Ce
ll C
ou
nt
ITD-10 µM1 µM5 µM
SB0 µM1 µM5 µM
IWP0 µM1 µM5 µM
DM0 µM1 µM5 µM
T m
RN
A L
ev
el
(F
old
o
ver D
MS
O)
T m
RN
A L
ev
el
(F
old
o
ver D
MS
O)
10000
1000
100
10
1Activin A
ITD-1 1µMITD-1 3µM
SB 5µM
ITD-1 1µMITD-1 3µM
SB 5µM
500
450
400350300
250
200150
10050
0
% TGF-
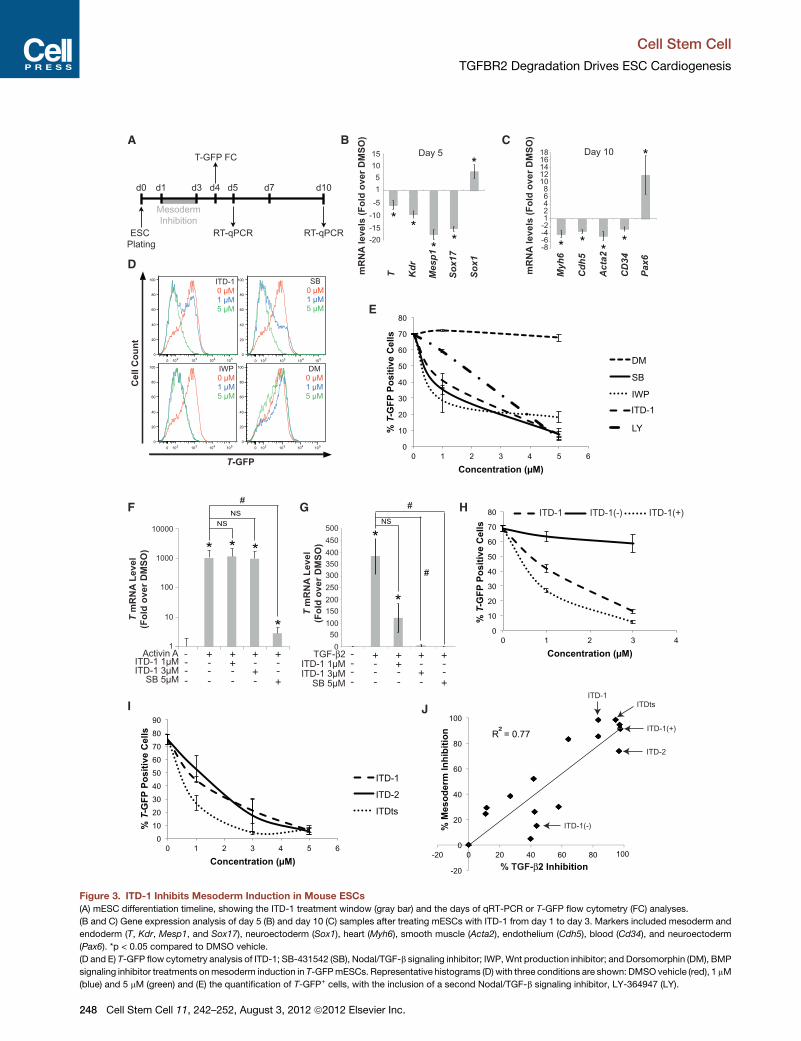
Figure 3. ITD-1 Inhibits Mesoderm Induction in Mouse ESCs
(A) mESC differentiation timeline, showing the ITD-1 treatment window (gray bar) and the days of qRT-PCR or T-GFP flow cytometry (FC) analyses.
(B and C) Gene expression analysis of day 5 (B) and day 10 (C) samples after treating mESCs with ITD-1 from day 1 to day 3. Markers included mesoderm and
endoderm (T, Kdr, Mesp1, and Sox17), neuroectoderm (Sox1), heart (Myh6), smooth muscle (Acta2), endothelium (Cdh5), blood (Cd34), and neuroectoderm
(Pax6). *p < 0.05 compared to DMSO vehicle.
(D and E) T-GFP flow cytometry analysis of ITD-1; SB-431542 (SB), Nodal/TGF-b signaling inhibitor; IWP,Wnt production inhibitor; and Dorsomorphin (DM), BMP
signaling inhibitor treatments onmesoderm induction in T-GFPmESCs. Representative histograms (D) with three conditions are shown: DMSOvehicle (red), 1 mM
(blue) and 5 mM (green) and (E) the quantification of T-GFP+ cells, with the inclusion of a second Nodal/TGF-b signaling inhibitor, LY-364947 (LY).
Cell Stem Cell
TGFBR2 Degradation Drives ESC Cardiogenesis
248 Cell Stem Cell 11, 242–252, August 3, 2012 ª2012 Elsevier Inc.

Cell Stem Cell
TGFBR2 Degradation Drives ESC Cardiogenesis
(Figure S6A, branch 3). Although the direct target of ITD-1
remains to be elucidated, several groups have reported different
half lives for TGFBR1 and TGFBR2, consistent with the idea
that distinct degradation processes may exist to clear these
receptors from the cell surface (Wells et al., 1997). It remains
possible that ITD-1 directly binds TGFBR2 to drive its internali-
zation and degradation. Interestingly, TGFBR2 appears to be
exclusively downregulated in several human cancers, and in
renal carcinomas this reduction has been attributed to increased
proteasomal degradation (Fukasawa et al., 2010; Meng et al.,
2011). ITD-1 might therefore be useful as a probe to understand
how the altered dynamics of TGFBR2 trafficking contributes to
cancer.
Through itshighselectivity forTGF-b, ITD-1 revealedabiphasic
role of TGF-b signaling in ESC cardiogenesis (Figure S6B). When
applied early in the differentiation process, ITD-1 prevented
mesoderm formation and enhanced neuroectodermal fates. A
direct role for TGF-b in mesoderm induction was unanticipated
becauseNodal (andActivin A) andWnt are thought to be the prin-
cipal effectors of the mesoderm and neuroectoderm fate choice
in ESCs and mouse embryos (Naito et al., 2006; Perea-Gomez
et al., 2002). TGF-b is expressed in differentiating ESCs and
embryos and can induce mesoderm if provided exogenously,
butTgfbr1- andTgfbr2-null embryosdo formmesoderm (Larsson
et al., 2001;Oshima et al., 1996). Thus, our data provide evidence
for the requirement of TGF-b in mesoderm/neuroectoderm
induction in mESCs and potentially in embryos, although
compensatory and/or other mechanisms may allow mesoderm
formation in Tgfbr1 and Tgfbr2 mutant embryos.
Additionally, ITD-1 stimulated cardiomyocyte differentiation
from uncommitted mesodermal progenitors in mouse and
human ESCs, indicating that TGF-b represses cardiac fate at
this developmental stage. Interestingly, inhibition of the TGF-
b signaling pathway at this time did not increase vascular smooth
muscle or endothelial markers or cell number, further substanti-
ating the idea that ITD-1 specifically stimulated cardiac differen-
tiation from a cardiovascular progenitor (Figure S6B, light blue
cell). In addition, TGF-b inhibition continues to enhance cardio-
genesis at considerably later stages (>day 8) by enhancing prolif-
eration of immature cardiomyocytes (Kitamura et al., 2007). In
embryos, TGF-b ligands are expressed in the newly forming
cardiac crescent where cardiomyocyte-committed cells arise
and may thus naturally contribute to the proper apportioning of
cardiomyocyte versus other cardiovascular lineages (Dickson
et al., 1993; Kitamura et al., 2007).
In summary, a phenotypic screen of ESC cardiogenesis
yielded ITD-1, which is a selective TGF-b inhibitor. ITD-1 acts
by stimulating clearance of TGFBR2 from the cell surface and
subsequent proteasomal degradation. The chemical biology
approach revealed that TGF-b plays a critical, biphasic role in
the formation of cardiovascular derivatives from ESCs, first by
promoting mesoderm induction and subsequently by inhibiting
(F and G) T gene expression in Cripto�/� mESCs to assess whether ITD-1 can b
compared to no Activin A/TGF-b2 control; #p < 0.05 compared to Activin A/TGF
(H and I) Flow cytometry quantification of T-GFP+ cells after treating with ITD-1 e
(J) SAR profile spanning a wide activity range of ITD-1 analogs, correlating TG
(calculated from T-GFP flow cytometry analyses). Key compounds are indicated
Error bars represent SEM.
C
cardiomyocyte differentiation specifically. Moreover, ITD-1 is
a potentially valuable reagent, not only to study ESC differentia-
tion, but also to probe the role of TGF-b signaling in pathological
processes such as cancer, fibrosis, and adult cardiovascular
disease.
EXPERIMENTAL PROCEDURES
Embryonic Stem Cell Culture and Differentiation Assays
mESC lines CGR8 carrying a Myh6-GFP, J1 carrying a T-GFP reporter, and
Cripto�/� ESCs were maintained as described in Supplemental Experimental
Procedures.
For screening, Myh6-GFP ESCs were seeded and differentiated in
384-well plates. About 17,000 compounds from the DIVERSet library
(Chembridge) were added from day 2 to day 6 of differentiation. ITD-1,
SB-431542 (Sigma), LY-364947 (Cayman Chemical), and tyrosine kinase
inhibitor panel (EMD/Millipore) treatments were performed as indicated.
Myh6-GFP-positive cells were imaged on an InCell 1000 System (GE Health-
care) and GFP levels from images were quantified with Cyteseer (Vala
Sciences).
Mesoderm inhibition assays with T-GFP and Myh6-GFP cells were per-
formed as suspension cultures in serum-containing media. Embryoid bodies
(EBs) formed in differentiation media were exposed to ITDs, SB-431542,
LY-364947, Dorsomorphin (Tocris), or IWP (EMD/Millipore) at day 1 of
differentiation.
For the Cripto�/� mESC assay, cells were transferred to serum-free condi-
tions and were treated at day 2 of EB formation with Wnt3a, 15 ng/ml
TGF-b2 (EMD/Millipore), 10 ng/ml BMP4 (R&D Systems), or 15 ng/ml Activin
A (R&D Systems) in the presence of indicated compounds.
H9 hESC were differentiated as EBs in StemPro34 (GIBCO) in ultra-low
attachment plates. EBs were optimally differentiated with BMP4, Activin A,
bFGF (Sigma), VEGF (R&D Systems), and DKK1 (R&D Systems) as described
(Kattman et al., 2011), with addition of ITD-1 from day 1 to day 5.
Quantitative Reverse-Transcription PCR
cDNA samples, synthetized from total RNA with the Quantitect RT kit
(QIAGEN), were run on a LightCycler 480 (Roche) with LC480 Sybr Green
master mix (Roche). Primers are available at http://www.rtprimerdb.org/ and
primer ID numbers are listed in Supplemental Experimental Procedures.
SBE4-Luciferase Assays
HEK293T cells, grown in DMEM-high glucose with 1% FBS, were transfected
with SBE4-Luciferase plasmid and CMV-Renilla-Luciferase with Lipofect-
amine 2000 (Invitrogen). After 12 hr of adhesion, cells were induced with either
TGF-b2 (15 ng/ml) or Activin A (15 ng/ml) and inhibitors were added simulta-
neously. Luminescence was measured through the Dual-Glo kit (Promega).
Receptor Degradation Assays
TGFBR1, extracellularly HA-tagged TGFBR2, HA-TGFBR2-mCherry fusions,
pcDNA3.1, or PGK-GFP plasmids were transfected in HEK293T as above
and treated >6 hr later with ITD-1 for the indicated time points. Chloroquine
(Sigma), Bortezomib (Selleck Chemicals), or MG132 (Sigma) were added
3 hr after ITD-1 treatment.
Flow Cytometry
Cultures were dissociated with enzyme-free cell dissociation buffer (GIBCO)
(or trypsin for cardiomyocytes) and analyzed on a FACSCanto or LSRFortessa
(BD Biosciences). For intracellular stains, cells were permeabilized with
saponin (Sigma) before staining. Single cells were stained for 30 min with
lock the ability of Activin A (F) or TGF-b2 (G) to induce mesoderm. *p < 0.05
-b2 alone; NS, not significant.
nantiomers (H) and TGF-b selective compounds (I).
F-b2 inhibition (calculated from SBE4-Luc assays) with mesoderm inhibition
by arrows.
ell Stem Cell 11, 242–252, August 3, 2012 ª2012 Elsevier Inc. 249
0
10
20
30
40
50
60
70
% T
NN
T2
h
um
an
c
ard
io
my
oc
yte
s
DM
SO
ITD
-1
+
Myh6
m
RN
A le
ve
l (F
old
o
ve
r s
iC
on
)
siTgfbr2
siTgfbr1
siAcvr1b
siC
on
4.5
4.0
3.5
3.0
2.5
2.0
1.5
1.0
0.5
0.0
A B C
D E F
I
d0 d1 d3 d5 d7 d10
ESCPlating
RT-qPCR Myh6-GFP, Imaging, FC, RT-qPCR
CardiacInduction
Myh6
-G
FP
L
ev
el
(F
old
o
ve
r D
MS
O) 50
40
30
20
10
0-1.5 -1.0 -0.5 0.0 0.5 1.0
Log ITD-1 Concentration (µM)
EC50 = 1.77µM
Im
ag
e-b
as
ed
Myh6-GFP
Pe
ca
m1
Gating Control DMSO
ITD-1 5µM
0 0
0
00.53±0.15
1.26±0.73
00.54±0.18
4.26±1.09
J K
Day 5
mR
NA
L
ev
els
(F
old
o
ve
r D
MS
O)
109876543210
T Sox17
Sox1
Kdr
Mesp1
Day 10
mR
NA
L
ev
els
(F
old
o
ve
r D
MS
O)
8
7
6
5
4
3
2
1
0
Nkx2.5
Mef2c
Myh6
Pecam1
Cdh5
Acta2
Hbb-y
Cd34
ITD-1: hESC90
85
75
70
10
5
1
-5
-10mR
NA
L
ev
els
(F
old
o
ve
r D
MS
O)
NKX2.5
MYH6
TNNT2
PECAM1
CD34
ACTA1
ITD
-1 5
µM
ITD
-1(-
) 5µ
M
ITD
-1(+
) 5µ
M
ITD
-2 2
.5µM
ITD
ts 5
µM
SB
1µM
Myh6
-G
FP
P
os
itiv
e C
ell C
ou
nt
(F
old
o
ve
r D
MS
O)
0
0.5
1
1.5
2
2.5
3
3.5
4
4.5
5
*
**
**
GH
R = 0.78ITD-1
ITD-1(+)
ITD-1(-)
ITD-2
ITDts
% C
ard
ia
c In
du
ctio
n
% TGF-β2 Inhibition
160
140
120
100
80
60
40
20
0 20 40 60 80 100
R = 0.93 ITD-1
ITDts
ITD-1(+)
ITD-2ITD-1(-)
160
140
120
100
80
60
40
20
0 20 40 60 80 100
% C
ard
ia
c In
du
ctio
n
% Mesoderm Inhibition
80
70
60
50
40
30
20
10
0
*
*
* *
**
Myh6
-G
FP
L
ev
el (F
old
o
ve
r D
MS
O)
Im
ag
e-b
as
ed
ITD
-1 5
µM
ITD
-1(-
) 5µ
M
ITD
-1(+
) 5µ
M
ITD
-2 2
.5µM
ITD
ts 5
µM
LY 0
.25µ
M
SB
1µM
Myh6
-G
FP
L
ev
el
(F
old
o
ve
r P
BS
)
**
TG
F-β
2 15
ng/m
l
PB
S
Act
A 1
5ng/
ml
TG
F-β
2 15
ng/m
l
PB
S
Act
A 1
5ng/
ml
Myh6
-G
FP
P
os
itiv
e
C
ell C
ou
nt
(F
old
o
ve
r P
BS
)
2.5 2.0
1.5
1.0 0.5 0.0
2.0
1.5
1.0
0.5
0.0 Im
ag
e-b
as
ed
ML
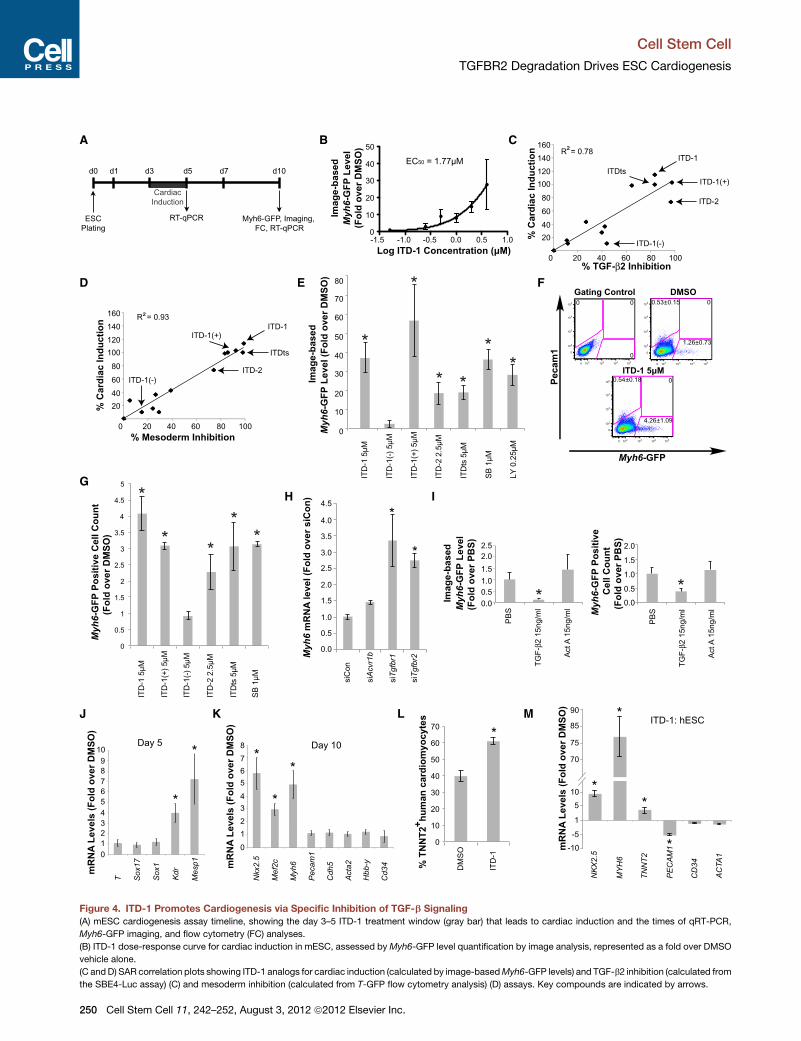
Figure 4. ITD-1 Promotes Cardiogenesis via Specific Inhibition of TGF-b Signaling
(A) mESC cardiogenesis assay timeline, showing the day 3–5 ITD-1 treatment window (gray bar) that leads to cardiac induction and the times of qRT-PCR,
Myh6-GFP imaging, and flow cytometry (FC) analyses.
(B) ITD-1 dose-response curve for cardiac induction in mESC, assessed byMyh6-GFP level quantification by image analysis, represented as a fold over DMSO
vehicle alone.
(C andD) SAR correlation plots showing ITD-1 analogs for cardiac induction (calculated by image-basedMyh6-GFP levels) and TGF-b2 inhibition (calculated from
the SBE4-Luc assay) (C) and mesoderm inhibition (calculated from T-GFP flow cytometry analysis) (D) assays. Key compounds are indicated by arrows.
Cell Stem Cell
TGFBR2 Degradation Drives ESC Cardiogenesis
250 Cell Stem Cell 11, 242–252, August 3, 2012 ª2012 Elsevier Inc.

Cell Stem Cell
TGFBR2 Degradation Drives ESC Cardiogenesis
indicated antibodies, which are listed in the Supplemental Experimental
Procedures. FlowJo (Treestar) was used for data analysis.
Western Blotting
Cells were washed in cold PBS, collected with enzyme-free dissociation
buffer, and lysed with ice-cold RIPA buffer supplemented with protease and
phosphatase inhibitors (Sigma). Lysates were run on 10% SDS-tris glycine
gels (Invitrogen) and transferred to 45 mm PVDF membranes, which were
blocked and stained in 5% w/v skim milk in TBST. Detection was performed
with the ECL Plus detection kit (Abcam) or with an Odyssey system (LICOR).
Antibodies are listed in the Supplemental Experimental Procedures.
Statistic Analysis of Samples
All data are represented as the mean with error bars indicating SEM for at least
three biological replicates; p values were obtained by a Student’s t test. Dose
response curve fitting and EC50/IC50 calculation using the (log)agonist versus
normalized response equation for induction and the (log)inhibitor versus
normalized response equation for inhibition were done in Prism 5 (GraphPad
Software). Toxic doses were removed from EC50 or IC50 analysis, as judged
by Renilla luciferase levels, Alamar Blue cell viability assays, or microscopy.
SUPPLEMENTAL INFORMATION
Supplemental Information includes Supplemental Experimental Procedures,
six figures, two tables, and one movie and can be found with this article online
at http://dx.doi.org/10.1016/j.stem.2012.04.025.
ACKNOWLEDGMENTS
The authors would like to thank Fabio Cerignoli and Karl Willert for running
calcium transient assays and Wnt TOPflash assays, respectively. This work
was supported by CIRM T2-00004 and AHA fellowship to E.W., German
Research Foundation Grant SCHA 1663/1-1 to D.S., NIH HL088293 and
MINECO to J.C.I.B., CIRM Seed RS-00169-1 and T Foundation to J.C.,
CIRM RC1-000132 and NIH HL059502 to M.M., and NIH STTR
R41-HL108714 to ChemRegen Inc. E.W., M.M., and J.C. are cofounders of
ChemRegen, Inc.
Received: December 2, 2011
Revised: March 28, 2012
Accepted: April 19, 2012
Published: August 2, 2012
REFERENCES
Ao, A., Hao, J., and Hong, C.C. (2011). Regenerative chemical biology: current
challenges and future potential. Chem. Biol. 18, 413–424.
Behfar, A., Zingman, L.V., Hodgson, D.M., Rauzier, J.M., Kane, G.C., Terzic,
A., and Puceat, M. (2002). Stem cell differentiation requires a paracrine
pathway in the heart. FASEB J. 16, 1558–1566.
(E) Quantification of image-based Myh6-GFP levels induced by indicated compo
LY-364947. *p < 0.05 compared to DMSO vehicle.
(F) Representative flow cytometry analysis forMyh6-GFP+ cardiomyocytes and Pe
positive cells (average ± SEM).
(G) Fold increase in the number of Myh6-GFP+ cells quantified as in (F) for the in
(H) The effect of siRNAs to Acvr1, Tgfbr1, and Tgfbr2 on Myh6 mRNA induction
(I) Image based Myh6-GFP quantification (left) and flow cytometry quantificatio
represented as fold over PBS vehicle alone. *p < 0.05 compared to PBS vehicle
(J and K) Gene expression analysis of day 5 (B) and day 10 (C) samples after tre
endoderm (T, Kdr, Mesp1, and Sox17), neuroectoderm (Sox1), cardiac lineages
and blood progenitors (Hbb-y, Cd34). *p < 0.05 compared to DMSO vehicle.
(L and M) hESC cultures were exposed to ITD-1 from day 1 to day 5 and were
differentiation (L) and were analyzed for gene expression indicative of cardiac (NK
muscle (ACTA1) cells by qRT-PCR (M). *p < 0.05 compared to DMSO vehicle.
Error bars represent SEM.
C
Burridge, P.W., Keller, G., Gold, J.D., and Wu, J.C. (2012). Production of de
novo cardiomyocytes: human pluripotent stem cell differentiation and direct
reprogramming. Cell Stem Cell 10, 16–28.
Chen, Y.G. (2009). Endocytic regulation of TGF-beta signaling. Cell Res. 19,
58–70.
Di Guglielmo, G.M., Le Roy, C., Goodfellow, A.F., and Wrana, J.L. (2003).
Distinct endocytic pathways regulate TGF-beta receptor signalling and turn-
over. Nat. Cell Biol. 5, 410–421.
Dickson, M.C., Slager, H.G., Duffie, E., Mummery, C.L., and Akhurst, R.J.
(1993). RNA and protein localisations of TGF beta 2 in the early mouse
embryo suggest an involvement in cardiac development. Development 117,
625–639.
Edraki, N., Mehdipour, A.R., Khoshneviszadeh, M., and Miri, R. (2009).
Dihydropyridines: evaluation of their current and future pharmacological appli-
cations. Drug Discov. Today 14, 1058–1066.
Fukasawa, H., Yamamoto, T., Fujigaki, Y., Misaki, T., Ohashi, N., Takayama,
T., Suzuki, S., Mugiya, S., Oda, T., Uchida, C., et al. (2010). Reduction of trans-
forming growth factor-beta type II receptor is caused by the enhanced ubiqui-
tin-dependent degradation in human renal cell carcinoma. Int. J. Cancer 127,
1517–1525.
Kattman, S.J., Witty, A.D., Gagliardi, M., Dubois, N.C., Niapour, M., Hotta, A.,
Ellis, J., and Keller, G. (2011). Stage-specific optimization of activin/nodal and
BMP signaling promotes cardiac differentiation of mouse and human pluripo-
tent stem cell lines. Cell Stem Cell 8, 228–240.
Kitamura, R., Takahashi, T., Nakajima, N., Isodono, K., Asada, S., Ueno, H.,
Ueyama, T., Yoshikawa, T., Matsubara, H., and Oh, H. (2007). Stage-specific
role of endogenous Smad2 activation in cardiomyogenesis of embryonic stem
cells. Circ. Res. 101, 78–87.
Larsson, J., Goumans, M.J., Sjostrand, L.J., van Rooijen, M.A., Ward, D.,
Leveen, P., Xu, X., ten Dijke, P., Mummery, C.L., and Karlsson, S. (2001).
Abnormal angiogenesis but intact hematopoietic potential in TGF-beta type I
receptor-deficient mice. EMBO J. 20, 1663–1673.
Meng, W., Xia, Q., Wu, L., Chen, S., He, X., Zhang, L., Gao, Q., and Zhou, H.
(2011). Downregulation of TGF-beta receptor types II and III in oral squamous
cell carcinoma and oral carcinoma-associated fibroblasts. BMC Cancer
11, 88.
Naito, A.T., Shiojima, I., Akazawa, H., Hidaka, K., Morisaki, T., Kikuchi, A., and
Komuro, I. (2006). Developmental stage-specific biphasic roles of Wnt/beta-
catenin signaling in cardiomyogenesis and hematopoiesis. Proc. Natl. Acad.
Sci. USA 103, 19812–19817.
Oshima, M., Oshima, H., and Taketo, M.M. (1996). TGF-beta receptor type II
deficiency results in defects of yolk sac hematopoiesis and vasculogenesis.
Dev. Biol. 179, 297–302.
Perea-Gomez, A., Vella, F.D., Shawlot, W., Oulad-Abdelghani, M., Chazaud,
C., Meno, C., Pfister, V., Chen, L., Robertson, E., Hamada, H., et al. (2002).
Nodal antagonists in the anterior visceral endoderm prevent the formation of
multiple primitive streaks. Dev. Cell 3, 745–756.
unds and represented as fold over DMSO vehicle alone. SB, SB-431542; LY,
cam1+ endothelial cells after treatment with ITD-1. Numbers represent percent
dicated compounds. *p < 0.05 compared to DMSO vehicle.
at day 10. *p < 0.05 compared to siControl (siCon).
n (right) of ESC cultures treated with TGF-b2 or Activin A from day 3–5, both
.
atment of mESCs with ITD-1 from day 3–5. Markers included mesoderm and
(Nkx2.5, Mef2c, Myh6), endothelium (Pecam1, Cdh5), smooth muscle (Acta2),
analyzed by flow cytometry for TNNT2+ cardiomyocyte number on day 6 of
X2.5,MYH6, TNNT2), vascular endothelial (CD31), blood (CD34), and skeletal
ell Stem Cell 11, 242–252, August 3, 2012 ª2012 Elsevier Inc. 251
Cell Stem Cell
TGFBR2 Degradation Drives ESC Cardiogenesis
Sturzu, A.C., and Wu, S.M. (2011). Developmental and regenerative biology
of multipotent cardiovascular progenitor cells. Circ. Res. 108, 353–364.
Wells, R.G., Yankelev, H., Lin, H.Y., and Lodish, H.F. (1997). Biosynthesis of
the type I and type II TGF-beta receptors. Implications for complex formation.
J. Biol. Chem. 272, 11444–11451.
Wharton, K., and Derynck, R. (2009). TGFbeta family signaling: novel insights
in development and disease. Development 136, 3691–3697.
252 Cell Stem Cell 11, 242–252, August 3, 2012 ª2012 Elsevier Inc.
Willems, E., Lanier, M., Forte, E., Lo, F., Cashman, J., and Mercola, M. (2011).
A chemical biology approach to myocardial regeneration. J. Cardiovasc.
Transl. Res. 4, 340–350.
Yuasa, S., Itabashi, Y., Koshimizu, U., Tanaka, T., Sugimura, K., Kinoshita, M.,
Hattori, F., Fukami, S., Shimazaki, T., Ogawa, S., et al. (2005). Transient inhibi-
tion of BMP signaling by Noggin induces cardiomyocyte differentiation of
mouse embryonic stem cells. Nat. Biotechnol. 23, 607–611.