Cell Stem Cell Resource - Massachusetts Institute of...
14
Cell Stem Cell Resource The Transcriptional Landscape of Hematopoietic Stem Cell Ontogeny Shannon McKinney-Freeman, 1,2,12 Patrick Cahan, 1,12 Hu Li, 3,4,12 Scott A. Lacadie, 1 Hsuan-Ting Huang, 1 Matthew Curran, 1 Sabine Loewer, 1 Olaia Naveiras, 1 Katie L. Kathrein, 1 Martina Konantz, 5,6 Erin M. Langdon, 1 Claudia Lengerke, 5 Leonard I. Zon, 1,7,8,9 James J. Collins, 3,4,7 and George Q. Daley 1,7,8,10,11, * 1 Division of Pediatric Hematology/Oncology, Children’s Hospital Boston and Harvard Medical School, Harvard Stem Cell Institute, Boston, MA 02115, USA 2 Department of Hematology, St. Jude Children’s Research Hospital, Memphis, TN 38105, USA 3 Department of Biomedical Engineering, Center for BioDynamics and Center for Advanced Biotechnology, Boston University, Boston, MA 02215, USA 4 Wyss Institute for Biologically Inspired Engineering, Harvard University, Boston, MA 02115, USA 5 Division of Hematology and Oncology, University of Tuebingen Medical Center II, 72076 Tuebingen, Germany 6 Max Planck Institute for Developmental Biology, Department III – Genetics, Spemannstrasse 35, 72076 Tuebingen, Germany 7 Howard Hughes Medical Institute 8 Stem Cell Transplantation Program and Children’s Hospital Boston, Boston, MA 02115, USA 9 Dana Farber Cancer Institute, Boston, MA 02115, USA 10 Division of Hematology, Brigham and Women’s Hospital, Boston, MA 02115, USA 11 Department of Biological Chemistry and Molecular Pharmacology, Harvard Medical School, Broad Institute, Boston, MA 02115, USA 12 These authors contributed equally to this work *Correspondence: [email protected] http://dx.doi.org/10.1016/j.stem.2012.07.018 SUMMARY Transcriptome analysis of adult hematopoietic stem cells (HSCs) and their progeny has revealed mecha- nisms of blood differentiation and leukemogenesis, but a similar analysis of HSC development is lacking. Here, we acquired the transcriptomes of developing HSCs purified from >2,500 murine embryos and adult mice. We found that embryonic hematopoietic elements clustered into three distinct transcriptional states characteristic of the definitive yolk sac, HSCs undergoing specification, and definitive HSCs. We applied a network-biology-based analysis to recon- struct the gene regulatory networks of sequential stages of HSC development and functionally vali- dated candidate transcriptional regulators of HSC ontogeny by morpholino-mediated knockdown in zebrafish embryos. Moreover, we found that HSCs from in vitro differentiated embryonic stem cells closely resemble definitive HSCs, yet lack a Notch- signaling signature, likely accounting for their defec- tive lymphopoiesis. Our analysis and web resource will enhance efforts to identify regulators of HSC ontogeny and facilitate the engineering of hemato- poietic specification. INTRODUCTION Hematopoietic stem cells (HSCs) have been extensively analyzed via global transcriptional profiling, which has yielded novel insights into their unique biology (Seita and Weissman, 2010). A recent examination of human HSCs and their progeny revealed both hematopoietic cell-type specific and ‘‘reused’’ transcriptional programs (Novershtern et al., 2011). A similarly comprehensive examination of the transcriptome of embryonic HSCs is absent from the literature, largely due to the practical difficulties of prospectively isolating sufficient quantities of highly purified HSCs and precursors from embryos (Godin and Cumano, 2002). The description of Sox17 as a disparate regu- lator of fetal versus adult HSCs indicates that distinct molecular pathways likely govern different stages of HSC development (Kim et al., 2007). A deep understanding of the molecular regula- tion of HSC ontogeny would inform efforts to expand HSCs in vitro and induce HSC generation during pluripotent stem cell (PSC) differentiation, as well as illuminate novel disease-causing genes. Definitive adult-type HSCs are born in the E10.5 aorta- gonads-mesonephros (AGM), and thereafter migrate to the fetal liver (FL), placenta, and bone marrow (Medvinsky et al., 2011). HSCs apparently emerge from a subset of endothelial cells in the ventral aspect of the dorsal aorta (recently reviewed in detail; Medvinsky et al., 2011). Imaging reveals the dramatic ‘‘bending’’ of hemogenic endothelial cells as they move into the aortic space (Kissa and Herbomel, 2010). Although these emergent cells have not been directly demonstrated to be functional HSCs, the preponderance of evidence indicates that definitive HSCs arise from hemogenic endothelium. Directed differentiation of PSCs to specific lineages for research and cell therapy is a major goal of stem cell biology. Nearly 2 decades of effort has not yielded robust, definitive HSCs from PSCs (McKinney-Freeman and Daley, 2007). Ectopic expression of the homeotic genes HoxB4 and Cdx4 produced cells that reconstituted multilineage hematopoiesis in lethally irradiated primary and secondary mice (Kyba et al., 2002; Wang et al., 2005b). Although this approach generated Cell Stem Cell 11, 701–714, November 2, 2012 ª2012 Elsevier Inc. 701
Transcript of Cell Stem Cell Resource - Massachusetts Institute of...
Cell Stem Cell
Resource
The Transcriptional Landscapeof Hematopoietic Stem Cell OntogenyShannonMcKinney-Freeman,1,2,12 Patrick Cahan,1,12 Hu Li,3,4,12 Scott A. Lacadie,1 Hsuan-TingHuang,1MatthewCurran,1
Sabine Loewer,1 Olaia Naveiras,1 Katie L. Kathrein,1 Martina Konantz,5,6 Erin M. Langdon,1 Claudia Lengerke,5
Leonard I. Zon,1,7,8,9 James J. Collins,3,4,7 and George Q. Daley1,7,8,10,11,*1Division of Pediatric Hematology/Oncology, Children’s Hospital Boston and Harvard Medical School, Harvard Stem Cell Institute, Boston,MA 02115, USA2Department of Hematology, St. Jude Children’s Research Hospital, Memphis, TN 38105, USA3Department of Biomedical Engineering, Center for BioDynamics and Center for Advanced Biotechnology, Boston University, Boston,
MA 02215, USA4Wyss Institute for Biologically Inspired Engineering, Harvard University, Boston, MA 02115, USA5Division of Hematology and Oncology, University of Tuebingen Medical Center II, 72076 Tuebingen, Germany6Max Planck Institute for Developmental Biology, Department III – Genetics, Spemannstrasse 35, 72076 Tuebingen, Germany7Howard Hughes Medical Institute8Stem Cell Transplantation Program and Children’s Hospital Boston, Boston, MA 02115, USA9Dana Farber Cancer Institute, Boston, MA 02115, USA10Division of Hematology, Brigham and Women’s Hospital, Boston, MA 02115, USA11Department of Biological Chemistry and Molecular Pharmacology, Harvard Medical School, Broad Institute, Boston, MA 02115, USA12These authors contributed equally to this work
*Correspondence: [email protected]
http://dx.doi.org/10.1016/j.stem.2012.07.018
SUMMARY
Transcriptome analysis of adult hematopoietic stemcells (HSCs) and their progeny has revealed mecha-nisms of blood differentiation and leukemogenesis,but a similar analysis of HSC development is lacking.Here, we acquired the transcriptomes of developingHSCs purified from >2,500murine embryos and adultmice. We found that embryonic hematopoieticelements clustered into three distinct transcriptionalstates characteristic of the definitive yolk sac, HSCsundergoing specification, and definitive HSCs. Weapplied a network-biology-based analysis to recon-struct the gene regulatory networks of sequentialstages of HSC development and functionally vali-dated candidate transcriptional regulators of HSContogeny by morpholino-mediated knockdown inzebrafish embryos. Moreover, we found that HSCsfrom in vitro differentiated embryonic stem cellsclosely resemble definitive HSCs, yet lack a Notch-signaling signature, likely accounting for their defec-tive lymphopoiesis. Our analysis and web resourcewill enhance efforts to identify regulators of HSContogeny and facilitate the engineering of hemato-poietic specification.
INTRODUCTION
Hematopoietic stem cells (HSCs) have been extensively
analyzed via global transcriptional profiling, which has yielded
novel insights into their unique biology (Seita and Weissman,
Cell
2010). A recent examination of human HSCs and their progeny
revealed both hematopoietic cell-type specific and ‘‘reused’’
transcriptional programs (Novershtern et al., 2011). A similarly
comprehensive examination of the transcriptome of embryonic
HSCs is absent from the literature, largely due to the practical
difficulties of prospectively isolating sufficient quantities of highly
purified HSCs and precursors from embryos (Godin and
Cumano, 2002). The description of Sox17 as a disparate regu-
lator of fetal versus adult HSCs indicates that distinct molecular
pathways likely govern different stages of HSC development
(Kim et al., 2007). A deep understanding of the molecular regula-
tion of HSC ontogeny would inform efforts to expand HSCs
in vitro and induce HSC generation during pluripotent stem cell
(PSC) differentiation, as well as illuminate novel disease-causing
genes.
Definitive adult-type HSCs are born in the E10.5 aorta-
gonads-mesonephros (AGM), and thereafter migrate to the fetal
liver (FL), placenta, and bone marrow (Medvinsky et al., 2011).
HSCs apparently emerge from a subset of endothelial cells in
the ventral aspect of the dorsal aorta (recently reviewed in detail;
Medvinsky et al., 2011). Imaging reveals the dramatic ‘‘bending’’
of hemogenic endothelial cells as they move into the aortic
space (Kissa and Herbomel, 2010). Although these emergent
cells have not been directly demonstrated to be functional
HSCs, the preponderance of evidence indicates that definitive
HSCs arise from hemogenic endothelium.
Directed differentiation of PSCs to specific lineages for
research and cell therapy is a major goal of stem cell biology.
Nearly 2 decades of effort has not yielded robust, definitive
HSCs from PSCs (McKinney-Freeman and Daley, 2007). Ectopic
expression of the homeotic genes HoxB4 and Cdx4 produced
cells that reconstituted multilineage hematopoiesis in lethally
irradiated primary and secondary mice (Kyba et al., 2002;
Wang et al., 2005b). Although this approach generated
Stem Cell 11, 701–714, November 2, 2012 ª2012 Elsevier Inc. 701
Cell Stem Cell
Transcriptome of Developing HSCs
hematopoietic progenitors with the cardinal stem cell features
of self-renewal and multilineage differentiation, these embry-
onic-stem-cell-derivedHSCs (ESC-HSCs) do not faithfullymimic
the function or phenotype of whole bone marrow (WBM)-HSCs
(Bonde et al., 2008; McKinney-Freeman et al., 2009; Ta-
bayoyong et al., 2009). Recent data proposing the equivalence
of hemogenic endothelium and the hemangioblast that arises
during ESC differentiation (Lancrin et al., 2009) suggests that
discerning the molecular pathways of hematopoietic ontogeny
in vivo will provide a roadmap for differentiating definitive
HSCs from PSCs in vitro.
Here, we present the most complete analysis of the transcrip-
tional program of definitive HSC ontogeny to date, gleaned from
rigorously characterized hematopoietic stem and progenitor cell
(HSPC) populations isolated from over 2,500 murine embryos
and adult mice. To illuminate combinatorial control of gene ex-
pression, we applied a computational analysis that identifies
a gene regulatory network for each critical developmental stage
(Faith et al., 2007). We then validated several predicted regula-
tors in HSC ontogeny via morpholino knockdown in zebrafish
embryos. We discovered that HSCs exist in only three distinct
transcriptional states during ontogeny and that a subset of
HSCs from E12.5 FL retain the transcriptional signature of their
endothelial precursors. Ultimately, we compared the transcrip-
tional profiles of ESCs, ESC-derived hematopoietic progenitors,
and ESC-HSCs to their potential in vivo counterparts, and found
that ESC-HSCs most closely resemble definitive HSCs but
are defective in essential HSC regulatory pathways, perhaps
accounting for their functional deficits. Taken together, our
unique data set, available to the stem cell community as a
searchable web resource (http://hsc.hms.harvard.edu), illumi-
nates aspects of hematopoietic development that will prove
valuable for research in developmental hematopoiesis and
in vitro directed differentiation.
RESULTS
Acquisition of HSCGene Expression Profiles throughoutMurine OntogenyThe technical challenges of purifying HSCs to absolute homoge-
neity from FL and WBM has not precluded the derivation of
important biological insights from analysis of the global gene
expression profiles of highly purified populations of primitive
hematopoietic progenitors (Kiel et al., 2005; Park et al., 2003;
Seita and Weissman, 2010). Here, we restricted our purification
scheme to surface markers that enrich functionally for hemato-
poietic repopulation (yolk sac [YS], placenta, FL, WBM, and
ESC-HSCs) or HSC precursors (embryoid body [EB]-derived
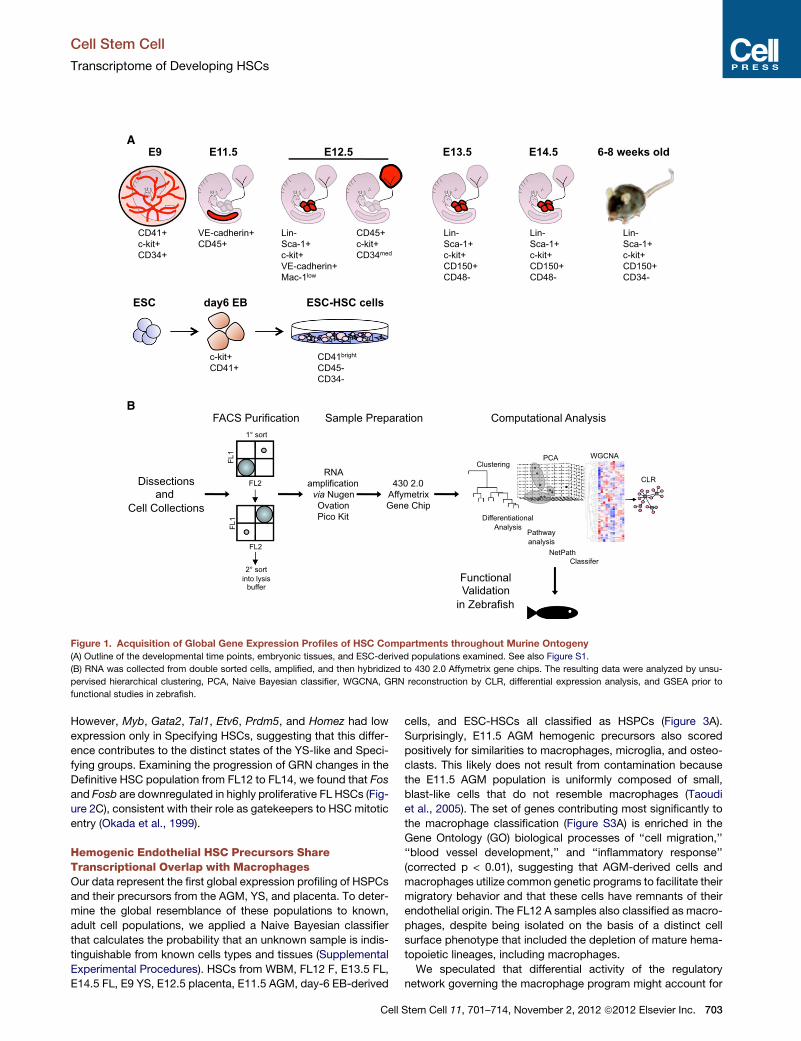
cells and AGM) (Figure 1A and Table 1). E9 YS CD41+c-kit+
CD34+ cells can contribute to life-long hematopoiesis when
transplanted into neonates (Ferkowicz et al., 2003). E11.5 AGM
HSCs are exceedingly rare (one to three functional HSCs per
embryo; Kumaravelu et al., 2002). However, between E11.5
and E12.5, HSCs expand dramatically in the placenta and FL
(Kumaravelu et al., 2002; Taoudi et al., 2005, 2008). This expan-
sion results partly from an acceleration in de novo HSC specifi-
cation from VE-cadherin+CD45+ AGM hemogenic precursors
(Taoudi et al., 2008). To capture the molecular transition
from hemogenic endothelium to definitive HSCs, we isolated
702 Cell Stem Cell 11, 701–714, November 2, 2012 ª2012 Elsevier In
VE-cadherin+CD45+ cells from E11.5 AGM and HSCs from
E12.5 placenta and FL. We also collected HSCs from E13.5
FL, E14.5 FL, adult WBM, and ESCs (McKinney-Freeman
et al., 2008). Samples were double sorted into lysis buffer via
fluorescence-activated cell sorting (FACS) to assure cell purities
of >95%, minimal loss of material, and maximal RNA integrity
(Figure 1B and Figure S1 available online). Three to six biological
replicates were collected for each population. We generated
gene expression profiles using Affymetrix gene chips and per-
formed computational analysis as described below.
Embryonic HSCs Exist in Three PredominantTranscriptional StatesPearson correlations between biological replicates revealed that
most samples within a group were well correlated (Figure S2A).
Hierarchical clustering and principal component analysis (PCA)
reveal that embryonic hematopoietic populations segregate
into three transcriptionally distinct groups, designated as ‘‘YS-
like,’’ ‘‘Specifying HSCs,’’ and ‘‘Definitive HSCs’’ (Figures 2A
and 2B). Placenta and AGM samples cluster together (Figures
2A and 2B), confirming recent data that both are sites of hema-
topoietic specification (Rhodes et al., 2008). Interestingly, two
E12.5 FL samples align with the AGM, whereas four align with
later-stage FL and WBM HSCs (Figure 2A). We termed the
AGM-like E12.5 FL samples ‘‘FL12 A,’’ and the FL-like E12.5
FL samples ‘‘FL12 F.’’ FL12 F, E13.5 FL, E14.5 FL, and WBM-
HSCs cluster as one group (i.e. Definitive HSCs) while E9 YS
clusters separately with EB-derived hematopoietic progenitors.
Definitive HSCs isolated from FL across 2 days of embryonic
development (E12.5–14.5) are nearly indistinguishable by gene
expression. Nine genes were differentially expressed in FL12 F
versus E13.5 FL and only five genes distinguished E13.5 from
E14.5 (http://hsc.hms.harvard.edu). In contrast, 619 genes
were differentially expressed between AGM and FL12 F HSCs
(http://hsc.hms.harvard.edu). The clustering of FL12 A with
placenta/AGM rather than FL/WBM suggests that the transcrip-
tional signature of HSCs immediately upon arrival in the FL
represents a critical transitional stage from hemogenic endothe-
lium to definitive HSCs that can be observed fortuitously in some
embryos (Figures 2A and 2B). Although AGM and FL12 A cluster
together, they are transcriptionally distinct when specific hema-
topoietic genes are examined (Figure S2B). In total, our data
reveal that AGM and FL12 A are distinct, yet transcriptionally
related cell populations.
To determinewhether differences in theHSPCgene regulatory
network (GRN) contribute to the three distinct transcriptional
states of developing HSCs, we first identified the context-
dependent GRNs of 44 distinct cell types and tissues, including
HSPCs, using publicly available data (Supplemental Experi-
mental Procedures). There are three components to each
GRN: genes expressed by a cell type or tissue, the transcription
factors (TFs) predicted to regulate these genes, and cooperating
gene sets that must be highly expressed for the TFs to exert
a regulatory influence (contexts). We compared the expression
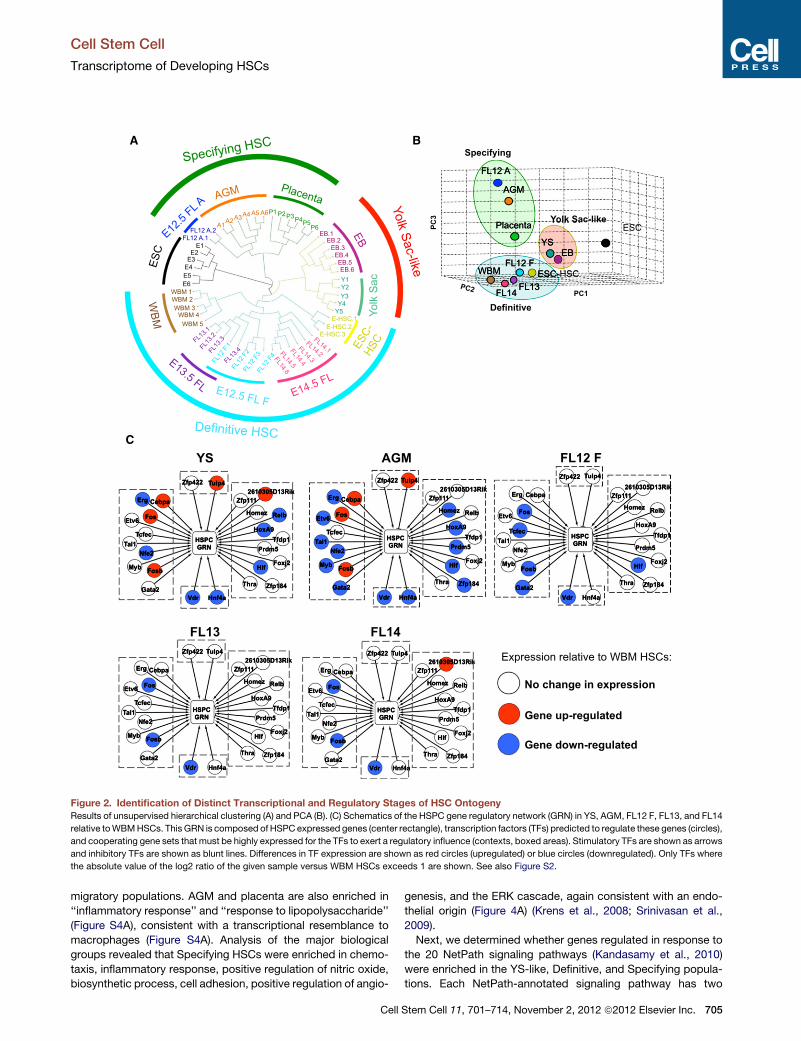
of the HSPC GRN in YS and AGM to WBM (Figure 2C). The
expression of the HSPC regulators Erg, Nfe2, Hoxa9, and Hlf
did not reach an adult HSC expression level in the YS and
AGM. Also, Tulp4, a predicted repressor of the HSPC GRN, is
highly expressed in both the YS-like and Specifying HSCs.
c.
A
B
CD41+c-kit+CD34+
VE-cadherin+CD45+
CD45+c-kit+CD34med
Lin-Sca-1+c-kit+VE-cadherin+Mac-1low
Lin-Sca-1+c-kit+CD150+CD48-
Lin-Sca-1+c-kit+CD150+CD48-
Lin-Sca-1+c-kit+CD150+CD34-
E9 E11.5 E12.5 E13.5 E14.5 6-8 weeks old
ESC day6 EB ESC-HSC cells
CD41bright
CD45-CD34-
c-kit+CD41+
Dissectionsand
Cell Collections
430 2.0 Affymetrix Gene Chip
FACS Purification
RNA amplificationvia NugenOvationPico Kit
Sample Preparation
WGCNA Clustering
PCA
CLR
Differentiational Analysis
Pathwayanalysis
NetPath
Computational Analysis 1° sort
FL1
FL1
FL2
2° sortinto lysis
bufferFunctionalValidation
in Zebrafish
Classifer
Figure 1. Acquisition of Global Gene Expression Profiles of HSC Compartments throughout Murine Ontogeny
(A) Outline of the developmental time points, embryonic tissues, and ESC-derived populations examined. See also Figure S1.
(B) RNA was collected from double sorted cells, amplified, and then hybridized to 430 2.0 Affymetrix gene chips. The resulting data were analyzed by unsu-
pervised hierarchical clustering, PCA, Naive Bayesian classifier, WGCNA, GRN reconstruction by CLR, differential expression analysis, and GSEA prior to
functional studies in zebrafish.
Cell Stem Cell
Transcriptome of Developing HSCs
However, Myb, Gata2, Tal1, Etv6, Prdm5, and Homez had low
expression only in Specifying HSCs, suggesting that this differ-
ence contributes to the distinct states of the YS-like and Speci-
fying groups. Examining the progression of GRN changes in the
Definitive HSC population from FL12 to FL14, we found that Fos
and Fosb are downregulated in highly proliferative FL HSCs (Fig-
ure 2C), consistent with their role as gatekeepers to HSC mitotic
entry (Okada et al., 1999).
Hemogenic Endothelial HSC Precursors ShareTranscriptional Overlap with MacrophagesOur data represent the first global expression profiling of HSPCs
and their precursors from the AGM, YS, and placenta. To deter-
mine the global resemblance of these populations to known,
adult cell populations, we applied a Naive Bayesian classifier
that calculates the probability that an unknown sample is indis-
tinguishable from known cells types and tissues (Supplemental
Experimental Procedures). HSCs from WBM, FL12 F, E13.5 FL,
E14.5 FL, E9 YS, E12.5 placenta, E11.5 AGM, day-6 EB-derived
Cell
cells, and ESC-HSCs all classified as HSPCs (Figure 3A).
Surprisingly, E11.5 AGM hemogenic precursors also scored
positively for similarities to macrophages, microglia, and osteo-
clasts. This likely does not result from contamination because
the E11.5 AGM population is uniformly composed of small,
blast-like cells that do not resemble macrophages (Taoudi
et al., 2005). The set of genes contributing most significantly to
the macrophage classification (Figure S3A) is enriched in the
Gene Ontology (GO) biological processes of ‘‘cell migration,’’
‘‘blood vessel development,’’ and ‘‘inflammatory response’’
(corrected p < 0.01), suggesting that AGM-derived cells and
macrophages utilize common genetic programs to facilitate their
migratory behavior and that these cells have remnants of their
endothelial origin. The FL12 A samples also classified as macro-
phages, despite being isolated on the basis of a distinct cell
surface phenotype that included the depletion of mature hema-
topoietic lineages, including macrophages.
We speculated that differential activity of the regulatory
network governing the macrophage program might account for
Stem Cell 11, 701–714, November 2, 2012 ª2012 Elsevier Inc. 703
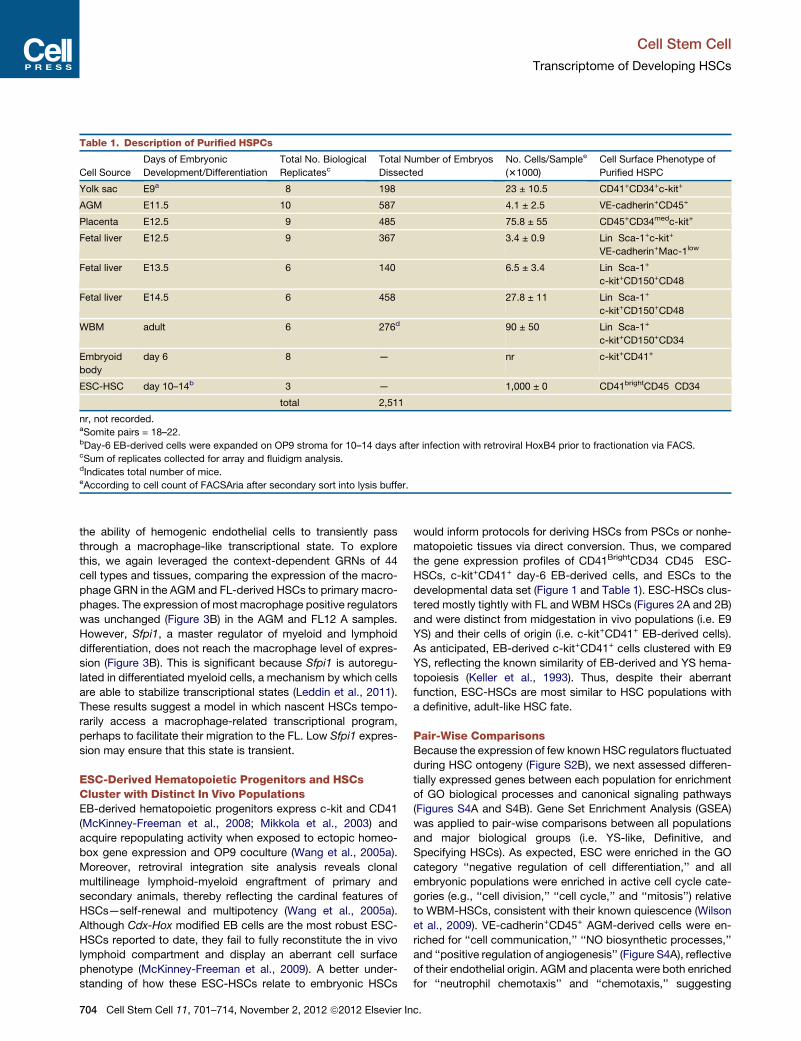
Table 1. Description of Purified HSPCs
Cell Source
Days of Embryonic
Development/Differentiation
Total No. Biological
ReplicatescTotal Number of Embryos
Dissected
No. Cells/Samplee
(31000)
Cell Surface Phenotype of
Purified HSPC
Yolk sac E9a 8 198 23 ± 10.5 CD41+CD34+c-kit+
AGM E11.5 10 587 4.1 ± 2.5 VE-cadherin+CD45+
Placenta E12.5 9 485 75.8 ± 55 CD45+CD34medc-kit+
Fetal liver E12.5 9 367 3.4 ± 0.9 Lin�Sca-1+c-kit+
VE-cadherin+Mac-1low
Fetal liver E13.5 6 140 6.5 ± 3.4 Lin�Sca-1+
c-kit+CD150+CD48�
Fetal liver E14.5 6 458 27.8 ± 11 Lin�Sca-1+
c-kit+CD150+CD48�
WBM adult 6 276d 90 ± 50 Lin�Sca-1+
c-kit+CD150+CD34�
Embryoid
body
day 6 8 — nr c-kit+CD41+
ESC-HSC day 10–14b 3 — 1,000 ± 0 CD41brightCD45�CD34�
total 2,511
nr, not recorded.aSomite pairs = 18–22.bDay-6 EB-derived cells were expanded on OP9 stroma for 10–14 days after infection with retroviral HoxB4 prior to fractionation via FACS.cSum of replicates collected for array and fluidigm analysis.dIndicates total number of mice.eAccording to cell count of FACSAria after secondary sort into lysis buffer.
Cell Stem Cell
Transcriptome of Developing HSCs
the ability of hemogenic endothelial cells to transiently pass
through a macrophage-like transcriptional state. To explore
this, we again leveraged the context-dependent GRNs of 44
cell types and tissues, comparing the expression of the macro-
phage GRN in the AGM and FL-derived HSCs to primary macro-
phages. The expression of most macrophage positive regulators
was unchanged (Figure 3B) in the AGM and FL12 A samples.
However, Sfpi1, a master regulator of myeloid and lymphoid
differentiation, does not reach the macrophage level of expres-
sion (Figure 3B). This is significant because Sfpi1 is autoregu-
lated in differentiated myeloid cells, a mechanism by which cells
are able to stabilize transcriptional states (Leddin et al., 2011).
These results suggest a model in which nascent HSCs tempo-
rarily access a macrophage-related transcriptional program,
perhaps to facilitate their migration to the FL. Low Sfpi1 expres-
sion may ensure that this state is transient.
ESC-Derived Hematopoietic Progenitors and HSCsCluster with Distinct In Vivo PopulationsEB-derived hematopoietic progenitors express c-kit and CD41
(McKinney-Freeman et al., 2008; Mikkola et al., 2003) and
acquire repopulating activity when exposed to ectopic homeo-
box gene expression and OP9 coculture (Wang et al., 2005a).
Moreover, retroviral integration site analysis reveals clonal
multilineage lymphoid-myeloid engraftment of primary and
secondary animals, thereby reflecting the cardinal features of
HSCs—self-renewal and multipotency (Wang et al., 2005a).
Although Cdx-Hox modified EB cells are the most robust ESC-
HSCs reported to date, they fail to fully reconstitute the in vivo
lymphoid compartment and display an aberrant cell surface
phenotype (McKinney-Freeman et al., 2009). A better under-
standing of how these ESC-HSCs relate to embryonic HSCs
704 Cell Stem Cell 11, 701–714, November 2, 2012 ª2012 Elsevier In
would inform protocols for deriving HSCs from PSCs or nonhe-
matopoietic tissues via direct conversion. Thus, we compared
the gene expression profiles of CD41BrightCD34�CD45� ESC-
HSCs, c-kit+CD41+ day-6 EB-derived cells, and ESCs to the
developmental data set (Figure 1 and Table 1). ESC-HSCs clus-
tered mostly tightly with FL and WBM HSCs (Figures 2A and 2B)
and were distinct from midgestation in vivo populations (i.e. E9
YS) and their cells of origin (i.e. c-kit+CD41+ EB-derived cells).
As anticipated, EB-derived c-kit+CD41+ cells clustered with E9
YS, reflecting the known similarity of EB-derived and YS hema-
topoiesis (Keller et al., 1993). Thus, despite their aberrant
function, ESC-HSCs are most similar to HSC populations with
a definitive, adult-like HSC fate.
Pair-Wise ComparisonsBecause the expression of few known HSC regulators fluctuated
during HSC ontogeny (Figure S2B), we next assessed differen-
tially expressed genes between each population for enrichment
of GO biological processes and canonical signaling pathways
(Figures S4A and S4B). Gene Set Enrichment Analysis (GSEA)
was applied to pair-wise comparisons between all populations
and major biological groups (i.e. YS-like, Definitive, and
Specifying HSCs). As expected, ESC were enriched in the GO
category ‘‘negative regulation of cell differentiation,’’ and all
embryonic populations were enriched in active cell cycle cate-
gories (e.g., ‘‘cell division,’’ ‘‘cell cycle,’’ and ‘‘mitosis’’) relative
to WBM-HSCs, consistent with their known quiescence (Wilson
et al., 2009). VE-cadherin+CD45+ AGM-derived cells were en-
riched for ‘‘cell communication,’’ ‘‘NO biosynthetic processes,’’
and ‘‘positive regulation of angiogenesis’’ (Figure S4A), reflective
of their endothelial origin. AGM and placenta were both enriched
for ‘‘neutrophil chemotaxis’’ and ‘‘chemotaxis,’’ suggesting
c.
B
PC2
FL12 A
AGM
Placenta
YSEB
ESC
WBM
FL14 FL13
FL12 F ESC-HSC
PC3
PC1
Specifying
Yolk Sac-like
Definitive
C
MGASY
No change in expression
Gene up-regulated
Gene down-regulated
Expression relative to WBM HSCs:
FL12 F
41LF31LF
Zfp422 Tulp4
Zfp111 2610305D13Rik
Homez Relb
HoxA9Tfdp1
Prdm5
Foxj2Hlf
Thra Zfp184
Vdr Hnf4a Gata2
FosbMyb
Nfe2Tal1
Tcfec
Etv6 Fos
Erg Cebpa
HSPCGRN
HSPCGRN
Zfp111 2610305D13Rik
Homez Relb
HoxA9Tfdp1
Prdm5
Foxj2Hlf
Thra Zfp184
Vdr Hnf4a Gata2
FosbMyb
Nfe2Tal1
Tcfec
Etv6 Fos
Erg Cebpa
HSPCGRN
Zfp111 2610305D13Rik
Homez Relb
HoxA9Tfdp1
Prdm5
Foxj2Hlf
Thra Zfp184
Vdr Hnf4a Gata2
FosbMyb
Nfe2Tal1
Tcfec
Etv6 Fos
Erg Cebpa
Zfp422 Tulp4 Zfp422 Tulp4
HSPCGRN
Zfp111 2610305D13Rik
Homez Relb
HoxA9Tfdp1
Prdm5
Foxj2Hlf
Thra Zfp184
Vdr Hnf4a Gata2
FosbMyb
Nfe2Tal1
Tcfec
Etv6 Fos
Erg Cebpa
Zfp422 Tulp4
HSPCGRN
Zfp111 2610305D13Rik
Homez Relb
HoxA9Tfdp1
Prdm5
Foxj2Hlf
Thra Zfp184Gata2
FosbMyb
Nfe2Tal1
Tcfec
Etv6 Fos
Erg Cebpa
Vdr Hnf4a
Zfp422 Tulp4
A
FL12 A.1 FL12 A.2
A1A2A3A4 A5 A6P1 P2P3P4P5
P6EB.1
EB.2EB.3
EB.4EB.5EB.6Y1Y2Y3
Y4Y5
E-HSC.1E-HSC.2
E-HSC.3
WBM 1 WBM 2 WBM 3
WBM 4 WBM 5
E1E2
E3E4E5E6
AGM Placenta
Yolk
Sac
E12.5 FL F
WBM
ESC
Specifying HSC
Yolk Sac-like
Definitive HSC
Figure 2. Identification of Distinct Transcriptional and Regulatory Stages of HSC Ontogeny
Results of unsupervised hierarchical clustering (A) and PCA (B). (C) Schematics of the HSPC gene regulatory network (GRN) in YS, AGM, FL12 F, FL13, and FL14
relative toWBMHSCs. This GRN is composed of HSPC expressed genes (center rectangle), transcription factors (TFs) predicted to regulate these genes (circles),
and cooperating gene sets that must be highly expressed for the TFs to exert a regulatory influence (contexts, boxed areas). Stimulatory TFs are shown as arrows
and inhibitory TFs are shown as blunt lines. Differences in TF expression are shown as red circles (upregulated) or blue circles (downregulated). Only TFs where
the absolute value of the log2 ratio of the given sample versus WBM HSCs exceeds 1 are shown. See also Figure S2.
Cell Stem Cell
Transcriptome of Developing HSCs
migratory populations. AGM and placenta are also enriched in
‘‘inflammatory response’’ and ‘‘response to lipopolysaccharide’’
(Figure S4A), consistent with a transcriptional resemblance to
macrophages (Figure S4A). Analysis of the major biological
groups revealed that Specifying HSCs were enriched in chemo-
taxis, inflammatory response, positive regulation of nitric oxide,
biosynthetic process, cell adhesion, positive regulation of angio-
Cell
genesis, and the ERK cascade, again consistent with an endo-
thelial origin (Figure 4A) (Krens et al., 2008; Srinivasan et al.,
2009).
Next, we determined whether genes regulated in response to
the 20 NetPath signaling pathways (Kandasamy et al., 2010)
were enriched in the YS-like, Definitive, and Specifying popula-
tions. Each NetPath-annotated signaling pathway has two
Stem Cell 11, 701–714, November 2, 2012 ª2012 Elsevier Inc. 705
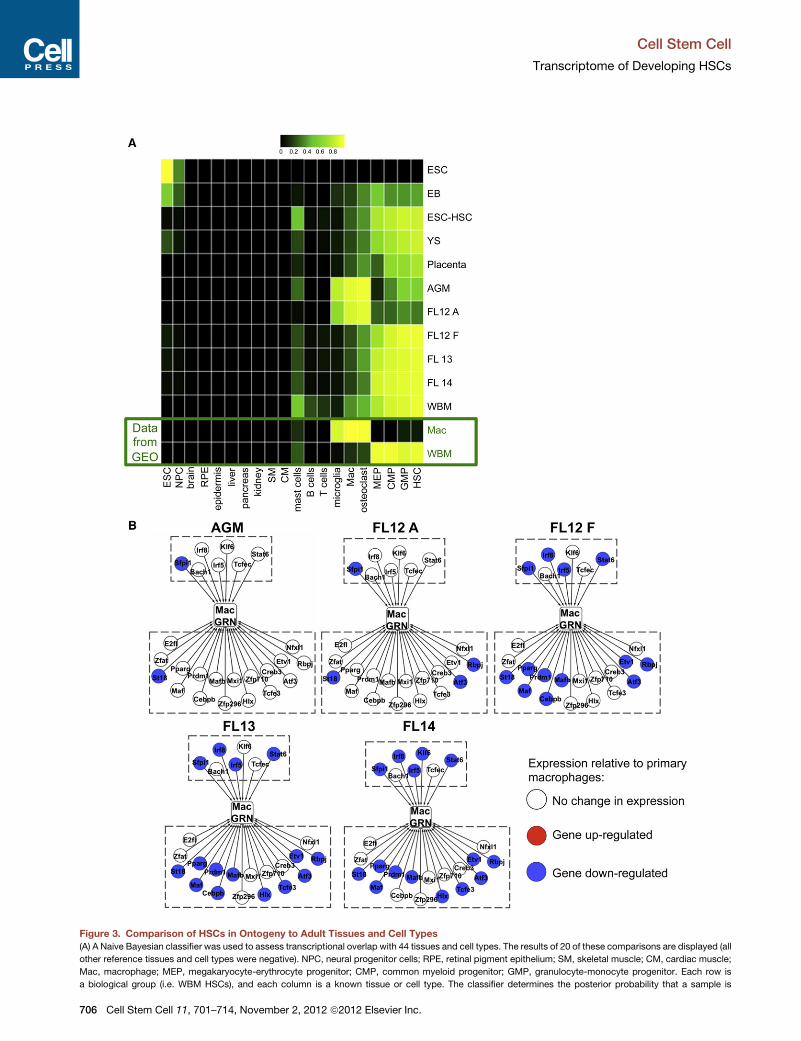
Figure 3. Comparison of HSCs in Ontogeny to Adult Tissues and Cell Types
(A) A Naive Bayesian classifier was used to assess transcriptional overlap with 44 tissues and cell types. The results of 20 of these comparisons are displayed (all
other reference tissues and cell types were negative). NPC, neural progenitor cells; RPE, retinal pigment epithelium; SM, skeletal muscle; CM, cardiac muscle;
Mac, macrophage; MEP, megakaryocyte-erythrocyte progenitor; CMP, common myeloid progenitor; GMP, granulocyte-monocyte progenitor. Each row is
a biological group (i.e. WBM HSCs), and each column is a known tissue or cell type. The classifier determines the posterior probability that a sample is
Cell Stem Cell
Transcriptome of Developing HSCs
706 Cell Stem Cell 11, 701–714, November 2, 2012 ª2012 Elsevier Inc.
Cell Stem Cell
Transcriptome of Developing HSCs
gene sets: genes upregulated in response to a pathway and
genes downregulated. Genes upregulated in response to Wnt
and IL-3 signaling were enriched in Specifying HSCs (Figure 4B),
in agreement with reports that Wnt and IL-3 signaling promote
HSC specification (Goessling et al., 2009; Robin et al., 2006).
Notably, in vivo Definitive HSCs were enriched in genes targeted
by Notch signaling relative to ESC-HSCs (Figure 4B and Fig-
ure S4B), suggesting that the aberrant functionality of ESC-
HSCs may be due to a lack of specification via Notch signaling.
Identification of Transcriptional Regulators of HSCOntogenyTo identify coordinately expressed genes, we applied the
network-basedWeighted Gene Coexpression Network Analysis
clustering algorithm (WGCNA) and detected 66 modules ranging
in content from 24 to 1,752 genes (Figure 5 and Figure S5A). A
complete list of genes assigned to each module is available on
the companion website (http://hsc.hms.harvard.edu). Because
genes within a module are highly positively correlated, we
summarized their expression as the median of the standardized
expression of each gene within a given module, resulting in
a single module value at each developmental time point (Figure 5
and Figure S5A). Twenty-six modules are stage enriched (i.e.,
more highly expressed in a single stage than all other stages;
corrected p < 0.01; Figure 5). Thirteen modules were character-
istic of Definitive HSCs (highest in FL12 F, FL13, FL14, WBM,
ESC-HSCs), eleven for Specifying HSCs (highest in AGM,
placenta, FL12 A), and five for YS-like (highest in EB and YS),
and ten reflected the in vitro state (highest in ESC, EB, and
ESC-HSCs; Figure 5).
To identify the GRN active in HSC development, we used the
Context Likelihood of Relatedness (CLR) algorithm to identify
putative transcriptional regulators (TRs) of each module (Fig-
ure S6A) (Faith et al., 2007; Taylor et al., 2008). CLR uses mutual
information rather than linear correlation to identify significant
relationships between TRs and target genes, and has accurately
reconstructed mammalian GRN (Faith et al., 2007; Taylor et al.,
2008). We applied CLR to each gene module and 1,623 TRs,
computing the mutual information between module profiles
and the expression profile of each TR. This analysis identified a
GRN consisting of 1,147 putative regulatory relationships
(FDR < 0.05) with 0 to 53 (median = 17) regulators per module
and 0 to 7 modules per regulator. A table of the complete GRN
(TRs and putative target modules) is available on the companion
website. For clarity, we show the network consisting of CLR
predictions at the 0.01 FDR threshold (Figure S6A). The network
is scale free, indicating that a small number of nodes act as hubs
with edges to a large number of other nodes, consistent with
other network analyses of GRN (Figure S6B) (Barabasi and
Oltvai, 2004).
To assess the reproducibility of our gene expression data, we
analyzed the exemplars and top three predicted regulators of
22 modules via the Fluidigm microfluidic qRT-PCR platform
indistinguishable from each of the tissues or cell types in the reference data se
and black.
(B) Schematics of the macrophage GRN in AGM, FL12 A, FL12 F, FL13, and FL14
where the absolute value of the log2 ratio of the given sample versus primary ma
See also Figure S3.
Cell
(Table S1, Figures S5B–S5E). We collected multiple additional
independent biological replicates of EB-derived cells, ESC-
HSCs, YS, placenta, AGM, E12.5 FL, E13.5 FL, and WBM
(Table 1) and compared the microarray intensities of each gene
at each stage to qRT-PCR-based delta Cts (normalized to
Rps29). We saw high concordance between the two platforms
(R2 = 0.5446, p < 4.4 * 10�111, Figures S5C and S5D). Figure S5E
depicts the results for five Definitive HSCmodules, revealing that
at the gene level, the Affymetrix expression levels are recapitu-
lated by Fluidigm. In total, 60/80 candidate genes (at a cutoff
of p < 0.10) were validated by Fluidigm, confirming the fidelity
of our data set.
Hypothesizing that highly connected (‘‘hub’’) genes are more
likely to be important in HSCs, we looked for overlap in the CLR
predictions of modules with a Definitive HSC signature (i.e., M7,
M10, M11, M12, M23, M26, M35, M37, M42, M50, M8, and M9;
Figure 6A). Regulators predicted for more than one of these
modules are labeled in Figure 6A. Many of these hub regulators
have already been implicated in hematopoiesis, though not
necessarily in HSC development, including HoxA9, Vdr, Hlf,
Lmo2, Bcl11a, Prdm16, Gfi1, and Mllt3 (Chuikov et al., 2010;
Hirose et al., 2010; Hock et al., 2004; Jeanson and Scadden,
2010; Lawrence et al., 1997; Magnusson et al., 2007; Pina et al.,
2008;Sankaranet al., 2008). These resultsconfirmthat hubgenes
may be key regulators of HSC function and/or development.
To functionally determine if our computational predictions
were indeed able to identify gene candidates involved in defini-
tive hematopoiesis, Definitive HSC hub genes Prdm16, Mllt3,
Atf3, Msrb2, and Rfx5 (Figure 6A), as well as Gfi1b, predicted
regulator of definitive module M10, and Tulp4, a CLR predicted
positive regulator of Specifying modules 19 and 28 and nega-
tive regulator of Definitive HSC module 7, were selected for
knockdown in zebrafish embryos. Mllt3 is also a Specifying
hub gene, predicted to regulate two Specifying modules (M28
and M40). Zebrafish represents a tractable system that faithfully
reflects mammalian hematopoiesis and thus allows us to rapidly
interrogate a role for these genes in this process in vivo. Embryos
were injected at the one-cell stage with morpholinos targeting
these gene candidates and were assayed at 36 hr postfertiliza-
tion (hpf) by in situ hybridization for c-myb and Runx1, markers
for HSPC/myeloid cells and HSPCs, respectively (Jin et al.,
2009).
Mllt3morphants displayed a significant loss of both c-myb and
Runx1 staining in the 36 hpf AGM, suggesting a decrease in
HSPCs (Figure 6B). While disruption of Gfi1b did not affect
c-myb or Runx1 expression in the AGM, an increase of c-myb+
cells and a decrease of Runx1+ cells was seen in the posterior
intermediate cell mass (ICM), where erythroid/myeloid pro-
genitors (EMPs) are known to localize (Figure 6B). These data
implicate Gfi1b in erythroid/myeloid EMP fate choice by sug-
gesting an increase in EMP-derivedmyeloid progeny, consistent
with Gfi1’s known role in lineage choice (Hock and Orkin, 2006;
Randrianarison-Huetz et al., 2010). Atf3 morphants showed an
t. Higher probabilities are bright yellow and low probabilities are dark green
relative to primary macrophages (see legend to Figure 2C for details). Only TFs
crophages exceeds 2 are shown.
Stem Cell 11, 701–714, November 2, 2012 ª2012 Elsevier Inc. 707
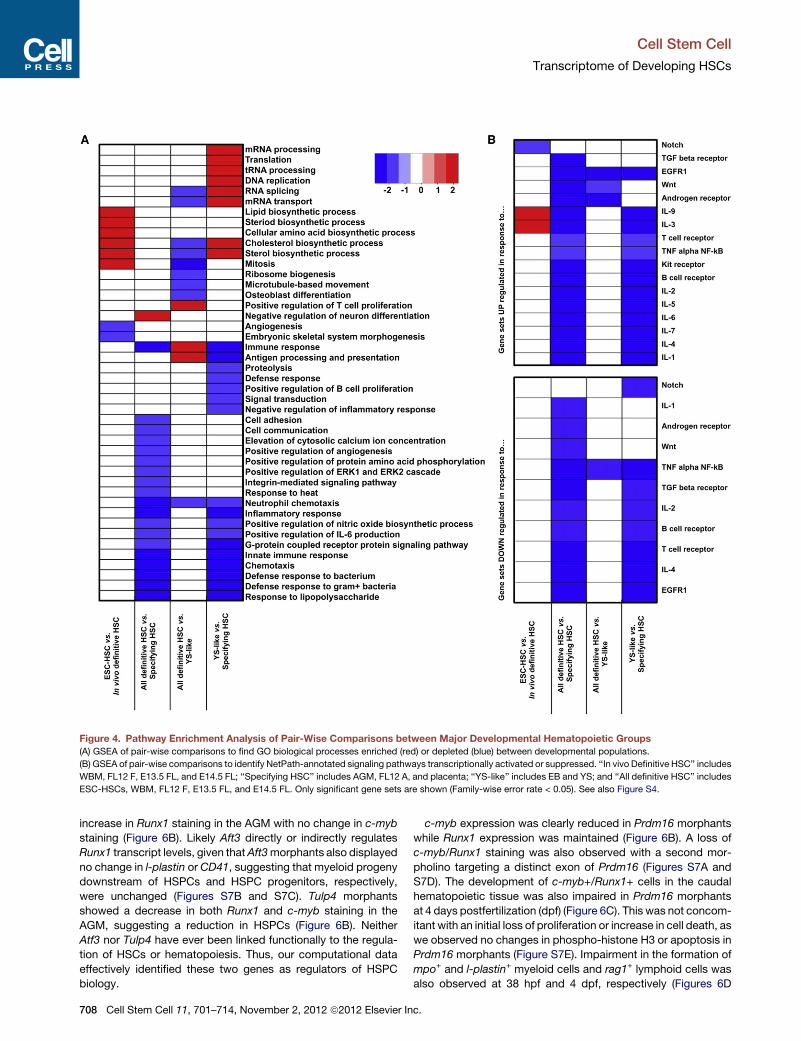
Figure 4. Pathway Enrichment Analysis of Pair-Wise Comparisons between Major Developmental Hematopoietic Groups
(A) GSEA of pair-wise comparisons to find GO biological processes enriched (red) or depleted (blue) between developmental populations.
(B) GSEA of pair-wise comparisons to identify NetPath-annotated signaling pathways transcriptionally activated or suppressed. ‘‘In vivo Definitive HSC’’ includes
WBM, FL12 F, E13.5 FL, and E14.5 FL; ‘‘Specifying HSC’’ includes AGM, FL12 A, and placenta; ‘‘YS-like’’ includes EB and YS; and ‘‘All definitive HSC’’ includes
ESC-HSCs, WBM, FL12 F, E13.5 FL, and E14.5 FL. Only significant gene sets are shown (Family-wise error rate < 0.05). See also Figure S4.
Cell Stem Cell
Transcriptome of Developing HSCs
increase in Runx1 staining in the AGM with no change in c-myb
staining (Figure 6B). Likely Aft3 directly or indirectly regulates
Runx1 transcript levels, given thatAft3morphants also displayed
no change in l-plastin or CD41, suggesting that myeloid progeny
downstream of HSPCs and HSPC progenitors, respectively,
were unchanged (Figures S7B and S7C). Tulp4 morphants
showed a decrease in both Runx1 and c-myb staining in the
AGM, suggesting a reduction in HSPCs (Figure 6B). Neither
Atf3 nor Tulp4 have ever been linked functionally to the regula-
tion of HSCs or hematopoiesis. Thus, our computational data
effectively identified these two genes as regulators of HSPC
biology.
708 Cell Stem Cell 11, 701–714, November 2, 2012 ª2012 Elsevier In
c-myb expression was clearly reduced in Prdm16 morphants
while Runx1 expression was maintained (Figure 6B). A loss of
c-myb/Runx1 staining was also observed with a second mor-
pholino targeting a distinct exon of Prdm16 (Figures S7A and
S7D). The development of c-myb+/Runx1+ cells in the caudal
hematopoietic tissue was also impaired in Prdm16 morphants
at 4 days postfertilization (dpf) (Figure 6C). This was not concom-
itant with an initial loss of proliferation or increase in cell death, as
we observed no changes in phospho-histone H3 or apoptosis in
Prdm16 morphants (Figure S7E). Impairment in the formation of
mpo+ and l-plastin+ myeloid cells and rag1+ lymphoid cells was
also observed at 38 hpf and 4 dpf, respectively (Figures 6D
c.
M1M13M14M29M48M51M25M43M27M18M49M55M39M54M7
M10M11 M12M23M26M35M37M42M50M8M9
M45M21M65
M17M56M19M2M59M28M38M40M46
M47M5M20M33M58M44
ESC
EBES
C-H
SC YS Pla
AG
MFL
12 A
FL
12 F
FL
13FL
14W
BM
Stag
e-en
riche
dD
efin
itive
HSC
YS
-like
Spec
ifyin
gIn
vitr
o
-2 -1 0 1 2
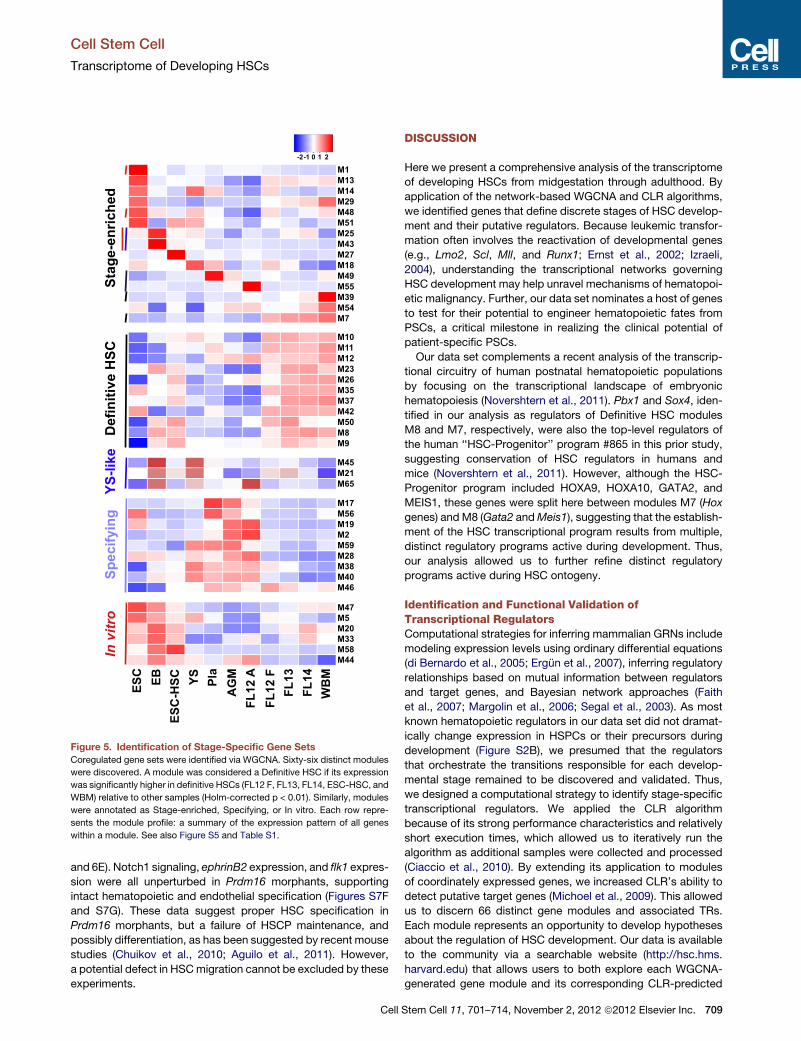
Figure 5. Identification of Stage-Specific Gene Sets
Coregulated gene sets were identified via WGCNA. Sixty-six distinct modules
were discovered. A module was considered a Definitive HSC if its expression
was significantly higher in definitive HSCs (FL12 F, FL13, FL14, ESC-HSC, and
WBM) relative to other samples (Holm-corrected p < 0.01). Similarly, modules
were annotated as Stage-enriched, Specifying, or In vitro. Each row repre-
sents the module profile: a summary of the expression pattern of all genes
within a module. See also Figure S5 and Table S1.
Cell Stem Cell
Transcriptome of Developing HSCs
and 6E). Notch1 signaling, ephrinB2 expression, and flk1 expres-
sion were all unperturbed in Prdm16 morphants, supporting
intact hematopoietic and endothelial specification (Figures S7F
and S7G). These data suggest proper HSC specification in
Prdm16 morphants, but a failure of HSCP maintenance, and
possibly differentiation, as has been suggested by recent mouse
studies (Chuikov et al., 2010; Aguilo et al., 2011). However,
a potential defect in HSCmigration cannot be excluded by these
experiments.
Cell
DISCUSSION
Here we present a comprehensive analysis of the transcriptome
of developing HSCs from midgestation through adulthood. By
application of the network-based WGCNA and CLR algorithms,
we identified genes that define discrete stages of HSC develop-
ment and their putative regulators. Because leukemic transfor-
mation often involves the reactivation of developmental genes
(e.g., Lmo2, Scl, Mll, and Runx1; Ernst et al., 2002; Izraeli,
2004), understanding the transcriptional networks governing
HSC development may help unravel mechanisms of hematopoi-
etic malignancy. Further, our data set nominates a host of genes
to test for their potential to engineer hematopoietic fates from
PSCs, a critical milestone in realizing the clinical potential of
patient-specific PSCs.
Our data set complements a recent analysis of the transcrip-
tional circuitry of human postnatal hematopoietic populations
by focusing on the transcriptional landscape of embryonic
hematopoiesis (Novershtern et al., 2011). Pbx1 and Sox4, iden-
tified in our analysis as regulators of Definitive HSC modules
M8 and M7, respectively, were also the top-level regulators of
the human ‘‘HSC-Progenitor’’ program #865 in this prior study,
suggesting conservation of HSC regulators in humans and
mice (Novershtern et al., 2011). However, although the HSC-
Progenitor program included HOXA9, HOXA10, GATA2, and
MEIS1, these genes were split here between modules M7 (Hox
genes) and M8 (Gata2 andMeis1), suggesting that the establish-
ment of the HSC transcriptional program results from multiple,
distinct regulatory programs active during development. Thus,
our analysis allowed us to further refine distinct regulatory
programs active during HSC ontogeny.
Identification and Functional Validation ofTranscriptional RegulatorsComputational strategies for inferring mammalian GRNs include
modeling expression levels using ordinary differential equations
(di Bernardo et al., 2005; Ergun et al., 2007), inferring regulatory
relationships based on mutual information between regulators
and target genes, and Bayesian network approaches (Faith
et al., 2007; Margolin et al., 2006; Segal et al., 2003). As most
known hematopoietic regulators in our data set did not dramat-
ically change expression in HSPCs or their precursors during
development (Figure S2B), we presumed that the regulators
that orchestrate the transitions responsible for each develop-
mental stage remained to be discovered and validated. Thus,
we designed a computational strategy to identify stage-specific
transcriptional regulators. We applied the CLR algorithm
because of its strong performance characteristics and relatively
short execution times, which allowed us to iteratively run the
algorithm as additional samples were collected and processed
(Ciaccio et al., 2010). By extending its application to modules
of coordinately expressed genes, we increased CLR’s ability to
detect putative target genes (Michoel et al., 2009). This allowed
us to discern 66 distinct gene modules and associated TRs.
Each module represents an opportunity to develop hypotheses
about the regulation of HSC development. Our data is available
to the community via a searchable website (http://hsc.hms.
harvard.edu) that allows users to both explore each WGCNA-
generated gene module and its corresponding CLR-predicted
Stem Cell 11, 701–714, November 2, 2012 ª2012 Elsevier Inc. 709
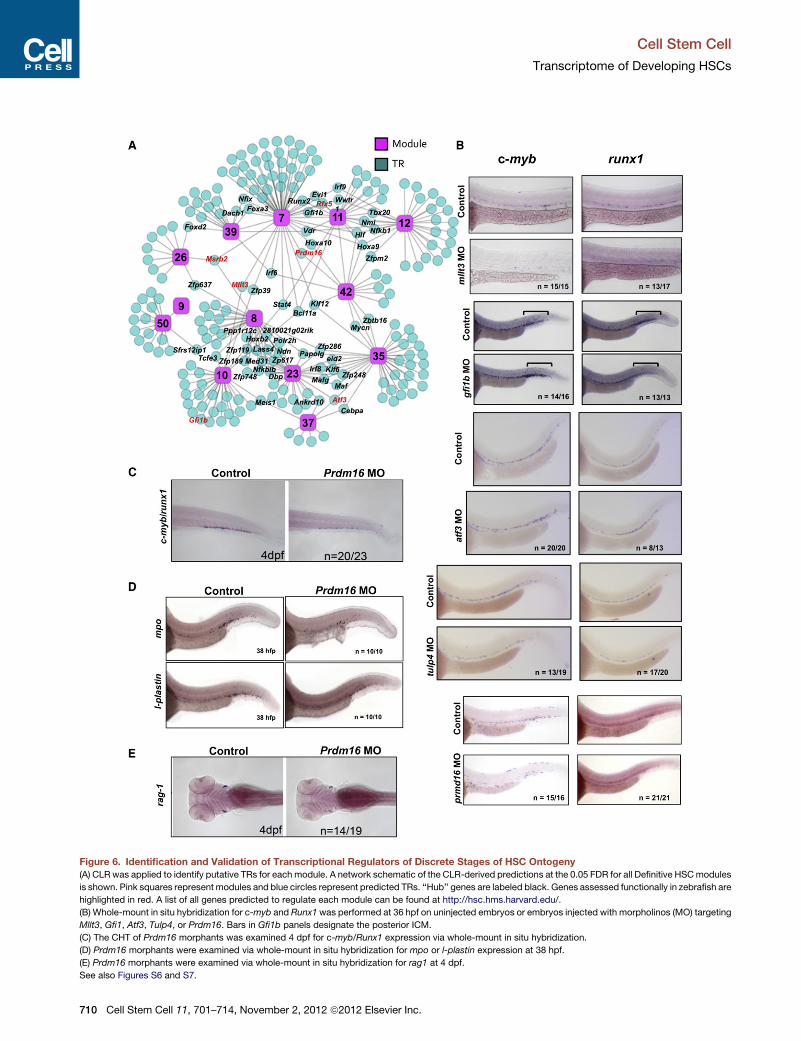
Figure 6. Identification and Validation of Transcriptional Regulators of Discrete Stages of HSC Ontogeny(A) CLRwas applied to identify putative TRs for each module. A network schematic of the CLR-derived predictions at the 0.05 FDR for all Definitive HSCmodules
is shown. Pink squares represent modules and blue circles represent predicted TRs. ‘‘Hub’’ genes are labeled black. Genes assessed functionally in zebrafish are
highlighted in red. A list of all genes predicted to regulate each module can be found at http://hsc.hms.harvard.edu/.
(B) Whole-mount in situ hybridization for c-myb and Runx1was performed at 36 hpf on uninjected embryos or embryos injected with morpholinos (MO) targeting
Mllt3, Gfi1, Atf3, Tulp4, or Prdm16. Bars in Gfi1b panels designate the posterior ICM.
(C) The CHT of Prdm16 morphants was examined 4 dpf for c-myb/Runx1 expression via whole-mount in situ hybridization.
(D) Prdm16 morphants were examined via whole-mount in situ hybridization for mpo or l-plastin expression at 38 hpf.
(E) Prdm16 morphants were examined via whole-mount in situ hybridization for rag1 at 4 dpf.
See also Figures S6 and S7.
Cell Stem Cell
Transcriptome of Developing HSCs
710 Cell Stem Cell 11, 701–714, November 2, 2012 ª2012 Elsevier Inc.
Cell Stem Cell
Transcriptome of Developing HSCs
TRs, and evaluate the expression of genes of interest across the
data set.
Our zebrafish studies confirmed a role for Prdm16, Mllt3,
Gfi1b, Aft3, and Tulp4, but not Rfx5 andMsrb2 (data not shown),
in HSPC biology. These genes were all predicted as HSC regu-
lators by our data set and represent both known and less studied
hematopoietic factors. Our data implicate potential roles for both
Mllt3 and Tulp4 in HSC specification. Importantly, both of these
genes are Specifying hub genes:Mllt3 is a predicted regulator of
Specifying modules M40 and M28, and Tulp4, of Specifying
modules M28 and M19. Although Mllt3�/� deficient mice do
not have peripheral hematopoietic defects, their HSC com-
partment is unexplored (Collins et al., 2002; Iida et al., 1993).
Preliminary work suggests that ectopic Mllt3 during murine
ESC differentiation enhances the specification of hematopoietic
progenitors (data not shown). Prdm16, Gfi1b, and Atf3 were
each shown to contribute to different aspects of HSC biology,
likely downstream of specification: Gfi1b was shown to skew
the activity of posterior ICM EMPs, consistent with known roles
in erythoid/megakaryocyte biology (Hock and Orkin, 2006;
Randrianarison-Huetz et al., 2010). Zebrafish Prdm16 seems
required to maintain homeostasis as HSCs differentiate, in
agreement with recent data that mice require Prdm16 for HSC
maintenance and function (Aguilo et al., 2011; Chuikov et al.,
2010). Although Atf3 and Tulp4 were predicted to regulate
multiple Specifying and Definitive HSC modules by our analysis,
these two genes have never been previously linked to HSC
biology. Our finding that morpholino-mediated disruption of
these genes in developing zebrafish can perturb the expression
of key hematopoietic TRs suggests that these genesmay indeed
regulate HSCdevelopment and/or biology, although further work
is needed to clarify their precise roles. Nonetheless, here we
showed that multiple genes identified by our computational
strategy do indeed have functional consequences on developing
hematopoietic populations when disrupted in vivo, establishing
that this data set and analysis can identify functionally relevant
gene candidates.
Recent reports establishing hemogenic endothelium as the
source of definitive HSCs have generated tremendous interest
in elucidating the molecular mechanisms governing this transi-
tion. HoxA3, reported to suppress the hematopoietic signature
in endothelium (Iacovino et al., 2011), was identified in our study
as a repressor of the specifying module M28 (Figure 5). Erg, key
for fetal HSCs but dispensable for specification, is negatively
correlated with M19, a specifying module, but positively corre-
lated with M10, a definitive HSC module (Figure 5), exactly as
one would predict (Taoudi et al., 2011). Thus, our computational
analyses successfully identified and classified these known
regulators of HSC development.
Embryonic HSCs Can Be YS-like, Specifying,or DefinitiveWhen examined by hierarchical clustering and PCA, the multiple
independent HSPC populations interrogated in our study con-
verged on three transcriptionally distinct states: the neonatal re-
populating cells of the YS, the nascent HSCs and precursors of
the placenta and AGM, and definitive FL and WBM HSCs
(Figures 2A and 2B). The relatively few differences within these
groups seen by differential expression and GSEA support our
Cell
conclusion that there are three states of developing HSC. For
example, pathway enrichment analyses revealed only nine and
six differentially expressed categories when E13.5 or 14.5 FL
HSCs were compared with WBM-HSCs, respectively. Seven of
these nine differential groups relate to the already well-described
differences in cell cycle status between these groups (Fig-
ure S4A). In contrast, 17 and 21 differential groups are seen
when the AGM is compared to E13.5 or 14.5 FL HSCs, respec-
tively, suggesting a distinct state. This finding also suggests
that the definitive HSC signature is not acquired gradually during
gestation, but is specified suddenly around E12.5 as HSCs tran-
sition to the FL. This finding highlights again the critical impor-
tance of dissecting the molecular regulation of the conversion
from a Specifying to a Definitive HSC fate, because this is the
most dramatic and critical transition that occurs during HSC
ontogeny.
The E12.5 HSC Compartment Is Split between TwoTranscriptional StatesHSCs, rare in the E10.5–E11.5 conceptus, expand dramatically
in the FL and placenta between E11.5 and E12.5 due to an accel-
eration of de novo HSC specification (Taoudi et al., 2008)
(Mikkola et al., 2005). Surprisingly, hierarchical clustering and
PCA of our data reveal that the E12.5 HSC compartment is split
between an AGM-like transcriptional signature and a WBM-like
transcriptional signature: all placenta and FL12 A samples
clustered with VE-cadherin+CD45+ E11.5 AGM while all FL12
F, E13.5 FL, and E14.5 FL samples clustered with WBM HSCs.
Thus, some E12.5 HSCs share significant transcriptional overlap
with hemogenic endothelial precursors. This could be due to
ongoing HSC specification within the early FL or significant
numbers of nascent HSC newly arrived from the AGM that
have not yet silenced the hemogenic endothelial signature.While
VE-cadherin+CD45+ E11.5 AGM cells express only gamma
globin, FL12 A cells express a variety of fetal and adult hemo-
globin genes, suggesting a population in transition. Thus, our
unique data set and computational analyses suggest a model
in which HSCs originating from AGM hemogenic endothelial
precursors, and possibly placenta, seed the E12.5 FL and
acquire a complete definitive HSC signature over the next few
hours of development.
Nascent HSCs Share Transcriptional Overlap withMacrophages and Inflammatory CellsAlthough VE-cadherin+CD45+ AGM-derived and FL12 A cells
scored as HSPCs, they also correlated with macrophages via
the Naive Bayesian classifier (Figure 3A and Figure S3A). E11.5
AGM-derived VE-cadherin+CD45+ cells are amixture of hemato-
poietic progenitors, adult repopulating cells, and hemogenic
precursors that display a uniform blast-like morphology very
unlike that of macrophages (Taoudi et al., 2005). Our data
suggest that the AGM is enriched for nascent HSPCs that utilize
similar molecular mechanisms asmacrophages tomigrate to the
FL. Indeed, analysis of intra-aortic cell clusters by electron
microscopy reveals fillipodia extensions, suggestive of a popula-
tion primed to migrate (Medvinsky et al., 1996). VE-cadherin+
CD45+ are likely found in these cell clusters (Taoudi et al.,
2005). Like these nascent progenitors, inflammatory cells are
programmed to migrate (sites of infection versus FL). Live
Stem Cell 11, 701–714, November 2, 2012 ª2012 Elsevier Inc. 711
Cell Stem Cell
Transcriptome of Developing HSCs
imaging recently captured dramatic changes in cell shape and
motility as endothelial cells leave the aortic wall and commit to
a hematopoietic fate (Kissa and Herbomel, 2010). It is possible
that this process employs the same motility pathways as those
used by macrophages.
ESC-HSCs Transcriptionally Resemble Definitive HSCsThere have been many unsuccessful attempts to generate PSC-
HSCs (McKinney-Freeman and Daley, 2007). Recently, hemato-
poietic cells have been generated via coculturing human ESCs
with AGM-derived stromal lines or reprogramming committed
cells directly into hematopoietic progenitors without a pluripo-
tent intermediate, but the degree of hematopoietic engraftment
for these engineered populations lags behind accessible human
sources like umbilical cord blood (Ledran et al., 2008; Szabo
et al., 2010). Although murine ESC-HSCs can robustly engraft
lethally irradiated mice (Wang et al., 2005a), they do not faithfully
mimic the function or phenotype of WBM-HSCs (McKinney-
Freeman et al., 2009). Since ESC-HSCs express high levels of
CD41, we hypothesized that they might represent a develop-
mental intermediate. However, our data reveal that ESC-HSCs
cluster most closely with FL and WBM-HSCs, rather than E9
YS or day-6 EBs. While it has been thought that HoxB4 merely
expands a hematopoietic progenitor population already speci-
fied during EB differentiation, our results suggest that homeotic
gene expression, in conjunction with OP9 coculture, serves to
respecify a subset of CD41+ckit+ EB-derived cells toward
a definitive HSC fate, as originally argued (Kyba et al., 2002).
The aberrant function of ESC-HSCs is likely due to incomplete
specification or molecular perturbations caused by constitutive
ectopic homeobox gene expression and the absence of critical
exogenous and molecular cues. Indeed, Tek and HoxA9 expres-
sion is starkly absent from ESC-HSCs relative to FL and WBM
HSCs. Tek (also known as Tie2) regulates HSC maintenance
while HoxA9 is required for normal hematopoiesis (Arai et al.,
2004; Lawrence et al., 1997; Takakura et al., 1998). In addition,
pair-wise comparison between ESC-HSCs and FL/WBM HSCs
revealed the absence of a transcriptional response to Notch
signaling, which could explain the inability of these cells to faith-
fully generate lymphoid cells. Further work is required to deter-
mine if rescuing the Notch transcriptional response restores the
lymphoid potential of homeobox-derived ESC-HSCs. Most
importantly, since ESC-HSCs are closely related to definitive
HSCs, yet functionally restricted, they represent a unique
opportunity to uncover molecular regulators of definitive HSC
function.
EXPERIMENTAL PROCEDURES
Details on embryo dissections, cell culture, zebrafish, Fluidigm validation
experiments, and data analysis are described in the Supplemental Experi-
mental Procedures available online.
Cell Fractionation
Cell sorting was performed as previously described (McKinney-Freeman et al.,
2009). For all populations, cells were first collected in PBS and then sorted
a second time into lysis buffer (RNAeasy Microkit, QIAGEN).
Microarray
The RNAeasy Microkit (QIAGEN) was used to collect and prepare total RNA for
microarray and Fluidigm analysis. The Ovation Picokit (Nugen) was used for
712 Cell Stem Cell 11, 701–714, November 2, 2012 ª2012 Elsevier In
preamplification. Gene expression profiling was performed on Affymetrix
430 2.0 gene chips per standard protocol.
Computational Analysis
Normalization, batch correction, differential analysis, and hierarchical
clustering of microarray data are described in detail in the Supplemental
Experimental Procedures. WGCNA, a clustering algorithm that selects
clustering cutoffs such that the resulting gene network follows a scale-
free distribution (Zhang and Horvath, 2005), was used to find sets of
positively coregulated genes. Module profiles were computed by calculating
the sample median of standardized gene expression values in each
module. Module regulatory networks were constructed by applying the
CLR algorithm to the matrix consisting of the standardized expression
values of 1,171 transcription regulators detected as present in at least
one biological group and the module profiles. FDRs were calculated as
previously described (Faith et al., 2007). Stage-specific and stage-enriched
modules were defined as those expressed higher in one stage versus all
other stages (Holm corrected p < 1*10�10 and p < 1*10�2, respectively).
GEO accessions of the mESC samples are GSE16925 and GSE14012.
Positive control samples for the classification analysis (Figure 3B) are
GSM516564 and GSM463712 for the macrophage and HSC samples,
respectively.
ACCESSION NUMBERS
The GEO accession for the newly generated data presented here is
GSE37000.
SUPPLEMENTAL INFORMATION
Supplemental Information for this article includes seven figures, one table, and
Supplemental Experimental Procedures and can be found with this article
online at http://dx.doi.org/10.1016/j.stem.2012.07.018.
ACKNOWLEDGMENTS
We thank M.W. Lensch for helpful discussions and critical review of the
manuscript, N. Gerry for assistance with gene expression arrays, and
J. Daley and S. Lazo-Kallanian of the Dana Farber Cancer Institute (Boston,
MA) and Richard Ashman and Jim Houston of St. Jude Children’s Research
Hospital (Memphis, TN) for expertise in cell sorting and flow cytometry.
Fluidigm experiments were performed by the Molecular Genetics Core
Facility at Children’s Hospital Boston supported by NIH-P50-NS40828 and
NIH-P30-HD18655. S.M.F. was supported by NIH grant K01 DK080846.
G.Q.D. is supported by grants from the NIH (RO1-DK70055, RO1-
DK59279, UO1-HL100001, Progenitor cell biology consortium, R24-
DK092760, and special funds from the ARRA stimulus package RC2-
HL102815), the Roche Foundation for Anemia Research, Alex’s Lemonade
Stand, and the Harvard Stem Cell Institute. G.Q.D. is an affiliate member
of the Broad Institute, a recipient of Clinical Scientist Awards in Translational
Research from the Burroughs Wellcome Fund and the Leukemia and
Lymphoma Society, and an investigator of the Manton Center for Orphan
Disease Research. P.C. is supported by grants T32HL007623 and
2T32HL66987-11 from the NHLBI. G.Q.D., L.I.Z., and J.J.C. are investigators
of the Howard Hughes Medical Institute. L.I.Z. is supported by HHMI and
NIH NIDDK 1R24DK092760-01. J.J.C. and H.L. are supported by Howard
Hughes Medical Institute, SysCODE (Systems-based Consortium for Organ
Design & Engineering), and NIH grant # RL1DE019021, and H.L. is supported
by Boston University Clinical and Translational Science Institute (CTSI) grant
# UL1-TR000157. C.L. was supported by grants from the Deutsche Kreb-
shilfe (Max Eder Program) and the Deutsche Forschungsgemeinschaft
(SFB773). L.I.Z. is a founder and stock holder of Fate, Inc. and a scientific
advisor for Stemgent.
Received: July 15, 2011
Revised: February 13, 2012
Accepted: July 23, 2012
Published: November 1, 2012
c.
Cell Stem Cell
Transcriptome of Developing HSCs
REFERENCES
Aguilo, F., Avagyan, S., Labar, A., Sevilla, A., Lee, D.F., Kumar, P., Lemischka,
I.R., Zhou, B.Y., and Snoeck, H.W. (2011). Prdm16 is a physiologic regulator of
hematopoietic stem cells. Blood 117, 5057–5066.
Arai, F., Hirao, A., Ohmura, M., Sato, H., Matsuoka, S., Takubo, K., Ito, K., Koh,
G.Y., and Suda, T. (2004). Tie2/angiopoietin-1 signaling regulates hematopoi-
etic stem cell quiescence in the bone marrow niche. Cell 118, 149–161.
Barabasi, A.L., and Oltvai, Z.N. (2004). Network biology: understanding the
cell’s functional organization. Nat. Rev. Genet. 5, 101–113.
Bonde, S., Chan, K.M., and Zavazava, N. (2008). ES-cell derived hematopoi-
etic cells induce transplantation tolerance. PLoS ONE 3, e3212.
Chuikov, S., Levi, B.P., Smith, M.L., and Morrison, S.J. (2010). Prdm16
promotes stem cell maintenance inmultiple tissues, partly by regulating oxida-
tive stress. Nat. Cell Biol. 12, 999–1006.
Ciaccio, M.F., Wagner, J.P., Chuu, C.P., Lauffenburger, D.A., and Jones, R.B.
(2010). Systems analysis of EGF receptor signaling dynamics with microwes-
tern arrays. Nat. Methods 7, 148–155.
Collins, E.C., Appert, A., Ariza-McNaughton, L., Pannell, R., Yamada, Y., and
Rabbitts, T.H. (2002). Mouse Af9 is a controller of embryo patterning, like Mll,
whose human homologue fuses with Af9 after chromosomal translocation in
leukemia. Mol. Cell. Biol. 22, 7313–7324.
di Bernardo, D., Thompson, M.J., Gardner, T.S., Chobot, S.E., Eastwood, E.L.,
Wojtovich, A.P., Elliott, S.J., Schaus, S.E., and Collins, J.J. (2005).
Chemogenomic profiling on a genome-wide scale using reverse-engineered
gene networks. Nat. Biotechnol. 23, 377–383.
Ergun, A., Lawrence, C.A., Kohanski, M.A., Brennan, T.A., and Collins, J.J.
(2007). A network biology approach to prostate cancer. Mol. Syst. Biol. 3, 82.
Ernst, P., Wang, J., and Korsmeyer, S.J. (2002). The role of MLL in hematopoi-
esis and leukemia. Curr. Opin. Hematol. 9, 282–287.
Faith, J.J., Hayete, B., Thaden, J.T., Mogno, I., Wierzbowski, J., Cottarel, G.,
Kasif, S., Collins, J.J., and Gardner, T.S. (2007). Large-scale mapping and
validation of Escherichia coli transcriptional regulation from a compendium
of expression profiles. PLoS Biol. 5, e8.
Ferkowicz, M.J., Starr, M., Xie, X., Li, W., Johnson, S.A., Shelley, W.C.,
Morrison, P.R., and Yoder, M.C. (2003). CD41 expression defines the onset
of primitive and definitive hematopoiesis in the murine embryo. Development
130, 4393–4403.
Godin, I., and Cumano, A. (2002). The hare and the tortoise: an embryonic
haematopoietic race. Nat. Rev. Immunol. 2, 593–604.
Goessling, W., North, T.E., Loewer, S., Lord, A.M., Lee, S., Stoick-Cooper,
C.L., Weidinger, G., Puder, M., Daley, G.Q., Moon, R.T., and Zon, L.I. (2009).
Genetic interaction of PGE2 andWnt signaling regulates developmental spec-
ification of stem cells and regeneration. Cell 136, 1136–1147.
Hirose, K., Inukai, T., Kikuchi, J., Furukawa, Y., Ikawa, T., Kawamoto, H.,
Oram, S.H., Gottgens, B., Kiyokawa, N., Miyagawa, Y., et al. (2010).
Aberrant induction of LMO2 by the E2A-HLF chimeric transcription factor
and its implication in leukemogenesis of B-precursor ALL with t(17;19).
Blood 116, 962–970.
Hock, H., andOrkin, S.H. (2006). Zinc-finger transcription factor Gfi-1: versatile
regulator of lymphocytes, neutrophils and hematopoietic stem cells. Curr.
Opin. Hematol. 13, 1–6.
Hock, H., Hamblen, M.J., Rooke, H.M., Schindler, J.W., Saleque, S., Fujiwara,
Y., and Orkin, S.H. (2004). Gfi-1 restricts proliferation and preserves functional
integrity of haematopoietic stem cells. Nature 431, 1002–1007.
Iacovino, M., Chong, D., Szatmari, I., Hartweck, L., Rux, D., Caprioli, A.,
Cleaver, O., and Kyba, M. (2011). HoxA3 is an apical regulator of haemogenic
endothelium. Nat. Cell Biol. 13, 72–78.
Iida, S., Seto,M., Yamamoto, K., Komatsu, H., Tojo, A., Asano, S., Kamada, N.,
Ariyoshi, Y., Takahashi, T., and Ueda, R. (1993). MLLT3 gene on 9p22 involved
in t(9;11) leukemia encodes a serine/proline rich protein homologous toMLLT1
on 19p13. Oncogene 8, 3085–3092.
Izraeli, S. (2004). Leukaemia — a developmental perspective. Br. J. Haematol.
126, 3–10.
Cell
Jeanson, N.T., and Scadden, D.T. (2010). Vitamin D receptor deletion leads to
increased hematopoietic stem and progenitor cells residing in the spleen.
Blood 116, 4126–4129.
Jin, H., Sood, R., Xu, J., Zhen, F., English, M.A., Liu, P.P., and Wen, Z. (2009).
Definitive hematopoietic stem/progenitor cells manifest distinct differentiation
output in the zebrafish VDA and PBI. Development 136, 647–654.
Kandasamy, K., Mohan, S.S., Raju, R., Keerthikumar, S., Kumar, G.S.,
Venugopal, A.K., Telikicherla, D., Navarro, J.D., Mathivanan, S., Pecquet, C.,
et al. (2010). NetPath: a public resource of curated signal transduction
pathways. Genome Biol. 11, R3.
Keller, G., Kennedy, M., Papayannopoulou, T., and Wiles, M.V. (1993).
Hematopoietic commitment during embryonic stem cell differentiation in
culture. Mol. Cell. Biol. 13, 473–486.
Kiel, M.J., Yilmaz, O.H., Iwashita, T., Yilmaz, O.H., Terhorst, C., and Morrison,
S.J. (2005). SLAM family receptors distinguish hematopoietic stem
and progenitor cells and reveal endothelial niches for stem cells. Cell 121,
1109–1121.
Kim, I., Saunders, T.L., and Morrison, S.J. (2007). Sox17 dependence
distinguishes the transcriptional regulation of fetal from adult hematopoietic
stem cells. Cell 130, 470–483.
Kissa, K., and Herbomel, P. (2010). Blood stem cells emerge from aortic endo-
thelium by a novel type of cell transition. Nature 464, 112–115.
Krens, S.F., Corredor-Adamez, M., He, S., Snaar-Jagalska, B.E., and Spaink,
H.P. (2008). ERK1 and ERK2 MAPK are key regulators of distinct gene sets in
zebrafish embryogenesis. BMC Genomics 9, 196.
Kumaravelu, P., Hook, L., Morrison, A.M., Ure, J., Zhao, S., Zuyev, S., Ansell,
J., andMedvinsky, A. (2002). Quantitative developmental anatomy of definitive
haematopoietic stem cells/long-term repopulating units (HSC/RUs): role of the
aorta-gonad-mesonephros (AGM) region and the yolk sac in colonisation of
the mouse embryonic liver. Development 129, 4891–4899.
Kyba, M., Perlingeiro, R.C., and Daley, G.Q. (2002). HoxB4 confers definitive
lymphoid-myeloid engraftment potential on embryonic stem cell and yolk
sac hematopoietic progenitors. Cell 109, 29–37.
Lancrin, C., Sroczynska, P., Stephenson, C., Allen, T., Kouskoff, V., and
Lacaud, G. (2009). The haemangioblast generates haematopoietic cells
through a haemogenic endothelium stage. Nature 457, 892–895.
Lawrence, H.J., Helgason, C.D., Sauvageau, G., Fong, S., Izon, D.J.,
Humphries, R.K., and Largman, C. (1997). Mice bearing a targeted interruption
of the homeobox gene HOXA9 have defects in myeloid, erythroid, and
lymphoid hematopoiesis. Blood 89, 1922–1930.
Leddin, M., Perrod, C., Hoogenkamp,M., Ghani, S., Assi, S., Heinz, S., Wilson,
N.K., Follows, G., Schonheit, J., Vockentanz, L., et al. (2011). Two distinct
auto-regulatory loops operate at the PU.1 locus in B cells and myeloid cells.
Blood 117, 2827–2838.
Ledran, M.H., Krassowska, A., Armstrong, L., Dimmick, I., Renstrom, J., Lang,
R., Yung, S., Santibanez-Coref, M., Dzierzak, E., Stojkovic, M., et al. (2008).
Efficient hematopoietic differentiation of human embryonic stem cells on
stromal cells derived from hematopoietic niches. Cell Stem Cell 3, 85–98.
Magnusson, M., Brun, A.C., Lawrence, H.J., and Karlsson, S. (2007). Hoxa9/
hoxb3/hoxb4 compound null mice display severe hematopoietic defects.
Exp. Hematol. 35, 1421–1428.
Margolin, A.A., Nemenman, I., Basso, K., Wiggins, C., Stolovitzky, G., Dalla
Favera, R., and Califano, A. (2006). ARACNE: an algorithm for the reconstruc-
tion of gene regulatory networks in a mammalian cellular context. BMC
Bioinformatics 7 (Suppl 1 ), S7.
McKinney-Freeman, S.L., and Daley, G.Q. (2007). Towards hematopoietic
reconstitution from embryonic stem cells: a sanguine future. Curr. Opin.
Hematol. 14, 343–347.
McKinney-Freeman, S.L., Lengerke, C., Jang, I.H., Schmitt, S., Wang, Y.,
Philitas, M., Shea, J., and Daley, G.Q. (2008). Modulation of murine embryonic
stem cell-derived CD41+c-kit+ hematopoietic progenitors by ectopic expres-
sion of Cdx genes. Blood 111, 4944–4953.
McKinney-Freeman, S.L., Naveiras, O., Yates, F., Loewer, S., Philitas, M.,
Curran, M., Park, P.J., and Daley, G.Q. (2009). Surface antigen phenotypes
Stem Cell 11, 701–714, November 2, 2012 ª2012 Elsevier Inc. 713
Cell Stem Cell
Transcriptome of Developing HSCs
of hematopoietic stem cells from embryos and murine embryonic stem cells.
Blood 114, 268–278.
Medvinsky, A.L., Gan, O.I., Semenova, M.L., and Samoylina, N.L. (1996).
Development of day-8 colony-forming unit-spleen hematopoietic progenitors
during early murine embryogenesis: spatial and temporal mapping. Blood 87,
557–566.
Medvinsky, A., Rybtsov, S., and Taoudi, S. (2011). Embryonic origin of the
adult hematopoietic system: advances and questions. Development 138,
1017–1031.
Michoel, T., De Smet, R., Joshi, A., Van de Peer, Y., and Marchal, K. (2009).
Comparative analysis of module-based versus direct methods for reverse-
engineering transcriptional regulatory networks. BMC Syst. Biol. 3, 49.
Mikkola, H.K., Fujiwara, Y., Schlaeger, T.M., Traver, D., and Orkin, S.H. (2003).
Expression of CD41 marks the initiation of definitive hematopoiesis in the
mouse embryo. Blood 101, 508–516.
Mikkola, H.K., Gekas, C., Orkin, S.H., and Dieterlen-Lievre, F. (2005).
Placenta as a site for hematopoietic stem cell development. Exp. Hematol.
33, 1048–1054.
Novershtern, N., Subramanian, A., Lawton, L.N., Mak, R.H., Haining, W.N.,
McConkey, M.E., Habib, N., Yosef, N., Chang, C.Y., Shay, T., et al. (2011).
Densely interconnected transcriptional circuits control cell states in human
hematopoiesis. Cell 144, 296–309.
Okada, S., Fukuda, T., Inada, K., and Tokuhisa, T. (1999). Prolonged expres-
sion of c-fos suppresses cell cycle entry of dormant hematopoietic stem cells.
Blood 93, 816–825.
Park, I.K., Qian, D., Kiel, M., Becker, M.W., Pihalja, M., Weissman, I.L.,
Morrison, S.J., and Clarke, M.F. (2003). Bmi-1 is required for maintenance of
adult self-renewing haematopoietic stem cells. Nature 423, 302–305.
Pina, C., May, G., Soneji, S., Hong, D., and Enver, T. (2008). MLLT3 regulates
early human erythroid andmegakaryocytic cell fate. Cell StemCell 2, 264–273.
Randrianarison-Huetz, V., Laurent, B., Bardet, V., Blobe, G.C., Huetz, F., and
Dumenil, D. (2010). Gfi-1B controls human erythroid and megakaryocytic
differentiation by regulating TGF-beta signaling at the bipotent erythro-mega-
karyocytic progenitor stage. Blood 115, 2784–2795.
Rhodes, K.E., Gekas, C., Wang, Y., Lux, C.T., Francis, C.S., Chan, D.N.,
Conway, S., Orkin, S.H., Yoder, M.C., and Mikkola, H.K. (2008). The
emergence of hematopoietic stem cells is initiated in the placental vasculature
in the absence of circulation. Cell Stem Cell 2, 252–263.
Robin, C., Ottersbach, K., Durand, C., Peeters, M., Vanes, L., Tybulewicz, V.,
and Dzierzak, E. (2006). An unexpected role for IL-3 in the embryonic develop-
ment of hematopoietic stem cells. Dev. Cell 11, 171–180.
Sankaran, V.G., Menne, T.F., Xu, J., Akie, T.E., Lettre, G., Van Handel, B.,
Mikkola, H.K., Hirschhorn, J.N., Cantor, A.B., and Orkin, S.H. (2008). Human
fetal hemoglobin expression is regulated by the developmental stage-specific
repressor BCL11A. Science 322, 1839–1842.
Segal, E., Shapira, M., Regev, A., Pe’er, D., Botstein, D., Koller, D., and
Friedman, N. (2003). Module networks: identifying regulatory modules and
714 Cell Stem Cell 11, 701–714, November 2, 2012 ª2012 Elsevier In
their condition-specific regulators from gene expression data. Nat. Genet.
34, 166–176.
Seita, J., and Weissman, I.L. (2010). Hematopoietic stem cell: self-renewal
versus differentiation. Wiley Interdiscip. Rev. Syst. Biol. Med. 2, 640–653.
Srinivasan, R., Zabuawala, T., Huang, H., Zhang, J., Gulati, P., Fernandez, S.,
Karlo, J.C., Landreth, G.E., Leone, G., and Ostrowski, M.C. (2009). Erk1 and
Erk2 regulate endothelial cell proliferation and migration during mouse embry-
onic angiogenesis. PLoS ONE 4, e8283.
Szabo, E., Rampalli, S., Risueno, R.M., Schnerch, A., Mitchell, R., Fiebig-
Comyn, A., Levadoux-Martin, M., and Bhatia, M. (2010). Direct conversion of
human fibroblasts to multilineage blood progenitors. Nature 468, 521–526.
Tabayoyong, W.B., Salas, J.G., Bonde, S., and Zavazava, N. (2009). HOXB4-
transduced embryonic stem cell-derived Lin-c-kit+ and Lin-Sca-1+ hemato-
poietic progenitors express H60 and are targeted by NK cells. J. Immunol.
183, 5449–5457.
Takakura, N., Huang, X.L., Naruse, T., Hamaguchi, I., Dumont, D.J.,
Yancopoulos, G.D., and Suda, T. (1998). Critical role of the TIE2 endothelial
cell receptor in the development of definitive hematopoiesis. Immunity 9,
677–686.
Taoudi, S., Morrison, A.M., Inoue, H., Gribi, R., Ure, J., and Medvinsky, A.
(2005). Progressive divergence of definitive haematopoietic stem cells from
the endothelial compartment does not depend on contact with the foetal liver.
Development 132, 4179–4191.
Taoudi, S., Gonneau, C., Moore, K., Sheridan, J.M., Blackburn, C.C., Taylor,
E., and Medvinsky, A. (2008). Extensive hematopoietic stem cell generation
in the AGM region via maturation of VE-cadherin+CD45+ pre-definitive
HSCs. Cell Stem Cell 3, 99–108.
Taoudi, S., Bee, T., Hilton, A., Knezevic, K., Scott, J., Willson, T.A., Collin, C.,
Thomas, T., Voss, A.K., Kile, B.T., et al. (2011). ERG dependence distinguishes
developmental control of hematopoietic stem cell maintenance from hemato-
poietic specification. Genes Dev. 25, 251–262.
Taylor, R.C., Acquaah-Mensah, G., Singhal, M., Malhotra, D., and Biswal, S.
(2008). Network inference algorithms elucidate Nrf2 regulation of mouse
lung oxidative stress. PLoS Comput. Biol. 4, e1000166.
Wang, L., Menendez, P., Shojaei, F., Li, L., Mazurier, F., Dick, J.E., Cerdan, C.,
Levac, K., and Bhatia, M. (2005a). Generation of hematopoietic repopulating
cells from human embryonic stem cells independent of ectopic HOXB4
expression. J. Exp. Med. 201, 1603–1614.
Wang, Y., Yates, F., Naveiras, O., Ernst, P., and Daley, G.Q. (2005b).
Embryonic stem cell-derived hematopoietic stem cells. Proc. Natl. Acad.
Sci. USA 102, 19081–19086.
Wilson, A., Laurenti, E., and Trumpp, A. (2009). Balancing dormant and self-
renewing hematopoietic stem cells. Curr. Opin. Genet. Dev. 19, 461–468.
Zhang, B., and Horvath, S. (2005). A general framework for weighted gene
co-expression network analysis. Stat. Appl. Genet. Mol. Biol. 4, 1128.
c.