Cell Signalling Presentationbetween animal cells Plasmodesmata between plant cells (a) Cell...
39
Cell Signaling
Transcript of Cell Signalling Presentationbetween animal cells Plasmodesmata between plant cells (a) Cell...

Cell Signaling

Figure 11.6-3
Plasma membraneEXTRACELLULAR FLUID
CYTOPLASM
Reception Transduction Response
Receptor
Signalingmolecule
Activationof cellular response
Relay molecules in a signal transductionpathway
321

Signal Transduction Pathway
1. Reception = target cell detects signal from outside; signal molecule binds to receptor protein
2. Transduction = binding of signal molecule changes receptor protein; may be single step or pathway
3. Response = transduced signal causes cellular activity
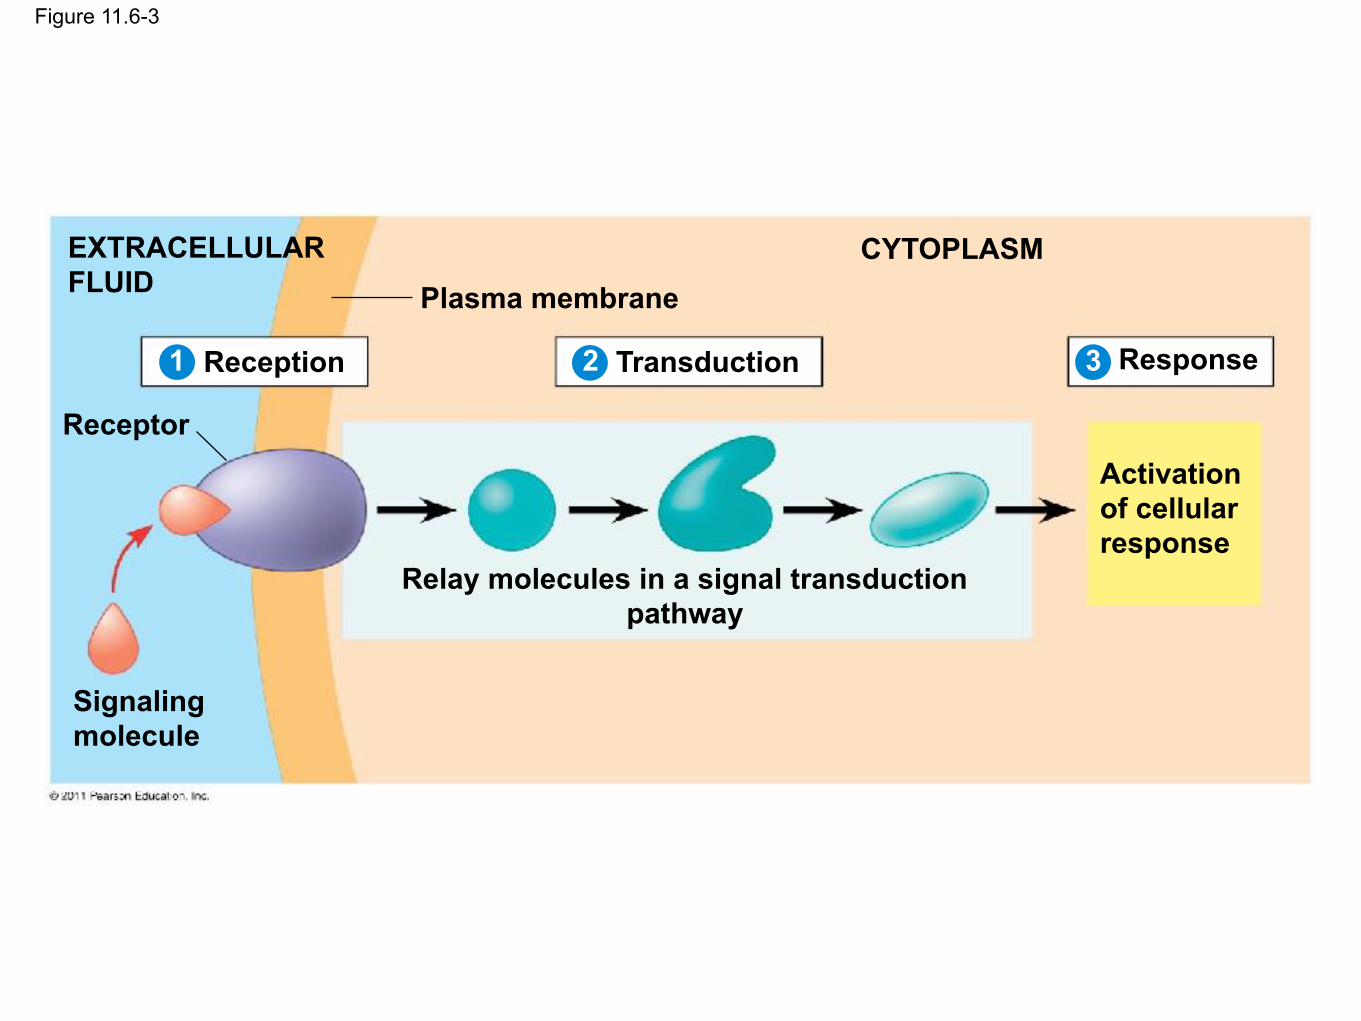
Figure 11.6-3
Plasma membraneEXTRACELLULAR FLUID
CYTOPLASM
Reception Transduction Response
Receptor
Signalingmolecule
Activationof cellular response
Relay molecules in a signal transductionpathway
321

Figure 11.2
Exchange of mating factors
Receptor α factor
a factorYeast cell,
mating type aYeast cell,
mating type α
Mating
New a/α cell
1
2
3
a
a
a/α
α
α
Advantages of the new a/α cell?
Example: Mating in Yeast

Types of Cell Signaling

Local v. Long-Distance Signaling
Local Signaling
direct contact = cell to cell recognition, cell junctions
messenger molecules = paracrine signaling, synaptic signaling, quorum sensing

Figure 11.4Plasma membranes
Gap junctions between animal cells
Plasmodesmatabetween plant cells
(a) Cell junctions
(b) Cell-cell recognition

Figure 11.5
Local signaling
Target cell
Secretingcell
Secretoryvesicle
Local regulator diffuses throughextracellular fluid.
(a) Paracrine signaling (b) Synaptic signaling
Electrical signalalong nerve celltriggers release ofneurotransmitter.
Neurotransmitter diffuses across synapse.
Target cellis stimulated.
*Growth factors* *Nervous system*

Local Signaling- Quorum Sensing
Accumulating signal molecule allows bacteria to determine density; coordinates behavior

Local v. Long-Distance Signaling (cont.)
Long-Distance Signaling
hormones = endocrine signaling
molecules travel through circulatory system to target cells; molecular structures vary
ex: insulin & glucagon (more on this later!)


Signals and Receptors

Cell-Surface Transmembrane Receptors
1. G-protein coupled receptors
2. Receptor tyrosine kinases
3. Ion channel receptors
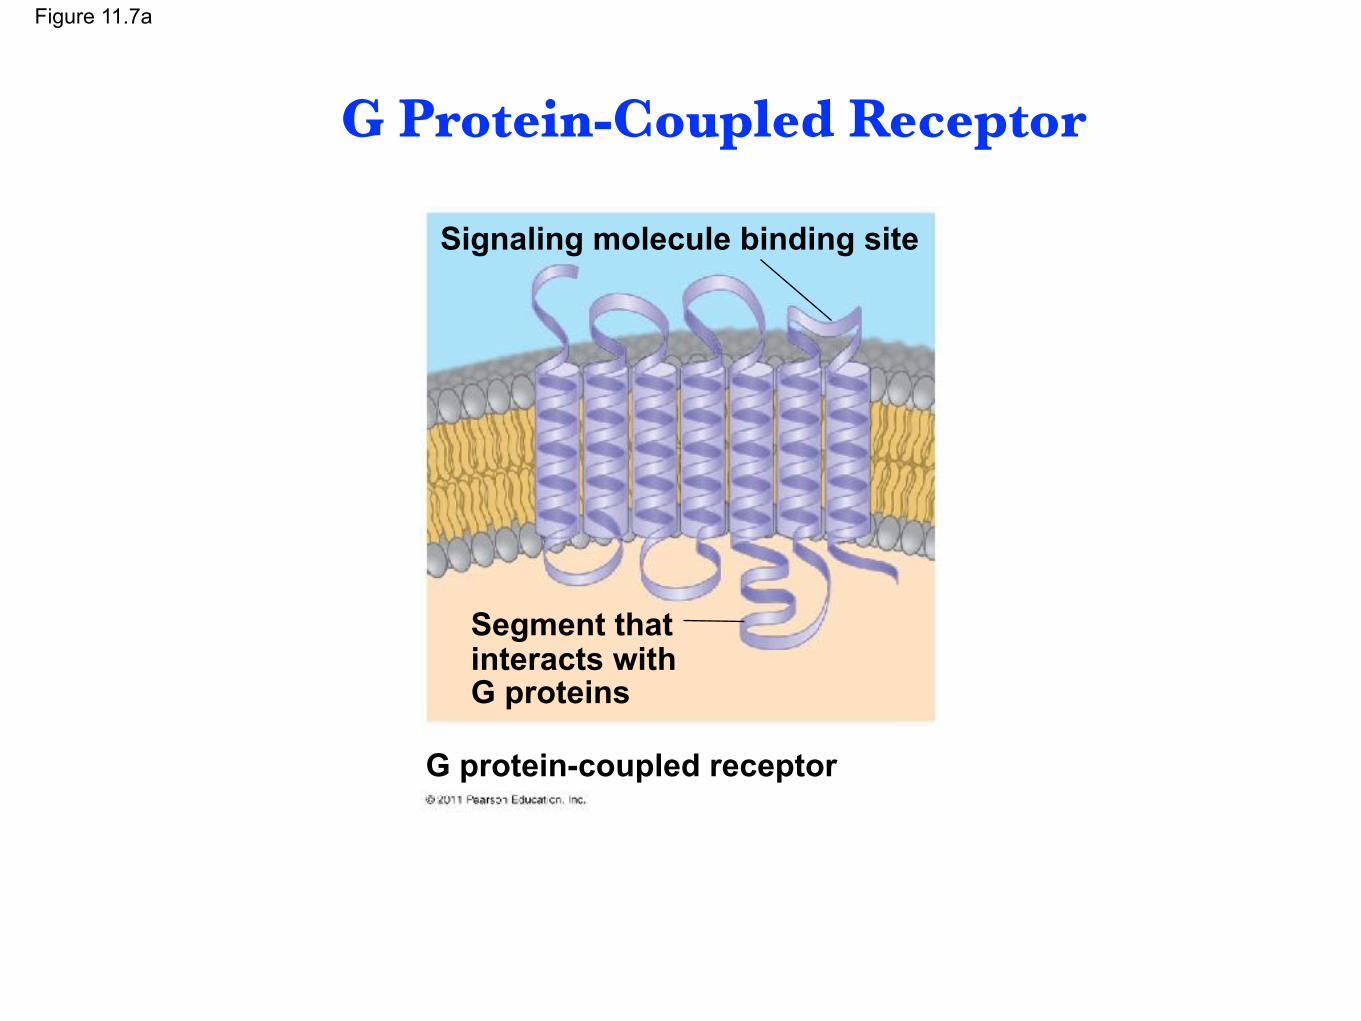
Figure 11.7a
G protein-coupled receptor
Signaling molecule binding site
Segment thatinteracts with G proteins
G Protein-Coupled Receptor

Figure 11.7b
G protein-coupled receptor
21
3 4
Plasma membrane
G protein(inactive)
CYTOPLASM Enzyme
Activatedreceptor
Signalingmolecule
Inactive enzyme
Activatedenzyme
Cellular response
GDPGTP
GDPGTP
GTP
P i
GDP
GDP
G protein-coupled receptor

Figure 11.7c
Signaling molecule (ligand)
21
3 4
Ligand-binding site
α helix in the membrane
Tyrosines
CYTOPLASM Receptor tyrosine kinase proteins (inactive monomers)
Signalingmolecule
Dimer
Tyr
Tyr
Tyr
Tyr
Tyr
Tyr
Tyr
Tyr
Tyr
Tyr
Tyr
Tyr
Tyr
Tyr
Tyr
Tyr
Tyr
Tyr
Tyr
Tyr
Tyr
Tyr
Tyr
Tyr
Tyr
Tyr
Tyr
Tyr
Tyr
Tyr
Tyr
Tyr
Tyr
Tyr
Tyr
Tyr
P
P
P
P
P
P
P
P
P
P
P
P
Activated tyrosine kinase regions(unphosphorylateddimer)
Fully activatedreceptor tyrosine kinase(phosphorylateddimer)
Activated relayproteins
Cellularresponse 1
Cellularresponse 2
Inactive relay proteins
6 ATP 6 ADP
Receptor Tyrosine Kinase
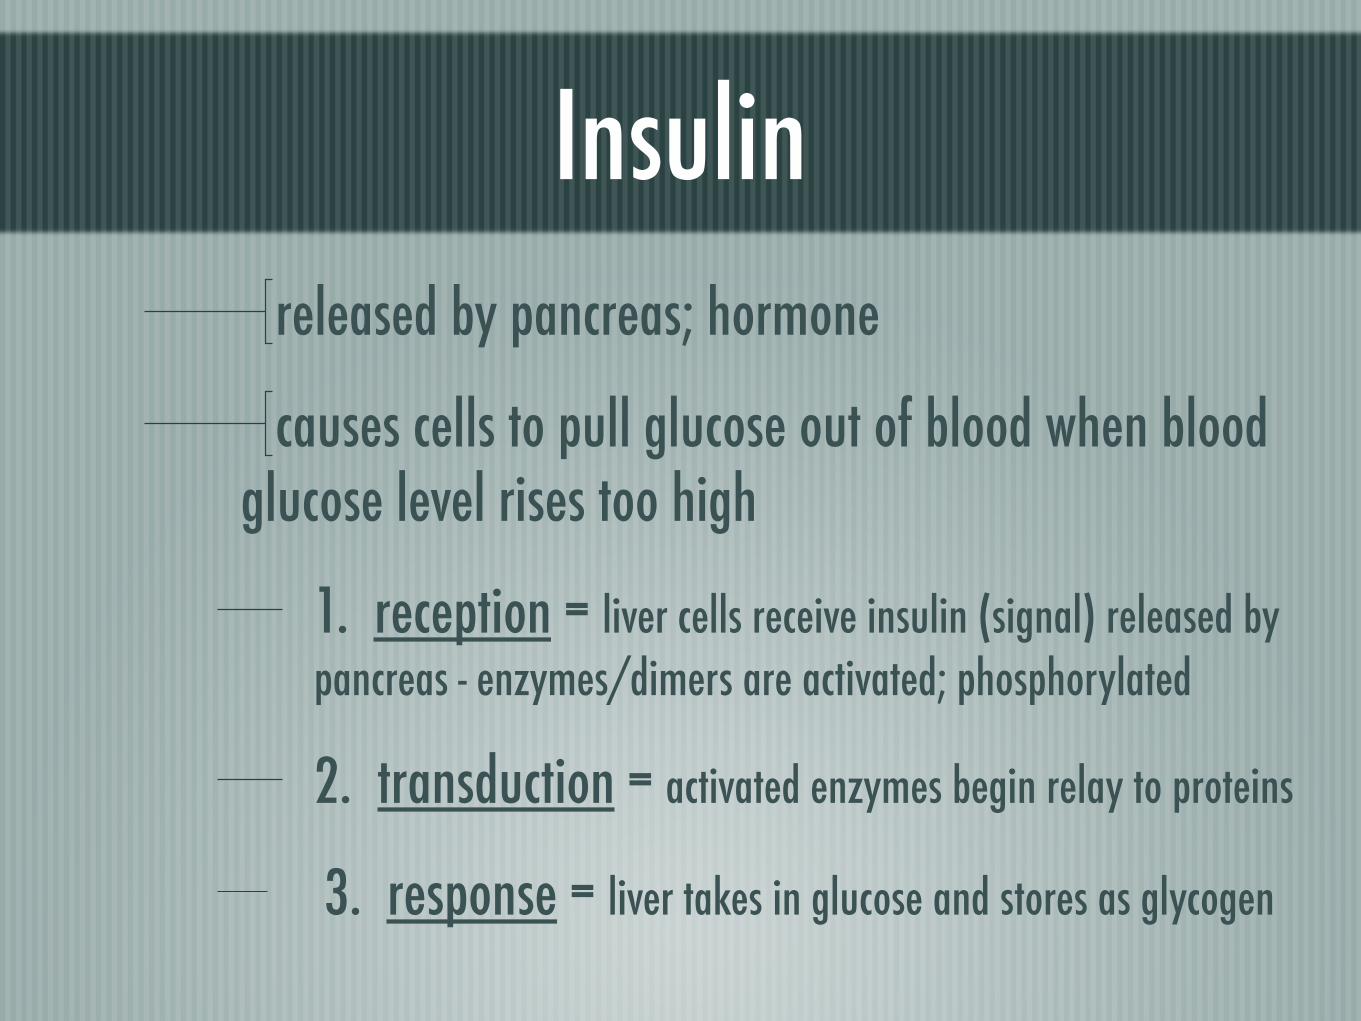
Insulinreleased by pancreas; hormone
causes cells to pull glucose out of blood when blood glucose level rises too high
1. reception = liver cells receive insulin (signal) released by pancreas - enzymes/dimers are activated; phosphorylated
2. transduction = activated enzymes begin relay to proteins
3. response = liver takes in glucose and stores as glycogen

Glucagon
released by pancreas; hormone
causes glucose to be released from liver when blood glucose level gets too low
functions with a g protein receptor

Glucagon/Insulin Feedback Loop
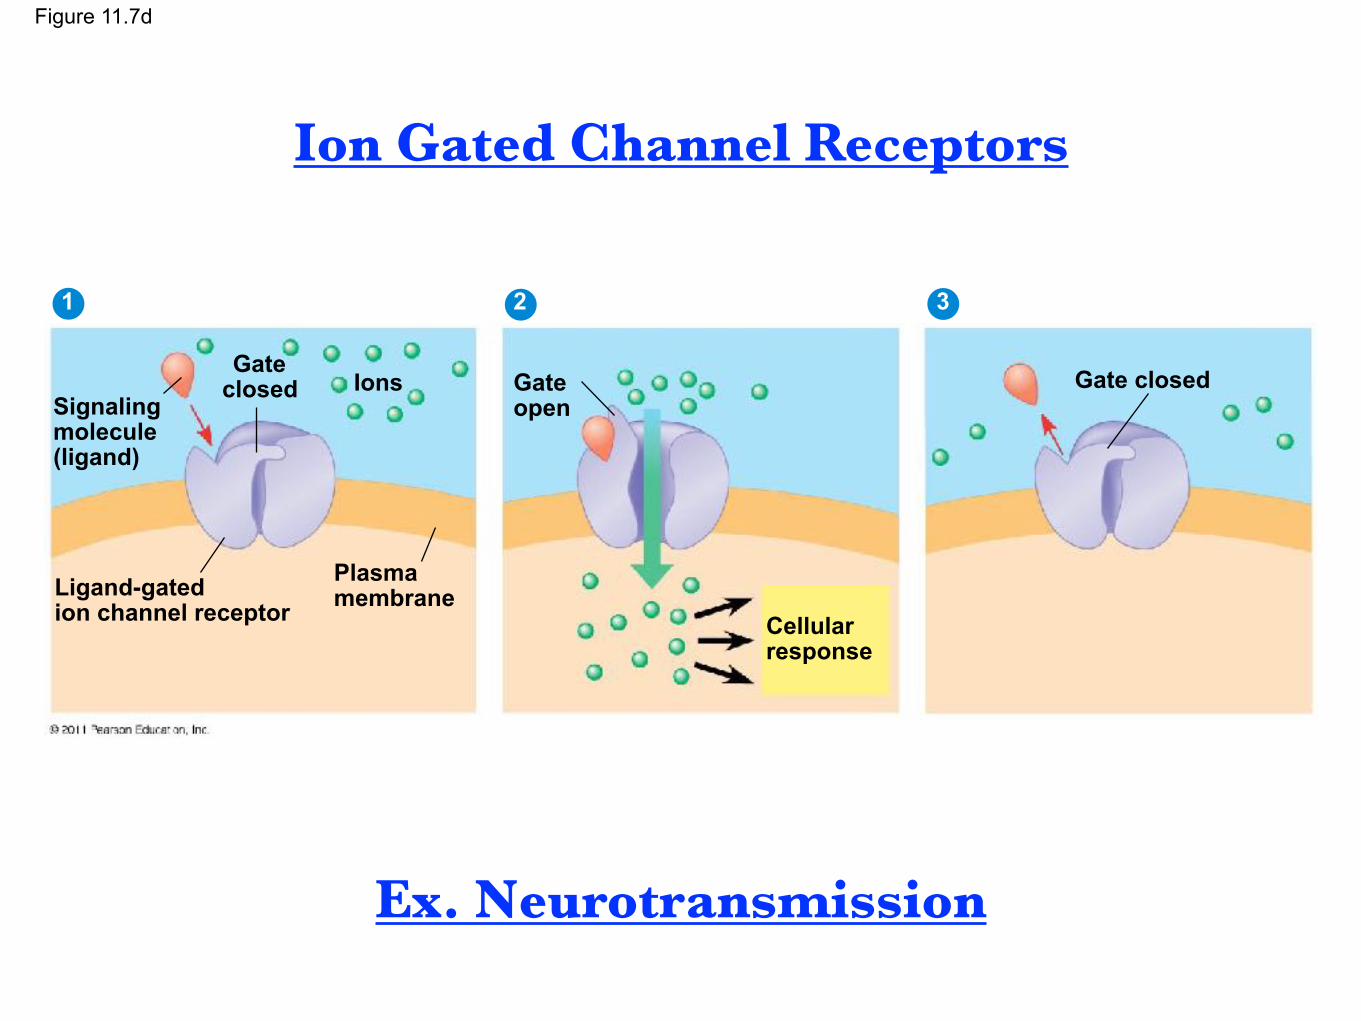
Figure 11.7d
Signaling molecule (ligand)
21 3
Gate closed Ions
Ligand-gatedion channel receptor
Plasma membrane
Gate open
Cellularresponse
Gate closed
Ion Gated Channel Receptors
Ex. Neurotransmission

Why all the steps?! • Many steps amplify the signal (cascade)
• Well coordinated; do not affect outside cells
• Different types of cells —> Different genes expressed —> Different types of responses!

Figure 11.10
Receptor
Signaling molecule
Activated relaymolecule
Phosphorylation cascade
Inactive protein kinase
1 Active protein kinase
1
Active protein kinase
2
Active protein kinase
3
Inactive protein kinase
2
Inactive protein kinase
3
Inactive protein
Active protein
Cellularresponse
ATPADP
ATPADP
ATPADP
PP
PP
PP
P
P
P
P i
P i
P i

Figure 11.16
Reception
Transduction
Response
Binding of epinephrine to G protein-coupled receptor (1 molecule)
Inactive G protein
Active G protein (102 molecules)
Inactive adenylyl cyclaseActive adenylyl cyclase (102)
ATPCyclic AMP (104)
Inactive protein kinase AActive protein kinase A (104)
Inactive phosphorylase kinaseActive phosphorylase kinase (105)
Inactive glycogen phosphorylaseActive glycogen phosphorylase (106)
GlycogenGlucose 1-phosphate
(108 molecules)
Ex. Epinephrine

Secondary Messenger
(cAMP)

Figure 11.12
G protein
First messenger(signaling molecule such as epinephrine)
G protein-coupled receptor
Adenylylcyclase
Second messenger
Cellular responses
Proteinkinase A
GTP
ATPcAMP

Cholera
caused by Vibrio cholerae from human feces in drinking water
produce toxins that modify G protein to remain stuck in active form
high concentration of cAMP = large secretions of salt into intestines = profuse diarrhea = dehydration

Cholera Pathway

Apoptosis=programmed cell death
DNA is “chopped,” organelles are split
cell shrinks & forms lobes (blebbing)
vesicles package up blebs, then are engulfed
process often begins with signal from outside cell

Figure 11.20
2 µm
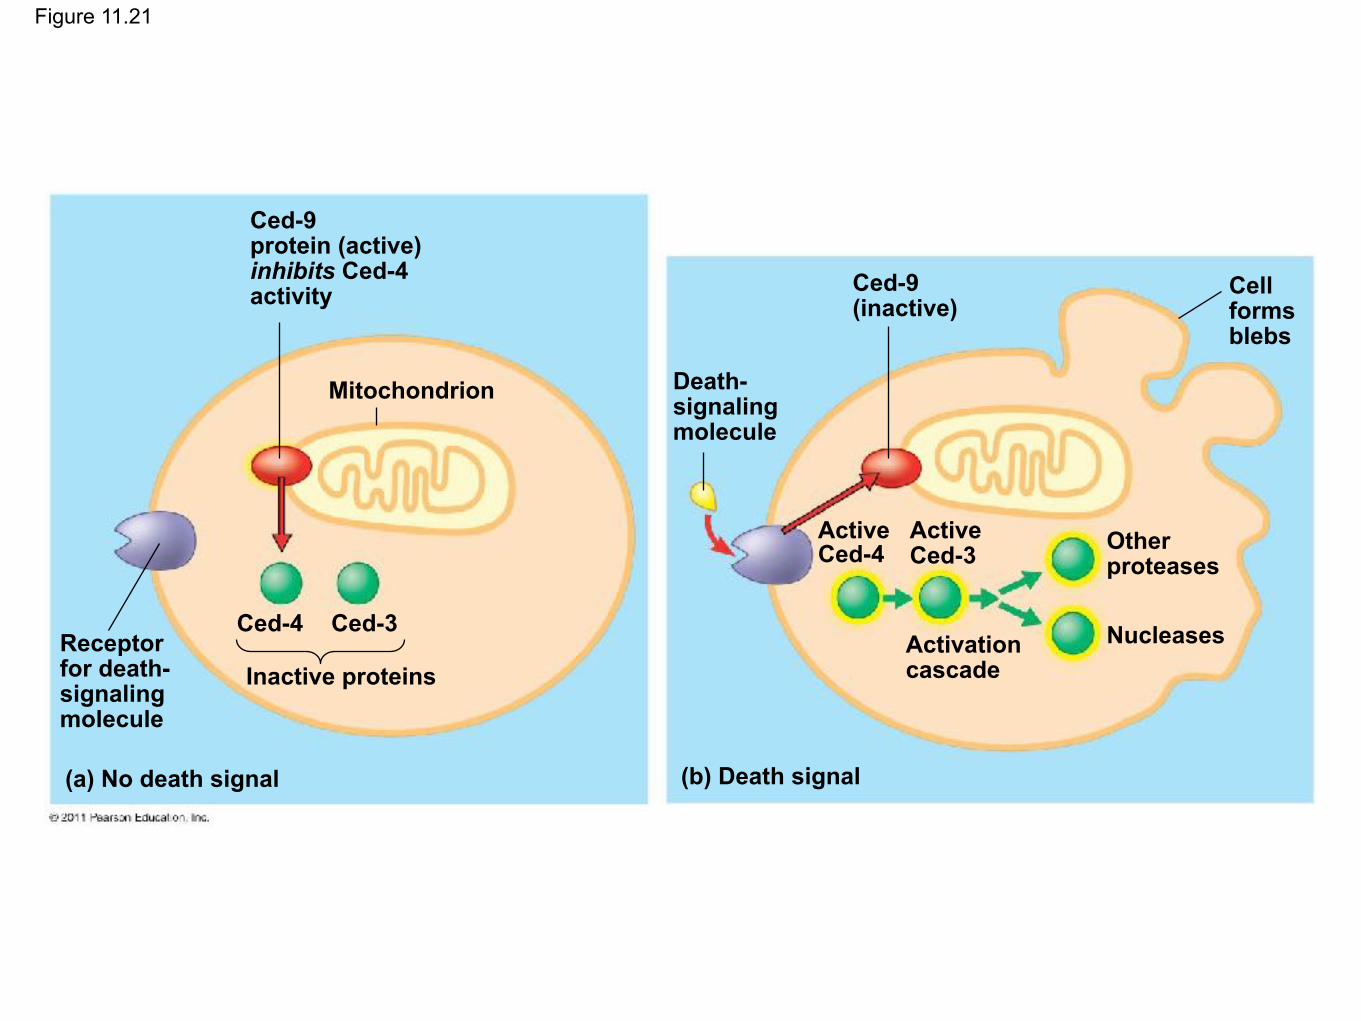
Figure 11.21
Mitochondrion
Ced-9 protein (active)inhibits Ced-4 activity
Receptor for death- signalingmolecule
Ced-4 Ced-3
Inactive proteins
(a) No death signal
Death-signalingmolecule
Ced-9 (inactive)
Cellforms blebs
Active Ced-4
Active Ced-3 Other
proteases
NucleasesActivationcascade
(b) Death signal
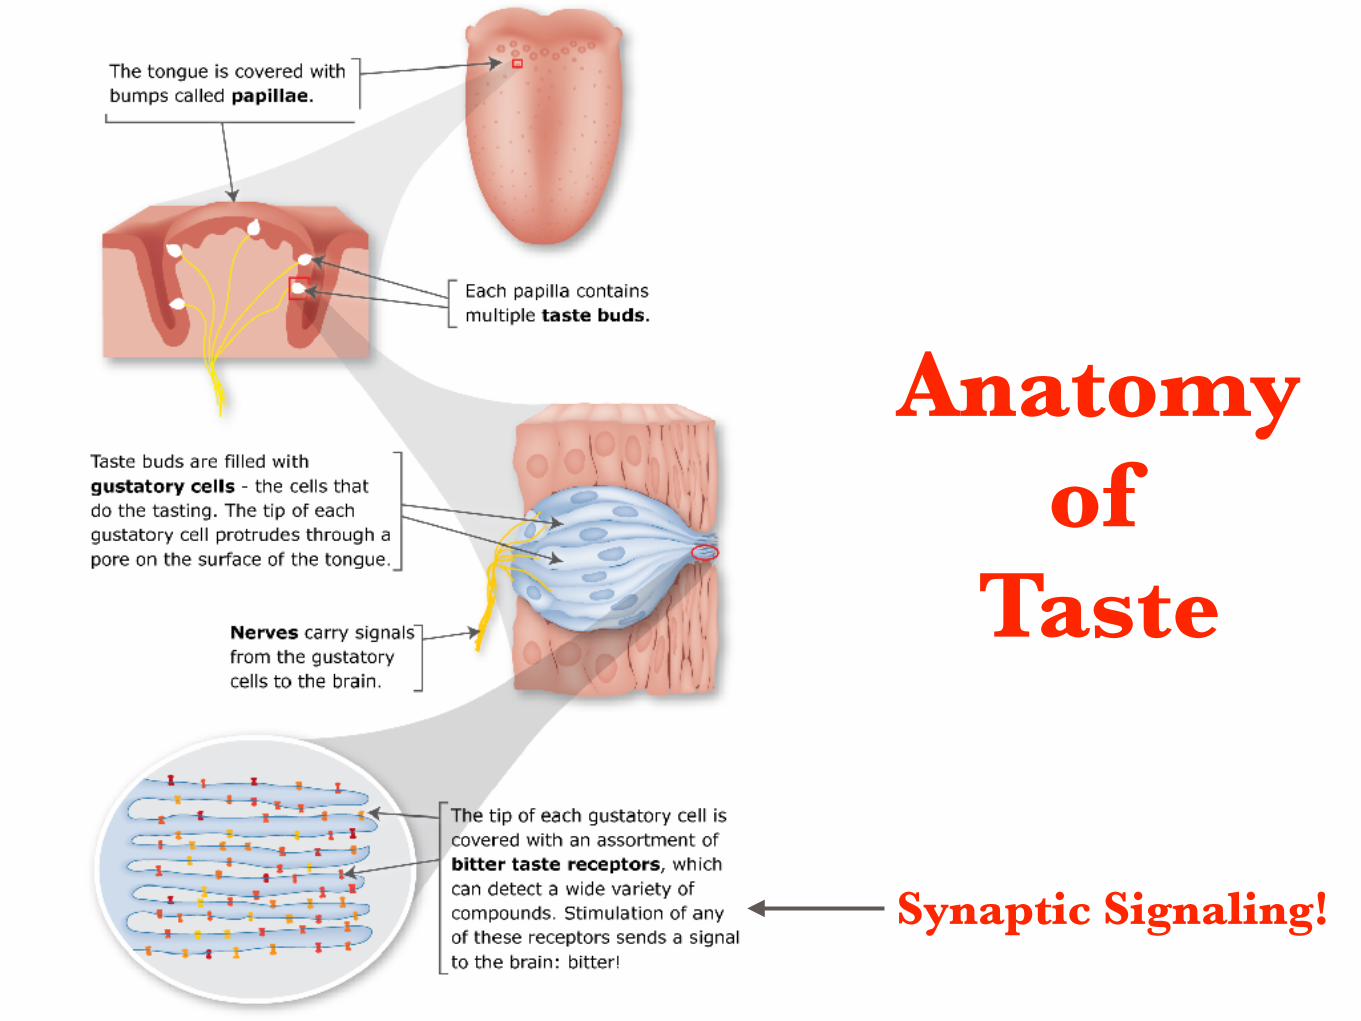
Anatomy of
Taste
Synaptic Signaling!

Taste Transduction

PTC Paper Taste Transduction


Tongue Anatomy
The pink bumps are fungiform papillae. - Each is made of dozens
of taste receptors - More papillae =
“Better” at tasting diff. flavors

Procedures
• Determine if you express the TAS2R38 gene • Determine if you are a super, normal, or non-
taster • Eat jolly rancher, focusing on dying the end
of the tongue. • Place a binder circle to create a counting
field • Count # of papillae
Suggestion: Photograph tongue

Super Taster= >30 fungiform papillae
Normal Tasters= 15-30 fungiform papillae
Non-Tasters= <15 fungiform papillae

Task: Does a certain level of “taster” relate to expressing the PTC tasting gene?
Collect data and decide!
Super Taster= >30 fungiform papillae
Normal Tasters= 15-30 fungiform papillae
Non-Tasters= <15 fungiform papillae


![Selective Targeting of Mobile mRNAs to Plasmodesmata for ... · Selective Targeting of Mobile mRNAs to Plasmodesmata for Cell-to-Cell Movement1[OPEN] Kai-Ren Luo, Nien-Chen Huang,](https://static.fdocuments.net/doc/165x107/5f13a2fca34f6100383e7928/selective-targeting-of-mobile-mrnas-to-plasmodesmata-for-selective-targeting.jpg)