CeLAND: search for a 4 a 3 PBq Ce- Pr e April 15, 2014 · CeLAND: search for a 4th light neutrino...
67
CeLAND: search for a 4 th light neutrino state with a 3 PBq 144 Ce- 144 Pr ¯ ν e -generator in KamLAND April 15, 2014 Abstract The reactor neutrino and gallium anomalies can be tested with a 3-4 PBq (75-100 kilocurie scale) 144 Ce - 144 Pr antineutrino beta-source deployed at the center or next to a large low- background liquid scintillator detector. The antineutrino generator will be produced by the Russian reprocessing plant PA Mayak as early as 2014, transported to Japan, and deployed in the Kamioka Liquid Scintillator Anti-Neutrino Detector (KamLAND) as early as 2015. KamLAND’s 13 m diameter target volume provides a suitable environment to measure the energy and position dependence of the detected neutrino flux. A characteristic oscillation pattern would be visible for a baseline of about 10 m or less, providing a very clean signal of neutrino disappearance into a yet-unknown, "sterile" state. This will provide a comprehensive test of the electron dissaperance neutrino anomalies and could lead to the discovery of a 4 th neutrino state for Δm 2 new & 0.1 eV 2 and sin 2 (2θ new ) & 0.05. 1 arXiv:1312.0896v2 [physics.ins-det] 13 Apr 2014
Transcript of CeLAND: search for a 4 a 3 PBq Ce- Pr e April 15, 2014 · CeLAND: search for a 4th light neutrino...

CeLAND: search for a 4th light neutrino state witha 3 PBq 144Ce-144Pr ν̄e-generator in KamLAND
April 15, 2014
Abstract
The reactor neutrino and gallium anomalies can be tested with a 3-4 PBq (75-100 kilocuriescale) 144Ce−144 Pr antineutrino beta-source deployed at the center or next to a large low-background liquid scintillator detector. The antineutrino generator will be produced by theRussian reprocessing plant PA Mayak as early as 2014, transported to Japan, and deployedin the Kamioka Liquid Scintillator Anti-Neutrino Detector (KamLAND) as early as 2015.KamLAND’s 13 m diameter target volume provides a suitable environment to measure theenergy and position dependence of the detected neutrino flux. A characteristic oscillationpattern would be visible for a baseline of about 10 m or less, providing a very clean signal ofneutrino disappearance into a yet-unknown, "sterile" state. This will provide a comprehensivetest of the electron dissaperance neutrino anomalies and could lead to the discovery of a 4th
neutrino state for ∆m2new & 0.1 eV 2 and sin2(2θnew) & 0.05.
1
arX
iv:1
312.
0896
v2 [
phys
ics.
ins-
det]
13
Apr
201
4

A. Gando, Y. Gando, S. Hayashida, H. Ikeda, K. Inoue, K. Ishidoshiro, H. Ishikawa, M. Koga, R.Matsuda, S. Matsuda, T. Mitsui,D. Motoki, K. Nakamura, Y. Oki, M. Otani, I. Shimizu, J.
Shirai, F. Suekane, A. Suzuki, Y. Takemoto, K. Tamae, K. Ueshima, H. Watanabe, B.D. Xu, S.Yamada,Y. Yamauchi, H. Yoshida
Research Center for Neutrino Science, Tohoku University, Sendai 980-8578, Japan
M. Cribier1,2, M. Durero2, V. Fischer2, J. Gaffiot1, N. Jonqueres3, A. Kouchner1, T.Lasserre1,2,4,5, D. Leterme3, A. Letourneau2, D. Lhuillier2, G. Mention2, G. Rampal3, L. Scola2,
Ch. Veyssière2, M. Vivier2, and P. Yala3
1Astroparticules et Cosmologie APC, 10 rue Alice Domon et Léonie Duquet, 75205 Paris cedex13, France
2Commissariat à l’énergie atomique et aux énergies alternatives, Centre de Saclay, IRFU, 91191Gif-sur-Yvette, France
2Commissariat à l’énergie atomique et aux énergies alternatives, Centre de Saclay, DEN/DANS& DEN/DM2S, 91191 Gif-sur-Yvette, France
4 European Research Council Starting Grant 4th-Nu-Avenue StG-3071845Corresponding author ([email protected])
B. E. BergerColorado State University, Fort Collins, CO 80523-1875, USA
A. KozlovKavli Institute for the Physics and Mathematics of the Universe (WPI), University of Tokyo,
Kashiwa 277-8583, Japan
T. Banks2, D. Dwyer1, B. K. Fujikawa1, K. Han2, Yu. G. Kolomensky1,2, Y. Mei2, T. O’Donnell2
1Lawrence Berkeley National Laboratory, Berkeley, CA 94720, USA2University of California, Berkeley, CA 94704, USA
Patrick DecowskiNikhef and the University of Amsterdam, Science Park 105 1098 XG, Amsterdam, the
Netherlands
D. M. MarkoffNorth Carolina Central University, Durham, NC 27707, USA
S. YoshidaGraduate School of Science, Osaka University, Toyonaka, Osaka 560-0043, Japan
V.N. Kornoukhov1, T. V.M. Gelis3, G.V. Tikhomirov2, I.S. Saldikov2
1 Russian Federation State Scientific Center of Theoretical and Experimental Physics Institute,117218 Moscow, Russia
2Scientific and Research Nuclear University, Moscow engineering and Physics Institute, Russia3 Russian Academy of Sciences A.N. Frumkin Institute of Physical chemistry and
Electrochemistry, Russia
J. G. Learned, J. Maricic, S. Matsuno, R. MilincicUniversity of Hawaii at Manoa, Honolulu, HI 96822, USA
H. J. KarwowskiUniversity of North Carolina, Chapel Hill, NC 27599, USA
2

Y. EfremenkoUniversity of Tennessee, Knoxville, TN 37996, USA
J. A. Detwiler, S. EnomotoUniversity of Washington, Seattle, WA 98195, USA
3

Contents1 Executive summary 6
2 Physics motivations 82.1 Oscillation overview . . . . . . . . . . . . . . . . . . . . . . . . . . . . . . . . . . . 82.2 The Gallium anomaly . . . . . . . . . . . . . . . . . . . . . . . . . . . . . . . . . . 82.3 The reactor antineutrino anomaly . . . . . . . . . . . . . . . . . . . . . . . . . . . . 82.4 Accelerator experiment anomalies . . . . . . . . . . . . . . . . . . . . . . . . . . . . 9
2.4.1 The LSND anomaly . . . . . . . . . . . . . . . . . . . . . . . . . . . . . . . 92.4.2 The MiniBooNE anomaly . . . . . . . . . . . . . . . . . . . . . . . . . . . . 9
2.5 Inputs from cosmology . . . . . . . . . . . . . . . . . . . . . . . . . . . . . . . . . . 102.6 Global picture of SBL oscillations . . . . . . . . . . . . . . . . . . . . . . . . . . . . 11
3 Concept of neutrino generator experiments 123.1 Oscillometry . . . . . . . . . . . . . . . . . . . . . . . . . . . . . . . . . . . . . . . 123.2 Neutrino Emitters . . . . . . . . . . . . . . . . . . . . . . . . . . . . . . . . . . . . 123.3 Antineutrino Emitters . . . . . . . . . . . . . . . . . . . . . . . . . . . . . . . . . . 13
4 144Ce−144 Pr antineutrino generator 144.1 144Ce−144 Pr source features . . . . . . . . . . . . . . . . . . . . . . . . . . . . . . 14
4.1.1 Nuclear data . . . . . . . . . . . . . . . . . . . . . . . . . . . . . . . . . . . 144.1.2 Decay heat . . . . . . . . . . . . . . . . . . . . . . . . . . . . . . . . . . . . 164.1.3 Electron and antineutrino spectra . . . . . . . . . . . . . . . . . . . . . . . 19
4.2 144Ce−144 Pr source production . . . . . . . . . . . . . . . . . . . . . . . . . . . . 224.2.1 Activity . . . . . . . . . . . . . . . . . . . . . . . . . . . . . . . . . . . . . . 224.2.2 Geometry . . . . . . . . . . . . . . . . . . . . . . . . . . . . . . . . . . . . . 224.2.3 Spent fuel seeds . . . . . . . . . . . . . . . . . . . . . . . . . . . . . . . . . . 234.2.4 Spent fuel cooling time and mass of CeO2 containing 75 kCi of 144Ce . . . . 244.2.5 Cerium production line . . . . . . . . . . . . . . . . . . . . . . . . . . . . . 254.2.6 144Ce source pressing and encapsulation . . . . . . . . . . . . . . . . . . . . 294.2.7 Target contamination . . . . . . . . . . . . . . . . . . . . . . . . . . . . . . 294.2.8 Source induced background . . . . . . . . . . . . . . . . . . . . . . . . . . . 31
4.2.8.1 Accidental backgrounds . . . . . . . . . . . . . . . . . . . . . . . . 314.2.8.2 Correlated backgrounds . . . . . . . . . . . . . . . . . . . . . . . . 31
4.2.9 Summary . . . . . . . . . . . . . . . . . . . . . . . . . . . . . . . . . . . . . 32
5 High-Z gamma ray shielding 325.1 Attenuation of γ rays in CeLAND . . . . . . . . . . . . . . . . . . . . . . . . . . . 335.2 Biological protection . . . . . . . . . . . . . . . . . . . . . . . . . . . . . . . . . . . 335.3 Equivalent dose . . . . . . . . . . . . . . . . . . . . . . . . . . . . . . . . . . . . . . 345.4 Insertion of the 144Ce source inside the biological shielding . . . . . . . . . . . . . . 375.5 High-Z shielding (for the deployment next to KamLAND) . . . . . . . . . . . . . . 37
5.5.1 γ-ray absorption specification . . . . . . . . . . . . . . . . . . . . . . . . . . 375.5.2 Radiopurity specification . . . . . . . . . . . . . . . . . . . . . . . . . . . . 375.5.3 Preliminary mechanical design . . . . . . . . . . . . . . . . . . . . . . . . . 38
6 Source and shielding logistics 396.1 High-Z shielding transportation . . . . . . . . . . . . . . . . . . . . . . . . . . . . 396.2 144Ce−144 Pr antineutrino generator transportation . . . . . . . . . . . . . . . . . 39
6.2.1 Transport of radioactive materials . . . . . . . . . . . . . . . . . . . . . . . 406.2.2 Transport with a B(U) type container . . . . . . . . . . . . . . . . . . . . . 406.2.3 Transport with a C type container . . . . . . . . . . . . . . . . . . . . . . . 43
4

7 Activity measurements 447.1 Requirements . . . . . . . . . . . . . . . . . . . . . . . . . . . . . . . . . . . . . . . 447.2 Calorimetry . . . . . . . . . . . . . . . . . . . . . . . . . . . . . . . . . . . . . . . . 44
7.2.1 Principle . . . . . . . . . . . . . . . . . . . . . . . . . . . . . . . . . . . . . 447.2.2 Data . . . . . . . . . . . . . . . . . . . . . . . . . . . . . . . . . . . . . . . . 447.2.3 Requirements . . . . . . . . . . . . . . . . . . . . . . . . . . . . . . . . . . . 457.2.4 Current Design . . . . . . . . . . . . . . . . . . . . . . . . . . . . . . . . . . 45
7.3 Spectroscopy of samples and weighing of the source . . . . . . . . . . . . . . . . . . 46
8 144Ce−144 Pr source deployment and data taking 468.1 The KamLAND detector . . . . . . . . . . . . . . . . . . . . . . . . . . . . . . . . . 46
8.1.1 Intrinsic detector backgrounds . . . . . . . . . . . . . . . . . . . . . . . . . 488.2 KamLAND infrastructure for CeLAND . . . . . . . . . . . . . . . . . . . . . . . . 49
8.2.1 Transportation of the antineutrino generator to the mine entrance . . . . . 498.2.2 Transportation of the anti neutrino generator to KamLAND entrance . . . 498.2.3 Transportation from the KamLAND entrance to the KamLAND dome area 50
8.3 Deployment into the outer detector (water veto) and data taking . . . . . . . . . . 518.3.1 Detector issues and source deployment . . . . . . . . . . . . . . . . . . . . . 518.3.2 Signal and backgrounds . . . . . . . . . . . . . . . . . . . . . . . . . . . . . 528.3.3 Expected sensitivity . . . . . . . . . . . . . . . . . . . . . . . . . . . . . . . 53
8.4 Alternative deployment into the Xenon Room and data taking . . . . . . . . . . . 538.4.1 Detector issues and source deployment . . . . . . . . . . . . . . . . . . . . . 548.4.2 Signal and backgrounds and sensitivity . . . . . . . . . . . . . . . . . . . . . 55
8.5 Running in parallel with KamLAND-Zen . . . . . . . . . . . . . . . . . . . . . . . 558.6 Additional systematic studies . . . . . . . . . . . . . . . . . . . . . . . . . . . . . . 57
8.6.1 Finite source size effect . . . . . . . . . . . . . . . . . . . . . . . . . . . . . 578.6.2 Energy resolution . . . . . . . . . . . . . . . . . . . . . . . . . . . . . . . . . 588.6.3 Vertex resolution . . . . . . . . . . . . . . . . . . . . . . . . . . . . . . . . . 598.6.4 Uncertainty on the source activity . . . . . . . . . . . . . . . . . . . . . . . 59
9 144Ce−144 Pr source disposal 60
10 Conclusion 61
A Interaction length in Tungsten alloy 62
5

1 Executive summaryOver the last 20 years a standard neutrino oscillation framework associated with small splittingsbetween the ν mass states has become well established. The three ν flavors (νe, νµ, ντ ) aremixtures of three massive neutrinos (ν1, ν2, ν3) separated by squared mass differences of ∆m2
21 =∆m2
sol = 7.50+0.19−0.20× 10⁻⁵ eV2 and | ∆m2
31 |≈| ∆m232 |= ∆m2
atm = 2.32+0.12−0.08× 10⁻³ eV2 [3]. This is
a minimal extension of the Standard Model that requires a lepton mixing matrix, similarly to thequark sector.Beyond this model, indications of oscillations between active and sterile νs have been observed inLSND [4], MiniBooNE [5, 6], Gallium [7, 8, 9] and more recently by reactor experiments [10]. Thissuggests the possible existence of a fourth massive ν with a mass of ∆m2 & 0.1 eV2 [11, 12, 13].Both the reactor and Gallium anomalies result from the observation of the disappearance of MeVenergy νe and ν̄e in counting experiments. Therefore, to definitivively test the anomalies one mustnot only test neutrino disappearance at short baselines, but also search for an oscillation patternas a function of L/Eν energy and baseline-dependent signatures. Probing ∆m2 values on the orderof 0.1 to a few eV2 implies that an oscillation search using neutrinos with energies of typical ofradioactive decays, i.e. in the few MeV range, requires a baseline of only several meters. AssumingCP invariance, both gallium and reactor anomalies can be unambiguously tested using a neutrinoemitter placed inside or next to a large 10-meter scale liquid scintillator detector, such as Borexino,KamLAND, SNO+, or Daya Bay. This constitutes an elegant method to probe the existence ofoscillations into a 4th neutrino by using a well-known neutrino detector.There are two options for deploying intense ν emitters in large liquid scintillator detectors: monochro-matic νe emitters, like 51Cr or 37Ar, or ν̄e emitters with continuous β-spectra, like 144Ce, 90Sr, 42Aror 106Ru. In the case of νe emitters the signature is provided by νe elastic scattering off electrons inthe liquid scintillator molecules. This signature can be mimicked by Compton scattering inducedby radioactivity or cosmogenic background, or by Solar-ν’s. The constraints of an experiment withνe impose the use of a very high activity source & 10 MCi outside of the detector target. In thecase of ν̄e, events are detected via the inverse beta decay reaction (IBD), which provides a e+-ndelayed coincidence that offers an efficient rejection of the mentioned background. For this reason,we focus our studies on ν̄e sources in the current proposal.Based on the concept presented in 2011 in [1], the CeLAND collaboration intends to use an intense144Ce source decaying into the unstable daughter 144Pr which, in turn, decays into stable 144Ndwith a Q-value of 2.996 MeV. The 144Pr decay produces antineutrinos above the 1.8 MeV thresholdfor the inverse beta decay reaction. The half-life of 144Ce is 285 days, and that of its daughter144Pr is only 17.3 minutes, so that the latter decay remains in equilibrium at all times. This thusleaves a significant amount of time for the source production, its transportation to the detector,and the data taking, without significant decrease in its initial activity.The intense 144Ce−144 Pr antineutrino generator (ANG hereafter) can be produced at the FederalState Unitary Enterprise Mayak Production Association (FSUE -Mayak- PA or simply Mayak)reprocessing plant in Russia as early as 2014. The source will then be transported within onemonth to the Kamioka mine, Japan, where the KamLAND detector is located. The CeLANDcollaboration intends to deploy a 75-100 kCi (2.78-3.73 PBq) antineutrino generator within 13m ofthe KamLAND detector center, as early as 2015. The plan is to take data for at least 18 months andto search for a fourth neutrino. If a hint of oscillation is observed, the collaboration would considerdeploying the source at the center of the detector, or procuring a second antineutrino generator toincrease the statistical power of the experiment. Such deployment strategy allows a comprehensivetest of the electron disappearance neutrino anomalies and could lead to the discovery of a 4thneutrino state for ∆m2
new & 0.1 eV 2 and sin2(2θnew) & 0.05.
6

Figure 1: Schematic view of the CeLAND experiment. In the first phase of the experiment thecollaboration intends to deploy a 75-100 kCi source in the water Cherenkov outer detector ofKamLAND. This run could be followed by the deployment of the same source (approx. 50 kCiafter 6 months) at the center of the KamLAND detector for 1 year (in liquid scintillator target) incase of detection hint of a fourth neutrino state.
7

2 Physics motivations
2.1 Oscillation overviewNeutrino oscillations have been observed in solar, atmospheric, and long-baseline reactor and ac-celerator experiments. For a detailed review, see for example [2]. The data collected so far bythese experiments are well fitted in the framework of a three-neutrino mixing approach, in whichthe three known flavor neutrinos νe, νµ and ντ are unitary linear combinations of three massiveneutrinos ν1, ν2 and ν3 with squared-mass differences and mixing angles [3]:
∆m221 = ∆m2
sol = 7.50+0.19−0.20 × 10⁻⁵eV 2, (1)
sin2(2θ12) = 0.857+0.023−0.025 (2)
| ∆m231 |≈| ∆m2
32 |= ∆m2atm = 2.32+0.12
−0.08 × 10⁻³eV 2, (3)sin2(2θ23) > 0.95 (90%C.L.), sin2(2θ13) = 0.098± 0.013 (4)
where ∆m2jk = m2
j −m2k and mj is the mass of the neutrino νj .
Besides this well-established picture, there are a few anomalies which could point toward short-baseline (SBL) neutrino oscillations generated by a larger squared-mass difference: the gallium ra-dioactive source experiment anomalies [7, 8, 9], the recently observed reactor antineutrino anomaly[10], and the MiniBooNE [5, 6] and LSND [4] accelerator neutrino anomalies. Existence of a fourthyet unobserved neutrino species is not ruled out by cosmological data obtained by PLANCK [14]and WMAP [15]. In this section, we successively review these anomalies and give an up-to-dateinterpretation in terms of light sterile neutrinos.
2.2 The Gallium anomalyMan-made neutrino sources were originally proposed and designed to test solar-ν detection in theGALLEX [16, 17, 18] and SAGE [19, 20, 21] experiments. Intense Mega Curie (MCi) 51Cr and37Ar νe sources with precisely measured activities were placed at the center of the detectors tocount for the number of νe events, as a tool to understand the detector responses. Taking intoaccount the uncertainty of the cross-section of the detection process νe +71 Ga→71 Ge + e−, theratios R of measured to predicted 71Ge event rates reported by the experiments
RGALLEXCr1 = 0.95+0.11
−0.12, RGALLEXCr2 = 0.81+0.10
−0.11, (5)
RSAGECr = 0.95+0.12
−0.12, RSAGEAr = 0.79+0.09
−0.10 (6)
with an averaged ratio ofRGa = 0.86+0.05
−0.05. (7)
The number of measured events is smaller than the prediction at the 2.7σ level, leading to theso-called Gallium anomaly. Although the cross-section of the νe +71 Ga→71 Ge + e− detectionprocess might have been overestimated by adding the uncertain transitions from the ground stateof 71Ga to two excited states of 71Ge, the anomaly still remains at the 1.8σ level in the absence ofsuch transitions, with a ratio RGa = 0.90+0.05
−0.05. Recently, a re-interpretation of the Gallium datawith new measurements of the Gamow-Teller strengths of the transitions from the ground state of71Ga to the two excited states of 71Ge confirmed the anomaly at the 3σ level [9].
2.3 The reactor antineutrino anomalyNuclear reactors emit ν̄e through β− decay of fission products. Any reactor antineutrino spectrumis mostly the sum of the neutrino spectra of the four fissioning nuclei (235U, 238U, 239Pu and241Pu) weighted by their relative fission rate. Since thousands of different β branches are availableto the unstable fission products, and many of them are still unknown, neutrino spectra predictionscannot fully rely on simulations. Neutrino spectra are then estimated by converting the precisemeasurement of the total electron spectrum emitted by nuclear fuel under neutron irradiation,using energy conservation law. However, some modeling, such as of the end point distribution ofthe beta branches, still remain necessary.In 2011, a revised calculation of the rate of ν̄e production by nuclear reactors yielded yet anotherindication of the hypothetical existence of a fourth neutrino species. The new calculation relies on
8

detailed knowledge of the decays of thousands of fission products listed by nuclear databases [22],while the previous calculation used a phenomenological model based on 30 effective β-branches.The revised rate of ν̄e production by nuclear reactors is 3.5% higher than previously thoughtand was confirmed independently by another calculation [23]. This new calculation motivateda re-analysis of 19 past reactor experiments at reactor distances < 100 m. Figure 2 shows theratio of measured-to-expected ν̄e count rates in each of these experiments, following the revisedcalculation of the rate of ν̄e production by nuclear reactors combined with a new estimation of theinverse β decay cross-section (driven by the neutron life-time measurement) and off-equilibriumcorrections to the reactor fuel composition. Along with these new ratios are also displayed theresults of middle-baseline experiments (L > 100 m) such as Chooz [24] or Palo Verde [25]. Thedotted line represents a “classic” three active neutrinos mixing scheme. The solid line shows a(3+1) sterile neutrino model. A constant fit to the 19 SBL experiments’ measured-over-expectedν̄e count rates gives a mean ratio of RR = 0.927± 0.023, corresponding to a 3σ discrepancy calledthe reactor antineutrino anomaly (RAA)[10]. The SBL reactor data suggests a new ∆m2
new ∼ 1 eV2
if interpreted in terms of a new SBL oscillation driven by a 4th neutrino state.
NO
BS/(
NE
XP) p
red
,ne
w
Reactor To Detector Distance (m)10
−110
010
110
210
310
410
510
60.4
0.5
0.6
0.7
0.8
0.9
1
1.1
Figure 2: Re-analysis of the past reactor antineutrino experiments, which indicates an anomaly inthe expected measured-to-predicted count rates of ν̄e at short distances. The dashed line corre-sponds to the classic three-neutrino picture with the squared mass differences quoted above. Thesolid line corresponds to a 3 active neutrinos plus one sterile neutrino (3+1) model.
2.4 Accelerator experiment anomalies2.4.1 The LSND anomaly
The LSND experiment was designed to search for ν̄µ → ν̄e oscillations at short distances and ranat the Los Alamos 800 MeV proton accelerator, producing ν̄µ up to 300 MeV by µ+ decay at rest[26]. The LSND detector was placed 30 m away from the ν̄µ source and the detection processof ν̄e relied on the inverse β decay reaction ν̄e + p+ → e+ + n. Using the data collected between1993 and 1998, the collaboration reported evidence for ν̄µ oscillations at the 3.8σ level, with atotal excess of 87.9 ± 22.4 ± 6.0 events consistent with the ν̄e + p+ → e+ + n reaction above theexpected background [4]. In conjunction with other known neutrino limits, the LSND data suggestthat the observed neutrino oscillations occur in the 0.2-10 eV2 ∆m2 range, leading to the LSNDanomaly.
2.4.2 The MiniBooNE anomaly
MiniBooNE is an appearance experiment which ran at Fermilab between 2002 and 2012. It hasbeen searching for a νµ → νe and ν̄µ → ν̄e oscillation signal in the LSND L/Eν range [27]. Theexperiment uses the Fermilab Booster neutrino beam, which produces νµ (ν̄µ) with energies up to 3GeV with a 8 GeV proton beam hitting a Beryllium target. The center of the detector is 541 m away
9

from the neutrino source, and the νe (ν̄e ) detection process relies on quasi-elastic charged-currentscattering on nucleons νe + C→ e− + X and ν̄e + C→ e+ + X (CCQE). In 2007, the MiniBooNEcollaboration released its first results and showed no evidence of νµ → νe oscillations for neutrinoenergies above 475 MeV [28].However in their second publication [5], the collaboration reported a sizable excess of 83.7 ± 15.1± 19.3 electron-like events for neutrino energies between 300 MeV and 475 MeV, correspondingto a significance of 3.4σ. In the antineutrino mode, MiniBooNE observes an excess of 24.7 ±18.0 events in the 475 < Eν < 3000 MeV energy range, which is consistent with the antineutrinooscillations suggested by the LSND data [6]. Finally, a combined analysis of the data collectedin the neutrino and antineutrino mode recently showed an excess of 240.3 ± 34.5 ± 52.6 events,updating the significance to 3.8σ [29]. The combined dataset favors ∆m2 in the 0.01-1 eV2 range.
2.5 Inputs from cosmologyCosmological data can also be used to test the sterile neutrino hypothesis because the Universeexpansion rate is sensitive to the energy density in relativistic particles during the radiation dom-ination era [15]:
H2(t) ≈ 8πG
3(ργ + ρν), (8)
where ργ and ρν are the photon and neutrino energy density, respectively and
ρν = Neff7π2
120T4ν . (9)
Neff could be interpreted as the effective number of neutrino species. It is equal to 3.046 inthe standard model of cosmology with three generations of fermions. The extra energy density ofneutrinos with respect to Neff = 3 comes from QED and non-instantaneous decoupling effects in thecalculation of the neutrino temperature Tν . From a particle physics perspective, a sterile neutrinothat mixes with active neutrinos can increase the relativistic energy density in the early Universethrough oscillation-based thermal production, leading to a Neff > 3.046. With ργ being extremelywell determined from measurements of the cosmic microwave background (CMB) temperature,constraints on H(t) in the early Universe can be then interpreted as bounds on ρν and hence onNeff .Various cosmological observables can be used to search for signatures of sterile neutrinos. Thoseinclude the light elemental abundances from big bang nucleosynthesis (BBN), the CMB anisotropiesand the large-scale structure distribution. figure 3 summarizes the best constraints on Neff obtainedwith the combination of these different cosmological observables. The recent Planck result leads toNeff = 3.36±0.66 at 95% C.L. if no additional constraint are being used[14]. However including theastrophysical constraints on the Hubble constant measurement this results shifts to Neff = 3.52±0.46 at 95% C.L. Therefore Neff > 3.046 is mildly disfavored but this cosmological bound is stillmodel dependent. Further laboratory experiments are thus mandatory to test the hypotheticalexistence of a fourth neutrino state.
4 2 0 2 4 6 8 10 12
Number of Neutrino Types
4 2 0 2 4 6 8 10 124 2 0 2 4 6 8 10 12
W9+eCMB+BAO+H0; YHe fixedNeff
0.400± X3.840
SPT2013Neff
0.480± X3.620
SPT2013+H0+BAONeff
0.350± X3.710
Planck+OthersNeff
0.300± X3.300
Planck+Others+H0Neff
0.250± X3.600
Figure 3: Constraints obtained on the number of effective neutrino species Neff from different cos-mological observables, based on WMAP 9-year data, PLANCK, SPT, BAO, and Hubble constantastrophysical inputs. BAO corresponds to the baryon acoustic oscillations data. ACT and SPTare the Atacama Cosmology Telescope and South Pole Telescope, respectively, which measure theCMB damping tail. Reference [15] gives further details about these experiments.
10

2.6 Global picture of SBL oscillationsTable1 summarizes the different anomalies observed so far in past neutrino oscillation experiments.Many studies have been performed to interpret the results of the different dataset in terms of oscil-lations into a fourth neutrino state. Figure 4 shows a comparison of the allowed 95% C.L. regions inthe sin2(2θnew)−∆m2
new parameter space obtained from the separate fits of the different anomaliespresented previously in the framework of a (3+1) neutrino mixing model. A global fit to the Gal-lium, reactor, solar, and νeC scattering data shows that two regions are preferred (in red contours),centered around ∆m2
new = 7.6 eV2, sin2(2θnew) = 0.12 and ∆m2new ' 2 eV2, sin2(2θnew) ' 0.1 [9].
The second region is preferred by Gallium and reactor data.
sin22ϑee
∆m
412 [e
V2]
+
10−2
10−1
1
10−2
10−1
1
10
102
++
+
95% CL
GalliumReactorsνeC
SunCombined
95% CL
GalliumReactorsνeC
SunCombined
Figure 4: Allowed 95% C.L. regions in the sin2(2θnew)−∆m2new plane obtained from separate fits
of Gallium, reactor, solar and νeC scattering data and from the combined fits of all data. Crossesindicate the best-fit points. Figure taken from [9].
Experiment ν source Channel Detection Oscillation signature Significance
LSND µ decay at rest ν̄µ → ν̄e IBD Rate, energy spectrum 3.8σMiniBooNE π decay in flight νµ → νe, ν̄µ → ν̄e CCQE Rate, energy spectrum 3.8σGallium 51Cr,37Ar νe disappearance CCQE Rate ≈ 3.0σReactor 235,238U , 239,241Pu νe disappearance IBD Rate, energy spectrum 3.0σ
Cosmology CMB, BBN, LSS, ... All - Neff ≈ 2.0σ
Table 1: Summary of the different anomalies that possibly indicate the existence of a fourthneutrino state, along with their corresponding significances.
The results of the global fits, as well as the results of Gallium and reactor data give lower limits on∆m2
new but do not give any upper limits. Upper limits on ∆m2new, and even upper limits on the
absolute mass scale of a new sterile neutrino ms can be derived from the effects of heavy neutrinomasses on electron spectrum measured in tritium β-decay experiments such as Mainz [30, 31, 32]orKATRIN [33], the results of neutrinoless double-β decay experiments such as KamLAND-Zen[34, 36] or EXO [37]and cosmology. The current upper limits at the 95% C.L. on ∆m2
new lie atO(104 eV 2) assuming a normal hierarchy and come from the Mainz experiment[32]. For Majorananeutrinos, the recent combined results of EXO and KamLAND-Zen on the effective Majoranamass in neutrinoless double-β decay gives a more stringent constraint between 102 and 103 eV2
11

[9]. Finally, cosmological data have also been used to set a 95% C.L. upper limit on the mass ofa new sterile neutrino [38], which exhibits some tension with the mixing parameters preferred bythe terrestrial experiment data:
ms < 0.45 eV. (10)
Nevertheless, the reported anomalies from the various terrestrial experiments still make a com-pelling case for a decisive search for a fourth neutrino state in the larger mass difference region.
3 Concept of neutrino generator experimentsThere are two types of ν-source suitable to search for light sterile neutrinos: monochromatic νeemitters, such as 51Cr or 37Ar and ν̄e emitters with a continuous β-spectrum such as 144Ce, 90Sr,42Ar or 106Ru. Both types provide pure neutrino flux with well-defined energy spectrum andabsolute rate that can be precisely measured, creating an excellent opportunity to test the fourthneutrino hypothesis using oscillometry.
3.1 OscillometryThe unambiguous way to address the existence of a fourth neutrino state is the determinationof the oscillation pattern in the distance-dependent flux of a pure neutrino flavor source over theentire oscillation length. A detector-source distance similar to the expected oscillation length isthus necessary:
L ∼ Losc[m]
2= 1.24
Eν̄e [MeV ]
∆m2new[eV 2]
. (11)
Electron antineutrinos produced in radioactive decays have energies up to a few MeV. Assuming a∆m2
new∼1 eV2, which is preferred by the different anomalies seen in the past terrestrial neutrinodata, the optimum source-detector distance is O(1m). Therefore, large liquid-scintillator (LS)detectors such as Borexino [39], KamLAND [40], or SNO+ [41] are able to perform precise neutrinooscillometry since they are big enough to fully cover the spatial pattern of ν̄e oscillations into afourth neutrino state.
3.2 Neutrino EmittersIn the nineties, intense 51Cr (∼ 750 keV, A0 ∼ MCi) and 37Ar (814 keV, A0 ∼ 0.4 MCi) sourceswere used to test the radiochemical experiments Gallex and Sage. Such radioactive neutrinosources involve either β+-decay or electron capture. Electron captures produce mono-energetic νe’sallowing for a determination of L/Eν by only measuring the interaction vertex position. Productionof an 37Ar source requires a large fast neutron reactor (which is not easily available), leaving 51Cras the best current candidate for sterile neutrino searches with νe sources. 51Cr has a half-lifeof 27.7 days. It decays 90.1% of the time to the 51V ground state and emits a 751 keV νe while9.9% of the time it decays to the first excited state of 51V and emits a 413 keV νe followed by a320 keV γ. The large scale production of 51Cr has been possible thanks to the relatively high 50Crneutron capture cross-section (∼ 17.9 barns). Natural chromium is primarily composed of 53Cr(9.5%), 52Cr (83.8%) and 50Cr (4.35%). The 53Cr and 50Cr isotopes have similar neutron capturecross-section. Under the irradiation of natural chromium, 53Cr absorbs 2.5 neutrons every time aneutron is captured on 50Cr, thus reducing the 51Cr yield. Enrichment of natural chromium with50Cr is therefore necessary in order to produce a 51Cr source with an activity of several MCi. Suchenrichment is favorable for manufacturing a compact target, which is necessary for sterile neutrinosearches. The material used by the Gallex experiment was enriched to 38.6% in 50Cr while theSage target was enriched to 92%. Because many isotopes have high neutron capture cross-sections,great care must be taken during the production and handling of the chromium rods in order toavoid high-energy gamma ray contamination from chemical impurities.In a radiochemical experiment, the interactions of 51Cr and 37Ar neutrinos produce 71Ge atomsvia the 71Ga(νe,e−)71Ge reaction. The 71Ge atoms are chemically extracted from the detectorand converted to GeH4. Ge atoms are then placed in proportional counters and their number isdetermined by counting the Auger electrons released in the transition back to 71Ga, which occurswith a half-life of 11.4 days.In liquid scintillator experiments, the νe signature is provided by νe elastic scattering off electrons
12

(ES) of the molecules. The cross section is σ(Eν) ∼ 0.96×10−44×Eν cm2, where Eν is the neutrinoenergy in MeV. This signature can be mimicked by Compton scatterings induced by radioactiveand cosmogenic backgrounds, or by solar-ν interactions. An experiment running with a νe sourcethen imposes the use of a very high activity source (5-10 MCi) to provide an interaction rate withinthe detector that will exceed the rate from solar ν, and to compensate the lack of solid angle dueto the positioning of a source outside the detector (since the ES does not provide any specificsignature of νe interaction).
3.3 Antineutrino EmittersAntineutrino sources are non-monochromatic ν̄e emitters decaying through β−-decay. ν̄e are de-tected through the inverse beta decay (IBD) reaction ν̄e + p → e+ + n. The IBD cross-sectionis σ(Ee) ∼ 0.96 10−43 × peEe cm2, where pe and Ee are the momentum and energy (in MeV) ofthe detected e+, neglecting neutron recoil, weak magnetism effects, and radiative second ordercorrections. The IBD cross-section is an order of magnitude higher than the neutrino scatteringoff electron cross-section at 1 MeV.The ν̄e interaction signature is the time and space coincidence of two energy depositions in the liquidscintillator. The first energy deposition consists of e+ kinetic energy deposition closely followed bythe energy deposition of two 511 keV γ-rays from e+ annihilation with an electron of the medium.It is called the prompt event, releasing a total visible energy of Ee= Eν-(mn-mp) MeV. The secondenergy deposition originates from the neutron capture on a free proton, with an averaged capturetime of the order of a few hundreds µs, which releases a 2.2 MeV deexcitation γ-ray. This is calledthe delayed event. The time coincidence between these two energy depositions suppresses anynon-source backgrounds to a negligible level.The background free IBD signature plus the relatively high IBD cross-section allow the sourceactivity to be at the (tens of) kCi scale for sterile neutrino searches. A suitable ν̄e source musthave a Qβ greater than 1.8 MeV to exceed the IBD energy threshold and a long enough lifetime(&1 month) not to be limited by production and transportation time to the detector. Fulfillmentof these two requirements is impossible for a single nuclei, since Qβ is anti-correlated with lifetime.We then looked for pairs of nuclei involving a long-lived low-Q nucleus decaying to a short-livedhigh-Q nucleus. Since the first isotope, the parent, has a much longer lifetime than its daughter,both nuclei are in equilibrium and the activity is driven by the parent. ν̄e emitted by the fatherhas not enough energy to undergo an IBD, while ν̄e in the tail of the daughter spectrum can:
AZX1
τ1/2∼year−−−−−−−−→Qβ∼100 keV
AZ+1X2
τ1/2∼hour−−−−−−−−→Qβ>1.8 MeV
AZ+2X3 (12)
Four pairs fulfilling the above mentioned requirements have been identified in the nuclear databasesand are presented in table 2, some of them also being reported in [64].
144Ce-144Pr 106Ru-106Rh 90Sr-90Y 42Ar-42Kτ1/2 285 d 7.2 min 372 d 30 s 28.9 y 64 h 32.9 y 12 h
Qβ (MeV) 0.319 2.996 0.039 3.54 0.546 2.28 0.599 3.52
Table 2: Possible nuclei pairs for a ν̄e source.
144Ce, 106Ru and 90Sr are fission products found within nuclear reactor spent fuels, whereas 42Aris too light to be produced by fission processes. Furthermore, the production of 42Ar needs twoneutron captures, starting from stable 40Ar. Because 41Ar has a short lifetime of only 110 minand 40Ar (n,γ)41Ar reaction has a cross-section of only ∼0.4 barn, massive 42Ar production is verydifficult. Therefore, a solution consisting in the reprocessing and treatment of nuclear spent fuelrods is more convenient.The probability of a nuclei to be created during fission processes in nuclear reactor fuel is calledthe fission yield and is given in percent 1. However, the fission yield of a given nucleus does nottake into account its possible decay to another nucleus, and is therefore not representative of theabundance of a given nuclei within spent nuclear fuel. The cumulative fission yield of an isotope is
1The sum of the isotopic fission yield gives 200 % because of the normalization with the number of fissions, notwith the number of fissions products.
13

the number of nuclei of the considered isotope per fission when the reactor is at equilibrium. Thisquantity is then more interesting for our purpose of finding the best pair candidate because with areasonable approximation (very long-lived isotopes never reach equilibrium), it represents a fissionproduct abundance at reactor shutdown. Table 3 shows the 144Ce, 106Ru and 90Sr cumulativefission yields for thermal fission of 235U and 239Pu, these two isotopes being the most fissionedisotopes in nuclear reactors. 144Ce, 106Ru and 90Sr are clearly abundant fission products, but106Ru suffers from its rather low 235U cumulative yield compared to 144Ce and 90Sr. Since 90Sr-90Y suffers from a relatively low Qβ leading to a small IBD reaction rate for a given activity, the144Ce−144 Pr pair is therefore the best candidate for a ν̄e source.
Cumulative fission yield (%)14458 Ce 106
44 Ru 9038Sr
235U 5.50 (4) 0.401 (6) 5.78 (6)239Pu 3.74 (3) 4.35 (9) 2.10 (4)
Table 3: Cumulative fission yield for thermal fission of 235U / 239Pu for 144Ce, 106Ru and 90Sr [73].
4 144Ce−144 Pr antineutrino generatorThe CeLAND experiment will use a 144Ce−144 Pr source, which is the best compromise betweenproduction feasibility, intrinsic backgrounds and ν̄e interaction rate through the inverse beta decayreaction.
4.1 144Ce−144 Pr source featuresWith an atomic number Z=58, cerium belongs to the lanthanide elements. Natural cerium has anatomic mass of 140.116 g and is a soft, silvery, ductile metal which easily oxidizes in air. Ceriumhas two oxidation states (III and IV) and easily converts to CeO2 in contact with oxygen.. Naturalcerium contains four stable isotopes of mass 136 (0.195%), 138 (0.265%) and 140 (88.45%) and 142(11.1%), respectively. Cerium is the most abundant rare earth element, making up about 0.0046%of the Earth’s crust by weight.
4.1.1 Nuclear data
There is a considerable interest in the decay of 144Ce since it is a prominent fission product. Nucleardata reported below are taken from the ENSDF database referring to [59, 60] for 144Ce and [60]for 144Pr.
F. Y. t1/2 1st β− (keV) 2nd β− (keV) Iγ>1 MeV Iγ>2 MeV W/kCi235U: 5.2% 284.91d 318 (76%)
184 (20%) 2996 (99%) 1380 (0.007%) 2185 7.99239Pu: 3.7% 238 (4%) 810 (1%) 1489 (0.28 %) (0.7%)
Table 4: Summary of the features of 144Ce−144 Pr pair. F.Y. are the fission yields of 144Ce, t1/2
the half-lives. β end-points are given for 1st and 2nd nucleus in the pair. The Iγ ’s are the intensitiesof the main γ-rays per β-decay above 1 and 2 MeV. The last column is the heat production inunits of W/kCi.
The different cerium isotopes are listed in table 5. Up to now, 35 radioisotopes have been charac-terized, the most stable ones being 144Ce with a half-life of 284.91 days, 139Ce with a half-life of137.640 days, and 141Ce with a half-life of 32.501 days. The remaining radioactive isotopes havehalf-lives shorter than 4 days, most of them having half-lives shorter than 10 minutes. Note thatthe 136,138,142Ce isotopes are predicted to undergo double beta decay but this process has neverbeen observed.
14

Parent Z A isotopic mass (u) half-life decay daughter spin/parity119Ce 58 61 118.95276(64) 200 ms β+ 119La 5/2+120Ce 58 62 119.94664(75) 250 ms β+ 120La 0+121Ce 58 63 120.94342(54) 1.1(1) s β+ 121La (5/2)(+)122Ce 58 64 121.93791(43) 2 s β+ 121,122La 0+123Ce 58 65 122.93540(32) 3.8(2) s β+,p 123La, 122Ba (5/2)(+)124Ce 58 66 123.93041(32) 9.1(12) s β+ 124La 0+125Ce 58 67 124.92844(21) 9.3(3) s β+,p 125La,124Ba (7/2-)126Ce 58 68 125.92397(3) 51.0(3) s β+ 126La 0+127Ce 58 69 126.92273(6) 29(2) s β+ 127La 5/2+128Ce 58 70 127.91891(3) 3.93(2) min β+ 128La 0+129Ce 58 71 128.91810(3) 3.5(3) min β+ 129La (5/2+)130Ce 58 72 129.91474(3) 22.9(5) min β+ 130La 0+
130mCe 2453.6(3) keV 100(8) ns (7-)131Ce 58 73 130.91442(4) 10.2(3) min β+ 131La (7/2+)
131mCe 61.8(1) keV 5.0(10) min β+ 131La (1/2+)132Ce 58 74 131.911460(22) 3.51(11) h β+ 132La 0+
132mCe 2340.8(5) keV 9.4(3) ms IT 132Ce (8-)133Ce 58 75 132.911515(18) 97(4) min β+ 133La 1/2+
133mCe 37.1(8) keV 4.9(4) h β+ 133La 9/2-134Ce 58 76 133.908925(22) 3.16(4) d EC 134La 0+135Ce 58 77 134.909151(12) 17.7(3) h β+ 135La 1/2(+)
135mCe 445.8(2) keV 20(1) s IT 135Ce (11/2-)136Ce 58 78 135.907172(14) Observationally Stable 0+
136mCe 3095.5(4) keV 2.2(2) µs 10+137Ce 58 79 136.907806(14) 9.0(3) h β+ 137La 3/2+
137mCe 254.29(5) keV 34.4(3) h IT(99.22%)/β+(.779%) 137Ce/137La 11/2-138Ce 58 80 137.905991(11) Observationally Stable 0+
138mCe 2129.17(12) keV 8.65(20) ms IT 138Ce 7-139Ce 58 81 138.906653(8) 137.641(20) d EC 1399a 3/2+
139mCe 754.24(8) keV 56.54(13) s IT 139Ce 11/2-140Ce 58 82 139.9054387(26) Stable 0+
140mCe 2107.85(3) keV 7.3(15) µs 6+141Ce 58 83 140.9082763(26) 32.508(13) d β− 141Pr 7/2-142Ce 58 84 141.909244(3) Observationally Stable 0+143Ce 58 85 142.912386(3) 33.039(6) h β− 143Pr 3/2-144Ce 58 86 143.913647(4) 284.91(5) d β− 144mPr 0+145Ce 58 87 144.91723(4) 3.01(6) min β− 145Pr (3/2-)146Ce 58 88 145.91876(7) 13.52(13) min β− 146Pr 0+147Ce 58 89 146.92267(3) 56.4(10) β− 147Pr (5/2-)148Ce 58 90 147.92443(3) 56(1) s β− 148Pr 0+149Ce 58 91 148.9284(1) 5.3(2) s β− 149Pr (3/2-)150Ce 58 92 149.93041(5) 4.0(6) s β− 150Pr 0+151Ce 58 93 150.93398(11) 1.02(6) s β− 151Pr 3/2-152Ce 58 94 151.93654(21) 1.4(2) s β− 152Pr 0+153Ce 58 95 152.94058(43) 500 ms β− 153Pr 3/2-154Ce 58 96 153.94342(54) 300 ms β− 154Pr 0+155Ce 58 97 154.94804(64) 200 ms β− 155Pr 5/2-156Ce 58 98 155.95126(64) 150 ms β− 156Pr 0+157Ce 58 99 156.95634(75) 50 ms β− 157Pr 7/2+
Table 5: Cerium isotopes. EC refers to Electron capture and IT to Isomeric transition. There are10 meta states.
The half-life of the 144Ce, 284.91 days (τ = 411.04 days), is long enough for uploading of irradi-ated fuel from the nuclear reactor, transportation to the reprocessing facility, extraction of cerium,cerium source packaging and transportation to the detector site. It is however not too long, mini-
15

mizing the mass of reprocessed fuel and source material within the detector. The 144Ce is thereforea very good compromise, suitable for a year time scale experiment. The source compactness re-quirement imposes the time elapsed prior to the source manufacturing time. The time period mustbe shorter than a few years (typically three) starting from the end of the nuclear fuel irradiationwithin the reactor core.
Figure 5: (left) Decay scheme of 144Ce. The two intensities sum to give total transition intensityfrom each energy level in percent. Energies of γ rays and levels are given in keV. (right) Decayschemes of the 17.3-min 144Pr. Energies of γ rays and levels are given in keV.
A major concern regarding an ν̄e source is the rate and energy of accompanying γ-rays because itis a source of backgrounds for the detection of ν̄e, and requires substantial shielding to comply withsafety rules for anybody working in the vicinity of the source during production, transportation,and deployment. For an artificial ν̄e source, the main channel of γ-ray background is the long-livedγ-emitting isotopes of the same chemical element simultaneously extracted from irradiated nuclearfuel. In case of cerium, all isotopes except 139Ce and 144Ce (see table 5) decay fast enough not tobe sources of γ backgrounds for the CeLAND experiment. 139Ce cumulative fission yield is only2.10−9 for 239Pu and 9.10−12 for 235U, at least 7 orders of magnitude lower than 144Ce. Therefore139Ce gamma background yield is negligible. The main concern then arises from the decay of144Ce and its daughter 144Pr deexcitation. The decay scheme of 144Ce and of 144Pr ground andexited states are shown in figure 8 and 5, respectively. The most dangerous source of backgroundoriginates from the energetic 2185 keV γ produced by the decay through excited states of 144Pr(see also table 6). This γ line has a branching ratio of 0.7%. Starting from a β activity of 75kCi, this leads to a huge γ activity of 525 Ci (1.9 1013 Bq) that must be attenuated through athick high-Z shielding material, such as tungsten alloy. In addition, it is necessary to guaranteea low level of radio-impurities containing long-lived γ radioisotopes during the cerium chemicalextraction procedure. Specifically, rate of γ-rays above 1 MeV from impurities must be smallerthan 10% of the 2185 keV γ rate, leading to an activity smaller than 50 Ci/75 kCi, ensuring thatthis gamma background is negligible.
4.1.2 Decay heat
The 144Ce−144 Pr pair releases heat through the collisions of β and γ radiations with atoms.Details of the 144Ce−144 Pr decay chain and heat production per decay branch are given in table 6.A 144Ce−144 Pr source releases 7.991 ± 0.044 Watt/kCi (0.56 %) of thermal power per units ofactivity, mostly coming from β decay electrons (95.72 %) contained in the cerium oxide.A 75 kCi activity therefore corresponds to an overall 599.3 W thermal power. For CeLAND phase1, the heat will be dissipated within the 3 kilotons of water circulating in the outer detector. Heatrelease as a function of time (and decreasing activity) is given in table 7. Starting with a 75 kCisource at the KamLAND site, thermal power decreases down to 387 W after 6 months (roughlycorresponding to a 50 kCi activity). Two years after the start of the data taking with an initial 75
16

Figure 6: γ ray spectrum of 144mPr isomers in equilibrium with144Ce, measured with a 17% HPGedetector [61]. Energies are in keV; the energy dispersion is 0.76 keV/channel. SE and DE standfor single and double escape peaks, respectively. An asterisk denotes a γ ray from the background;the Σ symbol indicates summing a peak from 2185.6 and 696.5 keV γ rays.
kCi source, the heat release drops down to 101 W (corresponding to about 13 kCi). After 10 yearsof running with an initial 75 kCi source, the heat release should be roughly 0.1 W, correspondingto an activity of 10 Ci.
17

End-point Energy Intensity Doseenergy (keV) (keV) (%) (keV / Bq)
144Ceβ branches318.7 (8) 91.1 (7) 76.5 (5) 69.7 (7)238.6 (8) 66.1 (6) 3.90 (20) 2.58 (13)185.2 (8) 50.2 (6) 19.6 (4) 9.84 (23)
Total 100 82.1 (11)144Ce γ lines
133.515 (2) 11.09 (19) 14.8 (3)99.961 (15) 0.04 (4) 0.04 (4)80.12 (5) 1.36 (6) 1.09 (5)59.03 (3) 0.0004 (5) 0.00058 (3)53.395 (5) 0.1 (8) 0.053 (4)40.98 (10) 0.257 (16) 0.105 (7)33.568 (10) 0.2 (22) 0.067 (8)
Total 16.2 (4)144Prβ branches
2997.5 (24) 1222 (11) 97.9 (4) 1196 (5)2301 (24) 895 (11) 1.04 (20) 9.31 (18)1436.5 (24) 526.27 (99) 0.0014 (3) 0.0074 (16)924.7 (24) 322.85 (92) 0.00062 (5) 0.002 (16)913 (24) 306.77 (96) 0.0067 (10) 0.0206 (3)811.8 (24) 267.19 (93) 1.05 (4) 2.81 (11)342.6 (24) 98.9 (78) 0.00015 (3) 0.00015 (3)322.2 (24) 92.33 (77) 0.00087 (9) 0.0008 (8)254.6 (24) 71.11 (76) 0.0003 (10) 0.00021 (7)
Total 100 1208.2 (53)144Pr γ lines
2654.9 (2) 0.00015 (3) 0.0039 (7)2368.3 (3) 5.4 10−5 (13) 0.0013 (3)2185.66 (7) 0.694 (15) 15.2 (3)2072.9 (2) 0.00023 (3) 0.0047 (6)2046.3 (2) 0.00027 (5) 0.0055 (11)1978.82 (10) 0.00087 (8) 0.0173 (16)1560.97 (10) 0.00020 (3) 0.0031 (4)1489.17 (5) 0.278 (5) 4.14 (7)1388.02 (10) 0.00672 (9) 0.0933 (12)1376.27 (10) 0.00039 (4) 0.0054 (6)1182 (3) 5.37 10−5 6.34 10−4
864.45 (10) 0.0024 (3) 0.0209 (23)814.1 (10) 0.0032 (3) 0.0262 (22)696.51 (3) 1.342 9.35674.95 (10) 0.003 (3) 0.0199 (18)624.7 (1) 0.00113 (3) 0.00704 (18)
Total 28.9 (4)Total β branches 1290.3 (64)Total γ lines 45.1 (8)Total X lines 3.2 (1)Total CE and Auger lines 9.5 (3)Grand total 1348.0 (75)
Table 6: Energy released for branch of 144Ce and 144Pr decays [73]. The 144mPr is neglected, dueto its very low branching ratio (<1%) and its very low β decay probability (0.7 %) compared to γisomeric transition (99.3 %).
18
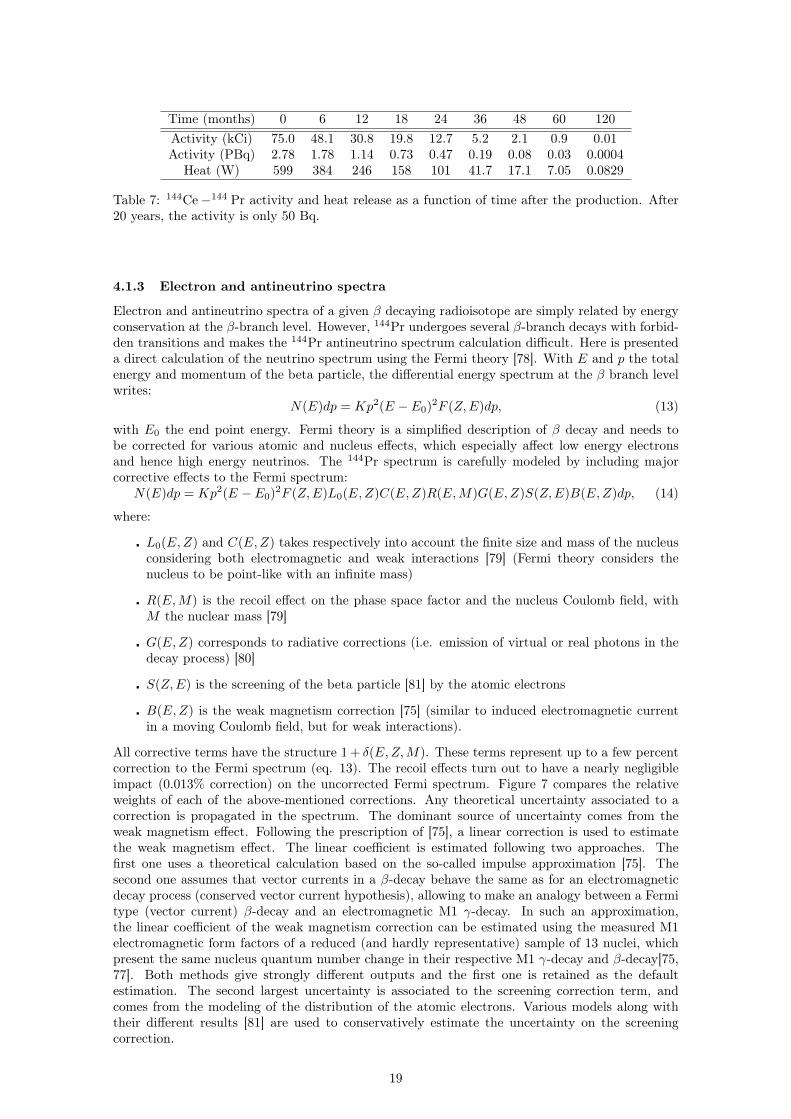
Time (months) 0 6 12 18 24 36 48 60 120Activity (kCi) 75.0 48.1 30.8 19.8 12.7 5.2 2.1 0.9 0.01Activity (PBq) 2.78 1.78 1.14 0.73 0.47 0.19 0.08 0.03 0.0004
Heat (W) 599 384 246 158 101 41.7 17.1 7.05 0.0829
Table 7: 144Ce−144 Pr activity and heat release as a function of time after the production. After20 years, the activity is only 50 Bq.
4.1.3 Electron and antineutrino spectra
Electron and antineutrino spectra of a given β decaying radioisotope are simply related by energyconservation at the β-branch level. However, 144Pr undergoes several β-branch decays with forbid-den transitions and makes the 144Pr antineutrino spectrum calculation difficult. Here is presenteda direct calculation of the neutrino spectrum using the Fermi theory [78]. With E and p the totalenergy and momentum of the beta particle, the differential energy spectrum at the β branch levelwrites:
N(E)dp = Kp2(E − E0)2F (Z,E)dp, (13)
with E0 the end point energy. Fermi theory is a simplified description of β decay and needs tobe corrected for various atomic and nucleus effects, which especially affect low energy electronsand hence high energy neutrinos. The 144Pr spectrum is carefully modeled by including majorcorrective effects to the Fermi spectrum:
N(E)dp = Kp2(E − E0)2F (Z,E)L0(E,Z)C(E,Z)R(E,M)G(E,Z)S(Z,E)B(E,Z)dp, (14)
where:
� L0(E,Z) and C(E,Z) takes respectively into account the finite size and mass of the nucleusconsidering both electromagnetic and weak interactions [79] (Fermi theory considers thenucleus to be point-like with an infinite mass)
� R(E,M) is the recoil effect on the phase space factor and the nucleus Coulomb field, withM the nuclear mass [79]
� G(E,Z) corresponds to radiative corrections (i.e. emission of virtual or real photons in thedecay process) [80]
� S(Z,E) is the screening of the beta particle [81] by the atomic electrons
� B(E,Z) is the weak magnetism correction [75] (similar to induced electromagnetic currentin a moving Coulomb field, but for weak interactions).
All corrective terms have the structure 1 + δ(E,Z,M). These terms represent up to a few percentcorrection to the Fermi spectrum (eq. 13). The recoil effects turn out to have a nearly negligibleimpact (0.013% correction) on the uncorrected Fermi spectrum. Figure 7 compares the relativeweights of each of the above-mentioned corrections. Any theoretical uncertainty associated to acorrection is propagated in the spectrum. The dominant source of uncertainty comes from theweak magnetism effect. Following the prescription of [75], a linear correction is used to estimatethe weak magnetism effect. The linear coefficient is estimated following two approaches. Thefirst one uses a theoretical calculation based on the so-called impulse approximation [75]. Thesecond one assumes that vector currents in a β-decay behave the same as for an electromagneticdecay process (conserved vector current hypothesis), allowing to make an analogy between a Fermitype (vector current) β-decay and an electromagnetic M1 γ-decay. In such an approximation,the linear coefficient of the weak magnetism correction can be estimated using the measured M1electromagnetic form factors of a reduced (and hardly representative) sample of 13 nuclei, whichpresent the same nucleus quantum number change in their respective M1 γ-decay and β-decay[75,77]. Both methods give strongly different outputs and the first one is retained as the defaultestimation. The second largest uncertainty is associated to the screening correction term, andcomes from the modeling of the distribution of the atomic electrons. Various models along withtheir different results [81] are used to conservatively estimate the uncertainty on the screeningcorrection.
19

Kinetic Energy (keV)
rela
tive c
orr
ecti
on
s in
%
0 500 1000 1500 2000 2500 3000−3
−2
−1
0
1
2
3
Screening
Finite−size
Hypercharge convolution
Radiative
Recoil
Weak mag
Figure 7: Comparison of the relative amplitudes for the corrective terms. The weak magnetismcorrection has been computed here using the impulse approximation. See text for further details.
The 144Pr neutrino spectrum is modeled combining the eight most important β-branches (highestbranching ratios) using data from National Nuclear Data Center. They are summarized in table 8.The resulting neutrino spectrum along with errors associated to the uncertainties in the consideredcorrections is displayed in figure 9. As a cross-check, the electron and antineutrino spectra havebeen calculated using the Bestiole code [76]. Bestiole has been originally developed to predict an-tineutrino spectra from nuclear reactors (which comprises thousands of β-branches) using availableexperimental informations in different nuclear databases. The agreement with our modeling, onceintegrated with the same binning configuration, is very good. The 144Pr antineutrino spectrumexhibits the same two discontinuities at 811.8 keV and 2301 keV, which are the end-point energiesof the β-branches of intensity of 1.05% and 1.04%, respectively. The next five branches do nothave a strong influence on the total spectrum and have a negligible contribution.In order to refine our knowledge of the source spectrum, β spectroscopic measurements usingcerium nitrate samples prepared by PA Mayak are scheduled to begin by the end of 2013. Our144Pr β spectrum modeling will be adjusted to the data to reduce uncertainties on the shape of theneutrino spectrum, and especially to constrain the weak magnetism correction, which dominatesthe shape error budget.The full 144Ce−144 Pr antineutrino spectrum is displayed in figure 8. The 144Ce lifetime is muchshorter than that of 144Pr, which enables us to assume secular equilibrium. The first peak corre-sponds to the 144Ce parent β decay with an end-point energy of 318.7 keV. ν̄e originating from144Ce β decay are hence not detectable through the inverse beta decay process. The second broadpeak corresponds to the 144Pr β decay with an end-point energy of 2997.5 keV. The ν̄e spectrumwhich lies above the inverse beta decay threshold of 1.8 MeV represents about 50% of the 144Premitted ν̄e.
20

Branchingratio (%)
Quantumnumbers Qβ(keV) type
97.9 0+ 2997.5 First non unique forbidden1.05 1− 811.8 Allowed1.04 2+ 2301.0 First unique forbidden
6.70 · 10−3 0+ 913 First non unique forbidden1.4 · 10−3 2+ 1436.5 First unique forbidden8.7 · 10−4 0+ 322.2 First non unique forbidden6.2 · 10−4 2+ 924.7 First unique forbidden3.0 · 10−4 0+ 254.6 First non unique forbidden
Table 8: 144Pr β-branches included in the analytical model, sorted by decreasing probability
Kinetic Energy (keV)
dN
/dE
(keV
−1)
0 500 1000 1500 2000 2500 300010
−7
10−6
10−5
10−4
10−3
10−2
Figure 8: 144Ce−144 Pr antineutrino emitted spectrum assuming secular equilibrium.
Kinetic Energy (keV)
dN
/dE
(keV
−1)
−500 0 500 1000 1500 2000 2500 3000 35000
1
2
3
4
5
6x 10
−4
Kinetic Energy (keV)
dN
/dE
(cm
2.k
eV
−1)
1800 2000 2200 2400 2600 2800 30000
1
2
3
4
5
x 10−47
Figure 9: Left panel: Complete neutrino spectrum for eight first β-branches of 144Pr with optimisticweak magnetism correction. Right Panel: Differential observable neutrino spectrum from 144Princluding the IBD cross-section.
21

As a first application, our model was used to predict the rate of inverse beta decay events thatwill be detected in KamLAND. It is also used to estimate the uncertainty coming from the shapeof the neutrino spectrum. The visible energy spectrum in the detector is obtained by multiplyingthe IBD cross-section to the 144Ce−144 Pr antineutrino spectrum. It is shown on the right panelof figure 9. The threshold of IBD is high enough to neglect all influence of Cerium as its transitionend-points are well below 1.8 MeV. The cross-section is computed using prescriptions from [81],with a pre-factor of 9.61 10−48 cm2/Mev2 (which has a negligible 0.1% uncertainty due to theneutron lifetime uncertainty). Then, the expected event rate in the KamLAND detector is
Nν = NCeρpFgeo
ˆ ∞0
σIBD (Eν)S (Eν) dEν , (15)
where ρp = 6.62 × 1022 cm−3 is the density of protons in the KamLAND detector and Fgeo is ageometric factor (with dimension of a length) including the detector and source geometry. For acylindrical source of 13.5 cm diameter and 13.5 cm height, positioned 9.3 m away from the centerof a spherical detector of 6.5 m radius, Fgeo = 1.10 m. Considering a pessimistic scenario wheresome backgrounds escaping the source (gammas and neutrons) remain unshielded, a tighter 6 mradius fiducial cut was also considered, giving Fgeo = 0.85 m. NCe is the number of Cerium decayscorresponding to a data taking period T:
NCe =
ˆ T
0
A0e−ln(2)tT1/2 dt (16)
= A0
T1/2
ln(2)
[1− e
−ln(2)TT1/2
],
where A0 is the initial source activity. With a 75 kCi source and a 18-month data taking period,24165±189 (resp. 18673±146) antineutrinos are expected to be detected in KamLAND consideringa 6.5m radius (resp. 6 m radius) fiducial volume cut. The quoted uncertainties come from the β-spectrum modeling only, assuming a weak magnetism correction factor calculated using the impulseapproximation, as done in [22].
4.2 144Ce−144 Pr source productionFrom an extraction and production perspective, cerium is a rather abundant element present atthe 5.5% and 3.7% levels in the fission products of uranium and plutonium, respectively (see tabletable 3).
4.2.1 Activity
As agreed with the PA Mayak, the activity of the cerium antineutrino generator will be of 85+15−10
kCi in 144Ce beta activity at delivery in Yekaterinburg. Taking into account the 6-8 % precision ofthe activity measurement at Mayak, one guarantee there is a 90 % probability to get the activityhigher than 75 kCi. Remaining free space in source (inner) capsule, if any, will be filled withadditional radioactive cerium oxide if available at the end of the production, up to 100 kCi. Thus,depending on the fuel age and extraction process there is a possibility that the source activity maybe above 75 kCi at the beginning of the experiment at KamLAND.
4.2.2 Geometry
The spatial extent of the CeO2 source material must be small compared to the neutrino oscillationlength (Losc ∼ 1 m for ∆m2 ∼ 1 eV2 neutrino mass splittings considered above) for the successfuloscillometry measurement. Moreover, the size of the source will directly increase the size and massof the shielding, thus requiring a source to be small and compact, with an extension of a few tensof centimeter.But several constraints have to be considered. The first consideration is that only a mixture ofall cerium isotopes produced during irradiation can be practically separated from spent nuclearfuel, since isolating the 144Ce would require a very difficult isotopic separation. So the 144Cecontent of the cerium oxide is limited by fission yields and cooling time. Secondly, the CeO2 willbe manipulated in hot cells, which requires cylindrically shaped capsule and limit the achievabledensity of cerium oxide to 4.0± 1 g/cm3.
22

Finally, the largest capsule that can be handled routinely in Mayak hot cells is 15 cm in height anddiameter, and safety requirements impose a double container in stainless steel. Mayak will providethe capsules, 4 mm thick for the outer capsule and 3 mm thick for the inner capsule. Adding thenecessary mechanical gap of 0.5 mm, a maximum of 13.5 cm in diameter remains available for theCeO2.
4.2.3 Spent fuel seeds
Preliminary computations have been done to study the amount of cerium produced within VVERreactors for various condition of irradiation. The SAS2H (SCALE-4.4) ORIGEN-S software fromOakridge was used by the MePhi group in Russia. The content of 144Ce in spent nuclear fuel(SNF) elements depends on the irradiation history and on the reactor neutron spectrum. The144Ce isotope mostly results from the decay of 144Cs and is abundantly produced in the fissionsof 235U and 239Pu. The abundance of cerium among produced rare earth elements is about 22%.Taking these numbers at their face values, about 15 SNF elements would be needed to achieve 75kCi of 144Ce, but we will see that technical considerations force us to consider about five to tentimes more SNF elements to reach the desired activity.To optimize the selection of SNF elements in order to maximize the 144Ce content per fuel elementunits of mass, a dedicated study was performed by Mayak and MePhi. The general guidelines toextract the fuel with the highest constant of 144Ce are the following:
1. Select SNF with shortest time of irradiation, since the fission yield for 144Ce of 239Pu is lowerthan 235U.
2. Select SNF with highest energy release during the last irradiation, since the 144Ce contentincreases with the fission rate and therefore power.
3. Select SNF with the lowest burn-up, for the same reason than the first guideline.
Following these guidelines, a specific activity of 144Ce in the range 31 to 35 Ci/g of SNF can beexpected, corresponding to an absolute activity of 8 to 12 kCi per fuel SNF.The usual cooling sequence of SNF consists is 3 years of cooling in the power plant storage poolfollowed by another 2-year period of SNF being stored at the reprocessing plant. Delivery offresher SNF to the reprocessing plant is possible but not conventional. This step would maximizethe amount of activity within a small volume and significantly reduce the amount of SNF neededto produce a 144Ce source with 75 kCi activity. Each gained month in the source manufacturingprocess represents a gain of SNF material of the order of 10%. To guarantee that the source iscompact enough to fit inside the Mayak capsule, the possibility of using SNF with a low coolingtime has been considered and approved by Mayak.The transport, by train, will probably use a TUK-6 container (or equivalent), which is categorizedas a B(M) container according to the international classification and contains typically up to 3.8tons of UO2 (see figure 10). To keep the level of radiation within the limits for transportation fromthe reactor site to the reprocessing plant with a low cooling time fuel, the container may be notfull or filled with a mix of long and low cooling time fuel.
23

Figure 10: TUK-6 container (left) and carriage container (right) for spent fuel transportation fromreactor to reprocessing plant. Each year about 58 tons of SNF are transported from Cola NPP toRadiochemistry plant RT-1 at PA Mayak (Ozersk, Chelyabinsk region).
An agreement between Rosatom and FSUE Mayak PA has been reached for delivery of ’fresh’ SNFfrom the Kola Nuclear Power Plant (VVER-440, 3000 km north of Mayak) with a 1.7 to 2.0 yearcooling period after the end of irradiation. The total mass of this special batch will be about 15- 16 tons, including 7 - 8 tons with cooling time in the range of 580 till 640 days (1.6-1.75 years).The second part of SNF has cooling time 3.5 years and more. The burnup value of this "fresh"fuel will be in the range of 48 - 51 MW.d/t.
4.2.4 Spent fuel cooling time and mass of CeO2 containing 75 kCi of 144Ce
The ratio of 144Ce in cerium extracted from SNF as a function of time t, assuming 144Ce is theonly cerium long-lived cerium isotope is,
χ(t) =mass(144Ce, t)
mass(Ce, t)=
mass(144Ce, t)
mass(144Ce, t) + mass(stableCe)=
m144(t)
m144(t) +mstable(17)
According to MePhi (private communication during the CeLAND meeting in Paris, 22 July 2013),the content of 144Ce in cerium with tc= 3 years after the end of irradiation is:
χ(3) = χ3 = 0.6+0.1−0.15 %
Here tc is an arbitrary reference cooling time, used by MePhi for standard simulations. The massof stable cerium can be written:
mstable =m144(3)
χ3−m144(3) =
(1− χ3)m144(3)
χ3(18)
and the mass of 144Ce is:m144(t) = m144(0) e−λt = m144(3) e−λ(t−tc)
with λ = ln(2)/τ1/2 = 2.8158 10−8 s−1. Then the 144Ce mass ratio as a function of time t is:
χ(t) =m144(3) e−λ(t−tc)
m144(3) e−λ(t−tc) + (1−χ3) m144(3)χ3
=χ3 e−λ(t−tc)
1− χ3 + χ3 e−λ(t−tc)(19)
The 144Ce mass ratio is plotted on the left panel of figure 11. The source mass is related to the144Ce activity A(t) through:
A(t) = λ N144(t) =m144(t) Na λ
144⇔ m144(t) =
144×A(t)
Na λ. (20)
with Na the Avogadro number. Finally, the source mass is given by:
msource(t) = m144(t)× 176
144+ mstable(t)× 174
142' A(t)
Na λ χ(t)(176.5− 0.5χ(t)) (21)
24

Time after last irradiation (year)
Ma
ss
ra
tio
144Ce over CeO
2 mass ratio
2.5 3 3.5 4 4.5 5 5.5 6
10−3
10−2
Time after last irradiation (year)
Ce
O2 m
as
s (
kg
)
CeO2 mass for 75 kCi in
144Ce
2 2.5 3 3.5 4 4.5 5 5.5 60
5
10
15
20
25
30
35
40
45
50
Figure 11: Left: 144Ce/CeO2 mass ratio as a function of time after last irradiation at the reactor(and its uncertainty band computed from reactor core simulations). Right: Mass of CeO2 for a 75kCi activity in 144Ce as a function of the cooling + production time. The antineutrino generatorshould be realized with maximum cooling + production time of about 4.5 years in order to fitenough radioactive material inside the inner capsule (assuming a cerium oxide density of 4 g/cm3).
The mass of CeO2 required to achieve an activity of 75 kCi in 144Ce, is given as a function of timein the right panel of figure 11. Assuming a 2-year cooling time and 1 year of production, the sourcemass included is between 4.8 kg and 6.4 kg. The last case corresponds to a cylinder of 15.4 cm inheight and diameter with a minimal density of 3 g/cm3. With all the parameters taken at theirbaseline values, the source mass is 5.45 kg, its volume is 1.36 liter corresponding to a cylinder of12.0 cm in height and diameter. Considering the uncertainty on density and χ3, the largest capsulehas been validated (15 cm in the external diameter of the outer capsule, 13.5 cm in the internaldiameter of the inner capsule).
4.2.5 Cerium production line
The Federal State Unitary Enterprise Mayak Production Association is a Russian spent fuel repro-cessing facility located in the city of Ozersk, which performs the reprocessing of Russian SNF. Itcan reprocess spent fuel from various nuclear power plants (VVER, BN-600, and BN-350) as wellas from research reactors, atomic-powered ships and submarines.Russia reprocesses its SNF with the PUREX process which extracts uranium and plutonium.A secondary and optional phase can extract a highly concentrated waste of rare-earth elements(REEs), and a final step allows to separate through liquid chromatography a specific element, suchas samarium used for powerless lights.
Standard reprocessing at the radiochemical plant
Procedures of spent fuel processing, starting from cutting and digestion through standard PUREXprocess to preparation of the required feed for further individual radionuclides separation aredepicted in figure 12.
25

Figure 12: First procedures of PUREX process and Selected Spent Fuel Processing to obtain therequired feed for further individual radionuclides separation.
First step is cutting of the ends of fuel assemblies (FA) by electroarc process. Then fuel partof FA is cut into small pieces and dissolved by nitric acid. The resulting solution is in form ofpulp with superfine components of graphite, silicone and other elements. These components canaffect the following chemical procedures. This is why one of important stages of reprocessing isclearing of the pulp by high-molecular organic flocculating agent and filtration on bulk filter madeof stainless steel metallic spheres and natural minerals.
Procedure of U, Th and Np recovery (PUREX process) is the extraction process using multistagemixer settlers with the mixture of tributyl phosphate and hydrocarbon solvent. A similar processis implemented by COGEMA (France) and BNFL (UK). After recovery of U, Pu and Np, PUREXraffinate is transported to another distant workshop of Radiochemical Plant for its concentratingby evaporation. During the evaporation procedure a large quantity of nitric acid is recovered fromthe raffinate for its reiterative use. Due to big volume of communication pipeline (the distance ofabout 1.5 km) the minimum batch of PUREX raffinate which is transported is about several tensof cubic meters of the solution. Such a volume of the PUREX raffinate is equivalent to about 10tons of SNF. It means that minimum quantity of SNF of certain quality we should select is about10 tons.
Most of raffinate after evaporation procedure is directed to vitrification unit for disposal of highradioactive waste in form of phosphate glasses. This is one of main task for the RadiochemicalPlant RT1 of PA Mayak in the framework of Russian program of closed fuel cycle.
Sometimes, accordingly to special request from Customers, a part of PUREX raffinate ispumped to another distant workshop, Radioisotope plant, for recovery of radioisotopes for medicine,scientific and industrial applications. Before pumping the solution is diluted by water to improvethe mobility of this pulp.
Additional reprocessing at radioisotope plant
First operation at Radioisotope plant is recovery of 137Cs isotope by sorption procedure (seefigure 13). At the radiochemical plant the raffinate passed two stages of concentration and pu-rification of REE and TPE concentrate by double oxalate precipitation. First and second oxalate
26

procedure consists of oxalate precipitation of REE and TPE followed by dissolving the precipitateby nitric acid (digestion of oxalate). Precipitation of oxalates allows to separate the bulk of impu-rities present in the raffinate and to obtain relatively pure REE and TPE group. Main impuritieswhich should be removed are Cesium (137Cs) and Strontium (90Sr), and chemical elements aftercorrosion (Fe, Ni, Cr).
Figure 13: Individual radionuclides separation and refining.
Cerium Recovery
REE and TPE concentrate after correction by means of nitric acid are transferred by a pipeline tothe chromatographic facility for separation of REE and TPE at the distance of about 500 m. Thepipeline and additional vessels should be purified before this procedure.Separation of cerium is performed by complexion displacement chromatography (CDC) using aseries of columns, the first one being a sorption column and the others being separating columns.REEs are sorbed as a uniform band in the sorption column and are later separated using a seriesof columns packed with a resin containing retaining ion (Ni2+, Cu2
+, H+, etc.).
27

Figure 14: Schematic view of the cerium extraction process.
The main role of the retaining ions is to decompose the REE complex during the entire separationprocess and to favor repeated sorption-desorption cycles. The complexes of the eluent with theretaining ion should be stronger than those with the ions being separated. The sorption of theretaining ion on the resin should be weaker than that of the ions being separated. To separateREEs, a complexing agent containing displacing ions, NH4
+, or Na+, is used. The sorption of thisagent is stronger than that of REEs. When a column is washed with this agent, NH4
+ cationssubstitute REE3
+ cations. As a results, the resin is transformed into the NH4+ form and REE ions
form complexes with the eluent (EDTA). These complexes are decomposed by reaction with theresin in the form of the retaining ion Ni2+. The released REE ions are sorbed again and displaceNi2+. Thus, separate REE bands are formed in the columns. The order of these bands correspondsto the strength of the REE complexes (see figure 15). A diagram of the cerium extraction processis given in figure 14. An generic output of the chromatography is given in figure 15.
Figure 15: Selection of cerium through displacement chromatography. We note here that ceriumif far away from curium and americium which guarantee a low concentation of neutron emitterimpuritites in the final product.
28

4.2.6 144Ce source pressing and encapsulation
The source will be encapsulated in a cylindrical sealed double stainless steel container, the outercapsule having a 15 cm external diameter. The outer capsule will be 4 mm thick, the inner capsule3 mm thick, and the mechanical gap will be 0.5 mm (to be confirmed by Mayak), leading to aninner capsule with a 13.5 cm in internal diameter (see figure 16 for a preliminary design proposedby CEA before Mayak constraints were known). The final design is ongoing. The capsules will bewelded inside a hot cell (argon-arc welding). The tightness of the capsules will be tested using theMayak’s standard helium leakage test. The capsule will be certified by Mayak according to theISO 9978-92 (Radiation protection - Sealed radioactive sources - Leakage test methods) regulation.
Figure 16: Preliminary 75 kCi 144Ce−144 Pr source capsule (cylinder with a diameter of 15 cmheight and radius). Dimensions have to be updated, and a new design of the lid holder (mushroom-like) is necessary for proper manipulation inside the hot cells.
The cold pressing of the cerium oxide will be done in a hot cell at PA Mayak. In principle, adensity of 5 g/cm3 can be achieved since the CeO2 has a theoretical density of 7.2 g/cm3, but itcould be as low as 3 g/cm3. This is being checked with large samples in laboratory. The currentdensity is expected to be 4 ± 1 g/cm3. Prior to insertion, the cerium oxide will be pressed underthe form of large solid pellets, with a diameter slightly smaller than the capsule.Finally, the CeO2 material and source container will be qualified as SFRM (Special Form of Ra-dioactive Material). This is a mandatory step prior to the source container insertion within thetungsten shielding.The CeLAND CeO2 source production scenario assumes a 1-year production time between SNFarrival at the PA Mayak reprocessing facility and source delivery in Japan. Mayak’s schedule isslightly shorter, about 10 months.
4.2.7 Target contamination144Ce will be extracted from spent nuclear fuel elements. Though expected to be very small,contamination of the final 144Ce source with other radio-elements is unavoidable. The extraction
29

process leads to a small contamination from other REEs and minor actinides, that may be howeverrelevant for realizing a neutrino experiment.The REE contaminants are γ and β emitters, which could bias the activity measurement or par-ticipate to γ-induced accidental background. The contamination in REEs must therefore be smallenough to provide a negligible contribution to activity, a requirement easily achieved through theCDC method used at PA Mayak. Because the source has to be shielded against 2.185 MeV 144Prγ-rays, any γ-rays from contaminants will be shielded as well. As explained in section 5, theγ attenuation length is close to its minimum at 2.2 MeV and will therefore drives the shieldingdimensions.Actinides are produced in a reactor core through successive neutron captures and beta decays from238U, as shown by figure 17. On one hand, they are α, β and γ emitters feeding long decay chainsthat require similar high-Z shielding than for REE contaminants. On the other hand, the heavyneutron rich actinides could be more hazardous since they also undergo Spontaneous Fission (SF).This emission of several γ-rays and neutrons is therefore a potential source of correlated backgroundfor the CeLAND experiment.
Figure 17: Production of minor actinides during irradiation of a reactor core.
Our contamination specifications are consequently the following:
� Thermal power of nuclides other than 144Ce and 144Pr should be less than 0.1 % of thethermal power delivered by 144Ce and 144Pr (7.991 ± 0.044 W/kCi), in order to guaranteethe precision of the calorimetry measurement;
� Gamma activity above 1 MeV should be less than 0.1 % of the beta activity of 144Ce;
� Activity of spontaneous fission radio impurities to be defined by Saclay in collaboration withthe MePhi institute, ICP institute and Isoflex USA.
Since the attenuation corresponding to 2.185 MeV γ-rays is very close to the minimal attenuationlength of tungsten, any high energy γ-rays (above 1 MeV) will at least be as attenuated as the2.185 MeV γ-rays from 144Pr. The 0.1% 144Ce beta activity specification on γ-rays therefore ensuresthat the most active γ-rays will come from the 144Pr 2.185 MeV γ emission (0.7% branching ratio).Thus, the gamma radiation shielding dimensions should only be driven by the activity of the 144Pr2.185 MeV γ-ray.
30
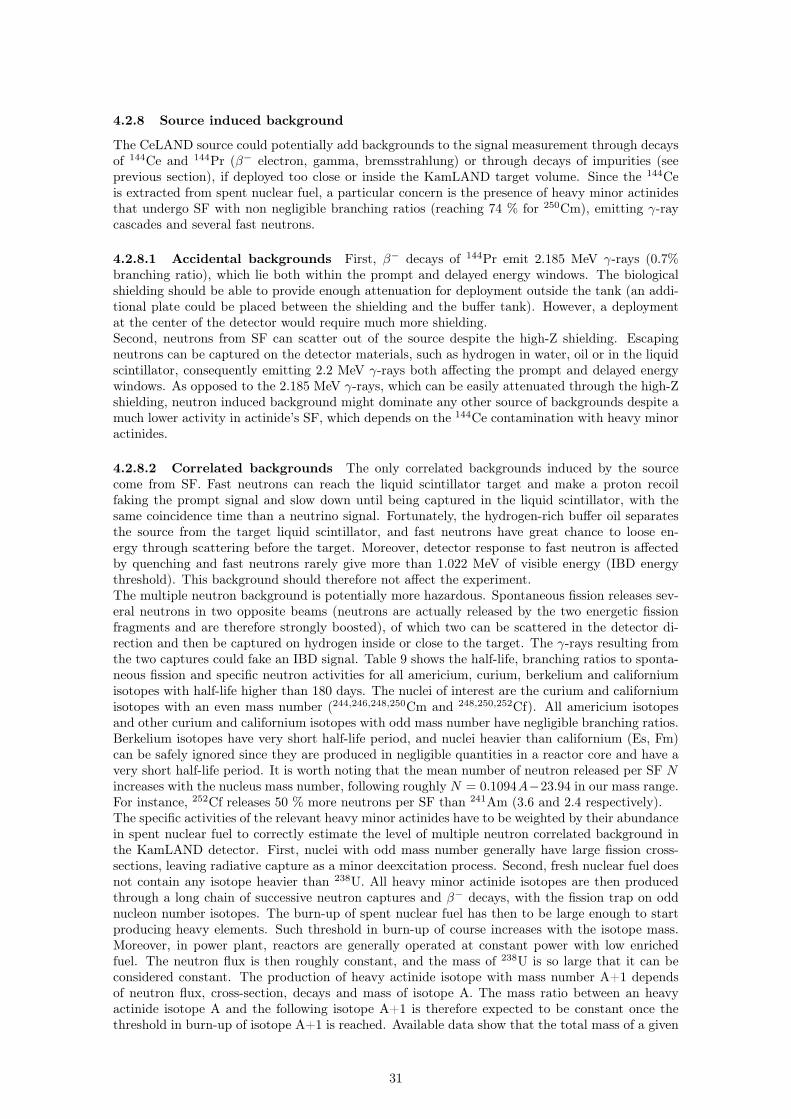
4.2.8 Source induced background
The CeLAND source could potentially add backgrounds to the signal measurement through decaysof 144Ce and 144Pr (β− electron, gamma, bremsstrahlung) or through decays of impurities (seeprevious section), if deployed too close or inside the KamLAND target volume. Since the 144Ceis extracted from spent nuclear fuel, a particular concern is the presence of heavy minor actinidesthat undergo SF with non negligible branching ratios (reaching 74 % for 250Cm), emitting γ-raycascades and several fast neutrons.
4.2.8.1 Accidental backgrounds First, β− decays of 144Pr emit 2.185 MeV γ-rays (0.7%branching ratio), which lie both within the prompt and delayed energy windows. The biologicalshielding should be able to provide enough attenuation for deployment outside the tank (an addi-tional plate could be placed between the shielding and the buffer tank). However, a deploymentat the center of the detector would require much more shielding.Second, neutrons from SF can scatter out of the source despite the high-Z shielding. Escapingneutrons can be captured on the detector materials, such as hydrogen in water, oil or in the liquidscintillator, consequently emitting 2.2 MeV γ-rays both affecting the prompt and delayed energywindows. As opposed to the 2.185 MeV γ-rays, which can be easily attenuated through the high-Zshielding, neutron induced background might dominate any other source of backgrounds despite amuch lower activity in actinide’s SF, which depends on the 144Ce contamination with heavy minoractinides.
4.2.8.2 Correlated backgrounds The only correlated backgrounds induced by the sourcecome from SF. Fast neutrons can reach the liquid scintillator target and make a proton recoilfaking the prompt signal and slow down until being captured in the liquid scintillator, with thesame coincidence time than a neutrino signal. Fortunately, the hydrogen-rich buffer oil separatesthe source from the target liquid scintillator, and fast neutrons have great chance to loose en-ergy through scattering before the target. Moreover, detector response to fast neutron is affectedby quenching and fast neutrons rarely give more than 1.022 MeV of visible energy (IBD energythreshold). This background should therefore not affect the experiment.The multiple neutron background is potentially more hazardous. Spontaneous fission releases sev-eral neutrons in two opposite beams (neutrons are actually released by the two energetic fissionfragments and are therefore strongly boosted), of which two can be scattered in the detector di-rection and then be captured on hydrogen inside or close to the target. The γ-rays resulting fromthe two captures could fake an IBD signal. Table 9 shows the half-life, branching ratios to sponta-neous fission and specific neutron activities for all americium, curium, berkelium and californiumisotopes with half-life higher than 180 days. The nuclei of interest are the curium and californiumisotopes with an even mass number (244,246,248,250Cm and 248,250,252Cf). All americium isotopesand other curium and californium isotopes with odd mass number have negligible branching ratios.Berkelium isotopes have very short half-life period, and nuclei heavier than californium (Es, Fm)can be safely ignored since they are produced in negligible quantities in a reactor core and have avery short half-life period. It is worth noting that the mean number of neutron released per SF Nincreases with the nucleus mass number, following roughly N = 0.1094A−23.94 in our mass range.For instance, 252Cf releases 50 % more neutrons per SF than 241Am (3.6 and 2.4 respectively).The specific activities of the relevant heavy minor actinides have to be weighted by their abundancein spent nuclear fuel to correctly estimate the level of multiple neutron correlated background inthe KamLAND detector. First, nuclei with odd mass number generally have large fission cross-sections, leaving radiative capture as a minor deexcitation process. Second, fresh nuclear fuel doesnot contain any isotope heavier than 238U. All heavy minor actinide isotopes are then producedthrough a long chain of successive neutron captures and β− decays, with the fission trap on oddnucleon number isotopes. The burn-up of spent nuclear fuel has then to be large enough to startproducing heavy elements. Such threshold in burn-up of course increases with the isotope mass.Moreover, in power plant, reactors are generally operated at constant power with low enrichedfuel. The neutron flux is then roughly constant, and the mass of 238U is so large that it can beconsidered constant. The production of heavy actinide isotope with mass number A+1 dependsof neutron flux, cross-section, decays and mass of isotope A. The mass ratio between an heavyactinide isotope A and the following isotope A+1 is therefore expected to be constant once thethreshold in burn-up of isotope A+1 is reached. Available data show that the total mass of a given
31

curium isotope with even mass number A is roughly a factor 102 more than the following evenisotope A+2. This effect should then counterbalance the increase of SF branching ratios with massnumber. Detailed simulations are ongoing to precisely estimate heavy isotope abundance is spentnuclear fuel.
Isotope Half-life Branching ratioto SF
Specific neutronactivity (neutron/g)
241Am 432 y 4 · 10−12 1.2242mAm 141 y 4.7 · 10−11 46243Am 7370 y 3.7 · 10−11 0.72243Cm 29 y 5.3 · 10−11 2.6 · 102
244Cm 18 y 1.4 · 10−6 1.2 · 107
245Cm 8500 y 6.1 · 10−9 1.1 · 102
246Cm 4730 y 3 · 10−4 1.0 · 107
248Cm 3.5 · 104 0.083 4.2 · 107
250Cm 9000 y 0.74 1.5 · 1010
249Bk 320 d 4.7 · 10−10 9.4 · 104
248Cf 333 d 2.9 · 10−5 5.4 · 109
249Cf 351 y 5 · 10−9 2.5 · 103
250Cf 13 y 8 · 10−4 1.1 · 1010
251Cf 898 y 1 · 10−7 2.0 · 104
252Cf 2.65 y 0.030 2.2 · 1012
Table 9: Spontaneous fission properties of minor actinide isotopes with half-life > 0.5 y
The most abundant curium isotope is 244Cm, with a specific neutron activity comparable to 246Cmand 248Cm. According to our preliminary GEANT4 simulations, the correlated background inducedby 244Cm is 5000 events per year in the KamLAND detector, with a 6 m radius fiducial volume cutand assuming a contamination of 10−9Bq/Bq. This assumption is taken from a limit on the levelof contamination by minor actinides observed in Promethium production. However, the amountof multiple neutron correlated background in KamLAND is expected to be lower, because Ceriumis more efficiently separated from actinides than Promethium using the complexion displacementchromatography method (see figure 15).A neutron shielding solution, using saturated boric water surrounding the tungsten alloy shielding,is envisaged if the contamination in heavy minor actinides turns out to be non negligible. Com-mercial tungsten alloys are known to resist to boric water at room temperature. Corrosion testare currently being performed to clearly demonstrate that point.
4.2.9 Summary
Below are summarized the specifications of the source in the standard scenario that we will relyon in estimating the physics and sensitivity reach of the CeLAND project:
1. Spent fuel cooling time less than 2 years prior to transportation to PA Mayak;
2. Source beta activity of 85+15−10 kCi of 144Ce at delivery ;
3. Chemical form of cerium is CeO2 with density 4± 1 g/cm3;
4. External diameter of the capsules is 15 cm, internal diameter is 13.5 cm ;
5. Samples of cerium from the same production batch will be provided with the source.
5 High-Z gamma ray shieldingThe most serious source of backgrounds is the decay of the 144Nd 1− excited state, which emits a2.185 MeV γ-ray with a 0.7% intensity (see table 4). The bremsstrahlung of the 144Pr β particles
32
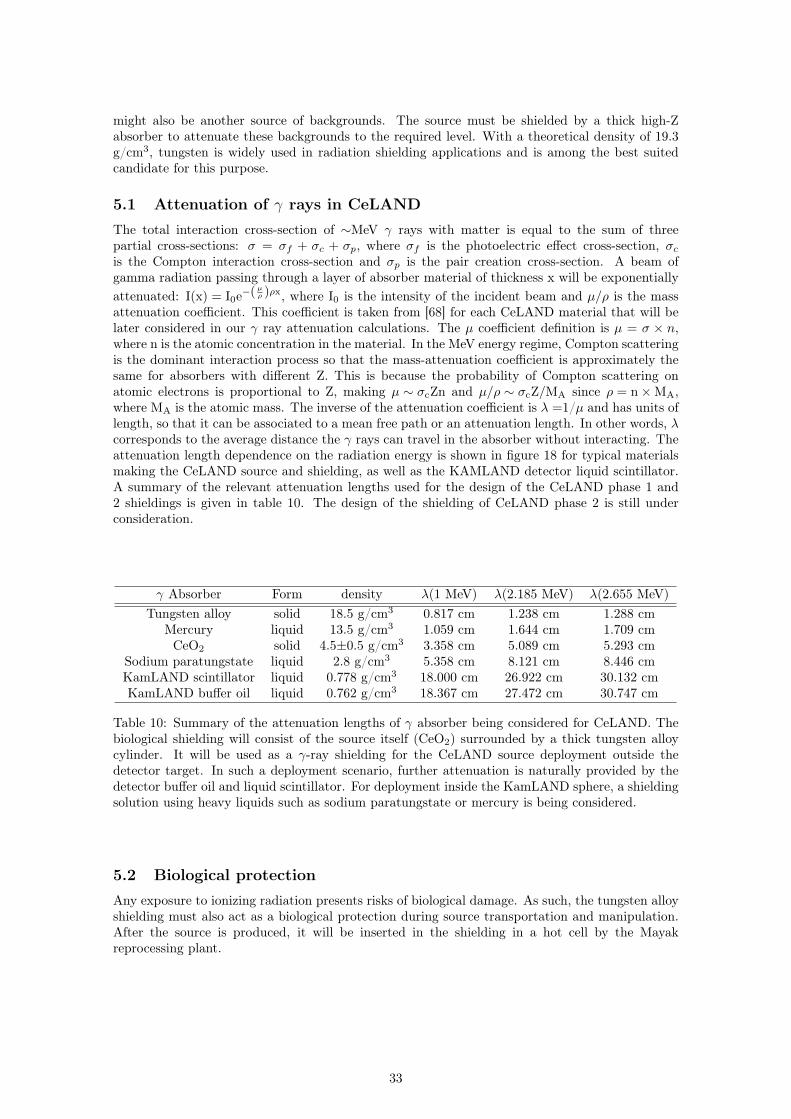
might also be another source of backgrounds. The source must be shielded by a thick high-Zabsorber to attenuate these backgrounds to the required level. With a theoretical density of 19.3g/cm3, tungsten is widely used in radiation shielding applications and is among the best suitedcandidate for this purpose.
5.1 Attenuation of γ rays in CeLANDThe total interaction cross-section of ∼MeV γ rays with matter is equal to the sum of threepartial cross-sections: σ = σf + σc + σp, where σf is the photoelectric effect cross-section, σcis the Compton interaction cross-section and σp is the pair creation cross-section. A beam ofgamma radiation passing through a layer of absorber material of thickness x will be exponentiallyattenuated: I(x) = I0e−(µρ )ρx, where I0 is the intensity of the incident beam and µ/ρ is the massattenuation coefficient. This coefficient is taken from [68] for each CeLAND material that will belater considered in our γ ray attenuation calculations. The µ coefficient definition is µ = σ × n,where n is the atomic concentration in the material. In the MeV energy regime, Compton scatteringis the dominant interaction process so that the mass-attenuation coefficient is approximately thesame for absorbers with different Z. This is because the probability of Compton scattering onatomic electrons is proportional to Z, making µ ∼ σcZn and µ/ρ ∼ σcZ/MA since ρ = n×MA,where MA is the atomic mass. The inverse of the attenuation coefficient is λ =1/µ and has units oflength, so that it can be associated to a mean free path or an attenuation length. In other words, λcorresponds to the average distance the γ rays can travel in the absorber without interacting. Theattenuation length dependence on the radiation energy is shown in figure 18 for typical materialsmaking the CeLAND source and shielding, as well as the KAMLAND detector liquid scintillator.A summary of the relevant attenuation lengths used for the design of the CeLAND phase 1 and2 shieldings is given in table 10. The design of the shielding of CeLAND phase 2 is still underconsideration.
γ Absorber Form density λ(1 MeV) λ(2.185 MeV) λ(2.655 MeV)Tungsten alloy solid 18.5 g/cm3 0.817 cm 1.238 cm 1.288 cm
Mercury liquid 13.5 g/cm3 1.059 cm 1.644 cm 1.709 cmCeO2 solid 4.5±0.5 g/cm3 3.358 cm 5.089 cm 5.293 cm
Sodium paratungstate liquid 2.8 g/cm3 5.358 cm 8.121 cm 8.446 cmKamLAND scintillator liquid 0.778 g/cm3 18.000 cm 26.922 cm 30.132 cmKamLAND buffer oil liquid 0.762 g/cm3 18.367 cm 27.472 cm 30.747 cm
Table 10: Summary of the attenuation lengths of γ absorber being considered for CeLAND. Thebiological shielding will consist of the source itself (CeO2) surrounded by a thick tungsten alloycylinder. It will be used as a γ-ray shielding for the CeLAND source deployment outside thedetector target. In such a deployment scenario, further attenuation is naturally provided by thedetector buffer oil and liquid scintillator. For deployment inside the KamLAND sphere, a shieldingsolution using heavy liquids such as sodium paratungstate or mercury is being considered.
5.2 Biological protectionAny exposure to ionizing radiation presents risks of biological damage. As such, the tungsten alloyshielding must also act as a biological protection during source transportation and manipulation.After the source is produced, it will be inserted in the shielding in a hot cell by the Mayakreprocessing plant.
33

Gamma Energy (MeV)
Att
en
ua
tio
n L
en
gth
(cm
)Cerium oxyde CeO
2 (4.5 g/cm
3)
10−3
10−2
10−1
100
101
10−4
10−3
10−2
10−1
100
101
Gamma Energy (MeV)
Att
en
ua
tio
n L
en
gth
(c
m)
tungsten alloy − Densimet 185 (18.5 g/cm3)
10−3
10−2
10−1
100
101
10−4
10−3
10−2
10−1
100
Gamma Energy (MeV)
Att
en
uati
on
Le
ng
th (
cm
)
Hheavy liquid − sodium polytungstate (2.8 g/cm3)
10−3
10−2
10−1
100
101
10−4
10−3
10−2
10−1
100
101
Gamma Energy (MeV)
Att
en
uati
on
Le
ng
th (
cm
)
KamLAND liquid scintillator (C11.4 H21.6, 0.778 g/cm3)
10−1
100
101
10
20
30
40
50
60
70
80
90
100
Figure 18: γ-ray attenuation lengths of some CeLAND materials. From left to right and top tobottom: cerium oxide, tungsten alloy, sodium paratungstate, and KamLAND liquid scintillator.The yellow line indicates the 2.185 MeV γ line produced by the decay through excited states of144Pr, which set the stronger constraint in the CeLAND source shielding design.
Chemical composition: W (97%), Ni (1.5%), Fe (1.5%)Density [g/cm3] 18.5
Tensile strength at 20 °C [MPa] 800Oxidation resistance up to 600 °C
Thermal conductivity at 500 °C [W/mï¿œK] 70-90Modulus of elasticity [GPa] 385
Hardness [HRC] 43Yield strength at 20 °C [MPa] 600
Breaking elongation at 20 °C [%] 10Coefficient of thermal expansion [10−6 K−1] 5.0
Table 11: Mechanical and thermal properties of a typical tungsten alloy used for radiation shieldingapplications.
5.3 Equivalent doseIn order to assess the tungsten shielding dimensions, and especially the thickness, a number offactors must be taken into consideration:
� the nature of the ionizing radiation
� the strength of the source, which drives the intensity of the 2.185 MeV escaping γ-rays andthus the required attenuation to suppress this background
34

� the level of exposure of the area surrounding the source to ionizing radiations, with parameterssuch as time and distance from the source to evaluate the impact of escaping radiations onhuman bodies
The only ionizing radiation which eventually escapes from the source are γ-rays. As a first estimate,the equivalent dose (in Sievert) induced by a radioactive point source at the center of the shieldingis computed. The absorbed dose (Gy/s) is given by:
D(J/g/s) = A[Bq]× 1
4πd2[cm2]× µ
ρ[g/cm2]en × E[J] (22)
where d is the source-person distance in cm, A is the source γ activity (in Bq) at the surface of thebiological protection (i.e. after shielding), µ/ρ is the mass absorption coefficient (the fraction ofenergy of the gamma rays transferred to the medium, in cm2/g), and E the energy of the escapingγ-ray (in Joule). Usually, µ/ρ ∼ 25 g/cm2 for γ-ray energies between 1 and 3 MeV. Furthermore itis almost medium independent, as explained in the previous section. The equivalent dose (in Sv)is calculated by multiplying the absorbed dose by the γ radiation weighting factor, w=1. Afterplugging in the correct numerical factors in equation 22, the equivalent dose becomes:
D(mSv/h) = 4.24×A[Ci]× E[MeV]/d[m]2 (23)
For a 75 kCi 144Ce−144 Pr source the activity corresponding to the 2.185 MeV γ rays (BR=0.7%)is 525 Ci. Considering a 16-cm thick spherical tungsten alloy shielding (d=18.5 g/cm3, attenuationlength of 1.26 cm at 2.185 MeV) the 2.185 MeV γ activity is reduced to 1.3× 10⁻³ Ci at the surfaceof the biological protection. According to equation 23, the absorbed dose received at 1 m from theshielding is 14 µSv/h. As a comparison, the maximum tolerable annual dose for people workingin environments with ionizing radiations is given by international regulations to be 20 mSv/y (seetable 12), corresponding to about 1730 hours/y of exposure for somebody standing 1 m away fromthe source.
Criteria IAEA dose Limitfor exposed workers
Effective dose limit for workers in category A 20 mSv/yEffective dose limit for workers in category B 6 mSv/y
Maximum effective dose allowed in any single year 50 mSv/yTotal work life (50 y) 400 mSv
Table 12: IAEA radiation dose limits for various working conditions.
A more accurate computation of the radiation dose using the GEANT4 simulation package hasbeen performed. We consider here a 75 kCi 144Ce−144 Pr source in the form of CeO2, encapsulatedin a 5-cm radius sphere with a density of 4 g/cm3. A sphere-shaped tungsten alloy shielding issimulated taking a typical composition for tungsten alloy with a density of 18.5 g/cm3 [69]. Themechanical and thermal properties of this material are summarized in table 11. The simulatedsphere is 21 cm diameter, leading to a uniform absorption thickness of 16 cm along any direction.The computed equivalent dose corresponding to the 2.185 MeV emission of 144Pr is 0.930 mSv/hat the shielding contact. For the 1.489 MeV, the equivalent dose is 0.026 mSv/h at contact. At adistance of 1 m from the shielding surface, the 2.185 MeV radiation leads to a dose of 0.028 mSv/h.It is two times higher than the dose obtained with the simple computation of equation 23. Thiscan be explained by the fact that the simulation also accounts for the degraded γ-rays that escapethe shielding material. The radiation dose associated to the 1.489 MeV line 1 m away from thebiological protection is 0.75 µSv/h. These results confirm that a tungsten alloy thickness of 16 cmis sufficient to meet the radiobiological protection requirements.Finally a computation of the equivalent dose was performed by the CEA radio protection division.The two 2.185 MeV and 1.49 MeV γ-rays have been simulated through the same shielding geometryand material, using MCNPX v 2.7.a. Other γ rays are neglected, either because of their low energyor because of their weak intensity. The source was assumed to be CeO2 with a density of 4 g/cm3
and contained in a 1-mm thick capsule made of stainless steel with the same shape and dimensionsas previously described. The equivalent dose rates are summarized in table 13. Though slightlyhigher, they are similar to our GEANT 4 computation.
35

γ rays energy (MeV) Dose rate at 1 cm (mSv/h) Dose rate at 1 m (mSv/h)2.185 1.5 4.210−2
1.49 3.910−2 <1.510−3
Table 13: CEA - SPR computations of the radiation dose 1 cm and 1 m away from the shielding.
For completeness, the influence of electromagnetic radiation produced by the deceleration of theβ-decay electrons when deflected by the atomic nuclei (Bremsstrahlung) has been studied. Themean free path of electrons in matter, δ, is taken from the Katz and Penfold formula [70]:δ(cm) = 0.412/ρEn, where ρ is the material density in g/cm3, E is the energy of the electronin MeV, and the scaling index n = 1.265 − 0.0954 ln(E). The maximum mean free path of elec-trons of 144Ce and 144Pr is given in table 14 for stainless steel, cerium oxide, and a tungstenalloy. Bremsstrahlung spectra of 144Ce and 144Pr is computed using MCNPX. The obtained X-rayspectra are converted into dose rates using the software MERCURIAD v1.04. Details of the com-putation can be found in [74]. The dose rate induced by Bremsstrahlung of β electrons is less than1 µSv/h at 1 cm and can thus be neglected in comparison with the dose rate directly induced bythe 2.185 MeV γ-ray of the 144Pr decay.
β energy (MeV) Stainless Steel CeO2 Tungsten alloy0.32 1.110−2 cm 4.2710−3 cm 2.210−2 cm3.0 1.910−1 cm 8.010−2 cm 3.710−1 cm
Table 14: CEA - SPR computations of the mean free path of electrons in stainless steel, ceriumoxide, and a tungsten alloy.
Shield Thickness (d=18.5 g/cm3)
Ab
so
rbe
d D
os
e a
t 1
m (
µS
v/h
)
Absorbed Dose (75 kCi Ce source, W−alloy spherical shield)
15 20 2510
−2
10−1
100
101
102
103
(a)
Exposure Hours
Inte
gra
ted
Ab
so
rbe
d D
os
e a
t 1
m (
mS
v)
Integrated Absorbed Dose (75 kCi Ce, 16 cm W−alloy spherical shield)
101
102
100
101
(b)
Figure 19: Left panel: absorbed dose received at 1 m from a spherical tungsten alloy shielding asa function of thickness. The gray area represent the range of thicknesses being considered for theCeLAND experiment, with a cylinder having a 16 cm minimum thickness. The maximum dose is42 µSv/h. Right panel: Integrated absorbed dose for a 16-cm tungsten alloy shielding as a functionof time, when standing next to the source (initial activity of 75 kCi). Category A and B equivalentdose limits are represented by the light and dark gray bands, respectively. A worker could standmore than 20 hours at 1 meter from the shielding before receiving an integrated dose of 1 mSv,assuming an activity of 75 kCi.
36

5.4 Insertion of the 144Ce source inside the biological shieldingThe 144Ce source will be manipulated and inserted into the central shielding in a hot cell at theMayak reprocessing plant. The hot cell has a 1.1 m high and 1.0 m wide single door and can containup to 4 tons of material. The crane available in the area is certified to lift a maximum weight of5 tons. The tungsten alloy shielding will be cleaned at Mayak to avoid surface contamination ofthe shielding after being manipulated in the hot cell. The 144Ce source must be inserted in theshielding downwards from the top.
5.5 High-Z shielding (for the deployment next to KamLAND)The characteristic signature of an inverse beta decay antineutrino interaction is the time andspace coincidence of a prompt energy deposition (e+ energy deposition) followed by a delayedenergy deposition (neutron capture on hydrogen). The main background to the antineutrino signalare accidental coincidences between prompt-like (E>0.9 MeV) and delayed-like energy depositions(E>2.0 MeV) occurring within a time window taken as three neutron capture lifetimes on hydrogen(equivalent to about ∆T =772 µs), and within a volume of 10 m3. If the prompt and delayedenergy deposition positions can be reconstructed, an additional background rejection of a factor∆V =1/100 can be achieved.A dangerous source of accidental coincidences comes from the emission of energetic 2.185 MeVγ-rays from the decay of the 1− excited state of 144Nd (Table 4). 2.185 MeV γ-rays can easilymimic the signal neutron capture on hydrogen at 2.2 MeV and the signal of a positron above 0.9MeV, generating an accidental coincidence signal. The rate of accidental coincidences must thenstay small enough compared to the expected antineutrino interaction rate within the KamLANDdetector (16000/y for phase 1). Hence, the reduction of the rate Rγ of escaping γ-rays is a keyparameter in computing the shielding dimensions. To first order, this requirement translates into:R2γ,phase1 ×∆t×∆V� 16000/y leading to Rγ,phase1 ≤ 5 Bq . Starting from an initial rate of 19.4
TBq for the 2.185 MeV γ-ray line (0.7% of 2.77 PBq), this requirement on the reduction of Rγimposes an attenuation of ∼ 10−12 .
5.5.1 γ-ray absorption specification
In the first phase of the experiment, the 144Ce−144 Pr emitter will be placed as close as possiblefrom the steel tank within the circulating water shielding. The minimum foreseen distance from thecenter of the KamLAND detector is 9.6 m. The shielding thickness is computed taking into accountadditional attenuation provided by different media between the source and the liquid scintillatorvolume: water plus a 1-cm thick stainless steel vessel (λ = 4.15 cm) plus 2.5 m of mineral oil (λ =26.9 cm). As a conservative assumption, the self-absorption of γ-rays within the CeO2 capsule andthe solid angle effect are not taken into account. Achieving a 10−12 attenuation in this geometricconfiguration finally leads to a 16-cm thick tungsten alloy (18.5 g/cm3).
5.5.2 Radiopurity specification
An important remaining source of background could be the tungsten shielding itself, especiallyin the second phase of the experiment where the shielding will be in contact with the liquidscintillator. The activity induced by impurities inside the tungsten shielding are here required to beless than ∼1/10 of the activity of the 2.185 MeV γs able to escape the shielding without interaction.This requirement ensures the absence of a significant background contribution from the tungstenshielding. For the deployment in the outer veto or in a room close to the detector, conservativeestimates can be computed as described in the previous section, by imposing a maximum tolerablebackground rate of Rγ,phase1 ≤ 0.5 Bq. GEANT4 simulations have been run in the CeLAND phase1 deployment scenario, with a 16 cm thick spherical shape tungsten alloy shielding placed 9.6 maway form the KamLAND detector center. Taking into account the most dangerous γ-ray linesemitted in the different primordial decay chains or nuclei, the maximum tolerable activities in232Th, 238U, 40K, 60Co are the following:
� 232Th (primordial, 232Th-chain) : ∼0.3 Bq/kg
� 238U (primordial, 238U-chain) : ∼3 Bq/kg
� 40K (primordial) : ∼120 Bq/kg
37

� 60Co (anthropogenic) : ∼20 Bq/kg
Several tungsten alloy samples from different suppliers have been analyzed, with activities at thelevel of ten to hundreds of mBq/kg for the above-mentioned radioisotopes. They are hence allsuitable for the CeLAND phase 1 deployment scenario of the cerium antineutrino generator in theKamLAND Outer detector.
5.5.3 Preliminary mechanical design
The shielding is made up of a hollow tungsten alloy cylinder with two cavities, each with differentinner diameter and located at different depths: the source fits in the lower cavity at the centerof the shielding and the upper cavity supports the plug to avoid direct radioactive leaks. Thetungsten alloy shielding is 16 cm thick at minimum and weighs about 1.5 tons. It is representedin figure 20.
Figure 20: Sketch of the tungsten alloy shielding to be used for radiological protection for thedeployment in the outer detector water (OD) or farther from the target liquid scintillator.
The final choice on the tungsten alloy material will mostly be driven by radiopurity requirements(see previous section). The upper cavity in the shielding is closed by a tungsten alloy lid. Thetightness of the seal is achieved by a Helicoflex O-ring metallic gasket with good resistance toradiations and high temperatures. Captive screws hold the cap in order to ease its mounting inthe hot cell. The final tightening of the screws will require a high torque and can be done outsidethe hot cell (the biological protection is ensured as soon as the cap is plugged on the top of theshielding). A 1 mm play between the outer capsule and the inner wall of the shielding lower cavity,as well as a 2 mm chamfer, should ease the insertion of the source in the shielding. Likewise, thereis a 5/10 mm play between the plug and the inner wall of the shielding upper cavity. The loadingof the capsule in the shielding should be done downwards from the top. 2 x 6 threaded M16 holeson the top and bottom shielding sides allow several handling operations: translation and rotation
38

in the hot cell (with a dedicated tool), insertion of the shielding in the transportation container,in the calorimeter, handling above the manhole at KamLAND or inside the detector. They alsoallow holding the shielding during measurements in the KamLAND detector or can be used to fixsupports to protect the bottom surface of the shielding. These threaded holes will be protectedby screws fitted with metallic gaskets to avoid trapping of any dust or any kind of radioactiveparticles. A preliminary technical drawing of the CeLAND source shielding is given in figure 21.
Vérif.Dess.Réf. approb. ou modif.DateIndSt
SeparatorSéparateur
0.000,00Supplier
Ss-Traitant
/ Mass :Masse/Scale :Echelle/Quantity:QuantitéPlan dessiné avec le système C.A.O. CATIA V5. Ne peut être modifié que par le même système.
CATIA V5 C.A.D. drawing. Do not make manual revisions or alterations.
Réf. C.A.O. :
Ref. ext. : Contrat :/Sheet :PlancheIl n'est permis d'utiliser ce dessin qu'avec licence spéciale ou autorisation expresse (loi du 11 mars 1957)
This drawing may not be used without special license
A0. 1189 x 841Dessin exécuté selon les Normes I.S.O.
Drawing created with I.S.O. norms.
16
15
14
13
12
11
10
9
8
7
6
5
4
3
2
1
16
15
14
13
12
11
10
9
8
7
6
5
4
3
2
1
G F E D CJKLMNOP
P O N M L K J I H G F E D C B A
/Sub Assy.:Ss-Ens.
.ScolaOrigineAS
PROVISOIRE.1:11
31000001PC_General_assembly.CATDrawing
CeLANDshielding
Biological shielding 75kCiGeneral assembly
1/1
PC71 3139 DM- 3100 000
10-01-13
.
. .
P B 30-08-13 71 3139 ZM- 3100 001 13 Scola .P C 21-11-13 71 3139 ZM- 3100 002 13 Scola .. . . . . .
.
Le 21/11/2013 à 16:44:33478
3.3
158154
146.6
140
160( )
160
()
481
160
()
2 15
140
(24x) H M12 - 50
(2x 6x) H M16 - Handling interface
Helicoflex métal oring
A Détail AEchelle : 10:1
Figure 21: Preliminary drawing of the tungsten alloy shielding to be used for radiological protectionas well as for the first phase of CeLAND, e.g. the deployment in the outer detector water (OD).
6 Source and shielding logisticsVarious heavy elements needed for the experiment will be shipped between the different manufac-turing places to Japan. Here is a summary of the major heavy shipments.
6.1 High-Z shielding transportationTransport involving non radioactive material:• shipment from Saclay to Mayak of the tungsten radiological protection ;• shipment from Saclay to Kamioka of the equipment to measure its activity prior to deploymentand of the tools used to manipulate the source ;• if the shielding is not manufactured in France, calibration of the calorimeter will impose a transitthrough France.
6.2 144Ce−144 Pr antineutrino generator transportationThe most sensitive part is the transportation of the radioactive antineutrino generator betweenMayak and Japan. Transport of radioactive materials must follow requirements stated in the refer-ence document : Regulations for the Safe Transport of Radioactive Material (2009 Edition) issuedby IAEA [IAEA09]. This document describe the type, characteristics and performance of contain-ers used for these transports, the different forms of the radioactive material and the radiation level
39

and temperature outside the transport container.
In our case the parcel (or consignment) which will be transported is composed of the radioactiveCerium oxide pressed to reach a density around 4 g/cm3 and placed inside a double sealed stainlesssteel container ; this object will be inserted in the tungsten shielding at Mayak and will be tightlyclosed by a top part in tungsten. Each capsule will be tested for leaks (Helium leak test) andaccording to ISO 9978-92 certification procedure (Radiation protection - Sealed radioactive sources- Leakage test methods).
6.2.1 Transport of radioactive materials
The physical characteristics of the 144Ce−144 Pr and its encapsulation leads to the classificationof the source as a Special form of radioactive material according to the IAEA terminology.
6.2.2 Transport with a B(U) type container
During the transport the 144Ce−144 Pr source contained in its biological shielding will be insertedand secured in an IAEA approved transport container of type B(U) whose characteristics arebeing defined. The plan is to use an existing transport container. As mentioned above the limiton radiation level will be satisfied thanks to the important tungsten shielding:• 2 mSv/h in contact with the packaging (or the vehicle);• 0.1 mSv/h at two meters from the vehicle.
These limits will be checked at each transit points. Vehicles carrying radioactive materials bydefinition are in motion; the public exposure times are very short (of the order of a few secondsto minutes) during transport. The workers involved in the handling of the container will receiveappropriate training on radiological protection. If a member of the CeLAND collaboration attendsto the transportation he/she will be classified in the category B (6 mSv/y) and therefore has noimpact on his/her health. The limit related to temperature concerns the external temperature ofthe transport container and not the temperature of the shielding itself.
The transport container of type B(U) must fulfill several requirements as explained above, butmust received an agreement from the safety authorities of the countries involved in the transport.To simplify the explanations, a US built and certified container in United Stated needs to be recti-fied if the transport goes (or transits) through Japan. For this procedure Russia and Europe havemutual agreements to accept containers certified in one of the countries. Agreements of an existingforeign container in Japan can be a long procedure (several months). The ideal case would be toreuse a container which has been already used to transport radioactive material from Russia toJapan.
Two potential transport containers have been identified :
TN TM – MTR
� Engineered by AREVA; used to transport package for irradiated MTR (Material Test Re-actor) and TRIGA (Training, Research, and Isotope production, General Atomics ) fuelelements Type B(U)F IAEA 1996
� Criticality Safety Index : CSI : 0
� Certified in Europe, Australia and USA; need a certification in Japan
� External dimensions : H = 2008 mm, D = 2080 mm , weight = 23 400 kg (max. loaded)
� Useful dimensions: Cavity height = 1080 mm; useful cavity diameter = 960 mm
40
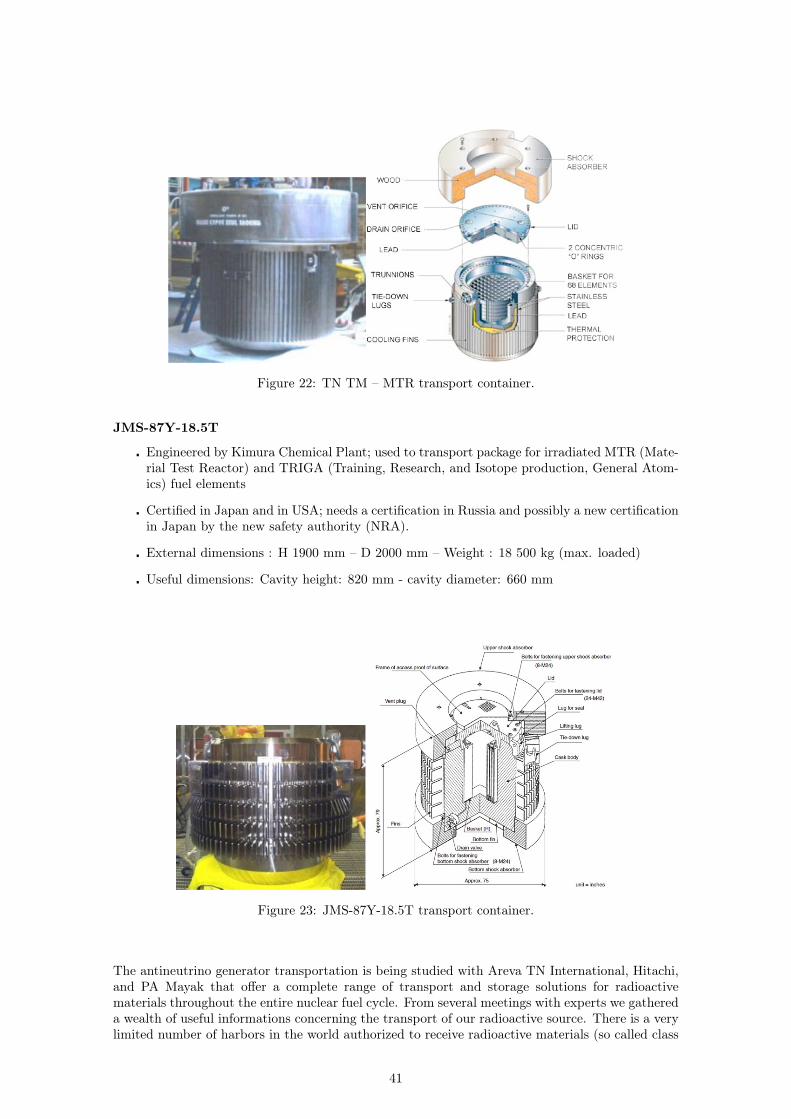
Figure 22: TN TM – MTR transport container.
JMS-87Y-18.5T
� Engineered by Kimura Chemical Plant; used to transport package for irradiated MTR (Mate-rial Test Reactor) and TRIGA (Training, Research, and Isotope production, General Atom-ics) fuel elements
� Certified in Japan and in USA; needs a certification in Russia and possibly a new certificationin Japan by the new safety authority (NRA).
� External dimensions : H 1900 mm – D 2000 mm – Weight : 18 500 kg (max. loaded)
� Useful dimensions: Cavity height: 820 mm - cavity diameter: 660 mm
Figure 23: JMS-87Y-18.5T transport container.
The antineutrino generator transportation is being studied with Areva TN International, Hitachi,and PA Mayak that offer a complete range of transport and storage solutions for radioactivematerials throughout the entire nuclear fuel cycle. From several meetings with experts we gathereda wealth of useful informations concerning the transport of our radioactive source. There is a verylimited number of harbors in the world authorized to receive radioactive materials (so called class
41

7). Until recently, only the Saint Petersburg and Mourmansk harbors were certified to receive theclass 7 radioactive materials in Russia. In particular on the east coast, on the sea of Japan, upto very recently no harbor were approved as class 7. Only Yokohama and Tokyo harbors havethe necessary certifications in Japan. Areva TNI transported several shipments of radioactivematerial towards (and from) Japan, such as fuel elements to be treated at la Hague plant andPlutonium and MoX fuel elements. Similarly they have organized the transport from Mayak towestern destinations.
Figure 24: CeLAND transportation routes, via train + boat (A), and airplane (B).
Last fall a transport of enriched uranium took place between Russia and Japan. It transited throughthe harbor of Nakhodka on the east coast of Siberia. This possibility will reduce the time (andthe cost) of the transport by a dedicated ship. IT is shown on 24. Indeed, the boat used for thistransport is a fully dedicated boat which means that the cost will include the renting of the boat,the salary of the crew, the renting of the container and, last but not least, the cost of the insurance.
Air transport IAEA regulations allow transport of radioactive material by air, but, in this casethere is a limit in the activity of the material inside a single container. For the case of 144Ce thelimit is 600 TBq (16.2 kCi), but for 51Cr it is 90 PBq and for 60Co 1200 TBq. Nevertheless thesame regulation does not limit the number of container in a single plane, but each radioactivesource has to be enclosed in a specific container. Thus we studied the possibility to divide our75kCi 144Ce source into 5 sources of 15 kCi. Even if the individual activity is reduced, we stillneed an important shielding to be able to manipulate these sources ; the estimated mass cannot beless than 500 kg. Existing transport containers dedicated for air shipments are used to transportalpha or beta sources with no penetrating radiations. In our case, an extra biological shielding intungsten is mandatory to be below the radiation limit, but the maximum load for the certificationis largely exceeded; therefore they are not suitable for our purpose.
Special arrangements
Having in mind the constraints on transportation following the usual standard IAEA regulations,it is wise to look if the regime of ᅵ Special arrangements ᅵ as described in paragraph 310 ismore appropriate for our case. It seems useful to quote the text describing this regime:ᅵ 310. Consignments for which conformity with the other provisions of these Regulations isimpracticable shall not be transported except under special arrangement. Provided the competentauthority is satisfied that conformity with the other provisions of these Regulations is impracticableand that the requisite standards of safety established by these Regulations have been demonstrated
42

through means alternative to the other provisions, the competent authority may approve specialarrangement transport operations for single or a planned series of multiple consignments. Theoverall level of safety in transport shall be at least equivalent to that which would be provided ifall the applicable requirements had been met. For consignments of this type, multilateral approvalshall be required. ᅵ
6.2.3 Transport with a C type container
The IAEA and the United States Department of Energy (DOE) fabricated a series of Czech-designSKODa VPVr/M transport overpacks, developed specifically for spent fuel storage and transportinside the standard twenty-foot ISO-containers. Sixteen such SKODa VPVr/M overpacks wereproduced and subsequently certified first in the Czech republic and then in Russia, where they arenow labelled as TUK145/C. This container has now performed spent fuel deliveries by automobile,rail, river and sea transport. Moreover it is the first world’s first Type C package certified forthe air transport of SNF in compliance with the classification given in IAEA TS-R-1 Regulations,without any restriction on the ANG activity.
TUK-145/C
� Engineered by Skoda in Czech Republic; used to transport package for LEU SNF.
� Certified in Russia for SNF; needs an extension of certification in Russia for containingcerium, only (not considered to be an obstacle) and an extension of the certification in Japanby the new safety authority (NRA).
� External dimensions : H 2155 mm – D 1500 mm – Weight : up to 35 000 kg (max. loaded)
� Useful dimensions: Cavity height: 820 mm - cavity diameter: 660 mm
Figure 25: TUK145/C transport container.
The TUK145/C cask is of a unique construction that allows it to be loaded and unloaded frombelow and from the top. The cask body is made of cast iron. The cask inner walls are platedwith aluminum. Leak-tight containment is provided by the metallic Helicoflex seals. The innercavity of the cask is backfilled with helium. The standard basket would have to be replaced by a
43

custom basket to fit the cerium antineutrino generator with a reduced shielding not exceeding 450kg. This corresponds to a thickness of approx. 8.5 cm, leading to a dose rate at 1 m of 10 mSv/h.The basket could be designed by the Sosny Science and Production Firm and fabricated by theOZNO plant in Ozersk, russia.
The TUK145/C container could be used for the transportation of a 75 kCi 144Ce ANG witha reduced, 8.5 cm thick W-alloy shielding. It would be loaded on a truck at PA Mayak, and betransferred to Yekaterinburg airport and loaded into an aircraft (AN-124-100), including the truckthat would finally drive from the Japanese airport to the Kamioka mine for unloading. This wouldnecessitate a special operation at the Kamioka site to unload the 144Ce ANG with its reducedshielding from the TUK-145/C and to immediately load it into the additional shielding cylinder,8 cm thick as well in order to reach the overall 16 cm thickness.
7 Activity measurements
7.1 RequirementsThe source activity is a key normalization parameter, directly linked to the prediction of thenumber of expected events and to the sensitivity of the experiment, particularly at high ∆m2. Sothe minimal uncertainty on activity is desirable. To ensure the competitiveness of the experiment,a maximum of 2 % uncertainty on activity is considered, 1 % being the goal.The main technique considered to measure the activity is the calorimetry, which is a global tech-nique relatively easy to interpret and calibrate (compared to radiation measurement). Accordingto nuclear database, the specific activity of the 144Ce−144 Pr couple is 7.991± 0.044 W/kCi, so a0.56 % systematic uncertainty will in any case limit the calorimetry sensitivity. In any case, thesource would be inside its tungsten biological protection to contain gammas, so the calorimetermust be able to support about 1.5 ton and a cylinder of roughly 60 cm in height and diameter.Other techniques rely on radiation measurement (β or γ) on a sample of the source, with extrap-olation to the source by weighing.
7.2 Calorimetry7.2.1 Principle
The proposed calorimetric measurement of the source is based on the fact that emitted β, γ , Xand Auger radiation will heat up the source and the tungsten shield leading to a well-defined powerrate. The temperature increase of the object is described by:
dT
dt=
P
C− T− Text
τ(24)
where T is the temperature at a given time t (in K), P the power released by the source (in W),C the heat capacity (in J.K−1) of the system measured and τ (in s) describes the thermal lossesof the calorimeter toward the exterior.Several different techniques can be used:
� the temperature increase (dTdt ) in a calorimeter maximally insulated from the environmentcan be measured (such as in Gallex [66]), which implies negligible heat losses during thewhole measurement and to calibrate the heat capacity;
� the equilibrium temperature (when dTdt = 0) can be measured and compared to a calibration
phase;
� the heat can be transferred to another system and then measured, typically to a fluid suchas water.
τ can be minimized down to be negligible, and C and τ (if any remaining) can be evaluatedprecisely in a preliminary calibration phase of the system with known heat sources.
7.2.2 Data
� 144Ce half life: 284.91 days
� 144Pr half life: 17.28 min
44

� Unitary power: 7.991± 0.044 W/kCi
� Density of tungsten alloy: 18.5 g/cm3
� Heat capacity of tungsten: 130 J/kg
� Thermal conductivity of tungsten: approx. 70 W.m−1.K−1
The thermal power delivered by the source is therefore between 600 and 800 W, for respectively75 and 100 kCi.
7.2.3 Requirements
1. Uncertainty on thermal power below 1 % (as long as reasonably achievable).
2. Measurement time below 3 days, and preferentially at the hour scale.
3. Capsule temperature below 400°C.
4. Reproducibility of the measurement, which implies a careful and limited instrumentation ofthe shielding to ensure reproducibility before and after hot cell manipulations and trans-portation.
7.2.4 Current Design
The current design (see figure 26) relies on the measurement of heat flow transferred to water,by measuring the water massive flow rate and the temperature of the water before and after itscirculation at the contact with the shielding. The flow rate can be very precisely measured withCoriolis flow meter, which directly gives the massive flow rate with uncertainty at the 0.1 % levelor even better with dedicated calibration. The temperature measurement with thermocouple hasan uncertainty of 0.1 to 0.2 K, leading to the requirement for the inflow/outflow water temperaturedifference of 40 K. This leads to a flow rate of 4 g/s for 85 kCi.
Figure 26: Preliminary design of the calorimeter. The multi-layer radiation shield, which willtake place in the vacuum between the two tanks, is missing. The shielded source is supportedby 3 pillars, while final design will use 3 strings to hold a board supporting the shielded source.Thermocouples and the Coriolis flow meter are not shown either.
45

The source power is measured by the power evacuated by water. The source has to be insulatedat the watt level to reach 1 % of uncertainty. This can be achieved by a combination of vacuum(probably secondary), suspension of the source (probably with Kevlar strings), multi-layer radiationshield and temperature control of the external tank.This design ensures reproducibility and allows a preliminary study and calibration phase withelectric source power, while being also an absolute measurement since water heat capacity is wellknown. The time needed for the measurement will probably be dominated by the time neededto reach the target vacuum, since the shielding heating will be low and consequently thermalequilibrium reached in about 1 hour. As soon as both target vacuum and thermal equilibrium arereached, the measurement is over. Finally, the capsule temperature will be far from 400°C sincethe mean shielding surface temperature will be several tens of degrees Celsius.
7.3 Spectroscopy of samples and weighing of the sourceUnder the assumption of CeO2 uniformity (which should be ensured by the mixing of all the ceriumsolution in a single tank, after chromatography at Mayak), one can sample the CeO2 and dilute it,determine the activity of the sample by radiation spectroscopy and deduce the source activity byweighing both the source and the sample. Mass measurement can easily achieve excellent accuracy,thus the main source of uncertainty of this technique is the spectroscopy.β spectroscopy relies on the measurement of the electron spectrum emitted by the sample. Thismeasurement is typically realized with a silicon detector, but the interpretation which relies onsimulation (diffusion in sample, back scattering, efficiency. . . ), calibration and background controlcan be difficult to control at the target levelγ spectroscopy relies on the measurement of a characteristic gamma ray of the 144Ce-144Pr couple,such as the 2.185 MeV ray of the 144Pr which is intense and far from common natural background(above 40K 1.4 MeV ray but still below the 208Tl 2.6 MeV ray). This measurement is typicallyrealized with a High Purity Germanium (HPGe) detector, but the normalization which also relieson simulation (solid angle, auto absorption, efficiency. . . ), calibration and background control canalso be difficult to control at the target level.
8 144Ce−144 Pr source deployment and data taking
8.1 The KamLAND detector
The KamLAND detector is located under the peak of Ikenoyama (Ike Mountain, 36.42◦N, 137.31◦E)in the Kamioka mine, see figure 27, with a vertical rock overburden of approximately 2700 meterswater equivalent (m.w.e.).
A schematic diagram of KamLAND is shown in figure 28. KamLAND consists of an active detectorregion of ∼1 kton of ultra-pure LS contained in a 13-m-diameter spherical balloon made of 135µmthick transparent nylon/EVOH (ethylene vinyl alcohol copolymer) composite film and supportedby a network of Kevlar ropes. In addition to providing containment for the LS, the balloon protectsthe LS against the diffusion of ambient radon from the surrounding components. The LS comprisesof 80% dodecane, 20% pseudocumene (1,2,4-Trimethylbenzene) by volume, and 1.36± 0.03 g/literof the fluor PPO (2,5-Diphenyloxazole). The density of the LS is 0.780 g/cm3 at 11.5◦C.A buffer comprising of 57% isoparaffin and 43% dodecane oils by volume fills the region betweenthe balloon and the surrounding 18-m-diameter spherical stainless-steel outer vessel to shield theLS from external radiation.An array of photomultiplier tubes (PMTs), 1325 specially developed fast PMTs masked to 17-inch diameter and 554 older 20-inch diameter PMTs reused from the Kamiokande experimentare mounted on the inner surface of the outer containment vessel, providing 34% photo-cathodecoverage. A 3mm thick acrylic barrier at 16.6-m-diameter helps prevent radon emanating from thePMT glass from entering the BO. The inner detector (ID), consisting of the LS and BO regions,is surrounded by a 3.2 kton water-Cherenkov detector instrumented with 225 20-inch PMTs. Thisouter detector (OD) absorbs γ-rays and neutrons from the surrounding rock and enables taggingof cosmic-ray muons.
46

Digital Japan Web System
Sendai
Tokyo
Fukushima
Kamioka
Figure 27: Kamioka mine location.
The KamLAND front-end electronics (FEE) system is based on the Analog Transient WaveformDigitizer (ATWD) which captures PMT signals in 128 10-bit digital samples at intervals of 1.5 ns.Each ATWD captures three gain levels of a PMT signal to obtain a dynamic range from onephotoelectron (p.e.) to 1000 p.e. Each ATWD takes 27µs to read out, so two are attached toeach PMT channel to reduce dead time. The FEE system contains discriminators set at 0.15 p.e.(∼0.3mV) threshold which send a 125 ns long logic signal to the trigger electronics. The triggerelectronics counts the number of ID and OD PMTs above the discriminator threshold with asampling rate of 40MHz and initiates readout when the number of 17-inch ID PMTs above thediscriminator threshold exceeds the number corresponding to ∼0.8MeV deposited energy. Thetrigger system also issues independent readout commands when the number of OD PMTs abovethreshold exceeds a preset number.
The offline analysis takes full advantage of the information stored in the digitized PMT signals byidentifying individual PMT pulses in the waveform information that is read out. The time andcharge are computed from the individual pulses. For each PMT, the average charge correspondingto a single p.e. is determined from single-pulse waveforms observed in low occupancy events. TheID PMT timing is calibrated with light pulses from a dye laser, injected at the center of thedetector through an optical fiber. The vertices of spatially localized low-energy (<30MeV) eventsare estimated by comparing calculated time-of-flights of optical photons from the hypotheticalvertex to the measured arrival times at the PMTs in KamLAND.The reconstructed energies of events were calibrated with γ sources in past deployments: 203Hg,68Ge, 65Zn, and 60Co; and with n+ γ sources: 241Am+9Be and 210Po+13C. These were deployedat various positions along the vertical axis of the detector and occasionally off the vertical axiswithin 5.5 m from the detector center. The energy calibration is aided with studies of backgroundcontaminants 40K and 208Tl, 212Bi-212Po and 214Bi-214Po sequential decays, 12B and 12N spallationproducts, and γ’s from thermal neutron captures on 1H and 12C.The visible energy (Evis) of an event is computed from the measured light yield. Specifically,Evis is the number of detected p.e. after corrections for PMT variation, dark noise, solid angle,shadowing by suspension ropes, optical transparencies, and scattering properties in the LS. The
47

Figure 28: Schematic diagram of the KamLAND detector at the Kamioka underground laboratory,including the KamLAND-Zen balloon.
relationship between Evis and the deposited energy (Edep) of γ’s, e±’s, protons, and α’s is non-linear and modeled as a combination of Birks-quenched scintillation and Cherenkov radiation. Thescale is adjusted so that Evis is equal to Edep for the 2.225MeV γ-ray from neutron capture on1H. The combined 17-inch and 20-inch PMT energy resolution is ∼6.5%/
√Evis(MeV).
The calibration sources are also used to determine systematic deviations in position reconstruc-tion by comparison with the source’s known position. This comparison gives an average positionreconstruction uncertainty of less than 3 cm for events with energies in the range 0.28 to 6.1MeV.The KamLAND experiment started operation in March 2002 and has run continuously since then.The experiment has gone through various phases, the latest phase is a modification to the detectorwhere an additional balloon at the center of the detector is filled with a mixture of liquid scintillatorand 136Xe to study neutrinoless double beta decay.
8.1.1 Intrinsic detector backgrounds
A number of backgrounds could mask the oscillation signal from the proposed source measurement.However we demonstrate in what follows that detector background are absolutely not an issue forCeLAND. We perform a simulation including all backgrounds measured or the last 10 years inKamLAND as shown in figure 29. Our background generator takes into account:
� accidental events, usually from natural radioactivity.
� cosmogenics, 9Li and 8He.
� (α,n), an α from Polonium (prompt signal) gets captured by a carbon atom deexciting intooxygen and a neutron (delayed signal from capture).
� geoneutrinos, from U and Th inside Earth’s crust and mantle.
� reactor neutrinos, from the surrounding Japanese and Korean nuclear reactors. This back-ground will depend on the nuclear activity in Japan at the time of the experiment, but cannotcreate significant background contribution even if all reactors in Japan are running at thefull power level.
48
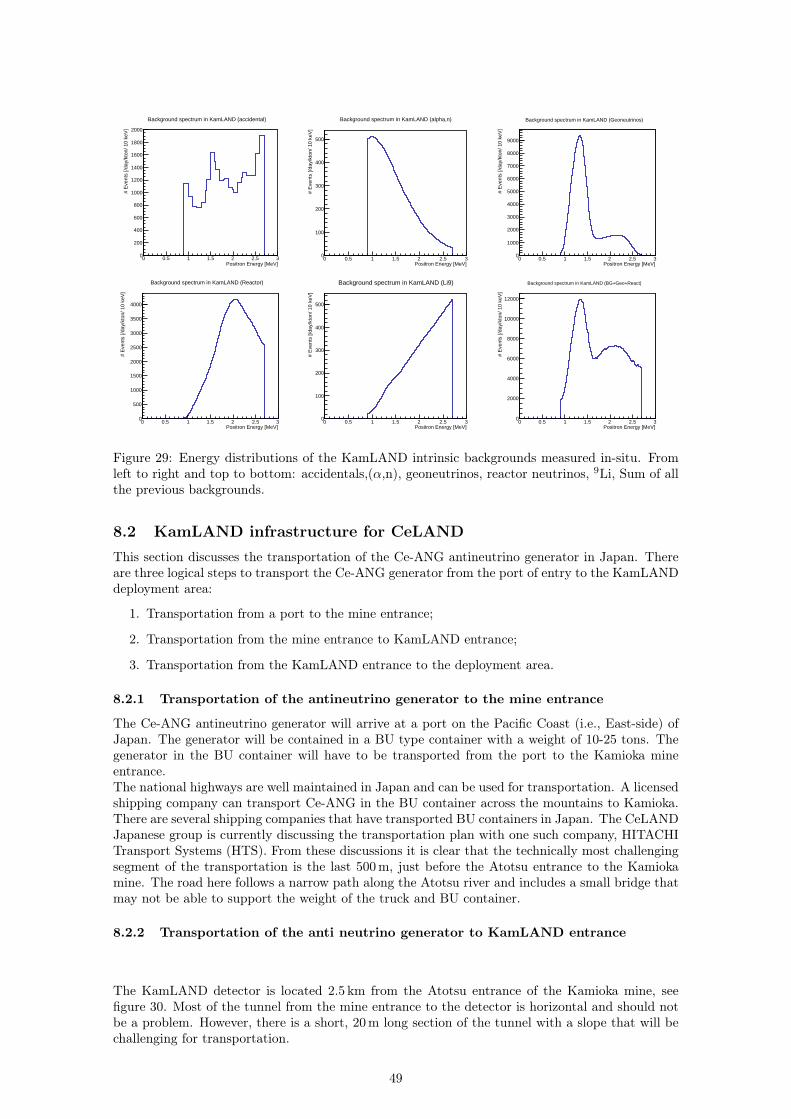
Spectrum_Accidental
Entries 180
Mean 1.881
RMS 0.523
Positron Energy [MeV]0 0.5 1 1.5 2 2.5 3
# E
vent
s [/d
ay/k
ton/
10
keV
]
0
200
400
600
800
1000
1200
1400
1600
1800
2000Spectrum_Accidental
Entries 180
Mean 1.881
RMS 0.523
Background spectrum in KamLAND (accidental)Spectrum_AlphaN
Positron Energy [MeV]0 0.5 1 1.5 2 2.5 3
# E
vent
s [/d
ay/k
ton/
10
keV
]
0
100
200
300
400
500
Spectrum_AlphaN
Background spectrum in KamLAND (alpha,n)Spectrum_Geo
Entries 180
Mean 1.497
RMS 0.3781
Positron Energy [MeV]0 0.5 1 1.5 2 2.5 3
# E
vent
s [/d
ay/k
ton/
10
keV
]
0
1000
2000
3000
4000
5000
6000
7000
8000
9000
Spectrum_Geo
Entries 180
Mean 1.497
RMS 0.3781
Background spectrum in KamLAND (Geoneutrinos)
Spectrum_Reactor
Entries 180
Mean 2.027
RMS 0.385
Positron Energy [MeV]0 0.5 1 1.5 2 2.5 3
# E
vent
s [/d
ay/k
ton/
10
keV
]
0
500
1000
1500
2000
2500
3000
3500
4000
Spectrum_Reactor
Entries 180
Mean 2.027
RMS 0.385
Background spectrum in KamLAND (Reactor)Spectrum_Li9
Entries 180
Mean 2.087
RMS 0.4329
Positron Energy [MeV]0 0.5 1 1.5 2 2.5 3
# E
vent
s [/d
ay/k
ton/
10
keV
]
0
100
200
300
400
500
Spectrum_Li9
Entries 180
Mean 2.087
RMS 0.4329
Background spectrum in KamLAND (Li9)Spectrum_Sum
Entries 180
Mean 1.774
RMS 0.4823
Positron Energy [MeV]0 0.5 1 1.5 2 2.5 3
# E
vent
s [/d
ay/k
ton/
10
keV
]
0
2000
4000
6000
8000
10000
12000
Spectrum_Sum
Entries 180
Mean 1.774
RMS 0.4823
Background spectrum in KamLAND (BG+Geo+React)
Figure 29: Energy distributions of the KamLAND intrinsic backgrounds measured in-situ. Fromleft to right and top to bottom: accidentals,(α,n), geoneutrinos, reactor neutrinos, 9Li, Sum of allthe previous backgrounds.
8.2 KamLAND infrastructure for CeLANDThis section discusses the transportation of the Ce-ANG antineutrino generator in Japan. Thereare three logical steps to transport the Ce-ANG generator from the port of entry to the KamLANDdeployment area:
1. Transportation from a port to the mine entrance;
2. Transportation from the mine entrance to KamLAND entrance;
3. Transportation from the KamLAND entrance to the deployment area.
8.2.1 Transportation of the antineutrino generator to the mine entrance
The Ce-ANG antineutrino generator will arrive at a port on the Pacific Coast (i.e., East-side) ofJapan. The generator will be contained in a BU type container with a weight of 10-25 tons. Thegenerator in the BU container will have to be transported from the port to the Kamioka mineentrance.The national highways are well maintained in Japan and can be used for transportation. A licensedshipping company can transport Ce-ANG in the BU container across the mountains to Kamioka.There are several shipping companies that have transported BU containers in Japan. The CeLANDJapanese group is currently discussing the transportation plan with one such company, HITACHITransport Systems (HTS). From these discussions it is clear that the technically most challengingsegment of the transportation is the last 500m, just before the Atotsu entrance to the Kamiokamine. The road here follows a narrow path along the Atotsu river and includes a small bridge thatmay not be able to support the weight of the truck and BU container.
8.2.2 Transportation of the anti neutrino generator to KamLAND entrance
The KamLAND detector is located 2.5 km from the Atotsu entrance of the Kamioka mine, seefigure 30. Most of the tunnel from the mine entrance to the detector is horizontal and should notbe a problem. However, there is a short, 20m long section of the tunnel with a slope that will bechallenging for transportation.
49
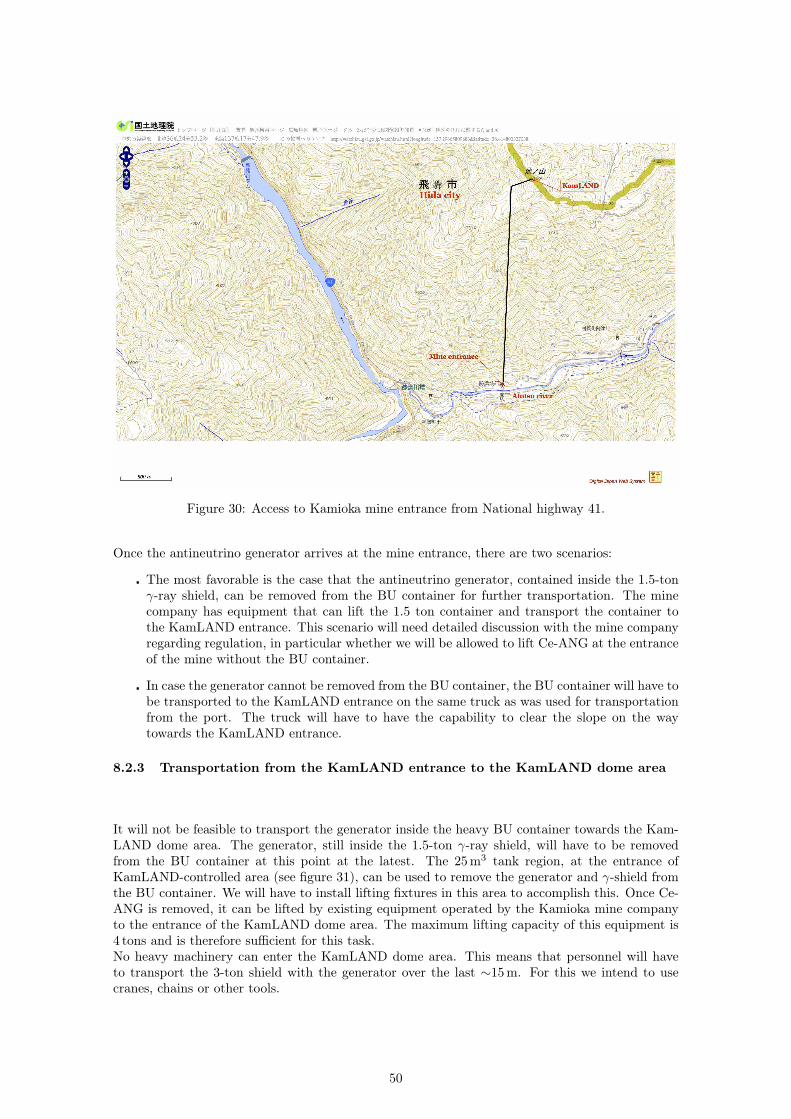
Figure 30: Access to Kamioka mine entrance from National highway 41.
Once the antineutrino generator arrives at the mine entrance, there are two scenarios:
� The most favorable is the case that the antineutrino generator, contained inside the 1.5-tonγ-ray shield, can be removed from the BU container for further transportation. The minecompany has equipment that can lift the 1.5 ton container and transport the container tothe KamLAND entrance. This scenario will need detailed discussion with the mine companyregarding regulation, in particular whether we will be allowed to lift Ce-ANG at the entranceof the mine without the BU container.
� In case the generator cannot be removed from the BU container, the BU container will have tobe transported to the KamLAND entrance on the same truck as was used for transportationfrom the port. The truck will have to have the capability to clear the slope on the waytowards the KamLAND entrance.
8.2.3 Transportation from the KamLAND entrance to the KamLAND dome area
It will not be feasible to transport the generator inside the heavy BU container towards the Kam-LAND dome area. The generator, still inside the 1.5-ton γ-ray shield, will have to be removedfrom the BU container at this point at the latest. The 25m3 tank region, at the entrance ofKamLAND-controlled area (see figure 31), can be used to remove the generator and γ-shield fromthe BU container. We will have to install lifting fixtures in this area to accomplish this. Once Ce-ANG is removed, it can be lifted by existing equipment operated by the Kamioka mine companyto the entrance of the KamLAND dome area. The maximum lifting capacity of this equipment is4 tons and is therefore sufficient for this task.No heavy machinery can enter the KamLAND dome area. This means that personnel will haveto transport the 3-ton shield with the generator over the last ∼15m. For this we intend to usecranes, chains or other tools.
50

Xe facility roomOD hatch
Cart rail crossingSlope
Mine entrance, 2 km
Slope DownUp
Super Kamiokande25 m3 tank area
KamLAND dome entrance
KamLAND dome area
Figure 31: KamLAND area
8.3 Deployment into the outer detector (water veto) and data takingThe existing water Cherenkov detector, the so-called KamLAND OD, provides a straightforwardlocation for the first phase of source deployment.
Source/detector propertiesSource initial activity 75-100 kCi
Source location Water vetoSource-center distance 9.3 mFiducial volume radius between 6.0 and 6.5 m
Interactions after 6 months 8930Shielding composition Tungsten alloy, d=18.5 g/cm3
Shielding dimensions 51 cm height, 54 cm diameter cylinder - TBCShielding mass 1.5 tons
Table 15: CeLAND Phase I deployment data
8.3.1 Detector issues and source deployment
The recirculating water provides a thermal bath for the hot source. Buffer oil provides a freeshielding of more than 2.5 m with a density of 0.75. Finally spatial constraints for source locationare easier to handle with respect to the detector center. In addition, the placement of the sourcein the OD avoids complicated issues of cleanliness and W-shielding radiopurity. Nevertheless, a
51

Figure 32: Sketch of the 3 different locations under consideration.
dedicated infrastructure for the transport and lifting of source on the KamLAND detector upperplatform has to be designed and realized. In order to prevent the unlikely scenario of a radioactivematerial contamination in the detector, the source and its biological shielding have to be isolatedfrom the OD. It is thus planned to put it inside a “sock” as sketched in figure 33. This sock, mostlikely made of stainless steel, will act as an additional shielding for the source intrinsic γ’s and willbe filled with water or any other liquid that will act as a temperature and neutron flux moderator.
8.3.2 Signal and backgrounds
Assuming a moderator thickness of 10 cm, the source will be located at about 9.3 m from thedetector center, separated from the active liquid scintillator volume by at least 2.8 m. CeLANDdata are given in Table 15. In the case of no-oscillation we estimate that 14650 neutrino events inone year are expected within the detector fiducial volume (taken as R<6.5 m inside the ballooncontaining the liquid scintillator). The expected number of interactions is given in Table 15.
The energy and distance traveled determine the oscillation probability of the νe flux. Using theGEANT4 KamLAND Monte-Carlo simulation we simulated 10 million events. However resultsthat follows are renormalized to 20000 to match the expectation for a one year run with a 75 kCisource located 9.3 m away from the detector center.
Figure 35 and shows the effect of νe → νs oscillation as a function of energy and distance from thesource. It is displayed as a function of R/E in figure 39. It also illustrates the fractional oscillationeffect normalized to the expected, unoscillated event rate. In what follows, to be conservative,signal is being considered within a radius of 6 m with respect to the detector center to limit the
52

Figure 33: Ce-ANG is contained inside a stainless steel enclosure (“sock”) and suspended into theOuter Detector.
contribution of the accidental background. This fiducial cut could probably be relaxed to use thewhole liquid scintillator contained in the balloon. As an illustration we considered, as a baseline,the following neutrino oscillation parameters: ∆m2
14 = 2 eV2, sin2(2 θ14) = 0.1 .
Months 3 6 9 12 18 24 30 36 48R<6 m 4950 8930 12110 14650 18330 20710 22170 23160 24180R<6.5 m 6425 11560 15680 18970 23740 26800 28710 29970 31330
Table 16: Expected νe interactions inside KamLAND with a 75 kCi 144Ce antineutrino generatorat 9.3 m from the detector center as a function of the exposure for 2 definitions of the fiducialvolume, R<6 m (current KamLAND analysis) and R<6.5 m (extension of the fiducial volume tothe KamLAND balloon surface).
8.3.3 Expected sensitivity
This section illustrate the expected sensitivity of the CeLAND experiment for an antineutrinogenerator deployed at 9.3 m from the target detector center.
8.4 Alternative deployment into the Xenon Room and data takingGiven the technical issues raised by a deployment in the OD, another option has been studied: thepossibility of placing the source outside the detector volume. Two locations are being considered:the Xenon room and the Control room as shown infigure 32. We will focus on the Xenon room whichis currently being used to store and purify the Xenon used for the KamLAND-Zen experiment.
53

Entrance
There are three hatches
These two can be used.
Figure 34: KamLAND top platform and OD hatch to be used for the source insertion inside theOD.
(a)
VertexDet_REntries 1e+07
Mean 4927
RMS 1234
Radius [mm]0 1000 2000 3000 4000 5000 6000 7000 8000
# E
vent
s [/
500
mm
]
0
500
1000
1500
2000
2500
3000
3500
4000
4500
VertexDet_REntries 1e+07
Mean 4927
RMS 1234
x 20
Non-oscillation
)2 = 2 eV2m∆) = 0.1, 14θ(22Oscillation (sin
Ce-Pr ANG @9.6m144
(b)
Figure 35: Left panel: Simulation of signal events in the non-oscillation case, for a source locatedat Y ∼ 6.8 m and Z ∼ 6.8 m (here, 9.3 m away from the detector center). Right panel: Radialdistribution of the signal (blue without oscillation, red with oscillation) and background events(green). Backgrounds are enhanced by a factor 20 to be visible on the plot. The origin of theradius is taken at the center of the detector.
8.4.1 Detector issues and source deployment
An alternative option for the deployment of Ce-ANG is the xenon facility room (Xe-LS room)that is used for the KamLAND-Zen phase of the experiment. There are significant challenges hereas the area is completely filled with equipment to process the xenon and load it into the liquidscintillator. In this case, Ce-ANG would have to be lifted through a narrow corridor (600mmwidth) to the back of the area, see figure 43. An additional 80mm of tungsten shielding would benecessary to allow people to occupy the area without making it into a controlled radiation area.
The most optimal spots in the Xenon room and the Control room are respectively located 12 mand 13 m from the detector center. Given the relative easiness of integration in both cases, theshorter baseline of the Xenon room is advantageous. In addition we are considering the optionof performing the calorimetric activity measurement in the Xenon room as well; this would allowstart of the data taking while the source is still in the calorimeter, therefore increasing the numberof detected neutrinos.
54

EnDepositEntries 1e+07
Mean 1.769
RMS 0.2829
Positron Energy [MeV]0 0.5 1 1.5 2 2.5 3
# E
vent
s [/
10
keV
]
0
1000
2000
3000
4000
5000
6000
EnDepositEntries 1e+07
Mean 1.769
RMS 0.2829
x 20
Energy [MeV]0 0.5 1 1.5 2 2.5 3
Eve
nts/
(0.2
5 M
ev)
0
5
10
15
20
25
Non-oscillation)2 = 2 eV2m∆) = 0.1, 14θ(22Oscillation (sin
20×Summed Backgrounds ,n)αAccidentals, Li-9 and (
Geoneutrinos
Reactor neutrinos
Ce-Pr ANG @9.6m144
(a)
VertexSource_R
Entries 1e+07
Mean 8625
RMS 2928
Radius [mm]0 2000 4000 6000 8000 10000 12000 14000 16000 18000 20000
# E
vent
s [/
500
mm
]
0
200
400
600
800
1000
1200
VertexSource_R
Entries 1e+07
Mean 8625
RMS 2928
x 20
Ce-Pr ANG @9.6m144
Non-oscillation
)2 = 2 eV2m∆) = 0.1, 14θ(22Oscillation (sin
(b)
Figure 36: Left panel: Energy distribution of the signal in case of non-oscillation (blue) and oscilla-tion (red) and the background (green, enhanced by a factor 20). Various background componentsare stacked in the inset. Right panel: Radial distribution of the signal and background with thesame color codes. Only the sum of all backgrounds is represented, dominated by the geoneutrinos.The origin of the radius is taken at the center of the source, 9.3 m away from the detector center.
Radius [mm]0 2000 4000 6000 8000 10000 12000 14000 16000 18000 20000
# E
vent
s (a
rbitr
ary)
[/ 5
00 m
m]
0
1000
2000
3000
4000
5000
6000
7000
8000
9000
VertexSource_R_Norm
Entries 399Mean 9605RMS 3703
x 20
Ce-Pr ANG @9.6m144
(a)
Radius [mm]0 2000 4000 6000 8000 10000 12000 14000 16000 18000 20000
# E
vent
s (a
rbitr
ary)
[/ 5
00 m
m]
8000
8200
8400
8600
8800
9000
9200
VertexSource_R_Norm
Entries 399Mean 9605RMS 3703
x 20
Ce-Pr ANG @9.6m144
(b)
Figure 37: Left panel: normalized radial distribution of the signal and background in case ofnon-oscillation (blue) and oscillation (red) and the background (green, enhanced by a factor 20).Each bin content at equidistance to the source is divided by the total scintillator volume at thecorresponding distance. Right panel: zoom on the radial normalized distributions. Oscillationparameters are ∆m2
14 = 2 eV2, sin2(2 θ14) = 0.1 in the 3 active + 1 sterile neutrino hypothesis.
8.4.2 Signal and backgrounds and sensitivity
Even though the signal quality is lowered by the increase of baseline at these two locations, itwould allow CeLAND to basically become a background-free experiment. Indeed, at 12 m, thegamma and neutron activities of the source are no longer an issue. Besides, if needed, it is mucheasier to put additional shielding in the Xenon room than in the OD. The sensitivity is shown infigure 44.
8.5 Running in parallel with KamLAND-ZenThe KamLAND-Zen experiment, dedicated to the search of the rare neutrinoless double betadecay process (0ν2β) with 136Xe, has been installed in the center of the KamLAND LS balloonin 2011[71]. It consists of a 3.08 m nylon-based transparent balloon (IB) filled with 13 tons ofXe-loaded liquid scintillator as shown in figure 28.
55

11.2
1.41.7
1.92.1
2.3
35
79
1113
15
0
20
40
60
80
100
Evis
(MeV)
No Oscillation signal
R (m)
N in
[10
cm
R,
100
ke
V] b
in
11.2
1.41.7
1.92.1
2.3
35
79
1113
15
0
20
40
60
80
100
Evis
(MeV)
Oscillation signal for ∆ m2 = 1.00 eV
2 and sin
2(2θ) = 0.16
R (m)
N in [10
cm
R, 10
0keV
] bin
11.2
1.41.7
1.92.1
2.3
35
79
1113
15
0
20
40
60
80
100
Evis
(MeV)
Oscillation signal for ∆ m2 = 2.51 eV
2 and sin
2(2θ) = 0.16
R (m)
N in [10cm
R, 10
0keV
] bin
11.2
1.41.7
1.92.1
2.3
35
79
1113
15
0
20
40
60
80
100
Evis
(MeV)
Oscillation signal for ∆ m2 = 6.31 eV
2 and sin
2(2θ) = 0.16
R (m)
N in [10cm
R, 10
0keV
] bin
Figure 38: Advantage of ν̄e sources providing both R and Evis oscillation patterns. IBD rate for a75 kCi 144Ce source deployed in the OD of KamLAND, in 10 cm radius bins and 100 keV bins ofvisible energy, Evis=Ee+2me. In 1.5 year, 20,000 ν̄e interact within the detector (with a fiducialvolume define as R<6m), for the no-oscillation scenario (top-left panel). The other panels showthe expected oscillation signal for ∆m2
new=1, 2.5, 6.3 eV2 and sin2(2θnew)=0.16.
A double beta decay process consists of the simultaneous emission of two electrons with (2ν2β)or without (0ν2β) neutrino emission. In the case of 136Xe, the 2ν2β energy spectrum consistsof a continuum up to the nucleus Q-value of 2.458 MeV while the 0ν2β spectrum should be aDirac delta distribution at this Q-value. Taking into account the KamLAND energy resolution of6.6%/
√E(MeV ) leads to an overlap of this 0ν2β signal with the neutron capture signal at 2.2 MeV
and the signals from several radioactive isotopes such as the 214Bi from natural Uranium. Thesebackgrounds have been thoroughly studied by the KamLAND-Zen collaboration and, in order tosuppress the antineutrino background from both prompt and delayed events of the IBD process, a1 ms coincidence cut is applied to the KamLAND-Zen data[72]. Furthermore, by loosing the timeand space criteria we will achieve a ~99.97% rejection efficiency, similar to 214Bi-Po. The remainingnumber of 2.2 MeV γ capture will be then much lower than any other in-situ backgrounds, at thelevel of a few events per year.The CeLAND experiment will not be an additional source of background for the already installedKamLAND-Zen experiment. However, the background of Zen for CeLAND might be worth lookingat.
The energy window of interest for 0ν2β in 136Xe is located between 2.2 and 3.0 MeV which is theend-point of the 144Pr antineutrino prompt spectrum (figure 45). Besides, with a 90 % CL upperlimit of 0.034 evts.ton−1.day−1, the 0ν2β background is be considered negligible for both promptand delayed events.However with an event rate of 80.2 ± 1.8(stat) ± 3.4(syst) evts.ton−1.day−1and its continuousspectrum up to the 136Xe Q-value, the 2ν2β could be considered a non-negligible background forthe detector central region. In the case of CeLAND, this region is located at the center of the layer
56
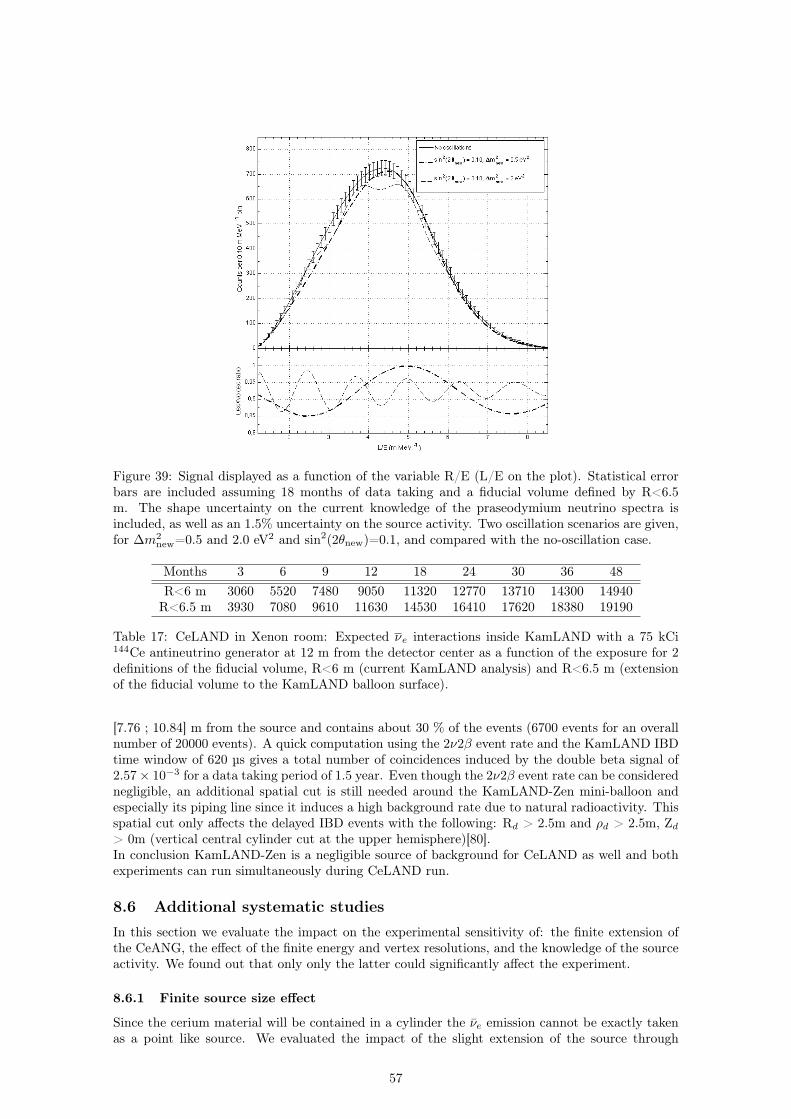
Figure 39: Signal displayed as a function of the variable R/E (L/E on the plot). Statistical errorbars are included assuming 18 months of data taking and a fiducial volume defined by R<6.5m. The shape uncertainty on the current knowledge of the praseodymium neutrino spectra isincluded, as well as an 1.5% uncertainty on the source activity. Two oscillation scenarios are given,for ∆m2
new=0.5 and 2.0 eV2 and sin2(2θnew)=0.1, and compared with the no-oscillation case.
Months 3 6 9 12 18 24 30 36 48R<6 m 3060 5520 7480 9050 11320 12770 13710 14300 14940R<6.5 m 3930 7080 9610 11630 14530 16410 17620 18380 19190
Table 17: CeLAND in Xenon room: Expected νe interactions inside KamLAND with a 75 kCi144Ce antineutrino generator at 12 m from the detector center as a function of the exposure for 2definitions of the fiducial volume, R<6 m (current KamLAND analysis) and R<6.5 m (extensionof the fiducial volume to the KamLAND balloon surface).
[7.76 ; 10.84] m from the source and contains about 30 % of the events (6700 events for an overallnumber of 20000 events). A quick computation using the 2ν2β event rate and the KamLAND IBDtime window of 620 µs gives a total number of coincidences induced by the double beta signal of2.57× 10−3 for a data taking period of 1.5 year. Even though the 2ν2β event rate can be considerednegligible, an additional spatial cut is still needed around the KamLAND-Zen mini-balloon andespecially its piping line since it induces a high background rate due to natural radioactivity. Thisspatial cut only affects the delayed IBD events with the following: Rd > 2.5m and ρd > 2.5m, Zd> 0m (vertical central cylinder cut at the upper hemisphere)[80].In conclusion KamLAND-Zen is a negligible source of background for CeLAND as well and bothexperiments can run simultaneously during CeLAND run.
8.6 Additional systematic studiesIn this section we evaluate the impact on the experimental sensitivity of: the finite extension ofthe CeANG, the effect of the finite energy and vertex resolutions, and the knowledge of the sourceactivity. We found out that only only the latter could significantly affect the experiment.
8.6.1 Finite source size effect
Since the cerium material will be contained in a cylinder the ν̄e emission cannot be exactly takenas a point like source. We evaluated the impact of the slight extension of the source through
57

144Ce−ANG (KamLAND, 1.5 y, 9.3 m from Center, 75 kCi)
sin2(2θ
new)
∆m
new
2 (
eV
2)
10−2
10−1
100
10−2
10−1
100
101
102
90% CL
95% CL
3 σ CL
Reactor ν anomaly, PRD 83 073006 (2011), 95% CL
Reactor ν anomaly, PRD 83 073006 (2011), 90% CL
144Ce−ANG (KamLAND, 1.5 y, 9.3 m from Center, Activity: 75 kCi, Shape Only)
sin2(2θ
new)
∆m
new
2 (
eV
2)
10−2
10−1
100
10−2
10−1
100
101
102
90% CL
95% CL
3 σ CL
Reactor ν anomaly, PRD 83 073006 (2011), 95% CL
Reactor ν anomaly, PRD 83 073006 (2011), 90% CL
Figure 40: Expected sensitivity to exclude the non-oscillation. We assume an initial activity of 75kCi with a source 9.3 m from the center. The fiducial volume is starting from the detector centerand extends to a radius of 6.5 m. Results are given for 1.5 year of data taking for a rate+shapeanalysis (left panel), and for a shape only analysis (right panel). The normalization uncertainty istaken at 1.5%.
144Ce−ANG (KamLAND, 1.5 y, 9.3 m from Center, 75 kCi)
sin2(2θ
new)
∆m
new
2 (
eV
2)
10−2
10−1
100
10−2
10−1
100
101
102
50 kCi
75 kCi
150 kCi
Reactor ν anomaly, PRD 83 073006 (2011), 95% CL
Reactor ν anomaly, PRD 83 073006 (2011), 90% CL
144Ce−ANG (KamLAND, 1.5 y, 9.3 m from Center, Shape Only, 95% C.L.)
sin2(2θ
new)
∆m
new
2 (
eV
2)
10−2
10−1
100
10−2
10−1
100
101
102
50 kCi
75 kCi
150 kCi
Reactor ν anomaly, PRD 83 073006 (2011), 95% CL
Reactor ν anomaly, PRD 83 073006 (2011), 90% CL
Figure 41: 95% C.L. expected sensitivity to exclude the non-oscillation, as a function of the activityof the source. We assume the antineutrino generator to be places at 9.3 m from the detector center.The fiducial volume is starting from the detector center and extends to a radius of 6.5 m. Resultsare given for 1.5 year of data taking for a rate+shape analysis (left panel), and for a shape onlyanalysis (right panel). The normalization uncertainty is taken at 1.5%.
Monte-Carlo simulations and found out that a 15 cm-scale CeANG provides a sensitivity as goodas the point like source case (that will indeed be used for all other computations). Results aredisplayed in figure 46.
8.6.2 Energy resolution
CeLAND sensitivity may depend on the energy resolution of the KamLAND detector. As statedpreviously in this proposal, the energy resolution of KamLAND detector is 6.5%/(E_vis (MeV))0.5.The impact on CeLAND sensitivity was evaluated for a 18 months long run and the CeANG located9.3 m away from the detector center. The energy resolution was varied from 2.5% to 15% as a flatvalue independent of energy. The results are shown in figure 47. The sensitivity is only marginallydegraded for ∆m2 between 1 to 10 eV2. Since KamLAND published energy resolution ranges from4.4 % to 6.5 % at 1 MeV visible energy, corresponding conservatively to the black lines on all plotssince the positrons induced from the source have an energy between 1 and 2.3 MeV. The energyresolution is therefore not an issue for the CeLAND. Exclusion contours are given at the 95% CLfor a fiducial volume taken as 0<R<6.5 m. Improvement of the energy resolution would,slightly
58

∆m
new
2 (
eV
2)
75 kCi 144
Ce (±1.5%) @ 9.3 m from center − 1.5 y, contours @ 99.730 % CL
10−1
10−1
100
101
rate + shape
shape only
Reactor ν anomaly, PRD 83 073006 (2011), 95% CL
Reactor ν anomaly, PRD 83 073006 (2011), 90% CL
∆m
new
2 (
eV
2)
75 kCi 144
Ce (±1.5%) @ 9.3 m from center − 1.5 y, contours @ 99.730 % CL
10−1
100
101
rate + shape
shape only
Reactor ν anomaly, PRD 83 073006 (2011), 95% CL
Reactor ν anomaly, PRD 83 073006 (2011), 90% CL
Figure 42: 3σ discovery potential illustrated for two examples: ∆m214 = 1 eV2, sin2(2 θ14) = 0.1
(left) and ∆m214 = 2 eV2, sin2(2 θ14) = 0.075 (right) . We assume the antineutrino generator to be
places at 9.3 m from the detector center. The fiducial volume is starting from the detector centerand extends to a radius of 6.5 m. Results are given for 1.5 year of data taking. The normalizationuncertainty is taken at 1.5%.
Months 3 6 9 12 18 24 30 36 48R<6 m 2580 4660 6320 7640 9560 10780 11560 12080 12630R<6.5 m 3320 5980 8100 9800 12250 13830 14850 15500 16180
Table 18: CeLAND in Control room: Expected νe interactions inside KamLAND with a 75 kCi144Ce antineutrino generator at 13 m from the detector center as a function of the exposure for 2definitions of the fiducial volume, R<6 m (current KamLAND analysis) and R<6.5 m (extensionof the fiducial volume to the second nylon vessel).
enhance the sensitivity of the shape only analysis for ∆m2>2 eV2.
8.6.3 Vertex resolution
KamLAND’s vertex resolution may impact sensitivity of CeLAND and a simulation study wasconducted to evaluate it. In this study, the CeANG was located 9.3 m from the detector centerfor the duration of 6 and 18 months. The vertex resolution was varied from 10 to 25 cm. Theresults are shown in figure 48. The sensitivity is marginally degraded for ∆m2 between 1 to 10eV2. KamLAND’s vertex resolution of 12 cm/(E_vis[MeV])0.5, or 8 cm to 12 cm in the CeLANDenergy range of interest, corresponds approximately to the black lines on all plots, and it is notexpected to be an issue, though reconstruction will have to be calibrated in the outermost regionof the target volume. In any case one expects no concern induced by vertex resolution effect forthe experiment. Exclusion contours are given at the 95% CL for a fiducial volume is taken as0<R<6.5 m.
8.6.4 Uncertainty on the source activity
Uncertainty in the knowledge of the CeANG activity directly impacts CeLAND’s rate measurementand more significantly the sensitivity at delta ∆m2 above a couple of eV2. The simulation studywas conducted to assess the sensitivity of CeLAND to the systematic uncertainty in the rateof the CeANG. The CeANG’s activity uncertainty was varied in the range from 0.5% to 3%.The results are shown in figure 49. As can be seen in the plot, the impact of the absolute rateuncertainty is significant especially for smaller values of mixing angle and higher values of ∆m2.The measurement of the absolute activity of the source will be performed prior to deployment inthe dedicated calorimeter described earlier. Another measurement will be performed at the end ofthe deployment run. The plan is to measure the CeANG activity with 1.5% precision or better.
59

Figure 43: Xe-LS facility room, an alternative deployment area for Ce-ANG.
9 144Ce−144 Pr source disposalAt the end of the experiment, the source activity will have decreased by a factor of 6 or so. However,all radio-protection safety rules will still apply for the removal of the source from the detector.The source disposal will be facilitated by the radioactive decay of cerium. We provide below theevolution of the state of the cerium ANG with time elapsed since its production (see also table19):
� at the end of the experiment, 2 years after the source delivery (at 85 kCi), the source willonly deliver 100 W at 15 kCi;
� after 5 years, heat power will reach the watt scale (for 1 kCi) where heat issues can beneglected, and dose rate at 1 m of the shielded source will be of the order of the natural doserate (some 0.1 µSv/h, depending on the site);
� after 20 years, the source will reach the 10 MBq scale (corresponding to some 100 kBq in γactivity) where manipulation with bare hand is conceivable and the dose rate at 1 m of thenaked source will be of the order of the natural dose rate ;
� after 25 years, the source will reach about 100 Bq/kg, which correspond to natural activityof standard matter;
� after 40 years, the source would reach the Bq scale, but long-lived impurities will probablylimit the decrease in the activity.
For disposal the antineutrino generator will return to PA Mayak in Russia. The transport costcould be reduced by keeping the source in Japan (Kamioka mine) until its activity is less than 16kCi (approx. 2 years after production) such as a regular type B(U) container could be used for airtransportation without special arrangement. This should implicitly happen after the data takingperiod and further measurement of the source activity.
60

144Ce−ANG (KamLAND, 1.5 y, 95% C.L.)
sin2(2θ
new)
∆m
new
2 (
eV
2)
10−2
10−1
100
10−2
10−1
100
101
102
8 m from center
9.3 m from center
12 m from center
16 m from center
Reactor ν anomaly, PRD 83 073006 (2011), 95% CL
Reactor ν anomaly, PRD 83 073006 (2011), 90% CL
144Ce−ANG (KamLAND, 1.5 y, Shape Only, 95% C.L.)
sin2(2θ
new)
∆m
new
2 (
eV
2)
10−2
10−1
100
10−2
10−1
100
101
102
8 m from center
9.3 m from center
12 m from center
16 m from center
Reactor ν anomaly, PRD 83 073006 (2011), 95% CL
Reactor ν anomaly, PRD 83 073006 (2011), 90% CL
Figure 44: Sensitivity to exclude non-oscillation with a 75 kCi antineutrino generator as a functionof the distance between the emitter and the detector center. The xenon/control room sites arelocated 12 m and 13 m away, respectively. The left panel shows the rate+shape sensitivity assuminga normalization uncertainty of 1.5%, whereas the right panel shows the shape only sensitivity, whichis more affected by a longer baseline. Exclusion contours are given at the 95% CL for a fiducialvolume is taken as 0<R<6.5 m.
Figure 45: (a) Energy spectrum of the KamLAND-Zen candidate events with the best-fit back-grounds, 2ν2β decays and 90 % CL upper limit on 0ν2β decays on the 0.5 < E < 4.8 MeV range.(b) Close-up on the energy window of interest for 0ν2β after known-background subtraction.
10 ConclusionThe CeLAND experiment offers to deploy a 75 kCi 144Ce−144 Pr antineutrino generator nextor inside the KamLAND detector in order to test both the reactor and the gallium anomalies.The concept of the experiment is to measure the energy and position dependence of the detectedneutrino flux, characteristic of neutrino oscillation into a 4th state. Consequently this will al-low to search for eV-scale light sterile neutrino oscillations with mass splittings of ≥0.1 eV2 andsin2(2θnew) > 0.05. With 1.5 year of data, the anomalous allowed region of mixing parameterscould be probed non ambiguously. CeLAND plans to make use of the existing KamLAND detectorwith well-measured backgrounds and systematics. Beside upgrading the KamLAND installationto safely host the source, most of the new effort involves creating, for the first time, an 75 kCi144Ce−144 Pr antineutrino and delivering it to the detector, where it could be placed in a firstphase outside the detector, 9.3 m from the center (this phase is the main purpose of our currentproposal), and possibly later inside the target liquid scintillator, but only after the KamLAND-Zen0νββ run is complete and if a hint of oscillation would be discovered during the first phase. Thecost-scale of the whole experiment is estimated to be less than 5 M$, and data taking could startwithin the next 1.5 years, depending of funding and logistic issues being currently investigated.
61

144Ce−ANG (KamLAND, 1.5 y, 9.3 m from Center, 75 kCi, 95% C.L.)
sin2(2θ
new)
∆m
new
2 (
eV
2)
10−2
10−1
100
10−2
10−1
100
101
102
Source Extension = 15 cm
Point−like Source
Source Extension = 50 cm
Source Extension = 100 cm
Reactor ν anomaly, PRD 83 073006 (2011), 95% CL
Reactor ν anomaly, PRD 83 073006 (2011), 90% CL
Figure 46: Impact of the extension of the source on the sensitivity. The source extension is takenas a sphere ranging from 0 to of 100 cm diameter. We observe that the sensitivity is not degradedat all by extensions of the source up to 100 cm, for a rate+shape analysis (left) and a shape onlyanalysis (right). Exclusion contours are given at the 95% CL for 1.5 y of data taking with a sourcelocated 9.3 m away from the detector center. The vertex resolution of the detector is taken as 15cm. Fiducial volume is taken as 0<R<6.5 m.
Source age Heat β activity 2.2 MeV γ Dose rate with Dose rate without(W) activity shielding (µSv/h) shielding (µSv/h)
1 day 678 84.8 kCi 594 Ci 16.4 6.6× 10⁶
1 week 668 83.6 kCi 585 Ci 16.1 6.5× 10⁶
1 month 631 79.0 kCi 553 Ci 15.3 6.2× 10⁶
3 month 546 68.3 kCi 478 Ci 13.2 5.3× 10⁶
1/2 year 438 54.9 kCi 384 Ci 10.6 4.3× 10⁶
1 year 279 35.0 kCi 245 Ci 6.8 2.7× 10⁶
2 years 115 14.4 kCi 101 Ci 2.8 1.1× 10⁶
3 years 47.3 5.92 kCi 41 Ci 1.1 4.6× 10⁵
5 years 8.0 1.00 kCi 7.0 Ci 0.19 7.8× 10⁴
10 years 9.5× 10⁻² 12 Ci 3.1 GBq 2.3× 10⁻³ 9.2× 10²
20 years 1.3× 10⁻⁵ 61 MBq 430 kBq 3.2× 10⁻⁷ 0.1340 years 2.5× 10⁻¹³ 1.2 Bq 8.3 mBq 6.2× 10⁻¹⁵ 2.5× 10⁻⁹
Table 19: Evolution of the source, starting with an initial β activity of 85 kCi. The dose rate iscalculated with formula 23 at 1 m from the center of the source (∼ 80 cm of the shielding if any).
A Interaction length in Tungsten alloyIn reference [63] we found plots of the cross section for photon on all elements taking from theevaluated data base ENDF/B-VI. Examples on W, Fe, Ni,U are given in figure 50. These data areused to precisely compute the interaction length in tungsten alloys.
The total interaction length is 1.238 ± 0.14 cm (see details in table 20). For comparison, theinteraction lengths in pure tungsten and uranium metals are respectively 1.19 cm and 1.13 cm.For a tungsten alloy shielding having a density of 18.5 ± 0.2 gm/cm3the attenuation factor in a35 cm thick shielding is (5.25 ± 1.4 ) × 10−13.
62

144Ce−ANG (KamLAND, 1.5 y, 9.3 m from Center, 75 kCi, 95% C.L.)
sin2(2θ
new)
∆m
new
2 (
eV
2)
10−2
10−1
100
10−2
10−1
100
101
102
σE=2.5%
σE=5%
σE=7.5%
σE=15%
Reactor ν anomaly, PRD 83 073006 (2011), 95% CL
Reactor ν anomaly, PRD 83 073006 (2011), 90% CL
144Ce−ANG (KamLAND, 1.5 y, 9.3 m from Center, 75 kCi, Shape Only, 95% C.L.)
sin2(2θ
new)
∆m
new
2 (
eV
2)
10−2
10−1
100
10−2
10−1
100
101
102
σE=2.5%
σE=5%
σE=7.5%
σE=15%
Reactor ν anomaly, PRD 83 073006 (2011), 95% CL
Reactor ν anomaly, PRD 83 073006 (2011), 90% CL
Figure 47: Impact of the KamLAND energy resolution on the sensitivity. We assume a antineutrinogenerator located 9.3 m away from the detector center. The sensitivity is computed for 18 monthsof data taking. We vary the resolution from 2.5% to 15%, not depending on energy. The left panelshows the rate+shape sensitivity assuming a normalization uncertainty of 1.5%, whereas the rightpanel shows the shape only sensitivity. We observe that the sensitivity is not noticeably degradedfor ∆m2 between 1 to 10 eV2 in the case of the rate+shape analysis. KamLAND published energyresolution is 5 % at 1 MeV, corresponding conservatively to the black lines on both plots since thepositrons induced from the source have an energy between 1 and 2.3 MeV. The energy resolution istherefore not an issue for the CeLAND. Exclusion contours are given at the 95% CL for a fiducialvolume is taken as 0<R<6.5 m.
Element E (keV) σ (barn) A Z % in mass # nuclei/cm3 λi
W 2179 13.3 ± 1 183.84 74 97 5.878 1022 1.279 ± 0.096 cmFe 2189 5.09 ± .15 55.845 26 1.5 0.299 1022 65.65 ± 0.19 cmNi 2188 5.28 ± .15 58.6934 28 1.5 0.284 1022 66.52 ± 1.9 cm
Table 20: Data used for the computation of the attenuation length in tungsten alloy. λi is thepartial interaction length. The total interaction length : 1.238 ± 0.14 cm.
144Ce−ANG (KamLAND, 1.5 y, 9.3 m from Center, 75 kCi, 95% C.L.)
sin2(2θ
new)
∆m
new
2 (
eV
2)
10−2
10−1
100
10−2
10−1
100
101
102
σR=5 cm
σR=15 cm
σR=25 cm
σR=50 cm
Reactor ν anomaly, PRD 83 073006 (2011), 95% CL
Reactor ν anomaly, PRD 83 073006 (2011), 90% CL
144Ce−ANG (KamLAND, 1.5 y, 9.3 m from Center, 75 kCi, 95% C.L.)
sin2(2θ
new)
∆m
new
2 (
eV
2)
10−2
10−1
100
10−2
10−1
100
101
102
σR=5 cm
σR=15 cm
σR=25 cm
σR=50 cm
Reactor ν anomaly, PRD 83 073006 (2011), 95% CL
Reactor ν anomaly, PRD 83 073006 (2011), 90% CL
Figure 48: Impact of the KamLAND vertex resolution on the sensitivity. We assume a antineutrinogenerator located 9.3 m away from the detector center. The sensitivity is computed for 18 monthsof data taking. We vary the resolution from 5 cm to 25 cm. The left panel shows the rate+shapesensitivity assuming a normalization uncertainty of 1.5%, whereas the right panel shows the shapeonly sensitivity. The KamLAND published vertex resolution is 15 cm, corresponding to the blacklines on all plots. Therefore one expects no concern induced by vertex resolution effect for thisphase of the experiment. Exclusion contours are given at the 95% CL for a fiducial volume is takenas 0<R<6.5 m.
63
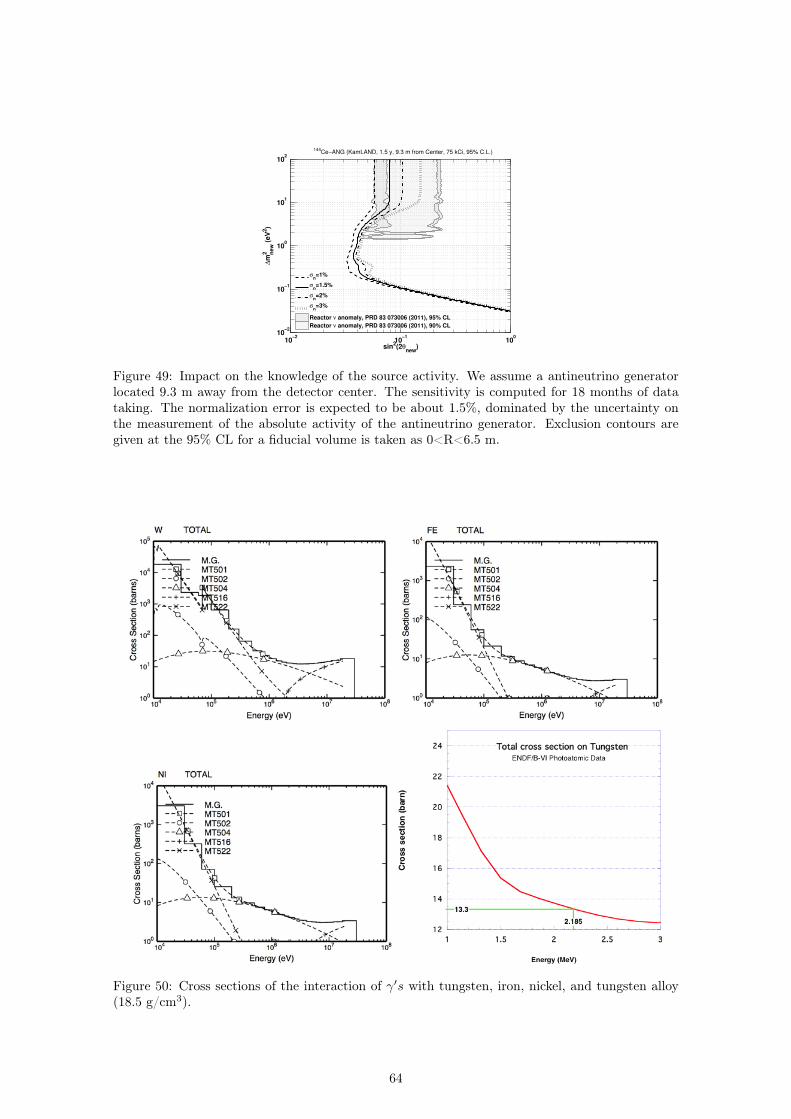
144Ce−ANG (KamLAND, 1.5 y, 9.3 m from Center, 75 kCi, 95% C.L.)
sin2(2θ
new)
∆m
new
2 (
eV
2)
10−2
10−1
100
10−2
10−1
100
101
102
σn=1%
σn=1.5%
σn=2%
σn=3%
Reactor ν anomaly, PRD 83 073006 (2011), 95% CL
Reactor ν anomaly, PRD 83 073006 (2011), 90% CL
Figure 49: Impact on the knowledge of the source activity. We assume a antineutrino generatorlocated 9.3 m away from the detector center. The sensitivity is computed for 18 months of datataking. The normalization error is expected to be about 1.5%, dominated by the uncertainty onthe measurement of the absolute activity of the antineutrino generator. Exclusion contours aregiven at the 95% CL for a fiducial volume is taken as 0<R<6.5 m.
Figure 50: Cross sections of the interaction of γ′s with tungsten, iron, nickel, and tungsten alloy(18.5 g/cm3).
64

References[1] M. Cribier, M. Fechner, Th. Lasserre et al., Phys. Rev. Lett. 107, 201801 (2011)
[2] C. Giunti and C.W. Kim, “Fundamentals of neutrino physics and astrophysics”, Oxford uni-versity press (2007)
[3] J. Beringer et al. (Particle Data Group), Phys. Rev. D86, 010001 (2012)
[4] A. Aguilar-Arevalo et al. (LSND), Phys. Rev. D64, 112007 (2001)
[5] A. Aguilar-Arevalo et al. (MiniBooNE), Phys. Rev. Lett. 102, 101802 (2009)
[6] A. Aguilar-Arevalo et al. (MiniBooNE), Phys. Rev. Lett. 105, 181801 (2010)
[7] C. Giunti and M. Laveder, Mod. Phys. Lett. A22, 2499 (2007)
[8] C. Giunti and M. Laveder, Phys. Rev. C83, 065504 (2011)
[9] C. Giunti, M. Laveder, Y.F. Li, Q.Y. Liu and H.W. Long, arXiv:1210.5715 (2012)
[10] G. Mention et al., Phys. Rev. D83, 073006 (2011)
[11] M. Cribier et al., NIM A 378, 233 (1996)
[12] J. N. Abdurashitov et al., Phys. Rev. C59, 2246 (1999)
[13] J. N. Abdurashitov et al., Phys. Rev. C73, 045805 (2006)
[14] P.A.R. Ade et al. (Planck collaboration), arXiv:1303.5076 (2013)
[15] K. Abazajian, G. Barenboim, B. Fleming, J. Formaggio, P. Huber, T. Lasserre, J. Link, W.Rodejohann, T. Schwetz, Y. Wong, et al., arXiv:1204.5379 (2012)
[16] P. Anselmann et al. (GALLEX), Phys. Lett. B342, 440 (1995)
[17] W. Hampel . et al. (GALLEX), Phys. Lett. B420, 114 (1998)
[18] F. Kaether, W. Hampel, G. Heusser, J. Kiko and T. Kirsten, Phys. Lett. B685, 47 (2010)
[19] J.N. Abdurashitov et al. (SAGE), Phys. Rev. Lett. 77, 4708 (1996)
[20] J.N. Abdurashitov et al. (SAGE), Phys. Rev. C59, 2246 (1999)
[21] J.N. Abdurashitov et al. (SAGE), Phys. Rev. C73, 045805 (2006)
[22] Th. Mueller et al., Phys. Rev. C83, 054615 (2011)
[23] P. Huber, Phys. Rev. C84, 024617 (2011)
[24] M. Apollonio et al. (CHOOZ), Eur. Phys. J. C27, 331 (2003)
[25] F. Boehm et al. (Palo Verde), Phys. Rev. D64, 112001 (2001)
[26] C. Athanassopoulos et al. (LSND), Nucl. Instrum. Meth. A388, 149 (1997)
[27] A. Aguilar-Arevalo et al. (MiniBooNE), Nucl. Instrum. Meth. A599, 28 (2009)
[28] A. Aguilar-Arevalo et al. (MiniBooNE), Phys. Rev. Lett. 98, 231801 (2007)
[29] A. Aguilar-Arevalo et al. (MiniBooNE), arXiv:1207.4809 (2012)
[30] C. Weinheimer et al., Phys. Lett. B300, 210 (1993)
[31] C. Weinheimer et al., Phys. Lett. B460, 219 (1999)
[32] C. Kraus, A. Singer, K. Valerius and C. Weinheimer, arXiv:1210.4194 (2012)
[33] F.M. Fraenkle (KATRIN), arXiv:1110.0087 (2011), DPF-2011 Conference, Providence, RI,August 8-13, 2011
65

[34] A. Gando et al. (KamLAND-Zen), Phys. Rev. C85, 045504 (2012)
[35] A. Gando et al. (KamLAND-Zen), arXiv:1205.6372 (2012)
[36] A. Gando et al. (KamLAND-Zen), arXiv:1211.3863 (2012)
[37] M. Auger et al. (EXO Collaboration), Phys. Rev. Lett. 109, 032505 (2012)
[38] J. Hamann, S. Hannestad, G.G. Raffelt, I. Tamborra and Y.Y. Wong, Phys. Rev. Lett. 105,181301 (2010)
[39] G. Alimonti et al. (Borexino), Nucl. Instrum. Meth. A600, 568 (2009)
[40] K. Eguchi et al. (KamLAND), Phys. Rev. Lett. 90, 021802 (2003)
[41] M.C. Chen (SNO+), arXiv:0810.3694, 34th International Conference on High Energy Physics(ICHEP 2008), Philadelphia, Pennsylvania, 30 Jul - 5 Aug 2008
[42] K. Nakamura et al., J. Phys. G37, 075021 (2010).
[43] C. Athanassopoulos et al., Phys. Rev. Lett. 75 2650 (1995); C. Athanassopoulos et al., Phys.Rev. C54, 2685 (1996); A. Aguilar et al., Phys. Rev. D64, 112007 (2001).
[44] J. Bahcall, P. Krastev, E. Lisi, PLB 349.68 (1995) 121; C. Giunti, M. Laveder,arXiv:1006.3244; P. Anselman et al., Phys. Lett. 342B, 440 (1995).
[45] G. Alimonti et al., Astropart. Phys. 16 205-234, (2002).
[46] L.W. Alvarez. Lawrence Radiation Laboratory Physics Note 767 (1973).
[47] R.S. Raghavan, Proc. Conf. on Status and Future of Solar Neutrino Research, BNL Report50879 (1978), Vol. 2, p. 270.
[48] W.C. Haxton, Phys. Rev. C 38 (1988) 2474.
[49] J. N. Abdurashitov et al. Phys. Rev. C59 (1999) 2246
[50] J. N. Abdurashitov et al. , Phys. Rev. C73.045805 (2006) ; V. N. Gavrin, et al., INR d d d ofthe Russian Academy of Sciences Report No. P-777 (1992).
[51] C. Arpesella et al., Phys. Rev. Lett. 101, 091302 (2008).
[52] M.P. Decowski, J. Phys. Conf. Ser. 136:022005 (2008).
[53] M. Chen, Nucl. Phys. B (Proc. Suppl.) 154, 65-68 (2005).
[54] A. Ianni et al., Eur. Phys. J. C8, 609-617 (1999).
[55] R.S. Raghavan, Phys. Rev. Lett. 37 259 (1976).
[56] Ch. Grieb et al., Phys. Rev. D83, 093006 (2009).
[57] D.A. Dwyer, K.M. Heeger, B.R. Littlejohn, P. Vogel, arXiv:1109.6036 (2011).
[58] V. Kornoukhov, preprint of ITEP, Moscow, 1994. No. 90.
[59] J.S. Geiger, R.L. Graham, G.T. Ewan, Nuclear Phys. 16, 1 (1960).
[60] J. Dalmasso, H. Maria, A. Hachem, G. Ardisson, Nucl.Instrum.Methods 221, 564 (1984).
[61] J. Dalmasso, H. Forest, G. Ardisson, Phys. Rev. C32, 1006 (1985).
[62] http://www.nist.gov/
[63]
[64] S. Agostinelli et al. NIM A 506, 250 (2003).
[65] M. Cribier, CeLAND Internal Note, Thermal issues in CeLAND, 6/12/2012.
66

[66] M. Cribier et al., NIM A378 (1996) 233-250.
[67] Calorimetric Measurements of the 51Cr Source Activity, Gallex Note GX-58.
[68] ENDF/B-VI Photoatomic Data (http://t2.lanl.gov/data/data.html)
[69] Densimet-Innermet for shielding and aerospace applications data sheet,http://www.plansee.com/en/Materials-Tungsten-403.htm#W-Schwermetall
[70] L. Katz and A.S. Penfold, Rev. Mod. Phys. 24, 28-44 (1952)
[71] KamLAND-Zen Collaboration, Measurement of the double-β decay half-life of 136Xe with theKamLAND-Zen experiment,Phys.Rev.C85:045504 (2012)
[72] KamLAND-Zen Collaboration, Limit on Neutrinoless ββ Decay of Xe-136 from the First Phaseof KamLAND-Zen and Comparison with the Positive Claim in Ge-76, arXiv:1211.3863v1(2012)
[73] National Nuclear Data Center, Brookhaven National Laboratory, information extracted fromthe Chart of Nuclides database, http://www.nndc.bnl.gov/chart/
[74] E. Le Coz, Radioprotection computation for the CeLAND experiment,CEA/DSM/SAC/UPSE/SPR/SERD/2012-1437 internal Note, 17/10/2012
[75] Patrick Huber. Determination of antineutrino spectra from nuclear reactors. Phys. Rev. C,84:024617, Aug 2011.
[76] Thomas Mueller. Expï¿œrience Double Chooz : simulation des spectres antineutrinos issus derï¿œacteurs. PhD thesis, Paris-Sud XI - Orsay, IRFU/SPhN, Sep 2010.
[77] Patrick Huber. Erratum: Determination of antineutrino spectra from nuclear reactors. Phys.Rev. C, 85:029901, Feb 2012.
[78] D.H. Wilkinson. Evaluation of beta-decay: I. The traditional phase space factors. Nuclear In-struments and Methods in Physics Research Section A: Accelerators, Spectrometers, Detectorsand Associated Equipment, 275(2):378 386, 1989.
[79] D.H. Wilkinson. Evaluation of beta-decay: II. Finite mass and size effects. Nuclear Instru-ments and Methods in Physics Research Section A: Accelerators, Spectrometers, Detectorsand Associated Equipment, 290(2/3):509 515, 1990.
[80] A. Sirlin. Radiative correction to the νe -νe spectrum in β decay. Phys. Rev. D, 84:014021,Jul 2011.
[81] H. Behrens and W. Bï¿œhring. 5 Electron Radial Wave Functions and Nuclear Beta-Decay.The International Series of Monographs on Physics Series. Clarendon Press, 1982.
[80] A. Gando et al. (KamLAND Collaboration), arXiv:1303.466 (2013)
[81] S. A. Fayans, Sov. J. Nucl. Phys. 42 (4), 590 (1985).
67