Cedar Rapids Community Schools School Finance Basics Updated: 9-20-10.
27
Cedar Rapids Community Schools School Finance Basics Updated: 9-20-10
-
date post
19-Dec-2015 -
Category
Documents
-
view
214 -
download
0
Transcript of Cedar Rapids Community Schools School Finance Basics Updated: 9-20-10.

Cedar Rapids Community Schools
School Finance BasicsUpdated: 9-20-10


Certified Enrollment Trends
15,000
15,500
16,000
16,500
17,000
17,500
18,000
18,500B
udge
t E
nrol
lmen
t
18,114 17,860 17,861 17,656 17,691 17,754 17,677 17,746 17,502 16,929
01-02 02-03 03-04 04-05 05-06 06-07 07-08 08-09 09-10 10-11
Data Source: Line 7 “Certified Enrollment” Resident Pupils
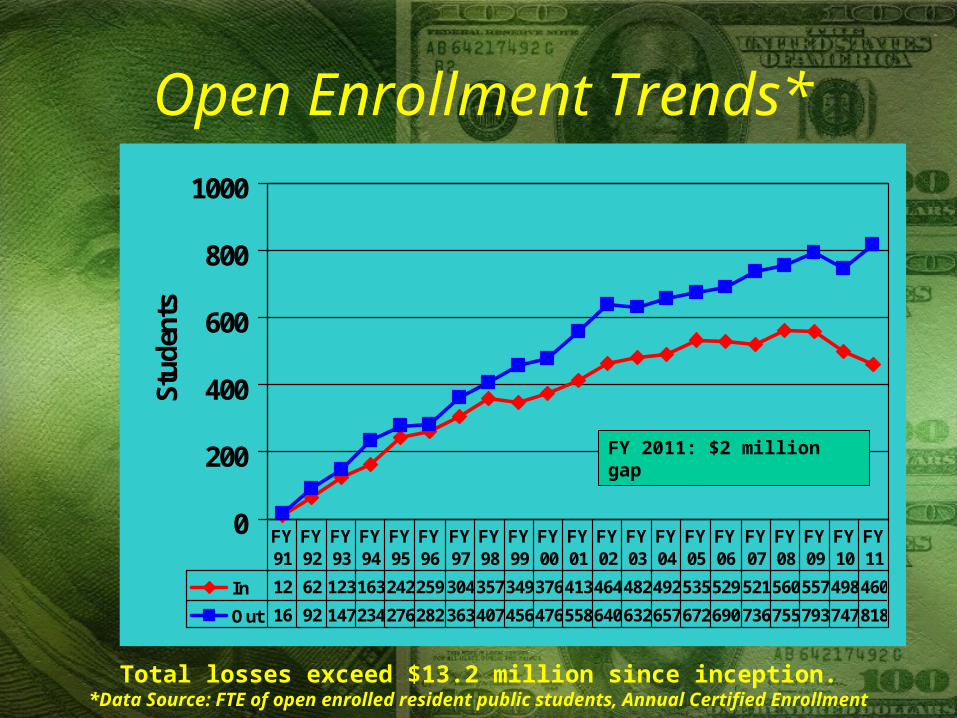
Open Enrollment Trends*
0
200
400
600
800
1000St
uden
ts
In 12 62 123163242259 304357349376413464482492535529 521560557498460
Out 16 92 147234276282 363407456476558640632657672690 736755793747818
FY 91
FY 92
FY 93
FY 94
FY 95
FY 96
FY 97
FY 98
FY 99
FY 00
FY 01
FY 02
FY 03
FY 04
FY 05
FY 06
FY 07
FY 08
FY 09
FY 10
FY 11
Total losses exceed $13.2 million since inception.*Data Source: FTE of open enrolled resident public students, Annual Certified Enrollment
FY 2011: $2 million gap

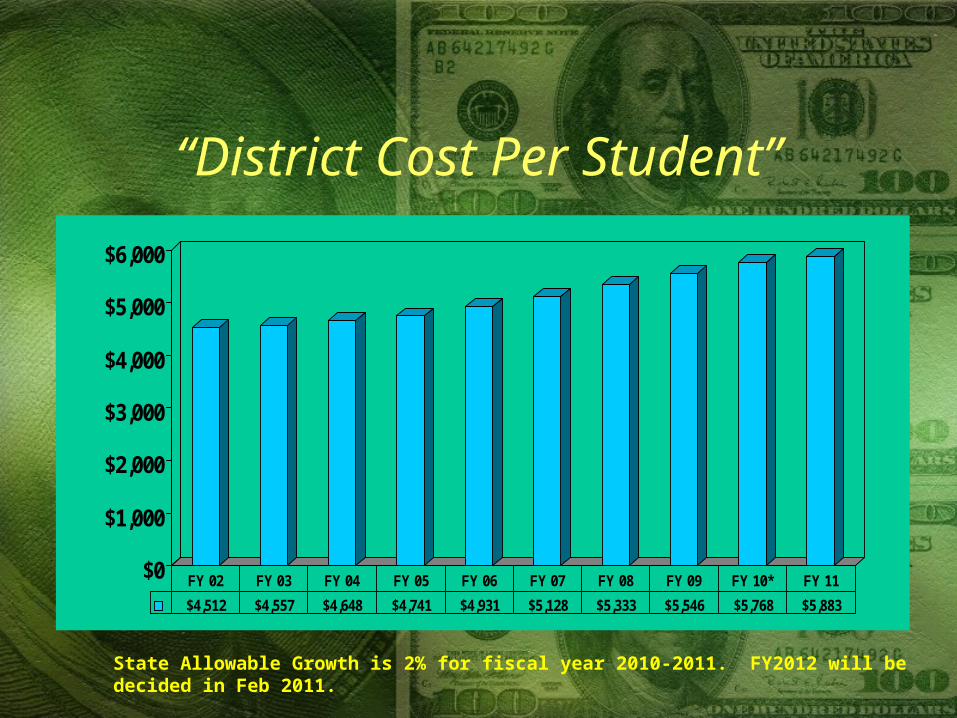
“District Cost Per Student”
$0
$1,000
$2,000
$3,000
$4,000
$5,000
$6,000
$4,512 $4,557 $4,648 $4,741 $4,931 $5,128 $5,333 $5,546 $5,768 $5,883
FY 02 FY 03 FY 04 FY 05 FY 06 FY 07 FY 08 FY 09 FY 10* FY 11
State Allowable Growth is 2% for fiscal year 2010-2011. FY2012 will be decided in Feb 2011.

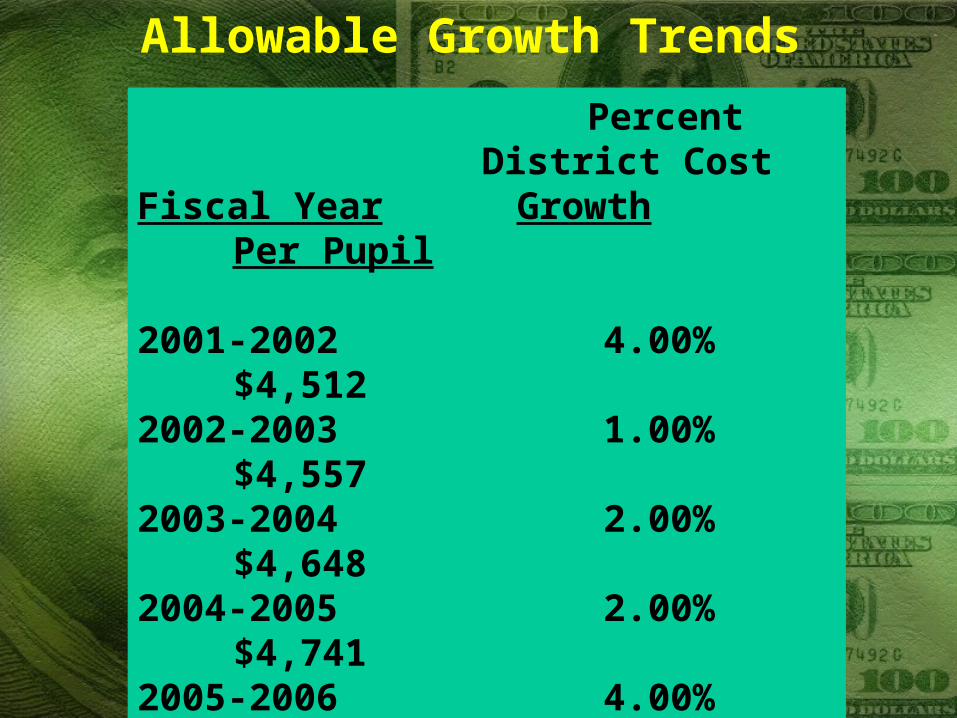
Allowable Growth Trends
Percent District Cost
Fiscal Year Growth Per Pupil
2001-2002 4.00% $4,5122002-2003 1.00% $4,5572003-2004 2.00% $4,6482004-2005 2.00% $4,7412005-2006 4.00% $4,9312006-2007 4.00% $5,1282007-2008 4.00% $5,3332008-2009 4.00% $5,5462009-2010 4.00% $5,7682010-2011 2.00% $5,883

Calculation of District New Money INCREASE PERCENT
FY 2010-2011 FY 2009-2010 (DECREASE) CHANGE
BUDGETED ENROLLMENT 16,929.00 17,502.00 -573.00 -3.27%(TIMES)
DISTRICT COST PER PUPIL $5,883 $5,768 $115 2.00%(EQUALS)
REG. PROGRAM REVENUES $99,599,401 $100,951,536 -$1,352,135 -1.34%
101% BUDGET GUARANTEE $2,361,650 $0ACTUAL REG. PROGRAM REVENUES $101,961,051 $100,951,536 $1,009,515 1.00%
What will the District receive in New Money?

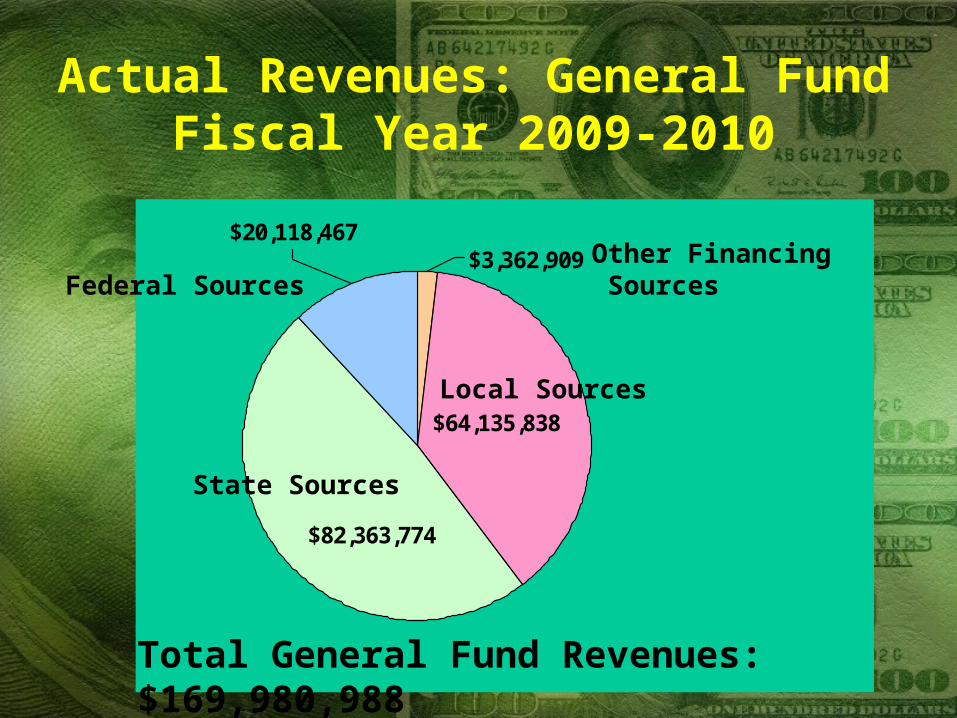
$82,363,774
$20,118,467
$64,135,838
$3,362,909
Actual Revenues: General FundFiscal Year 2009-2010
Total General Fund Revenues: $169,980,988
Local Sources
State Sources
Federal SourcesOther Financing Sources
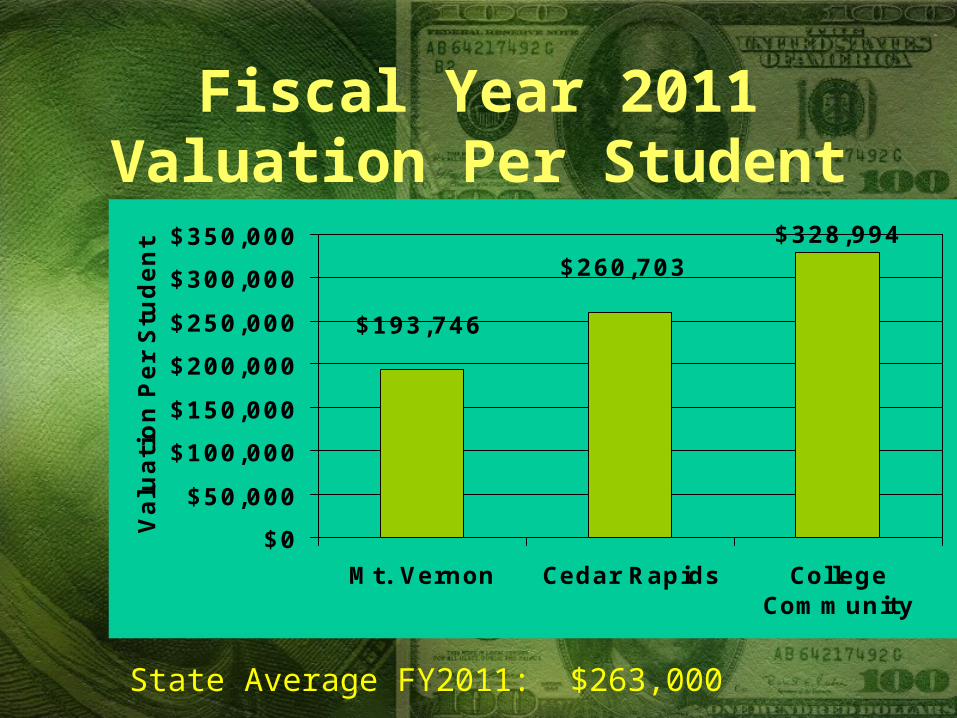
Fiscal Year 2011Valuation Per Student
$260,703$328,994
$193,746
$0
$50,000
$100,000
$150,000
$200,000
$250,000
$300,000
$350,000
Mt. Vernon Cedar Rapids CollegeCommunity
Valu
ati
on
Per
Stu
den
t
State Average FY2011: $263,000
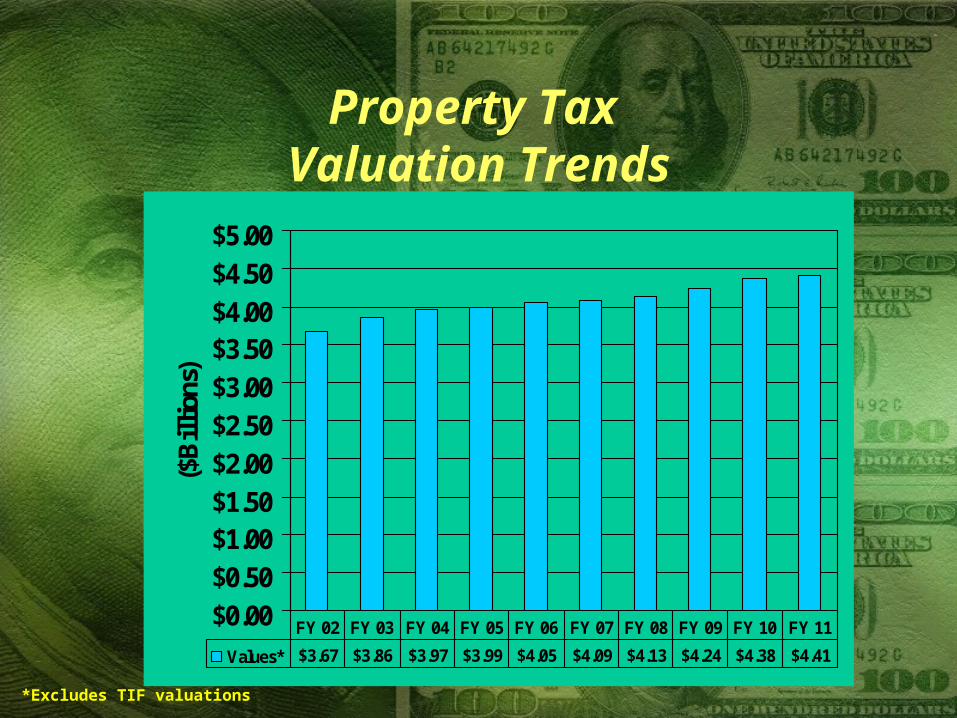
Property Tax Valuation Trends
$0.00$0.50$1.00$1.50$2.00$2.50$3.00$3.50$4.00$4.50$5.00
($B
illi
ons)
Values* $3.67 $3.86 $3.97 $3.99 $4.05 $4.09 $4.13 $4.24 $4.38 $4.41
FY 02 FY 03 FY 04 FY 05 FY 06 FY 07 FY 08 FY 09 FY 10 FY 11
*Excludes TIF valuations
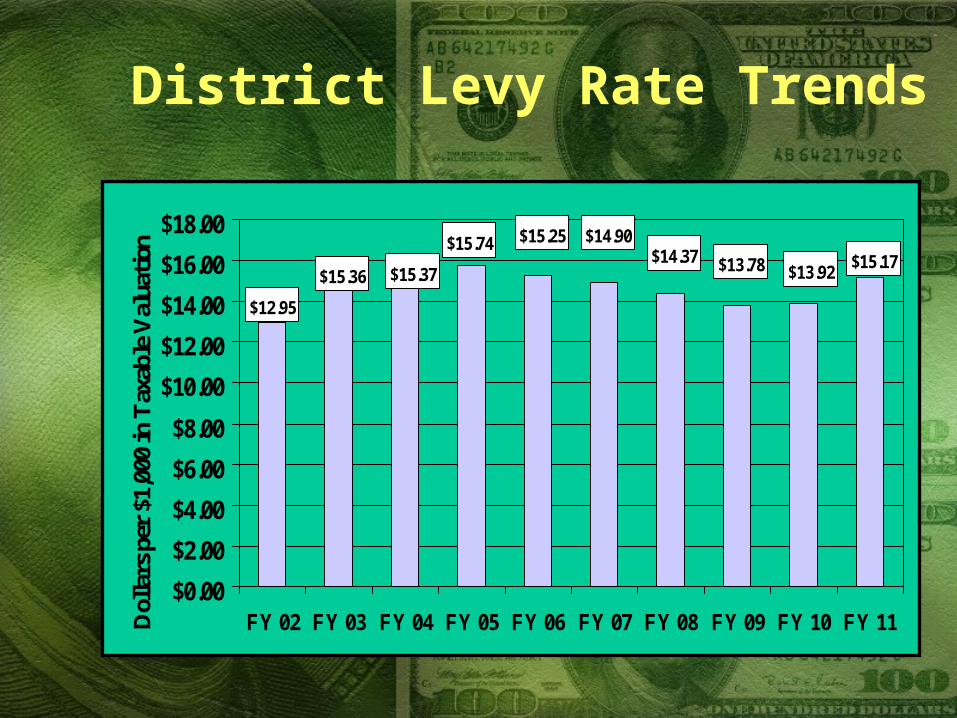
District Levy Rate Trends
$15.17$13.92$13.78$14.37
$14.90$15.25$15.74
$15.37$15.36
$12.95
$0.00
$2.00
$4.00
$6.00
$8.00
$10.00
$12.00
$14.00
$16.00
$18.00
FY 02 FY 03 FY 04 FY 05 FY 06 FY 07 FY 08 FY 09 FY 10 FY 11Dol
lars
per
$1,
000
in T
axab
le V
alua
tion
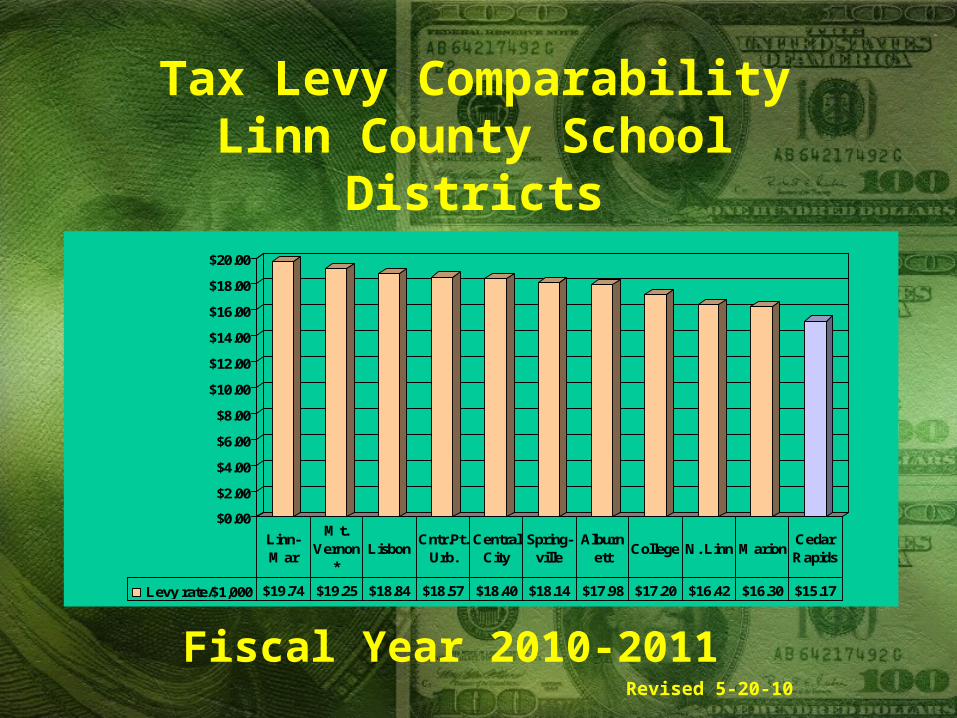
Tax Levy ComparabilityLinn County School Districts
Fiscal Year 2010-2011
$0.00
$2.00
$4.00
$6.00
$8.00
$10.00
$12.00
$14.00
$16.00
$18.00
$20.00
Levy rate/$1,000 $19.74 $19.25 $18.84 $18.57 $18.40 $18.14 $17.98 $17.20 $16.42 $16.30 $15.17
Linn-Mar
Mt. Vernon
*Lisbon
Cntr.Pt.- Urb.
Central City
Spring-ville
Alburnett
College N. Linn MarionCedar Rapids
Revised 5-20-10
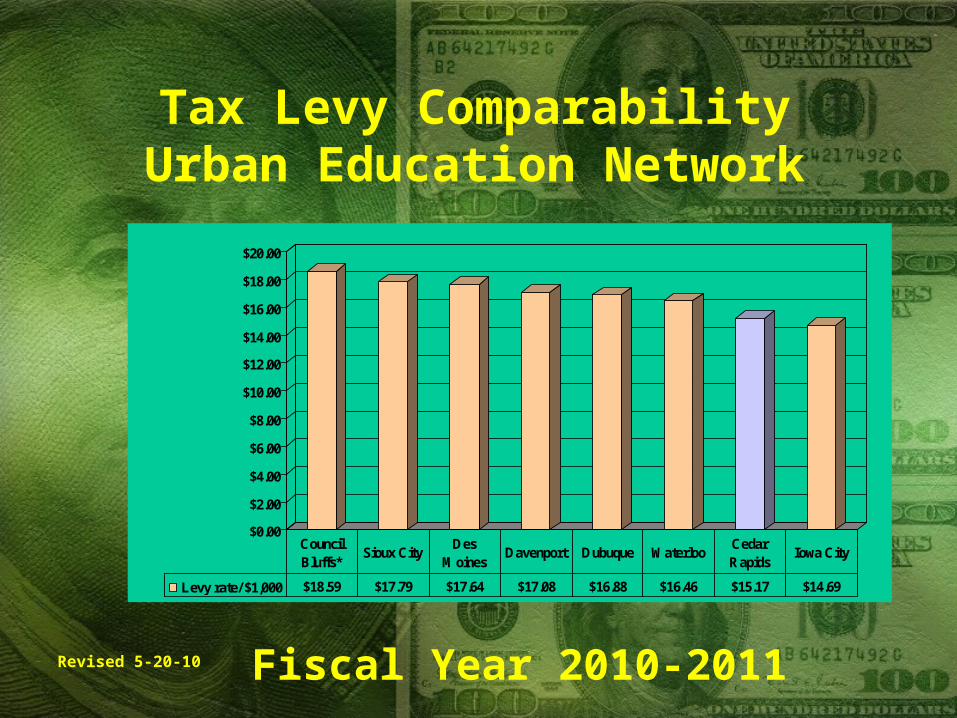
Tax Levy ComparabilityUrban Education Network
Fiscal Year 2010-2011
$0.00
$2.00
$4.00
$6.00
$8.00
$10.00
$12.00
$14.00
$16.00
$18.00
$20.00
Levy rate/ $1,000 $18.59 $17.79 $17.64 $17.08 $16.88 $16.46 $15.17 $14.69
Council Bluffs*
Sioux CityDes
MoinesDavenport Dubuque Waterloo
Cedar Rapids
Iowa City
Revised 5-20-10
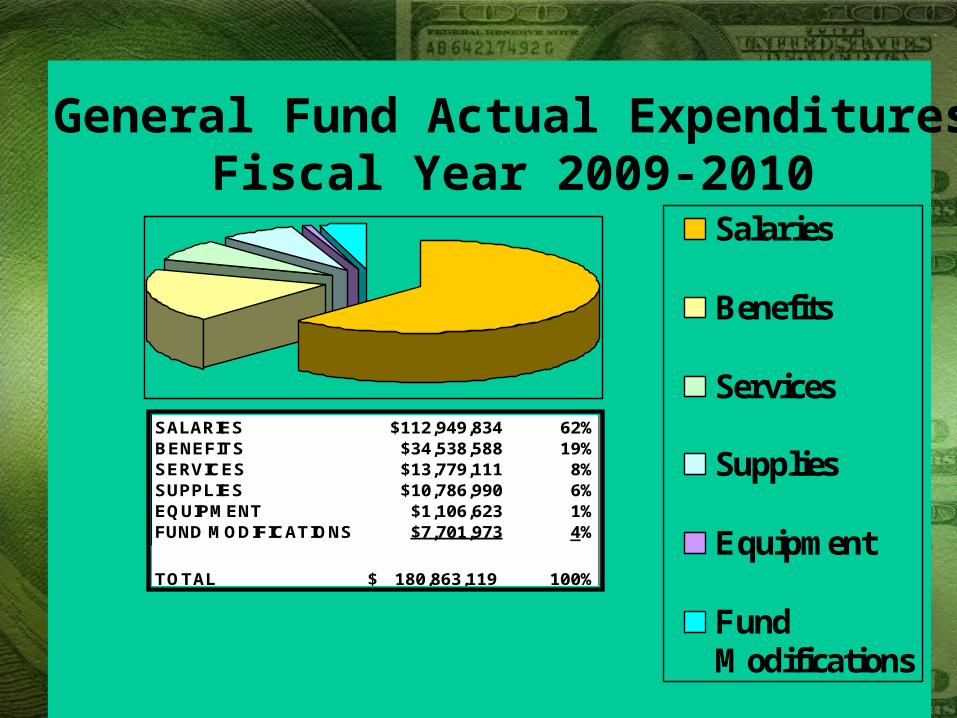
Salaries
Benefits
Services
Supplies
Equipment
FundModifications
SALARIES $112,949,834 62%BENEFITS $34,538,588 19%SERVICES $13,779,111 8%SUPPLIES $10,786,990 6%EQUIPMENT $1,106,623 1%FUND MODIFICATIONS $7,701,973 4%
TOTAL 180,863,119$ 100%
General Fund Actual ExpendituresFiscal Year 2009-2010
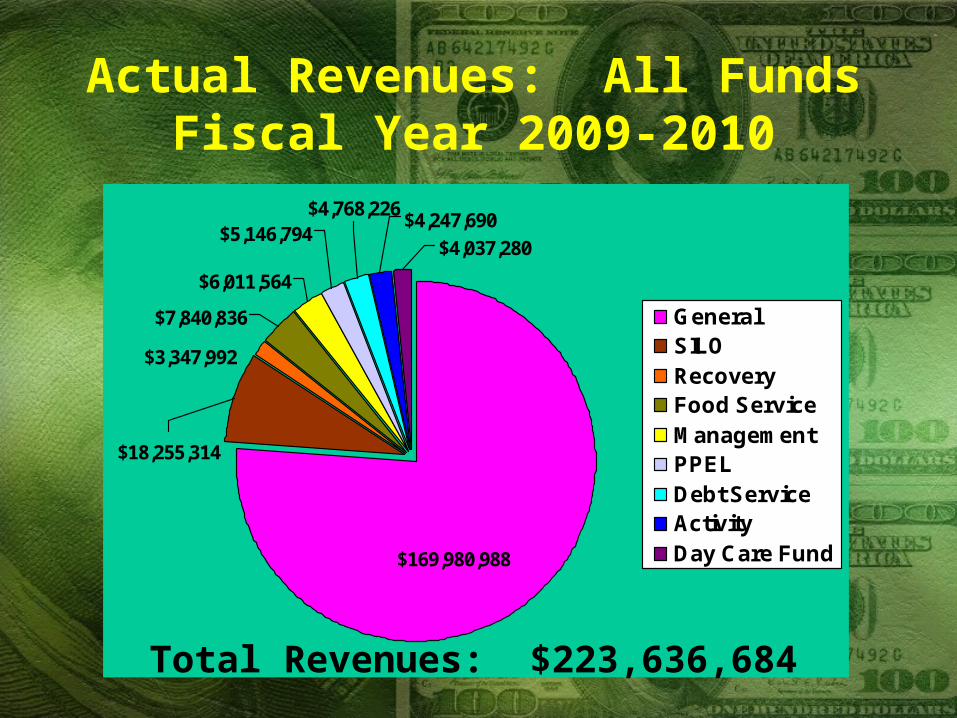
$4,037,280
$4,247,690
$18,255,314
$3,347,992
$4,768,226$5,146,794
$6,011,564
$7,840,836
$169,980,988
GeneralSILORecoveryFood ServiceManagementPPELDebt ServiceActivityDay Care Fund
Actual Revenues: All FundsFiscal Year 2009-2010
Total Revenues: $223,636,684
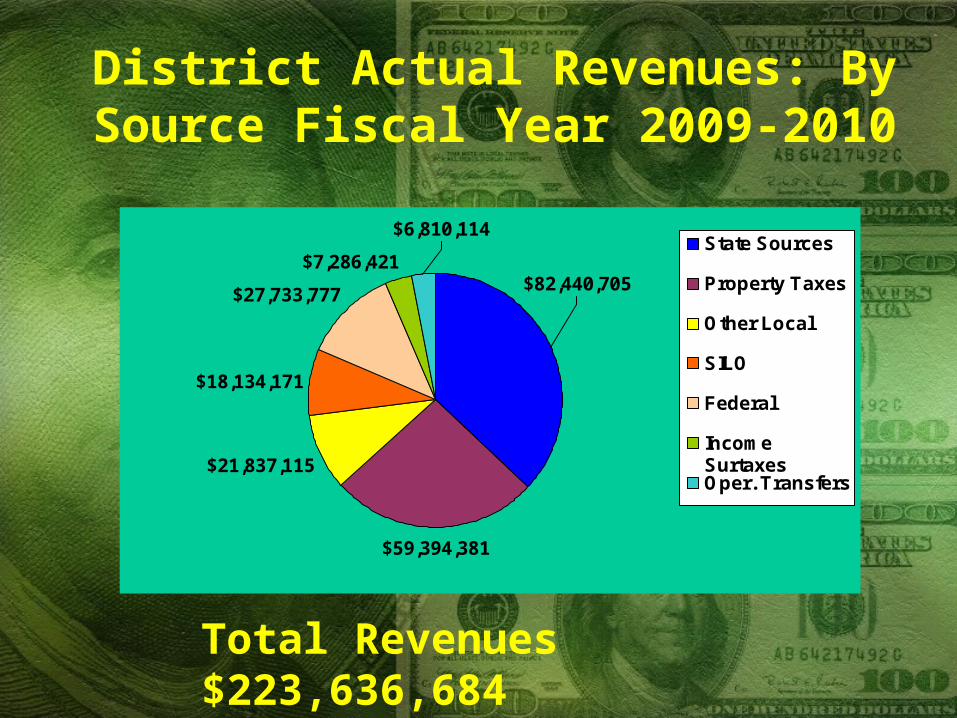
District Actual Revenues: By Source Fiscal Year 2009-2010
$59,394,381
$21,837,115
$18,134,171
$27,733,777
$7,286,421$82,440,705
$6,810,114State Sources
Property Taxes
Other Local
SILO
Federal
IncomeSurtaxesOper. Transfers
Total Revenues $223,636,684
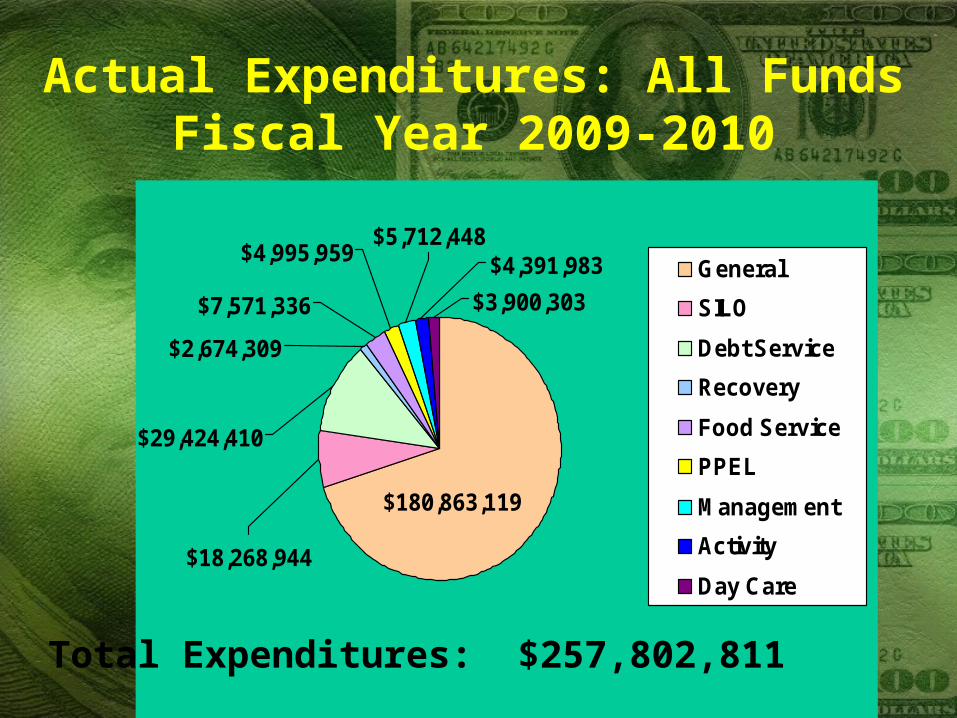
$3,900,303
$4,391,983
$180,863,119
$18,268,944
$7,571,336
$2,674,309
$29,424,410
$4,995,959$5,712,448
General
SILO
Debt Service
Recovery
Food Service
PPEL
Management
Activity
Day Care
Actual Expenditures: All FundsFiscal Year 2009-2010
Total Expenditures: $257,802,811
$-
$5.00
$10.00
$15.00
$20.00
$25.00
$30.00
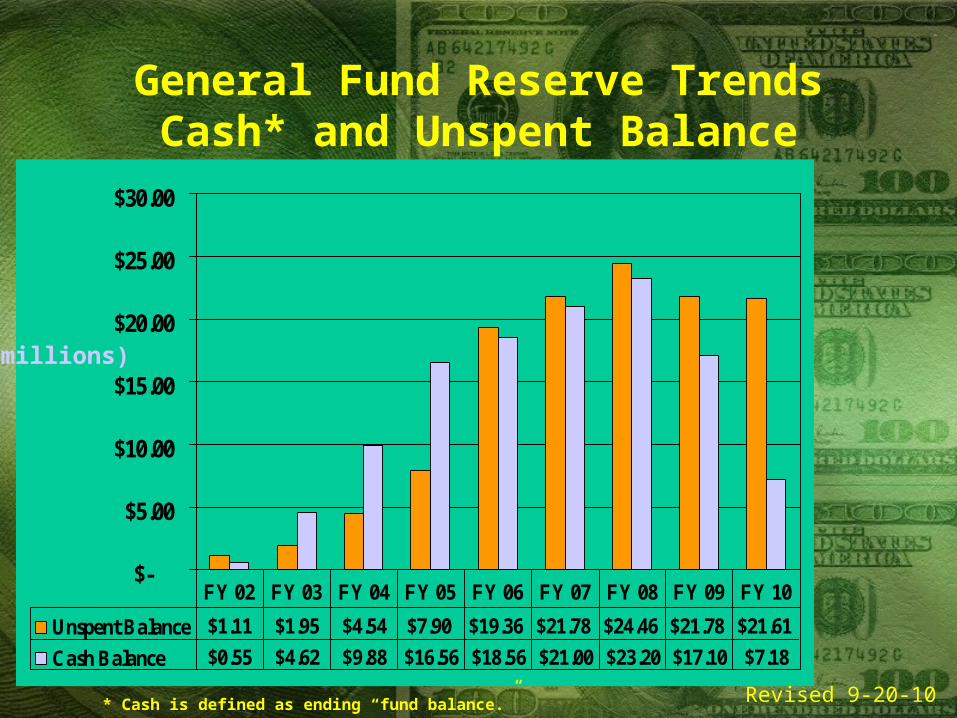
Unspent Balance $1.11 $1.95 $4.54 $7.90 $19.36 $21.78 $24.46 $21.78 $21.61
Cash Balance $0.55 $4.62 $9.88 $16.56 $18.56 $21.00 $23.20 $17.10 $7.18
FY 02 FY 03 FY 04 FY 05 FY 06 FY 07 FY 08 FY 09 FY 10
General Fund Reserve TrendsCash* and Unspent Balance
(millions)
* Cash is defined as ending “fund balance.” Revised 9-20-10
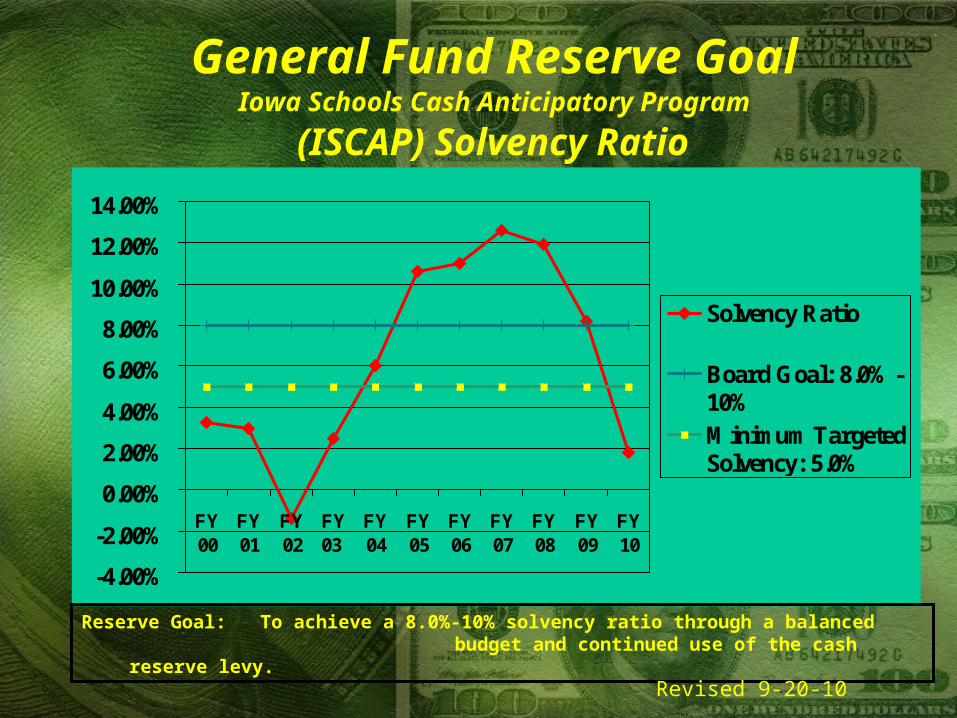
General Fund Reserve Goal Iowa Schools Cash Anticipatory Program
(ISCAP) Solvency Ratio
-4.00%
-2.00%
0.00%
2.00%
4.00%
6.00%
8.00%
10.00%
12.00%
14.00%
FY00
FY01
FY02
FY03
FY04
FY05
FY06
FY07
FY08
FY09
FY10
Solvency Ratio
Board Goal: 8.0%-10%Minimum TargetedSolvency: 5.0%
Reserve Goal: To achieve a 8.0%-10% solvency ratio through a balanced budget and continued use of the cash reserve levy.
Revised 9-20-10
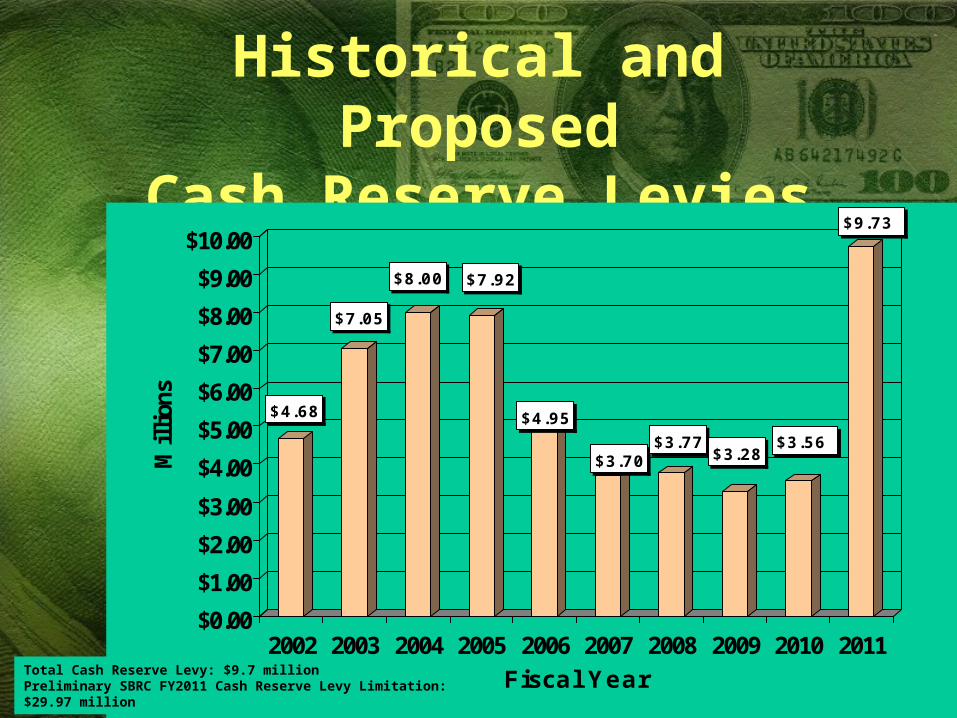
Historical and ProposedCash Reserve Levies
$4.68
$7.05
$8.00 $7.92
$4.95
$3.70$3.77
$3.28$3.56
$9.73
$0.00
$1.00
$2.00
$3.00
$4.00
$5.00
$6.00
$7.00
$8.00
$9.00
$10.00
Mil
lion
s
2002 2003 2004 2005 2006 2007 2008 2009 2010 2011
Fiscal YearTotal Cash Reserve Levy: $9.7 millionPreliminary SBRC FY2011 Cash Reserve Levy Limitation: $29.97 million

Questions ?&
Answers