CDP Italy 100 Report 2011 Accelerating carbon … written for Carbon Disclosure Project by Carbon...
52
CDP Italy 100 Report 2011 Accelerating carbon management through business as usual On behalf of 551 investors with assets of US$ 71 trillion Report written for Carbon Disclosure Project by Carbon Disclosure Project [email protected] +1 212 378 2086 www.cdproject.net Carbon Disclosure Partner
Transcript of CDP Italy 100 Report 2011 Accelerating carbon … written for Carbon Disclosure Project by Carbon...
1
CDP Italy 100 Report 2011Accelerating carbon management through business as usual
On behalf of 551 investors with assets of US$ 71 trillion
Report written forCarbon Disclosure Project by
Carbon Disclosure [email protected]+1 212 378 2086www.cdproject.net
Carbon Disclosure Partner
2
2011 Carbon Disclosure Project Investor Members
CDP works with investors globally to advance the investment opportunities and reduce the risks posed by climate change by asking almost 6,000 of the world’s largest companies to report on their climate strategies, GHG emissions and energy use in the standardized Investor CDP format. To learn more about CDP’s member offer and becoming a member, please contact us or visit the CDP Investor Member section at www.cdproject.net/investormembers
ABRAPP - Associação Brasileira das Entidades Fechadas de Previdência ComplementarAEGON N.V.AKBANK T.A.S. Allianz Global Investors Kapitalanlagegesell-schaft mbHATP GroupAviva InvestorsBank of America Merrill LynchBlackRockBP Investment Management LimitedCalifornia Public Employees’ Retirement SystemCalifornia State Teachers’ Retirement SystemCalvert Asset Management Company, Inc.
Catholic SuperCCLA Investment Management LtdEthos FoundationGeneration Investment ManagementHSBC Holdings plcINGKB Kookmin BankKLPLegg Mason, Inc.London Pensions Fund AuthorityMitsubishi UFJ Financial Group (MUFG)Morgan Stanley National Australia BankNEI InvestmentsNeuberger BermanNewton Investment Management LimitedNordea Investment ManagementPFA PensionRaiffeisen Schweiz
Royal Bank of Scotland GroupRobecoRockefeller & Co., Inc.SAM GroupSchroders Scottish Widows Investment PartnershipSEBSompo Japan Insurance Inc.Standard CharteredSun Life Financial Inc.TD Asset Management Inc. and TDAM USA Inc.The Wellcome TrustZurich Cantonal Bank
3
2011 Carbon Disclosure Project Investor Signatories
Carbon Disclosure Project 2011 551 financial institutions with assets of US$71 trillion were signatories to the CDP 2011 information request dated February 1st, 2011
Aberdeen Asset ManagersAberdeen Immobilien KAG mbHABRAPP - Associação Brasileira das Entidades Fechadas de Previdência ComplementarActive Earth Investment ManagementAcuity Investment ManagementAddenda Capital Inc.Advanced Investment PartnersAdvantage Asset Managers (Pty) LtdAEGON Magyarország Befektetési Alapkezelo Zrt.AEGON N.V.AEGON-INDUSTRIAL Fund Management Co., LtdAFP IntegraAIG Asset ManagementAk Asset Management AKBANK T.A.S.Alberta Investment Management Corporation (AIMCo)Alberta Teachers Retirement FundAlcyone FinanceAllianz Elementar Versicherungs-AGAllianz GroupAltira GroupAmalgamated BankAMP Capital InvestorsAmpegaGerling Investment GmbHAmundi AMANBIMA – Associação Brasileira das Entidades dos Mercados Financeiro e de CapitaisAntera Gestão de Recursos S.A.APG GroupAprionisAquila CapitalARIA (Australian Reward Investment Alliance)Arisaig Partners Asia Pte LtdARK Investment Advisors Inc.Arma Portföy Yönetimi A.S.ASB Community TrustASM Administradora de Recursos S.A.ASN BankAssicurazioni Generali SpaATP GroupAustralia and New Zealand Banking Group LimitedAustralian Central Credit Union incorporating Savings & Loans Credit UnionAustralian Ethical Investment LimitedAustralianSuperAvivaAviva InvestorsAXA GroupBaillie Gifford & Co.Bakers Investment Group (Australia) Pty LtdBanco Bradesco S/ABanco de Credito del Peru BCPBanco de Galicia y Buenos Aires S.A.Banco do Brasil S/ABanco Nacional de Desenvolvimento Econômico e Social - BNDESBanco SantanderBanesprev – Fundo Banespa de Seguridade SocialBanesto (Banco Español de Crédito S.A.)Bank of America Merrill LynchBank of MontrealBank Sarasin & Cie AGBank VontobelBankhaus Schelhammer & Schattera Kapitalanlagegesellschaft m.b.H.BANKINTER S.A.BankInvestBanque DegroofBarclays
Baumann and Partners S.A.BAWAG P.S.K. INVEST GmbHBayern LBBayernInvest Kapitalanlagegesellschaft mbHBBC Pension Trust LtdBBVABedfordshire Pension FundBentall KennedyBeutel Goodman and Co. LtdBioFinance Administração de Recursos de Terceiros LtdaBlackRockBlumenthal FoundationBNP Paribas Investment PartnersBNY MellonBNY Mellon Service Kapitalanlage GesellschaftBoston Common Asset Management, LLCBP Investment Management LimitedBrasilprev Seguros e Previdência S/A.British Columbia Investment Management Corporation (bcIMC)BT Investment ManagementBusan BankCAAT Pension PlanCadiz Holdings LimitedCaisse de dépôt et placement du QuébecCaisse des DépôtsCaixa Beneficente dos Empregados da Companhia Siderurgica Nacional - CBSCaixa de Previdência dos Funcionários do Banco do Nordeste do Brasil (CAPEF)Caixa Econômica FederalCaixa Geral de DepositosCaja de Ahorros de Valencia, Castellón y Valencia, BANCAJACaja NavarraCalifornia Public Employees’ Retirement SystemCalifornia State Teachers’ Retirement SystemCalifornia State TreasurerCalvert Asset Management Company, IncCanada Pension Plan Investment BoardCanadian Friends Service Committee (Quakers)Canadian Imperial Bank of Commerce (CIBC)CAPESESPCapital Innovations, LLCCARE Super Pty LtdCarlson Investment ManagementCarmignac GestionCatherine Donnelly FoundationCatholic SuperCbus Superannuation FundCCLA Investment Management LtdCeleste Funds Management LimitedCentral Finance Board of the Methodist ChurchCeresChristian SuperChristopher Reynolds FoundationChurch Commissioners for EnglandChurch of England Pensions BoardCI Mutual Funds’ Signature Global AdvisorsClean Yield Group, Inc.Cleantech Invest AGClearBridge AdvisorsClimate Change Capital Group LtdCM-CIC Asset ManagementColonial First State Global Asset ManagementComerica IncorporatedComite syndical national de retraite BâtirenteCommerzbank AGCommInsureCommonwealth Bank of AustraliaCompton Foundation, Inc.Concordia VersicherungsgruppeConnecticut Retirement Plans and Trust FundsCo-operative Financial Services (CFS)Corston-Smith Asset Management Sdn. Bhd.CRD AnalyticsCrédit AgricoleCredit SuisseGruppo Credito ValtellineseDaegu BankDaiwa Securities Group Inc.de Pury Pictet Turrettini & Cie S.A.DekaBank Deutsche GirozentraleDeutsche Asset Management Investmentgesellschaft mbH
Deutsche Bank AGDeutsche Postbank Vermögensmanagement S.A.Development Bank of Japan Inc.Development Bank of the Philippines (DBP)Dexia Asset ManagementDexus Property GroupDnB NOR ASADomini Social Investments LLCDongbu InsuranceDWS Investment GmbHEarth Capital Partners LLPEast Sussex Pension FundEcclesiastical Investment ManagementEcofi Investissements - Groupe Credit CooperatifEdward W. Hazen FoundationEEA Group LtdElan Capital PartnersElement Investment ManagersELETRA - Fundação Celg de Seguros e PrevidênciaEnvironment Agency Active Pension fundEpworth Investment ManagementEquilibrium Capital GroupErste Asset ManagementErste Group BankEssex Investment Management Company, LLCESSSuperEthos FoundationEureko B.V.Eurizon Capital SGREvangelical Lutheran Church in Canada Pension Plan for Clergy and Lay WorkersEvli Bank PlcF&C Management Ltd FAELCE – Fundacao Coelce de Seguridade SocialFAPERS- Fundação Assistencial e Previdenciária da Extensão Rural do Rio Grande do SulFASERN - Fundação COSERN de Previdência ComplementarFédéris Gestion d’ActifsFIDURA Capital Consult GmbHFIM Asset Management LtdFIPECq - Fundação de Previdência Complementar dos Empregados e Servidores da FINEP, do IPEA, do CNPqFIRA. - Banco de MexicoFirst Affirmative Financial Network, LLCFirst Swedish National Pension Fund (AP1)Firstrand LimitedFive Oceans Asset Management Pty LimitedFlorida State Board of Administration (SBA)FolketrygdfondetFolksamFondaction CSNFondation de LuxembourgFondiaria-SAIFonds de Réserve pour les Retraites – FRRFourth Swedish National Pension Fund (AP4)FRANKFURT-TRUST Investment-Gesellschaft mbHFukoku Capital Management IncFUNCEF - Fundação dos Economiários FederaisFundação AMPLA de Seguridade Social - BrasiletrosFundação Atlântico de Seguridade SocialFundação Attilio Francisco Xavier FontanaFundação Banrisul de Seguridade SocialFundação de Assistência e Previdência Social do BNDES - FAPESFUNDAÇÃO ELETROBRÁS DE SEGURIDADE SOCIAL - ELETROSFundação Forluminas de Seguridade Social - FORLUZFUNDAÇÃO ITAUBANCOFundação Itaúsa IndustrialFundação Promon de Previdência SocialFundação Vale do Rio Doce de Seguridade Social - VALIAFundação Rede Ferroviaria de Seguridade Social – ReferFundação Sistel de Seguridade Social (Sistel)FUNDIÁGUA - FUNDAÇÃO DE PREVIDENCIA COMPLEMENTAR DA CAESBFuturegrowth Asset ManagementGartmore Investment Management LtdGEAP Fundação de Seguridade SocialGenerali Deutschland Holding AGGeneration Investment ManagementGenus Capital ManagementGjensidige Forsikring ASAGLS Gemeinschaftsbank eG
4
Goldman Sachs Group Inc.GOOD GROWTH INSTITUT für globale Vermögensentwicklung mbHGovernance for OwnersGovernment Employees Pension Fund (“GEPF”), Republic of South AfricaGreen Cay Asset ManagementGreen Century Capital ManagementGroupe Crédit CoopératifGroupe Investissement Responsable Inc.GROUPE OFI AMGrupo Banco PopularGrupo Santander BrasilGruppo Credito ValtellineseGruppo MontepaschiGuardian Ethical Management IncGuardians of New Zealand SuperannuationGuosen Securities Co., LTD.Hang Seng BankHarbourmaster CapitalHarrington Investments, IncHauck & Aufhäuser Asset Management GmbHHazel Capital LLPHDFC Bank LtdHealth Super FundHealthcare of Ontario Pension Plan (HOOPP)Henderson Global InvestorsHermes Fund ManagersHESTA SuperHSBC Global Asset Management (Deutschland) GmbHHSBC Holdings plcHSBC INKA Internationale Kapitalanlagegesellschaft mbHHyundai Marine & Fire Insurance. Co., Ltd.Hyundai Securities Co., Ltd.Ibgeana Society of Assistance and Security SIAS / Sociedade Ibgeana de Assistência e Seguridade (SIAS)IDBI Bank LtdIlmarinen Mutual Pension Insurance CompanyImpax Group plcIndusInd Bank LimitedIndustrial Bank (A)Industrial Bank of KoreaIndustry Funds ManagementInfrastructure Development Finance CompanyINGInsight Investment Management (Global) LtdInstituto de Seguridade Social dos Correios e Telégrafos- PostalisInstituto Infraero de Seguridade Social - INFRAPREVInstituto Sebrae De Seguridade Social - SEBRAEPREVInsurance Australia GroupInvestec Asset ManagementIrish Life Investment ManagersItau Asset ManagementItaú Unibanco Holding S AJanus Capital Group Inc.Jarislowsky Fraser LimitedJPMorgan Chase & Co.Jubitz Family FoundationJupiter Asset ManagementKaiser Ritter Partner (Schweiz) AGKB asset ManagementKB Kookmin BankKBC Asset Management NVKDB Asset Management Co., Ltd.KEPLER-FONDS Kapitalanlagegesellschaft m. b. H.KfW BankengruppeKlimaINVESTKLPKorea Investment Management Co., Ltd.The Korea Teachers Pension (KTP)Korea Technology Finance Corporation (KOTEC)KPA PensionLa Banque Postale Asset ManagementLa Financiere ResponsableLampe Asset Management GmbHLandsorganisationen i SverigeLBBW - Landesbank Baden-WürttembergLBBW Asset Management Investmentgesellschaft mbHLD Lønmodtagernes DyrtidsfondLegal & General Investment Management
Legg Mason, Inc.LGT Capital Management Ltd.LIG Insurance Co., LtdLight Green Advisors, LLCLiving Planet Fund Management Company S.A.Local Authority Pension Fund ForumLocal Government SuperLocal SuperLombard Odier Darier Hentsch & CieLondon Pensions Fund AuthorityLothian Pension FundLupus alpha Asset Management GmbHMacif GestionMacquarie Group LimitedMAMA Sustainable Incubation AGManMaple-Brown Abbott LimitedMarc J. Lane Investment Management, Inc.Maryland State TreasurerMatrix Asset ManagementMcLean BuddenMEAG MUNICH ERGO Asset Management GmbHMeeschaert Gestion PrivéeMeiji Yasuda Life Insurance CompanyMendesprev Sociedade PrevidenciáriaMerck Family FundMeritas Mutual FundsMetallRente GmbHMetrus – Instituto de Seguridade SocialMetzler Investment GmbhMFS Investment ManagementMidas International Asset ManagementMiller/Howard InvestmentsMirae Asset Global Investments Co. Ltd.Mirae Asset Securities Co., Ltd.Missionary Oblates of Mary ImmaculateMistra, Foundation for Strategic Environmental ResearchMitsubishi UFJ Financial Group (MUFG)Mizuho Financial Group, Inc.Mn ServicesMonega Kapitalanlagegesellschaft mbHMorgan StanleyMotor Trades Association of Australia Superannuation Fund Pty LtdMutual Insurance Company Pension-FenniaNatcan Investment ManagementNathan Cummings Foundation, TheNational Australia BankNational Bank of CanadaNational Grid Electricity Group of the Electricity Supply Pension SchemeNational Grid UK Pension SchemeNational Pensions Reserve Fund of IrelandNational Union of Public and General Employees (NUPGE)NATIXISNedbank LimitedNeedmor FundNEI InvestmentsNelson Capital Management, LLCNest SammelstiftungNeuberger BermanNew Amsterdam Partners LLCNew Mexico State TreasurerNew York City Employees Retirement SystemNew York City Teachers Retirement SystemNew York State Common Retirement Fund (NYSCRF)New Zealand Earthquake CommissionNewton Investment Management LimitedNGS SuperNH-CA Asset ManagementNikko Asset Management Co., Ltd.Nikko Cordial SecuritiesNissay Asset Management CorporationNORD/LB Kapitalanlagegesellschaft AGNordea Investment ManagementNorfolk Pension FundNorges Bank Investment Management (NBIM)North Carolina Retirement SystemNorthern Ireland Local Government Officers’ Superannuation Committee (NILGOSC)
Northern TrustNykreditOddo & CieOECO Capital Lebensversicherung AGOld Mutual plcOMERS Administration CorporationOntario Teachers’ Pension PlanOP Fund Management Company LtdOppenheim Fonds Trust GmbHOpplysningsvesenets fond (The Norwegian Church Endowment)OPSEU Pension TrustOregon State TreasurerOrion Asset Management LLCParnassus InvestmentsPax World FundsPensioenfonds VervoerPension DenmarkPension Fund for Danish Lawyers and EconomistsPension Protection FundPensionsmyndighetenPETROS - The Fundação Petrobras de Seguridade SocialPFA PensionPGGMPhillips, Hager & North Investment Management Ltd.PhiTrust Active InvestorsPhoenix Asset Management Inc.Pictet Asset Management SAPKAPluris Sustainable Investments SAPNC Financial Services Group, Inc.Pohjola Asset Management LtdPortfolio 21 InvestmentsPorto Seguro S.A.PREVHAB PREVIDÊNCIA COMPLEMENTARPREVI Caixa de Previdência dos Funcionários do Banco do BrasilPREVIG Sociedade de Previdência ComplementarProvinzial Rheinland HoldingPrudential Investment ManagementPsagot Investment House LtdPSP InvestmentsPSS - Seguridade SocialQ Capital Partners Co. LtdQBE Insurance GroupRabobankRaiffeisen SchweizRailpen InvestmentsRathbones / Rathbone Greenbank InvestmentsReal Grandeza Fundação de Previdência e Assistência SocialRei SuperReliance Capital LtdResolutionResona Bank, LimitedReynders McVeigh Capital ManagementRLAMRobecoRockefeller Financial Rose Foundation for Communities and the EnvironmentRoyal Bank of CanadaRoyal Bank of Scotland GroupRREEF Investment GmbHSAM GroupSAMPENSION KP LIVSFORSIKRING A/SSAMSUNG FIRE & MARINE INSURANCESamsung SecuritiesSanlamSanta Fé Portfolios LtdaSAS Trustee CorporationSauren Finanzdienstleistungen GmbH & Co. KGSchrodersScotiabankScottish Widows Investment PartnershipSEBSEB Asset Management AGSecond Swedish National Pension Fund (AP2)SEIU Master TrustSeligson & Co Fund Management PlcSentinel InvestmentsSERPROS - Fundo MultipatrocinadoSeventh Swedish National Pension Fund (AP7)Shinhan Bank
Carbon Disclosure Project 2011 – Italy 100 Report
5
Shinhan BNP Paribas Investment Trust Management Co., LtdShinkin Asset Management Co., LtdSiemens Kapitalanlagegesellschaft mbHSignet Capital Management LtdSMBC Friend Securities Co., LTDSmith Pierce, LLCSNS Asset ManagementSocial(k)Sociedade de Previdencia Complementar da Dataprev - PrevdataSolaris Investment Management LimitedSompo Japan Insurance Inc.Sopher Investment ManagementSPF Beheer bvSprucegrove Investment Management LtdStandard CharteredStandard Chartered Korea LimitedStandard Life InvestmentsState Bank of IndiaState Street CorporationStatewideSuperStoreBrand ASAStrathclyde Pension FundStratus GroupSumitomo Mitsui Banking CorporationSumitomo Mitsui Card Company, LimitedSumitomo Mitsui Finance & Leasing Co., LtdSumitomo Mitsui Financial GroupThe Sumitomo Trust & Banking Co., Ltd.Sun Life Financial Inc.Superfund Asset Management GmbHSUSI Partners AGSustainable CapitalSvenska Kyrkan, Church of SwedenSwedbank ABSwiss ReSwisscanto Holding AGSyntrus Achmea Asset ManagementT. Rowe PriceT. SINAI KALKINMA BANKASI A.S.T.GARANTI BANKASI A.S.Tata Capital Limited TD Asset Management Inc. and TDAM USA Inc.Teachers Insurance and Annuity Association – College Retirement Equities Fund (TIAA-CREF)Telluride AssociationTempis Asset Management Co. LtdTerra Forvaltning ASTerraVerde Capital Management LLCThe Brainerd FoundationThe Bullitt FoundationThe Central Church Fund of FinlandThe Collins FoundationThe Co-operative Asset ManagementThe Co-operators Group LtdThe Daly FoundationThe GPT GroupThe Hartford Financial Services Group, Inc.The Japan Research Institute, LimitedThe Joseph Rowntree Charitable TrustThe Local Government Pensions InstitutionThe Pension Plan For Employees of the Public Service Alliance of CanadaThe Pinch GroupThe Presbyterian Church in CanadaThe Russell Family FoundationThe Shiga Bank, Ltd.The Standard Bank GroupThe United Church of Canada - General CouncilThe University of Edinburgh Endowment FundThe Wellcome TrustThird Swedish National Pension Fund (AP3)Threadneedle Asset ManagementTokio Marine & Nichido Fire Insurance Co., Ltd.Toronto Atmospheric FundTrillium Asset Management CorporationTriodos Investment ManagementTrygUBSUniCredit GroupUnion Asset Management Holding AG
UnipensionUNISON staff pension schemeUniSuperUnitarian Universalist AssociationUnited Methodist Church General Board of Pension and Health BenefitsUnited Nations FoundationUniversities Superannuation Scheme (USS)Vancity Group of CompaniesVCH Vermögensverwaltung AGVeris Wealth PartnersVeritas Investment Trust GmbHVermont State TreasurerVexiom Capital, L.P.VicSuper Pty LtdVictorian Funds Management CorporationVietNam Holding Ltd.Vision SuperVOLKSBANK INVESTMENTSWaikato Community Trust IncWalden Asset Management, a division of Boston Trust & Investment Management CompanyWARBURG - HENDERSON Kapitalanlagegesellschaft für Immobilien mbHWARBURG INVEST KAPITALANLAGEGESELLSCHAFT MBHWells Fargo & CompanyWest Yorkshire Pension FundWestLB Mellon Asset Management (WMAM)Westpac Banking CorporationWhite Owl Capital AGWinslow Management, A Brown Advisory Investment GroupWoori BankWoori Investment & Securities Co., Ltd.YES BANK LimitedYork University Pension FundYouville Provident Fund Inc.Zegora Investment ManagementZevin Asset ManagementZurich Cantonal Bank
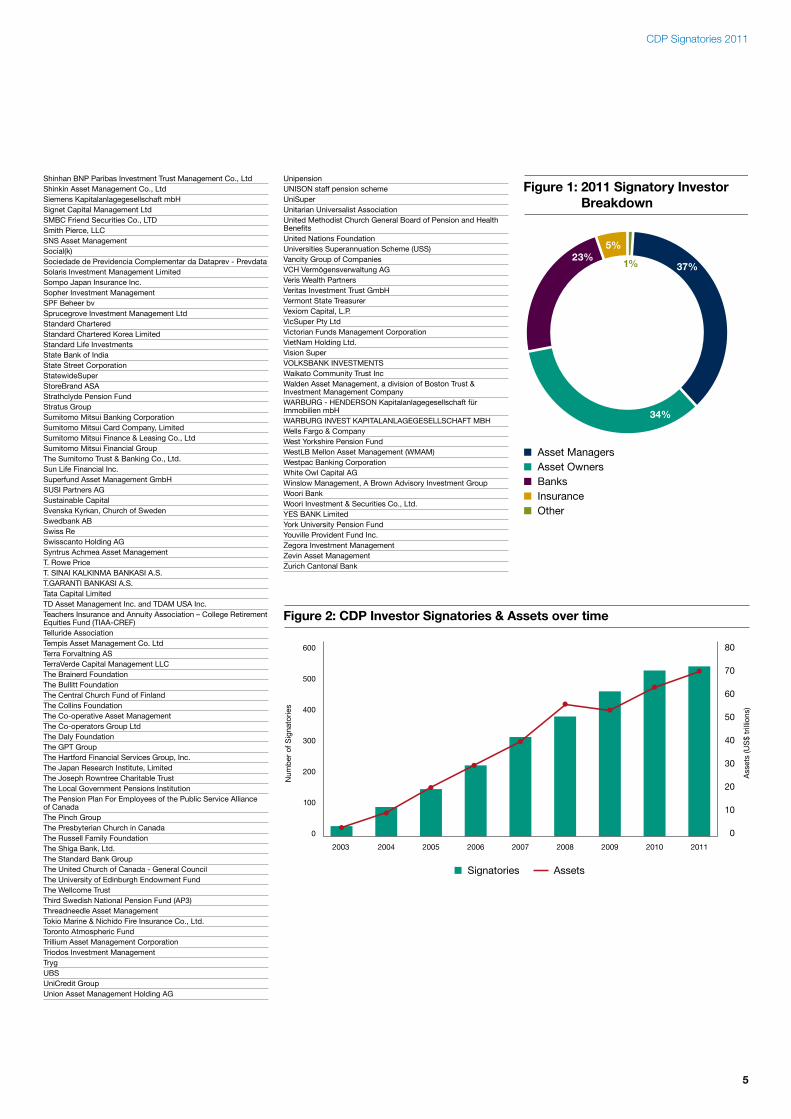
CDP Signatories 2011
Figure 1: 2011 Signatory Investor Breakdown
Asset ManagersAsset OwnersBanksInsuranceOther
1% 37%
5%23%
34%
Figure 2: CDP Investor Signatories & Assets over time
600
500
400
300
200
100
0
80
70
60
50
40
30
20
10
0
Num
ber
of S
igna
torie
s
Ass
ets
(US
$ tr
illio
ns)
Signatories Assets
2003 2004 2005 2006 2007 2008 2009 2010 2011

6
7
2011 Carbon Disclosure Project 2Investor Members
2011 Carbon Disclosure Project 3Investor Signatories
CEO Foreword 8
Accenture Foreword 9
Executive Summary 10
Key Themes 12
Analysis of Responses 15
2011 Carbon Leaders 17
Results 23
Appendix I: 36Table of emissions
Appendix II: 41Key trends
Appendix III: 43Investor CDP request 2011
Contents
8
Corporations, investors and governments today are faced with a choice: to compete aggressively for finite resources, or to advance towards a low carbon economy that enables sustainable, profitable growth, whilst reducing reliance on increasingly scarce materials.
Last year, global energy-related carbon dioxide emissions reached a record high. The International Energy Agency’s estimates made for bleak reading but compounded the necessity to take bold and decisive action if we are to have any chance of limiting temperature increase to the 2°C level agreed by world leaders to protect against catastrophic climate change.
What’s more, rising energy demands are competing for a limited supply of fossil fuels. The competition for increasingly scarce natural resources is putting pressure on commodity prices and having a growing impact both socially and economically. It is clear that today, more than ever, we must build momentum to decouple economic growth from emissions.
Managing carbon emissions and protecting business from climate change impacts are fundamental to achieving sustainable and strong shareholder returns. Earlier this year, the investment consultancy Mercer released a report concluding that the best way for institutional investors to manage portfolio risk associated with climate change may be to shift 40% of their portfolios into climate-sensitive assets with an emphasis on those that can adapt to a low carbon environment.
An important part of investors’ strategy should be to engage with the companies in which they invest to encourage performance improvement. Carbon Action is a new initiative launched by CDP this year. It is driven by a leading group of investors to encourage their portfolio companies to reduce emissions by investing in emissions’ reduction activities with a satisfactory payback period. Carbon Action reflects a growing recognition that there is a huge range of carbon reduction activities that companies can undertake and which have a very clear business case. It is therefore in the interests of all investors, and not just the more active owners of investments, to ensure these actions are taken.
As the management of carbon continues to move into companies’ core business strategies and mainstream investment thinking, demand for primary corporate climate change information grows around the world. As well as working on behalf of 551 institutional investors to gather relevant information from large corporations around the world, CDP is also working with global businesses and governments to strengthen the resilience and sustainability of their supply chains through the CDP Supply Chain program. CDP Cities has been launched to help the world’s major cities reduce climate change risk and bolster economic growth, whilst CDP Water Disclosure is now in its second year of working with major global companies to improve water management. A key part of CDP’s strategy is to ensure the effective use of data collected. To assist with this companies are able to obtain tools that help them to measure, report and manage carbon more effectively through CDP Reporter Services.
It is through partnerships that CDP can achieve the greatest impact. In Italy we are delighted to be working with our local partners: Accenture SpA, Banca Monte dei Paschi di Siena and Kyoto Club. In addition, we highly value the continued support of our Global Advisor, PwC, as well as that of Accenture, Microsoft, SAP and Bloomberg. These and our other partners around the world are integral to the acceleration of CDP’s mission.
Whilst we wait patiently for much needed global regulation, business must continue to forge ahead, innovate and seek out opportunities by doing more with less. The decisions that perpetuate a legitimate, low carbon and high growth economy will bring considerable value to those who have the foresight to make them. The information contained in this report and the companies’ responses assist in illuminating that path.
Paul SimpsonCEOCarbon Disclosure Project
CEO Foreword
CEO Foreword
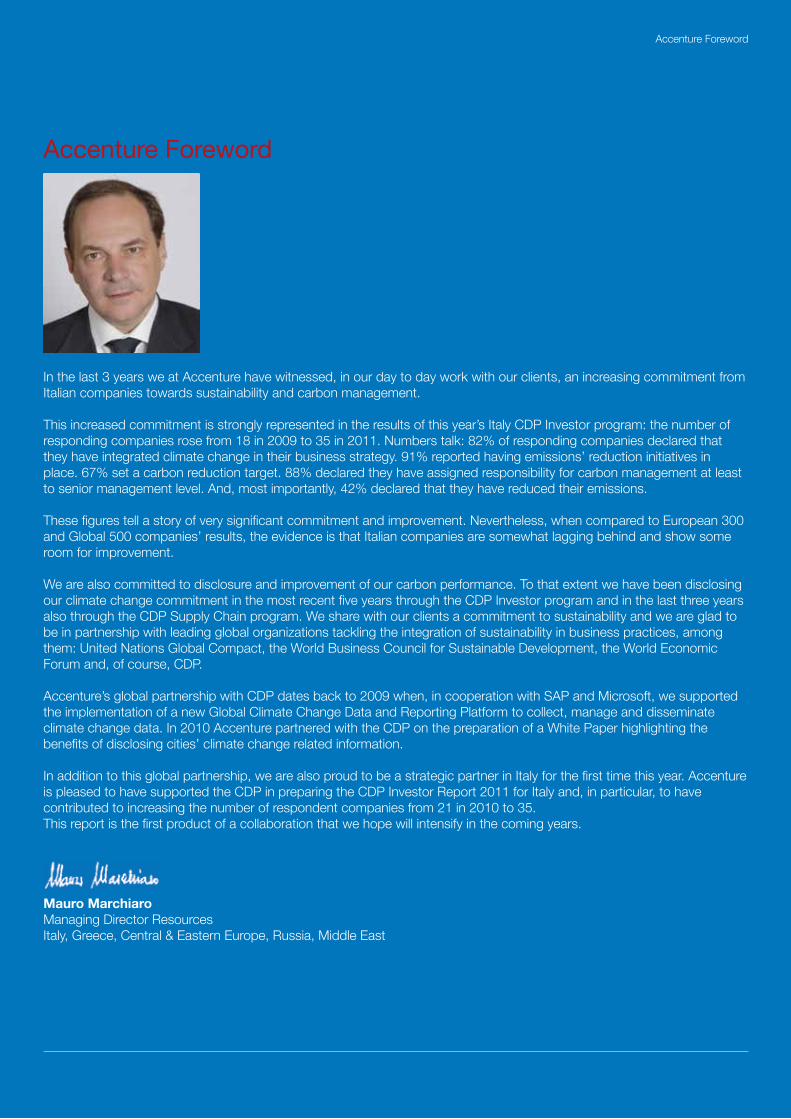
9
In the last 3 years we at Accenture have witnessed, in our day to day work with our clients, an increasing commitment from Italian companies towards sustainability and carbon management.
This increased commitment is strongly represented in the results of this year’s Italy CDP Investor program: the number of responding companies rose from 18 in 2009 to 35 in 2011. Numbers talk: 82% of responding companies declared that they have integrated climate change in their business strategy. 91% reported having emissions’ reduction initiatives in place. 67% set a carbon reduction target. 88% declared they have assigned responsibility for carbon management at least to senior management level. And, most importantly, 42% declared that they have reduced their emissions.
These figures tell a story of very significant commitment and improvement. Nevertheless, when compared to European 300 and Global 500 companies’ results, the evidence is that Italian companies are somewhat lagging behind and show some room for improvement.
We are also committed to disclosure and improvement of our carbon performance. To that extent we have been disclosing our climate change commitment in the most recent five years through the CDP Investor program and in the last three years also through the CDP Supply Chain program. We share with our clients a commitment to sustainability and we are glad to be in partnership with leading global organizations tackling the integration of sustainability in business practices, among them: United Nations Global Compact, the World Business Council for Sustainable Development, the World Economic Forum and, of course, CDP.
Accenture’s global partnership with CDP dates back to 2009 when, in cooperation with SAP and Microsoft, we supported the implementation of a new Global Climate Change Data and Reporting Platform to collect, manage and disseminate climate change data. In 2010 Accenture partnered with the CDP on the preparation of a White Paper highlighting the benefits of disclosing cities’ climate change related information.
In addition to this global partnership, we are also proud to be a strategic partner in Italy for the first time this year. Accenture is pleased to have supported the CDP in preparing the CDP Investor Report 2011 for Italy and, in particular, to have contributed to increasing the number of respondent companies from 21 in 2010 to 35. This report is the first product of a collaboration that we hope will intensify in the coming years.
Mauro Marchiaro Managing Director ResourcesItaly, Greece, Central & Eastern Europe, Russia, Middle East
Accenture Foreword
Accenture Foreword
10
Executive Summary
CDP overview
CDP is an independent not-for-profit organization that has been working, since 2000, to collect companies’ data on climate change strategy, GHG emissions’ disclosure and water use. The CDP was founded to put information on companies’ climate change strategies and GHG emissions management at the heart of financial and policy decision-making. The authority behind CDP’s information request lies in its list of investor signatories which has grown from 35 investors with assets of US$4.5 trillion under management in 2003 to 551 in 2011 with assets of US$71 trillion under management.
CDP conveys the information to its 551 investor signatories, as well as distributing it throughout the global market place, both to increase transparency around climate-related investment risk and commercial opportunity and to drive investment towards a low carbon economy. In order to better assess and compare companies’ responses, CDP developed a methodology that scores companies on the quality of their disclosure and performance on actions they take to mitigate climate change. The highest scoring companies per sample are recognized in two indexes: the Carbon Disclosure Leadership Index (CDLI) and the Carbon Performance Leadership Index (CPLI). In 2011 more than 3,000 companies have been scored according to the CDP methodology, making CDP the largest existing database for corporate climate data.
CDP 2011 in Italy
This report will especially focus on carbon measurement and reporting - the crucial first steps towards carbon management and the backbone to any robust and credible carbon strategy - and emission reduction initiatives.
The Italian companies invited to respond to CDP 2011 are the 100 largest companies, by market capitalization, on the Italian stock exchange. The first country specific report was published in 2008 with responses from 18 companies, managing more than 220 MtCO2e. The current report represents the management of almost 258 MtCO2e (Scope 1 emissions) from 35 companies.
Companies were scored according to the CDP methodology explained in the CDP 2011 Reporting Guidance and available to all through the CDP website. Kyoto Club is the scorer for the Italy 100 sample.
Overview of results
The number of Italian companies responding to CDP has increased significantly, from 21 in 2010 to 35 in 2011. The increased number of respondents of course adds value to the overall results, making the sample more representative. Nevertheless the response rate (35%) has not increased. The highest response rate in the Italy 100 sample comes from the Utility sector followed by the Energy, Materials and Telecommunications sectors.
Management
Most companies declare that climate change has been integrated into the fundamental pillars of management: overall strategy, risk management and employees’ reward. Responsibility for climate change management is assigned, in almost all responding companies (29), at least to senior management level, proving that basic sustainability practices such as carbon reporting are becoming integrated into the way business is done, both strategically and operationally. One of the questions in the CDP 2011 asks whether climate change is integrated in business strategy: 82% (27) of companies responding answered in the affirmative.
Calculation and reporting of carbon emissions have become common practice, but only few companies provide data on non CO2 GHG emissions. Third party verification/assurance has also become common: 24 companies have some verification on Scope 1 emissions.
Companies in the Italy 100 sample report almost 258 MtCO2e of Scope 1 emissions and almost 11 MtCO2e of Scope 2 emissions. Both values are in line with last year (249 MtCO2e for Scope 1 and 9.5 MtCO2e for Scope 2). Scope 3 emissions count for about 300 MtCO2e, 10% less than last year.
As far as performance is concerned, responding companies are almost equally divided between those which succeeded in decreasing their emissions and those whose emissions increased in 2011. When significant decreases have been reported these are in most cases the result of specific reduction initiatives, while increases are due to changes in both company reporting and system boundaries. 91% (30) of responding companies reported having emissions’ reduction initiatives in place. This is higher than the proportion of companies with an emissions reduction target (67%): it seems that the importance of reducing emissions is somehow translated into actions before becoming a formal commitment. 186 emissions’ reduction initiatives (mainly related to energy efficiency, transportation and low carbon energy) have been reported.
Risks and Opportunities
79% (26) of companies consider climate change is a source of opportunities related to regulation, changes in physical parameters and other possible climate-related developments. Regulation is the most important driver for both risks and opportunities. Companies identify more than 250 different risk events related to climate change, with 10 companies – from 5 different sectors – foreseeing
11
the inability to do business at all, as one of them. Of the 178 opportunities identified, the increase in demand for existing products, as well as the creation of new products/ business services, are the two most significant.
Emissions
Only four companies have not published any information on their GHG emissions performance. The norm for the vast majority of responding companies is to disclose their GHG emissions performance in several company documents (such as annual report, regulatory filings and voluntary communications).
A final appraisal of companies’ responses highlights the trend that Italian companies are shifting from the traditional paradigm of considering climate change only as a compliance and risk driven issue, to a new paradigm that regards climate change also as an accelerator of business performance and value creation. Commitment to defining and implementing emissions’ reduction initiatives is very high, as demonstrated by the data. Nevertheless only half of the companies adopt traditional financial analysis and metrics to back up these initiatives and assess their overall financial impact: another sign that a course towards carbon management integration has been set, but there is still work to be done.
CDLI and CPLI overview of results
Ten companies (Ansaldo STS, Banca Monte dei Paschi di Siena, Enel, Eni, Fiat, Fiat Industrials, Finmeccanica, Hera, Terna and UBI Banca) are included in the CDLI for the Italy 100 and two companies (Enel and Fiat) have made CPLI for the Italy 100.
Compared to last year, the average disclosure score for companies in the CDLI has increased (84 in 2011 vs. 80 in 2010), while the average disclosure score among all responding companies is stable (63 both in 2010 and in 2011).
Executive Summary
12
Key ThemesEmanuele Cacciatore – Senior Manager, Accenture
Integrating Sustainability into Business As Usual
82% (27) of Italian companies responding to the CDP 2011 information request reported that they have integrated climate change into core business strategy
Right in the middle of an economic recession, with the European economy struggling to solve the sovereign debt crisis, pressure on organizations to drive corporate action on sustainability issues has not weakened at all. Policy makers, institutional investors and customers are scrutinizing firms’ corporate behavior more carefully than ever, demanding greater accountability and performance from business in providing positive contributions to the economy, society and the environment. Corporations that wish to future proof their business must establish capacity to report coherently to stakeholders on the implications of sustainability for their economic and financial performance. The integration of sustainability into corporate strategy is now a key issue on many CEOs’ agenda.
Results from Accenture 2010 UN Global Compact CEOs Study had already highlighted how the economic downturn has raised the importance of sustainability as a leadership issue for top Italian managers (91% of Italian CEOs interviewed agree on that). 72% stated that the crisis had already led Italian companies to increase alignment of core business strategies with sustainability issues. One of the most eye-catching pieces of evidence from the study was that 100% of CEOs state that sustainability issues should be fully embedded into a company’s strategy and operations. More interestingly still, the gap between statements of intent and actual practice was remarkably low: 82% of respondents, in fact, confirmed that these issues were in reality fully
embedded into the strategy and operations of their companies. It is worth noting that 82% (27) Italian companies responding to the CDP information request in 2011 report that they have integrated climate change into their core business strategy and that they have increased the level of involvement and accountability of senior management in managing climate change related issues. A survey on sustainability performance management, conducted this year by Accenture among leading Italian companies to assess the level of integration of sustainability into business as usual, confirms that management of sustainability has advanced to a significant degree of integration with corporate strategy and strategic direction. That survey also highlighted that well-functioning measurement and surrounding processes have been established, although not yet integrated, into traditional enterprise performance management processes and systems. Emission Reduction Targets and Initiatives
Despite an increase in the absolute number of companies with emissions’ reduction targets, from 16 to 22 in 2011, the percentage of responding companies with emissions’ reduction targets has decreased: 67% (22) of respondents disclose absolute or intensity emission reduction targets, a decrease from 76% of respondents in 2010
67% (22) of responding companies have set an emission reduction target for the current fiscal year, compared to 76% (16) in 2010: this translates to a decrease of 9% from last year. Among those which report reduction targets, 90% of companies have set a target within the next five years. Only A2A, Edison and Unicredit have disclosed reduction targets addressing the next ten years to 2020.
“In Pukrang, Thailand, a waste heat recovery (WHR) system will be built into the current plant structure. Heat recovered from the kiln will be used to generate electricity fed to the grid. An installed capacity of 18MW is foreseen corresponding to a 70 ktonCO2 annual reduction in emissions.”Italcementi
“Even in a context such as the current one, we cannot forget that we must develop our business by acting responsibly, as we know that sustainability is the key to our future and the future of our children. Environmental protection is for us not only a commitment but also a significant business opportunity.”Unicredit Group
13
Absolute targets are marginally more common than intensity targets.
100% (22) of companies reporting reduction targets for the current fiscal year have defined more than one numeric emission reduction target. All companies, in fact, have several targets applying to different business units or with different time horizons.
When considering the underlying data, absolute targets are marginally more common than intensity targets. 45% of targets (set by 10 companies) include absolute emissions’ reductions, while 32% (set by 7 companies) are intensity targets (e.g. relating to production volumes, employees or square metres). The remaining 23% relate to 5 companies that set both absolute and intensity targets.
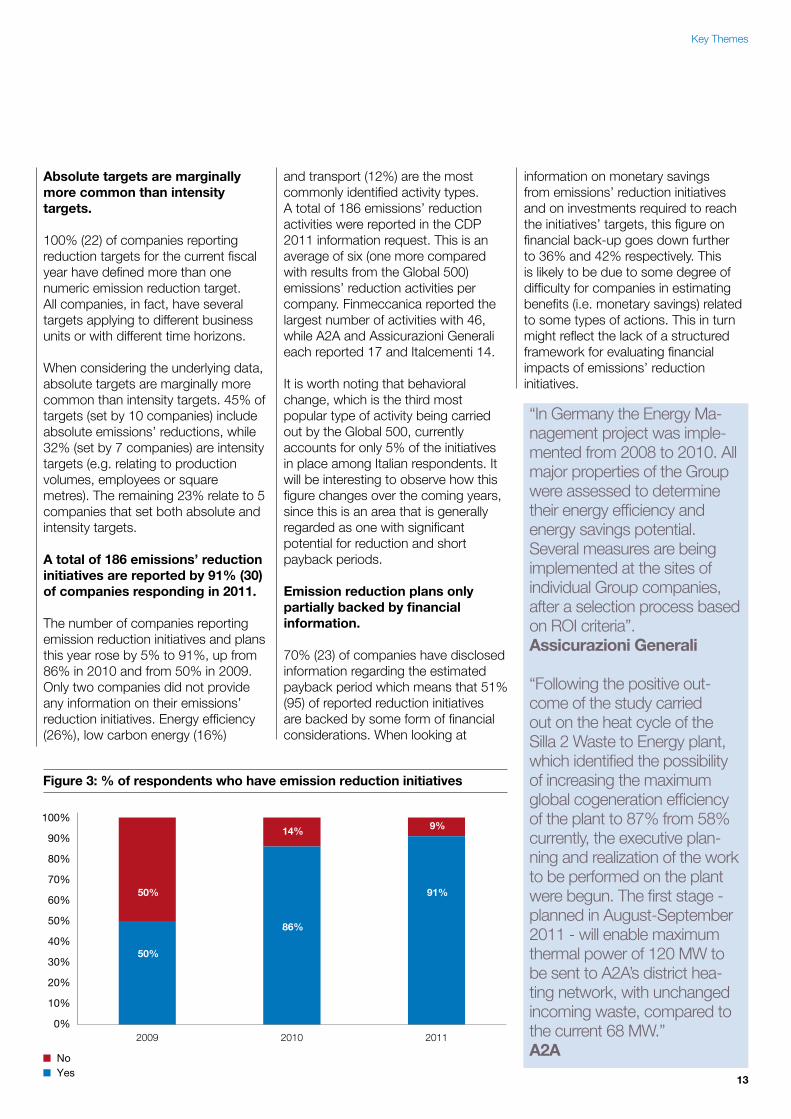
A total of 186 emissions’ reduction initiatives are reported by 91% (30) of companies responding in 2011.
The number of companies reporting emission reduction initiatives and plans this year rose by 5% to 91%, up from 86% in 2010 and from 50% in 2009. Only two companies did not provide any information on their emissions’ reduction initiatives. Energy efficiency (26%), low carbon energy (16%)
and transport (12%) are the most commonly identified activity types. A total of 186 emissions’ reduction activities were reported in the CDP 2011 information request. This is an average of six (one more compared with results from the Global 500) emissions’ reduction activities per company. Finmeccanica reported the largest number of activities with 46, while A2A and Assicurazioni Generali each reported 17 and Italcementi 14.
It is worth noting that behavioral change, which is the third most popular type of activity being carried out by the Global 500, currently accounts for only 5% of the initiatives in place among Italian respondents. It will be interesting to observe how this figure changes over the coming years, since this is an area that is generally regarded as one with significant potential for reduction and short payback periods.
Emission reduction plans only partially backed by financial information.
70% (23) of companies have disclosed information regarding the estimated payback period which means that 51% (95) of reported reduction initiatives are backed by some form of financial considerations. When looking at
information on monetary savings from emissions’ reduction initiatives and on investments required to reach the initiatives’ targets, this figure on financial back-up goes down further to 36% and 42% respectively. This is likely to be due to some degree of difficulty for companies in estimating benefits (i.e. monetary savings) related to some types of actions. This in turn might reflect the lack of a structured framework for evaluating financial impacts of emissions’ reduction initiatives.
“In Germany the Energy Ma-nagement project was imple-mented from 2008 to 2010. All major properties of the Group were assessed to determine their energy efficiency and energy savings potential. Several measures are being implemented at the sites of individual Group companies, after a selection process based on ROI criteria”.Assicurazioni Generali
“Following the positive out-come of the study carried out on the heat cycle of the Silla 2 Waste to Energy plant, which identified the possibility of increasing the maximum global cogeneration efficiency of the plant to 87% from 58% currently, the executive plan-ning and realization of the work to be performed on the plant were begun. The first stage - planned in August-September 2011 - will enable maximum thermal power of 120 MW to be sent to A2A’s district hea-ting network, with unchanged incoming waste, compared to the current 68 MW.”A2A
Figure 3: % of respondents who have emission reduction initiatives
NoYes
50%
50%
2009 2010
14%
86%
2011
9%
91%
100%
90%
80%
70%
60%
50%
40%
30%
20%
10%
0%
Key Themes
14
“Since 2009, Eni has been integrating its financial reporting with a document dedicated to the analysis and reporting of sustainability performance from the previous three years. Sustainability Performance 2010 provides an overall view of Eni’s ESG data and KPIs at group and business sector level for the years 2008-2010, according to the GRI G 3.0 guidelines, and outlines results from 2010 and objectives set for the period 2011-2014, with a special focus on climate change. The data featured refer to Eni SpA and its consolidated companies. The area of con-solidation is the same as that for financial reporting, with the exception of certain data clearly specified in the document.”Eni
“A sustainability section is em-bedded, as in previous years, in the Financial Year Report for 2010.” Telecom Italia
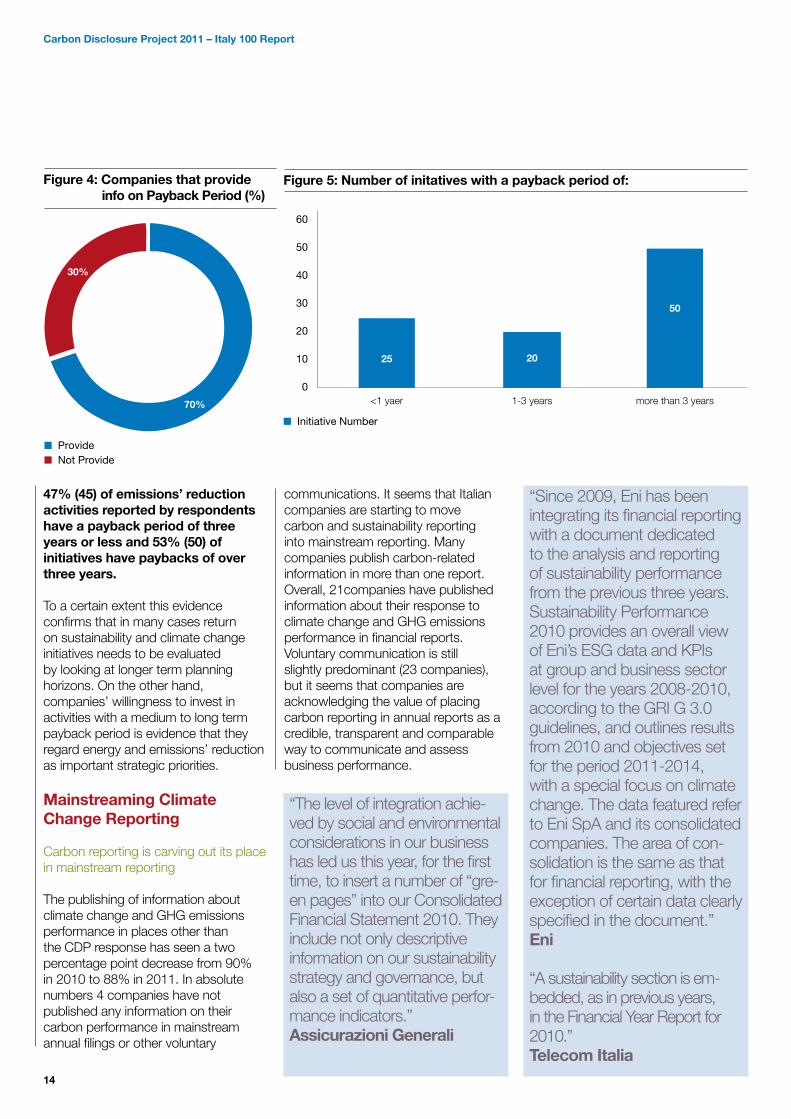
47% (45) of emissions’ reduction activities reported by respondents have a payback period of three years or less and 53% (50) of initiatives have paybacks of over three years.
To a certain extent this evidence confirms that in many cases return on sustainability and climate change initiatives needs to be evaluated by looking at longer term planning horizons. On the other hand, companies’ willingness to invest in activities with a medium to long term payback period is evidence that they regard energy and emissions’ reduction as important strategic priorities.
Mainstreaming Climate Change Reporting
Carbon reporting is carving out its place in mainstream reporting
The publishing of information about climate change and GHG emissions performance in places other than the CDP response has seen a two percentage point decrease from 90% in 2010 to 88% in 2011. In absolute numbers 4 companies have not published any information on their carbon performance in mainstream annual filings or other voluntary
communications. It seems that Italian companies are starting to move carbon and sustainability reporting into mainstream reporting. Many companies publish carbon-related information in more than one report. Overall, 21companies have published information about their response to climate change and GHG emissions performance in financial reports. Voluntary communication is still slightly predominant (23 companies), but it seems that companies are acknowledging the value of placing carbon reporting in annual reports as a credible, transparent and comparable way to communicate and assess business performance.
Figure 4: Companies that provide info on Payback Period (%)
ProvideNot Provide
30%
70%
Figure 5: Number of initatives with a payback period of:
Initiative Number
25
<1 yaer 1-3 years
20
more than 3 years
50
60
50
40
30
20
10
0
Carbon Disclosure Project 2011 – Italy 100 Report
“The level of integration achie-ved by social and environmental considerations in our business has led us this year, for the first time, to insert a number of “gre-en pages” into our Consolidated Financial Statement 2010. They include not only descriptive information on our sustainability strategy and governance, but also a set of quantitative perfor-mance indicators.”Assicurazioni Generali
15
I. Analysis of responses
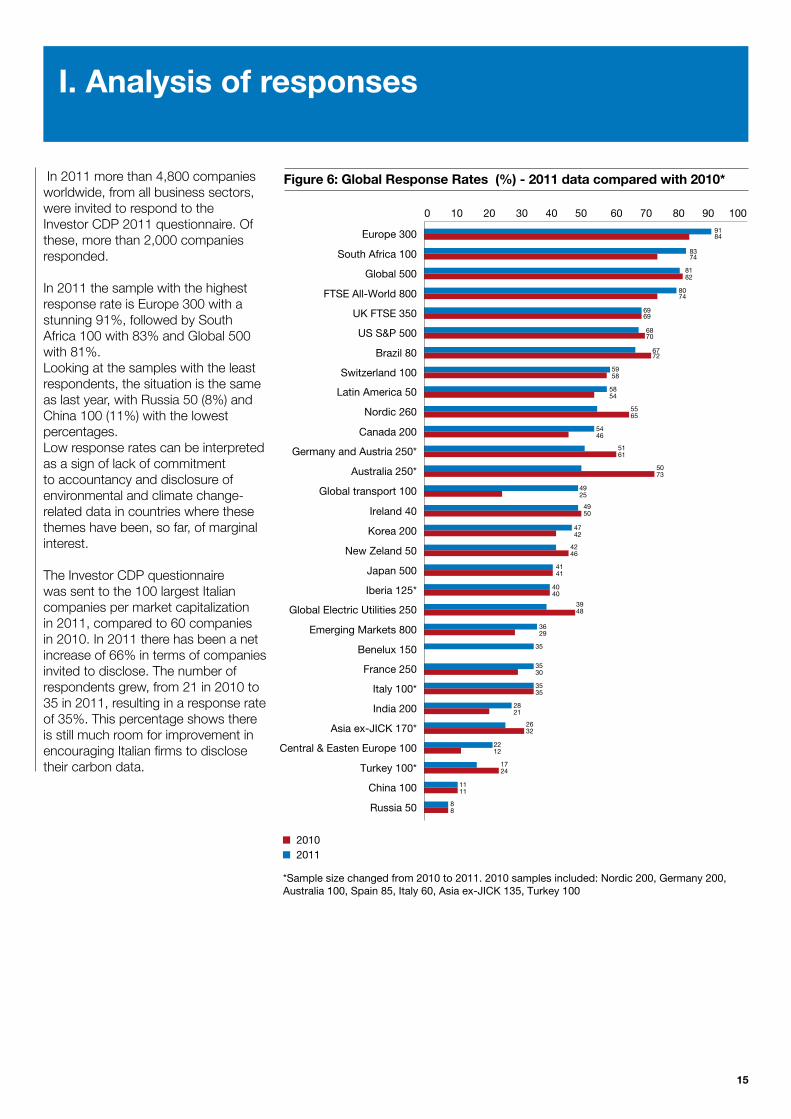
In 2011 more than 4,800 companies worldwide, from all business sectors, were invited to respond to the Investor CDP 2011 questionnaire. Of these, more than 2,000 companies responded.
In 2011 the sample with the highest response rate is Europe 300 with a stunning 91%, followed by South Africa 100 with 83% and Global 500 with 81%. Looking at the samples with the least respondents, the situation is the same as last year, with Russia 50 (8%) and China 100 (11%) with the lowest percentages.Low response rates can be interpreted as a sign of lack of commitment to accountancy and disclosure of environmental and climate change-related data in countries where these themes have been, so far, of marginal interest.
The Investor CDP questionnaire was sent to the 100 largest Italian companies per market capitalization in 2011, compared to 60 companies in 2010. In 2011 there has been a net increase of 66% in terms of companies invited to disclose. The number of respondents grew, from 21 in 2010 to 35 in 2011, resulting in a response rate of 35%. This percentage shows there is still much room for improvement in encouraging Italian firms to disclose their carbon data.
Figure 6: Global Response Rates (%) - 2011 data compared with 2010*
*Sample size changed from 2010 to 2011. 2010 samples included: Nordic 200, Germany 200, Australia 100, Spain 85, Italy 60, Asia ex-JICK 135, Turkey 100
Europe 300
South Africa 100
Global 500
FTSE All-World 800
UK FTSE 350
US S&P 500
Brazil 80
Switzerland 100
Latin America 50
Nordic 260
Canada 200
Germany and Austria 250*
Australia 250*
Global transport 100
Ireland 40
Korea 200
New Zeland 50
Japan 500
Iberia 125*
Global Electric Utilities 250
Emerging Markets 800
Benelux 150
France 250
Italy 100*
India 200
Asia ex-JICK 170*
Central & Easten Europe 100
Turkey 100*
China 100
Russia 50
0 10 20 30 40 50 60 70 80 90 100
9184
8374
8182
8074
6969
6870
6772
5958
5854
5565
5446
5161
5073
4925
4950
4742
4246
4141
4040
3948
3629
35
3530
3535
2821
2632
2212
1724
1111
88
20102011
16
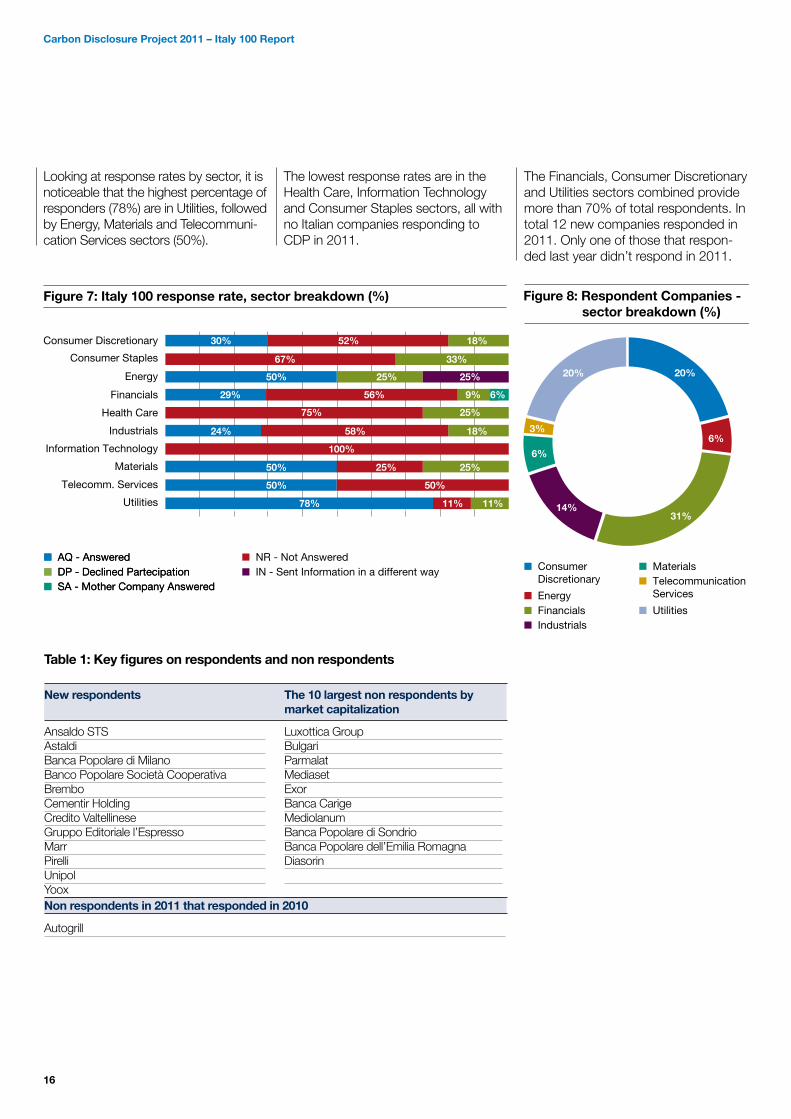
Looking at response rates by sector, it is noticeable that the highest percentage of responders (78%) are in Utilities, followed by Energy, Materials and Telecommuni-cation Services sectors (50%).
The lowest response rates are in the Health Care, Information Technology and Consumer Staples sectors, all with no Italian companies responding to CDP in 2011.
The Financials, Consumer Discretionary and Utilities sectors combined provide more than 70% of total respondents. In total 12 new companies responded in 2011. Only one of those that respon-ded last year didn’t respond in 2011.
Table 1: Key figures on respondents and non respondents
New respondents
Ansaldo STSAstaldiBanca Popolare di MilanoBanco Popolare Società CooperativaBremboCementir HoldingCredito ValtellineseGruppo Editoriale l’EspressoMarrPirelliUnipolYoox
The 10 largest non respondents by market capitalization
Luxottica GroupBulgariParmalatMediasetExorBanca CarigeMediolanumBanca Popolare di SondrioBanca Popolare dell’Emilia RomagnaDiasorin
Non respondents in 2011 that responded in 2010
Autogrill
AQ - AnsweredDP - Declined PartecipationSA - Mother Company Answered
Figure 7: Italy 100 response rate, sector breakdown (%)
AQ - AnsweredDP - Declined PartecipationSA - Mother Company Answered
NR - Not AnsweredIN - Sent Information in a different way
Consumer Staples 67% 33%
Information Technology 100%
Health Care 75% 25%
Utilities 78% 11% 11%
Telecomm. Services 50% 50%
Materials 50% 25% 25%
Industrials 24% 58% 18%
Energy 50% 25% 25%
Consumer Discretionary 30% 52% 18%
Financials 29% 56% 9% 6%
Figure 8: Respondent Companies - sector breakdown (%)
Consumer Discretionary
Energy
20% 20%
6%
31%14%
6%
3%
FinancialsIndustrials
MaterialsTelecommunication Services
Utilities
Carbon Disclosure Project 2011 – Italy 100 Report
17
II. 2011 Carbon leaders
Introduction to the Carbon Disclosure Leadership Index (CDLI) and the Carbon Performance Leadership Index (CPLI)
Each year, company responses are reviewed, analyzed and scored for the quality of disclosure and performance on actions taken to mitigate climate change. This results in a disclosure score and, where sufficient disclosure exists, a performance score.
Disclosure scores • Disclosure scores are anassessment of the quality and completeness of a company’s response; they are not a measure of a company’s performance in relation to climate change management
• Scores are plotted over a 100-point normalized scale
• Companies are assessed based on their level of disclosure of carbon emissions measurement techniques and subsequent public disclosure
• Companies with the highest disclosure scores are listed in the CDLI
Performance bands • Where a company’s disclosure score is 50 or more, its performance in contributing to climate change mitigation, adaptation and transparency is assessed and ranked in a performance band
• In 2011 there are six performance bands (there were four bands in 2010)
• Companies with the highest performance bands that meet additional CPLI criteria are listed in the CPLI
Analysis of the CDLI and CPLI provides insights into the characteristics and common trends among the leading companies on carbon disclosure, and highlights good practices in reporting, governance, risk management, emissions reductions and other areas. Interrelations between the CDLI and CPLI companies are analyzed to determine if those companies with better data use it within the business to drive value adding activities.
“ Fiat is one of the automotive groups most strongly committed to reducing the environmental impacts of transportation: between 2000 and 2010, average CO2 emissions for vehicles sold by Fiat Group Automobiles (FGA) in Europe fell 20%.” Fiat
18
The 2011 Carbon Disclosure Leadership Index (CDLI)
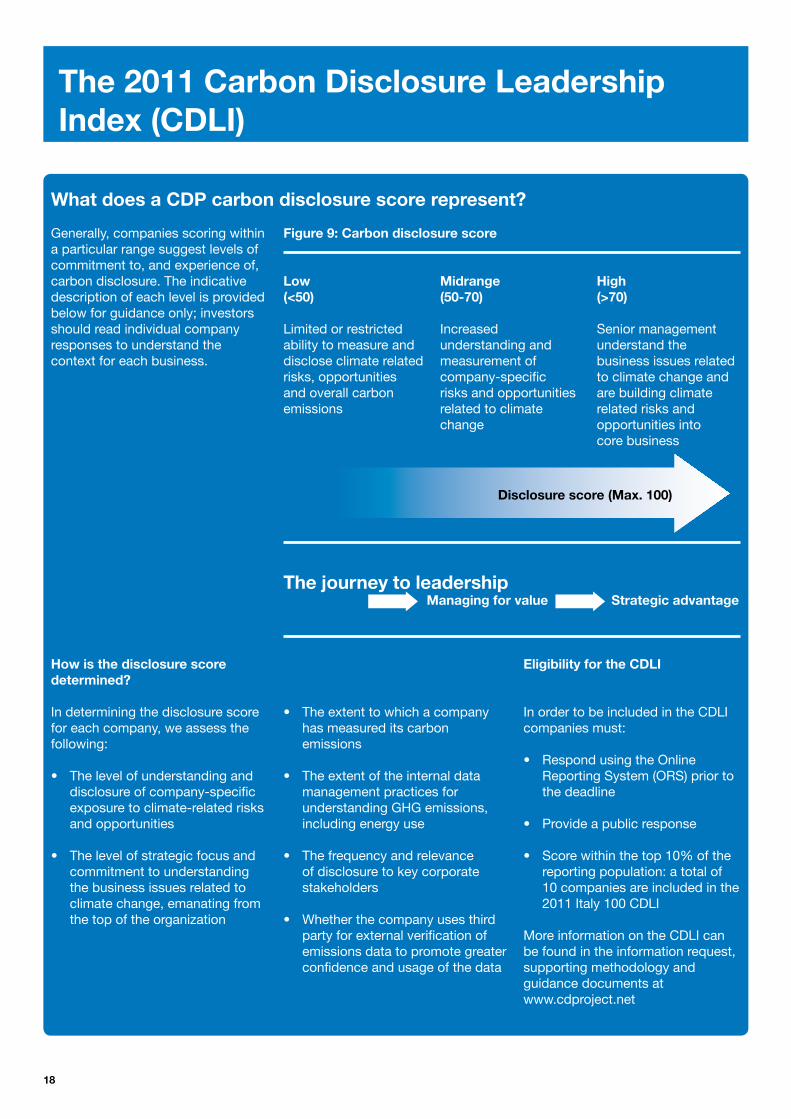
Generally, companies scoring within a particular range suggest levels of commitment to, and experience of, carbon disclosure. The indicative description of each level is provided below for guidance only; investors should read individual company responses to understand the context for each business.
Low (<50)
Limited or restricted ability to measure and disclose climate related risks, opportunities and overall carbon emissions
Midrange (50-70) Increased understanding and measurement of company-specific risks and opportunities related to climate change
High (>70) Senior management understand the business issues related to climate change and are building climate related risks and opportunities into core business
The journey to leadership
Figure 9: Carbon disclosure score
Managing for value Strategic advantage
How is the disclosure score determined?
In determining the disclosure score for each company, we assess the following:
• The level of understanding and disclosure of company-specific exposure to climate-related risks and opportunities
• The level of strategic focus and commitment to understanding the business issues related to climate change, emanating from the top of the organization
• The extent to which a company has measured its carbon emissions
• The extent of the internal data management practices for understanding GHG emissions, including energy use
• The frequency and relevance of disclosure to key corporate stakeholders
• Whether the company uses third party for external verification of emissions data to promote greater confidence and usage of the data
Eligibility for the CDLI
In order to be included in the CDLI companies must:
• Respond using the Online Reporting System (ORS) prior to the deadline
• Provide a public response
• Score within the top 10% of the reporting population: a total of 10 companies are included in the 2011 Italy 100 CDLI
More information on the CDLI can be found in the information request, supporting methodology and guidance documents at www.cdproject.net
What does a CDP carbon disclosure score represent?
Disclosure score (Max. 100)
19
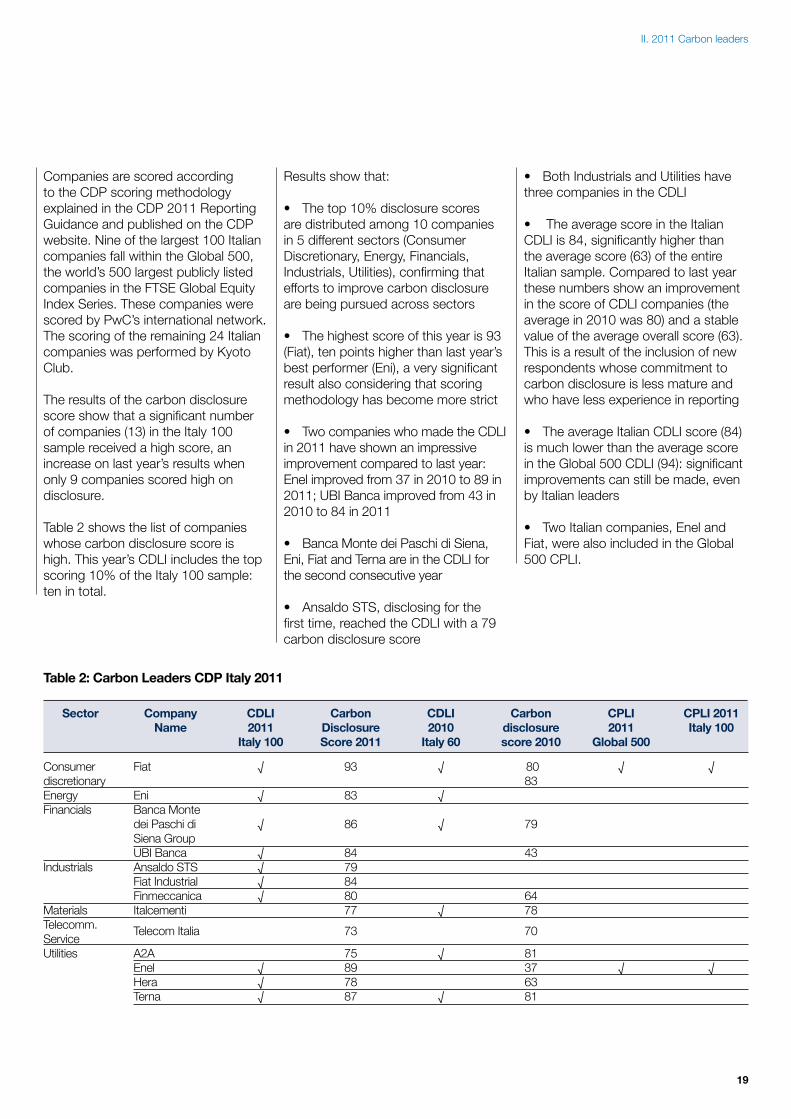
Companies are scored according to the CDP scoring methodology explained in the CDP 2011 Reporting Guidance and published on the CDP website. Nine of the largest 100 Italian companies fall within the Global 500, the world’s 500 largest publicly listed companies in the FTSE Global Equity Index Series. These companies were scored by PwC’s international network. The scoring of the remaining 24 Italian companies was performed by Kyoto Club.
The results of the carbon disclosure score show that a significant number of companies (13) in the Italy 100 sample received a high score, an increase on last year’s results when only 9 companies scored high on disclosure.
Table 2 shows the list of companies whose carbon disclosure score is high. This year’s CDLI includes the top scoring 10% of the Italy 100 sample: ten in total.
Results show that:
• The top 10% disclosure scores are distributed among 10 companies in 5 different sectors (Consumer Discretionary, Energy, Financials, Industrials, Utilities), confirming that efforts to improve carbon disclosure are being pursued across sectors
• The highest score of this year is 93 (Fiat), ten points higher than last year’s best performer (Eni), a very significant result also considering that scoring methodology has become more strict
• Two companies who made the CDLI in 2011 have shown an impressive improvement compared to last year: Enel improved from 37 in 2010 to 89 in 2011; UBI Banca improved from 43 in 2010 to 84 in 2011
• Banca Monte dei Paschi di Siena, Eni, Fiat and Terna are in the CDLI for the second consecutive year
• Ansaldo STS, disclosing for the first time, reached the CDLI with a 79 carbon disclosure score
• Both Industrials and Utilities have three companies in the CDLI
• The average score in the Italian CDLI is 84, significantly higher than the average score (63) of the entire Italian sample. Compared to last year these numbers show an improvement in the score of CDLI companies (the average in 2010 was 80) and a stable value of the average overall score (63). This is a result of the inclusion of new respondents whose commitment to carbon disclosure is less mature and who have less experience in reporting
• The average Italian CDLI score (84) is much lower than the average score in the Global 500 CDLI (94): significant improvements can still be made, even by Italian leaders
• Two Italian companies, Enel and Fiat, were also included in the Global 500 CPLI.
II. 2011 Carbon leaders
Table 2: Carbon Leaders CDP Italy 2011
Sector Company Name
CDLI2011
Italy 100
Carbon Disclosure Score 2011
CDLI2010
Italy 60
Carbon disclosure score 2010
CPLI2011
Global 500
CPLI 2011 Italy 100
Consumer discretionaryEnergyFinancials
Industrials
MaterialsTelecomm. ServiceUtilities
Fiat
EniBanca Monte dei Paschi di Siena GroupUBI BancaAnsaldo STSFiat IndustrialFinmeccanicaItalcementi
Telecom Italia
A2AEnelHeraTerna
√
√ √
√√ √√
√√√
93
83
86
8479 848077
73
75 897887
√
√ √
√
√
√
80 83
79
43
6478
70
8137 6381
√
√
√
√
20
The 2011 Carbon Performance Leadership Index (CPLI)
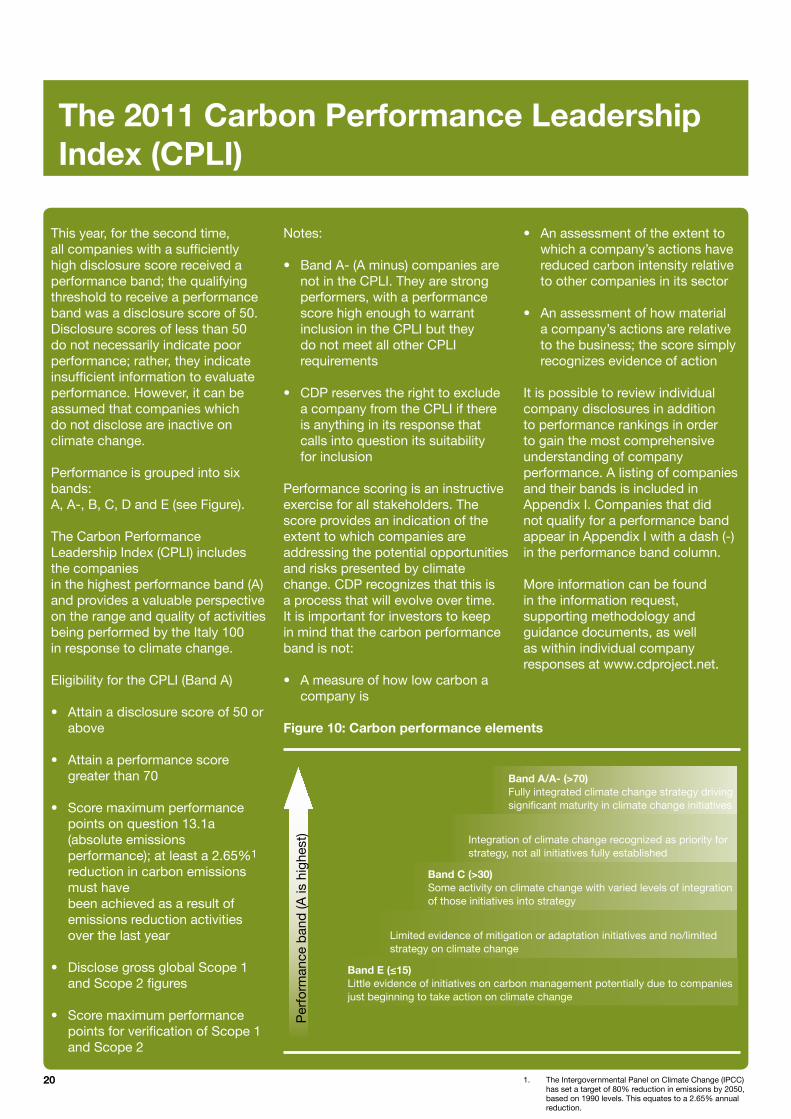
This year, for the second time, all companies with a sufficiently high disclosure score received a performance band; the qualifying threshold to receive a performance band was a disclosure score of 50. Disclosure scores of less than 50 do not necessarily indicate poor performance; rather, they indicate insufficient information to evaluate performance. However, it can be assumed that companies which do not disclose are inactive on climate change.
Performance is grouped into six bands: A, A-, B, C, D and E (see Figure).
The Carbon Performance Leadership Index (CPLI) includes the companies in the highest performance band (A) and provides a valuable perspective on the range and quality of activities being performed by the Italy 100 in response to climate change.
Eligibility for the CPLI (Band A) • Attain a disclosure score of 50 or
above
• Attain a performance score greater than 70
• Score maximum performance points on question 13.1a (absolute emissions performance); at least a 2.65%1
reduction in carbon emissions must have been achieved as a result of emissions reduction activities over the last year
• Disclose gross global Scope 1 and Scope 2 figures
• Score maximum performance
points for verification of Scope 1 and Scope 2
Notes:
• Band A- (A minus) companies are not in the CPLI. They are strong performers, with a performance score high enough to warrant inclusion in the CPLI but they do not meet all other CPLI requirements
• CDP reserves the right to exclude a company from the CPLI if there is anything in its response that calls into question its suitability for inclusion
Performance scoring is an instructive exercise for all stakeholders. The score provides an indication of the extent to which companies are addressing the potential opportunities and risks presented by climate change. CDP recognizes that this is a process that will evolve over time. It is important for investors to keep in mind that the carbon performance band is not:
• A measure of how low carbon a company is
• An assessment of the extent to which a company’s actions have reduced carbon intensity relative to other companies in its sector
• An assessment of how material a company’s actions are relative to the business; the score simply recognizes evidence of action
It is possible to review individual company disclosures in addition to performance rankings in order to gain the most comprehensive understanding of company performance. A listing of companies and their bands is included in Appendix I. Companies that did not qualify for a performance band appear in Appendix I with a dash (-) in the performance band column.
More information can be found in the information request, supporting methodology and guidance documents, as well as within individual company responses at www.cdproject.net.
Figure 10: Carbon performance elements
Per
form
ance
ban
d (A
is h
ighe
st)
Band A/A- (>70)Fully integrated climate change strategy driving significant maturity in climate change initiatives
Integration of climate change recognized as priority for strategy, not all initiatives fully established
Band C (>30)Some activity on climate change with varied levels of integration of those initiatives into strategy
Limited evidence of mitigation or adaptation initiatives and no/limited strategy on climate change
Band E (≤15)Little evidence of initiatives on carbon management potentially due to companies just beginning to take action on climate change
1. The Intergovernmental Panel on Climate Change (IPCC) has set a target of 80% reduction in emissions by 2050, based on 1990 levels. This equates to a 2.65% annual reduction.
21
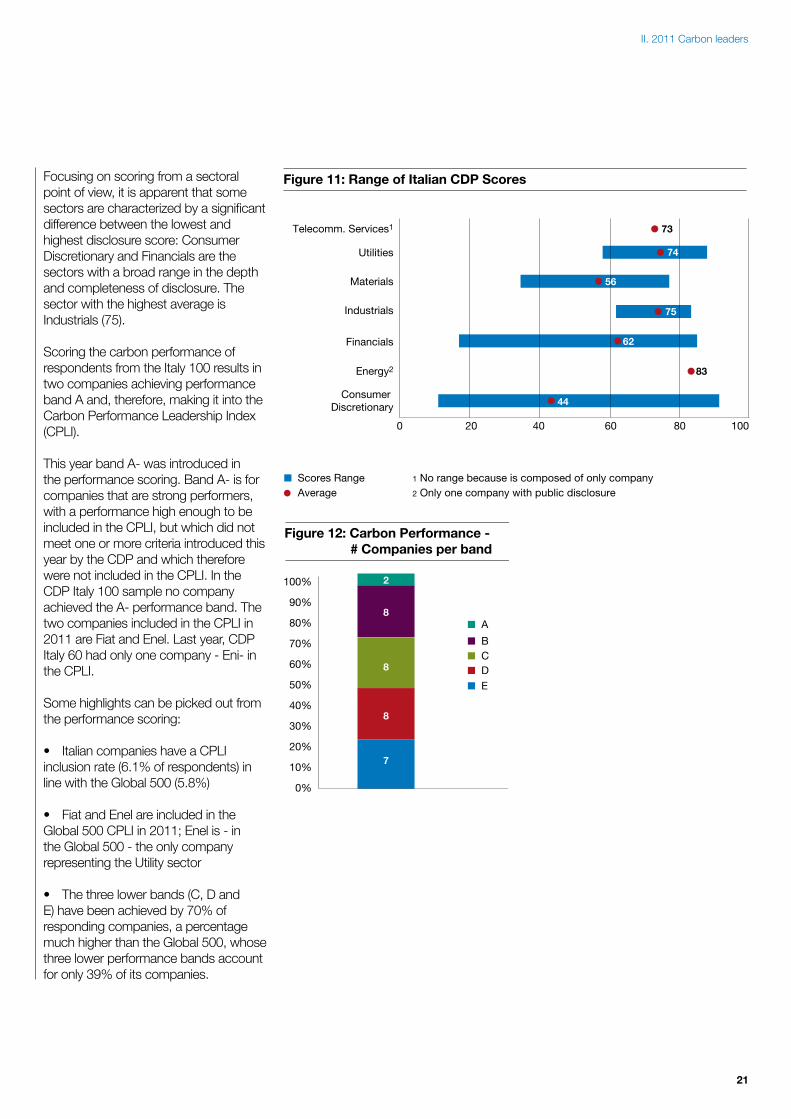
Focusing on scoring from a sectoral point of view, it is apparent that some sectors are characterized by a significant difference between the lowest and highest disclosure score: Consumer Discretionary and Financials are the sectors with a broad range in the depth and completeness of disclosure. The sector with the highest average is Industrials (75).
Scoring the carbon performance of respondents from the Italy 100 results in two companies achieving performance band A and, therefore, making it into the Carbon Performance Leadership Index (CPLI).
This year band A- was introduced in the performance scoring. Band A- is for companies that are strong performers, with a performance high enough to be included in the CPLI, but which did not meet one or more criteria introduced this year by the CDP and which therefore were not included in the CPLI. In the CDP Italy 100 sample no company achieved the A- performance band. The two companies included in the CPLI in 2011 are Fiat and Enel. Last year, CDP Italy 60 had only one company - Eni- in the CPLI.
Some highlights can be picked out from the performance scoring:
• Italian companies have a CPLI inclusion rate (6.1% of respondents) in line with the Global 500 (5.8%)
• Fiat and Enel are included in the Global 500 CPLI in 2011; Enel is - in the Global 500 - the only company representing the Utility sector
• The three lower bands (C, D and E) have been achieved by 70% of responding companies, a percentage much higher than the Global 500, whose three lower performance bands account for only 39% of its companies.
Figure 11: Range of Italian CDP Scores
Scores RangeAverage
Telecomm. Services1
Utilities
Materials
Industrials
Financials
Energy2
Consumer Discretionary
1 No range because is composed of only company
0 20 40 60 80 100
73
74
56
75
62
83
44
2 Only one company with public disclosure
7
8
8
8
2
Figure 12: Carbon Performance - # Companies per band
A
BCDE
100%
90%
80%
70%
60%
50%
40%
30%
20%
10%
0%
II. 2011 Carbon leaders
22
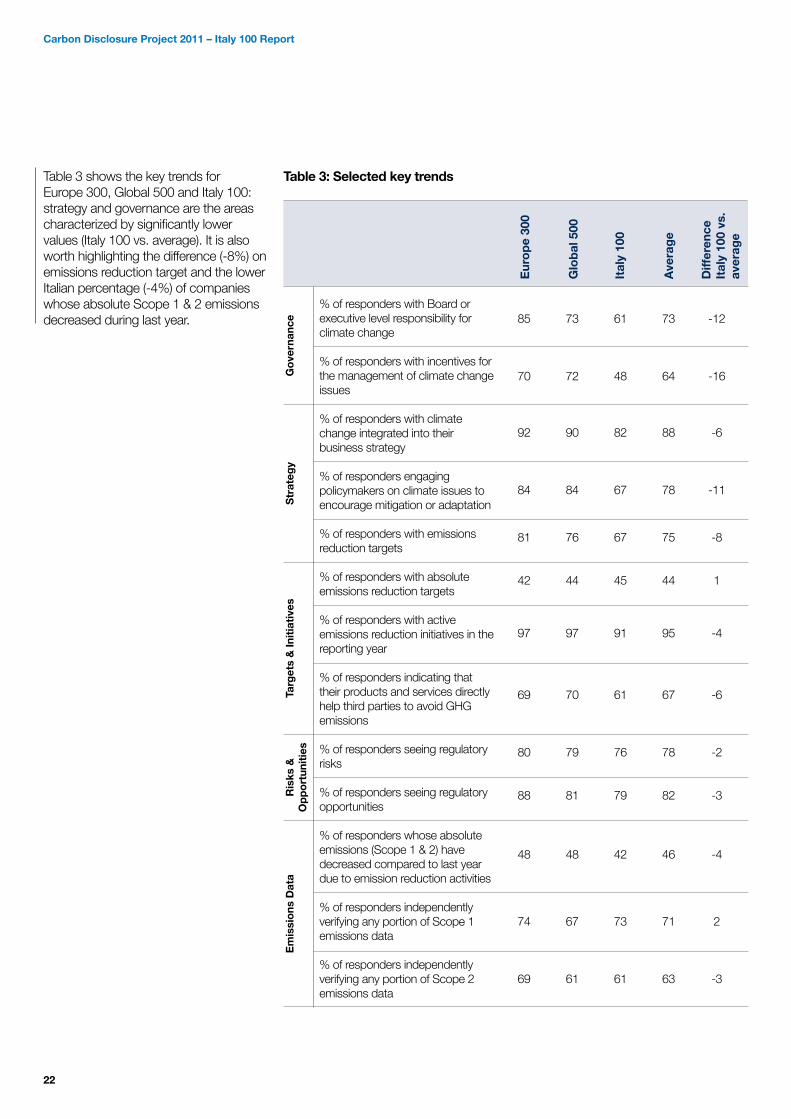
Table 3 shows the key trends for Europe 300, Global 500 and Italy 100: strategy and governance are the areas characterized by significantly lower values (Italy 100 vs. average). It is also worth highlighting the difference (-8%) on emissions reduction target and the lower Italian percentage (-4%) of companies whose absolute Scope 1 & 2 emissions decreased during last year.
Table 3: Selected key trends
% of responders with Board or executive level responsibility for climate change
% of responders with incentives for the management of climate change issues
% of responders with climate change integrated into their business strategy
% of responders engaging policymakers on climate issues to encourage mitigation or adaptation
% of responders with emissions reduction targets
% of responders with absolute emissions reduction targets
% of responders with active emissions reduction initiatives in the reporting year
% of responders indicating that their products and services directly help third parties to avoid GHG emissions
% of responders seeing regulatory risks
% of responders seeing regulatory opportunities
% of responders whose absolute emissions (Scope 1 & 2) have decreased compared to last year due to emission reduction activities
% of responders independently verifying any portion of Scope 1 emissions data
% of responders independently verifying any portion of Scope 2 emissions data
85
70
92
84
81
42
97
69
80
88
48
74
69
73
72
90
84
76
44
97
70
79
81
48
67
61
61
48
82
67
67
45
91
61
76
79
42
73
61
73
64
88
78
75
44
95
67
78
82
46
71
63
-12
-16
-6
-11
-8
1
-4
-6
-2
-3
-4
2
-3
Eur
op
e 30
0
Glo
bal
500
Ital
y 10
0
Ave
rag
e
Diff
eren
ce
Ital
y 10
0 vs
. av
erag
e
Go
vern
ance
Str
ateg
yTa
rget
s &
Init
iati
ves
Ris
ks &
Op
po
rtun
itie
sE
mis
sio
ns D
ata
Carbon Disclosure Project 2011 – Italy 100 Report
23
III. Results
This section of the report focuses on the company responses to the questionnaire. The 2011 questionnaire is made up of three main sections:
• Management (including governance, strategy, targets, initiatives and communications);
• Risks and opportunities (including physical, regulatory and other risks and opportunities related to climate change);
• Emissions (including reporting methodology, emissions data and performance and emissions’ trading)
The CDP 2011 questionnaire has changed compared to last year. It now includes questions, among others, on the payback period of emissions’ reduction initiatives, as well as the expected magnitude of impact on company business of risks and opportunities related to climate change.
As hereafter presented, many aspects of carbon management are included in the request for information. The data provided by companies in their responses helps painting a very interesting picture of how climate change is being addressed in all its aspects by companies.
Management
Regulatory uncertainty, over future developments in international agreements on emissions’ reduction, is still a restraint on companies’ long term decision making. It has to be said, however, that with or without agreement on an international framework over the next year or so, the likelihood is high that policymakers in most developed economies — and even in some developing countries — will adopt national GHG emissions targets and implement them through policies and regulations. This helps to explain why, despite the uncertainty, companies’ initiatives, investments and reporting standards have gone far
beyond mandatory requirements.The first step to emissions’ management is governance design and definition of responsibilities for issues related to climate change. 29 companies out of 332 have assigned the highest level of responsibility for climate change at least senior management level. This is in line with last year. Whilst senior management is identified as ultimately responsible for climate change, they are in only a few companies also entitled to benefit from incentives for the attainment of GHG targets. These incentives, set by 48% (16) responding companies, are mainly for energy and sustainability managers and the management group. In most of these cases (93%) incentives are set as monetary rewards. This figure is very important, as setting incentives around climate change targets is a very strong sign from a company to its employees and can act as a strong push to take action. The number of companies that set incentives increased from 12 in 2010 to 16 in 2011; yet the percentage has decreased significantly (57% in 2010 vs. 48% in 2011). Integration of climate change in companies’ processes is a common practice emerging from CDP 2011 data: 61% of respondents define their climatechange risk management process as integrated into multi-disciplinary
company-wide risk assessment. An even higher percentage (82%) declare climate change is integrated in their business strategy. 67% (22) of responding companies, exactly the same percentage as last year, engage with policy makers on possible responses to climate change.
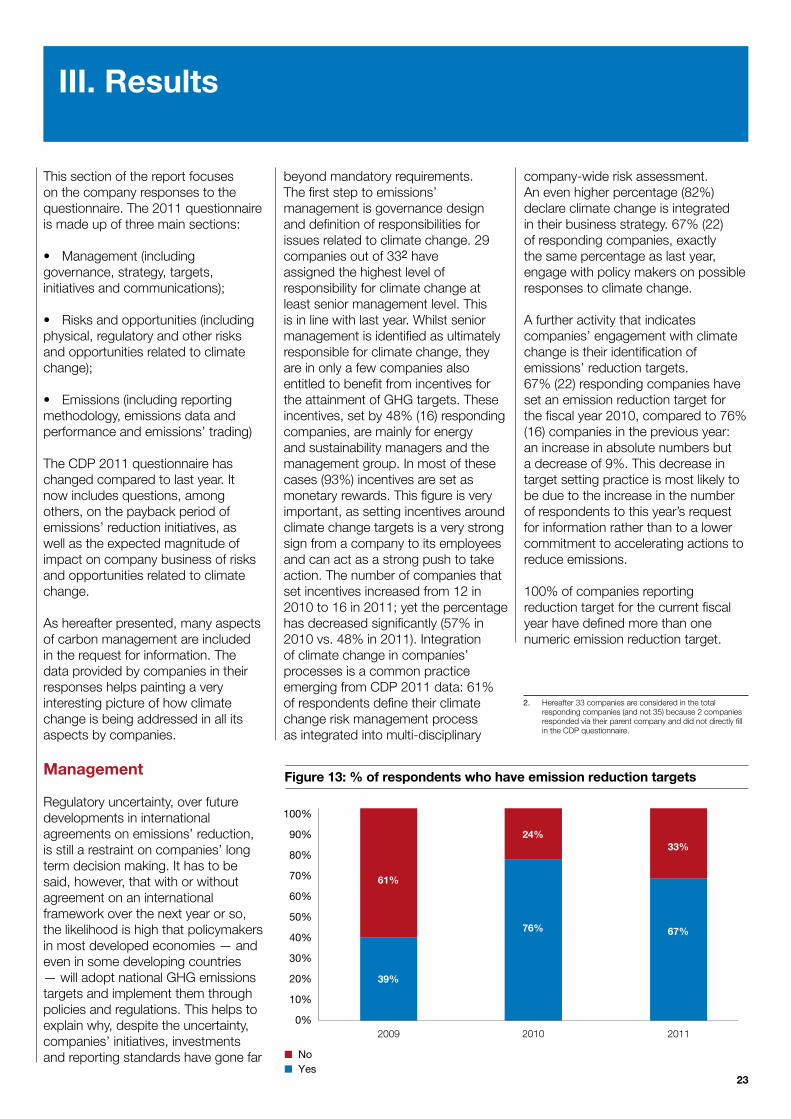
A further activity that indicates companies’ engagement with climate change is their identification of emissions’ reduction targets. 67% (22) responding companies have set an emission reduction target for the fiscal year 2010, compared to 76% (16) companies in the previous year: an increase in absolute numbers but a decrease of 9%. This decrease in target setting practice is most likely to be due to the increase in the number of respondents to this year’s request for information rather than to a lower commitment to accelerating actions to reduce emissions.
100% of companies reporting reduction target for the current fiscal year have defined more than one numeric emission reduction target.
Figure 13: % of respondents who have emission reduction targets
NoYes
61%
39%
2009 2010
24%
76%
2011
33%
67%
100%
90%
80%
70%
60%
50%
40%
30%
20%
10%
0%
2. Hereafter 33 companies are considered in the total responding companies (and not 35) because 2 companies responded via their parent company and did not directly fill in the CDP questionnaire.
24
All companies, in fact, have several targets applying to different business units or with different time horizons.
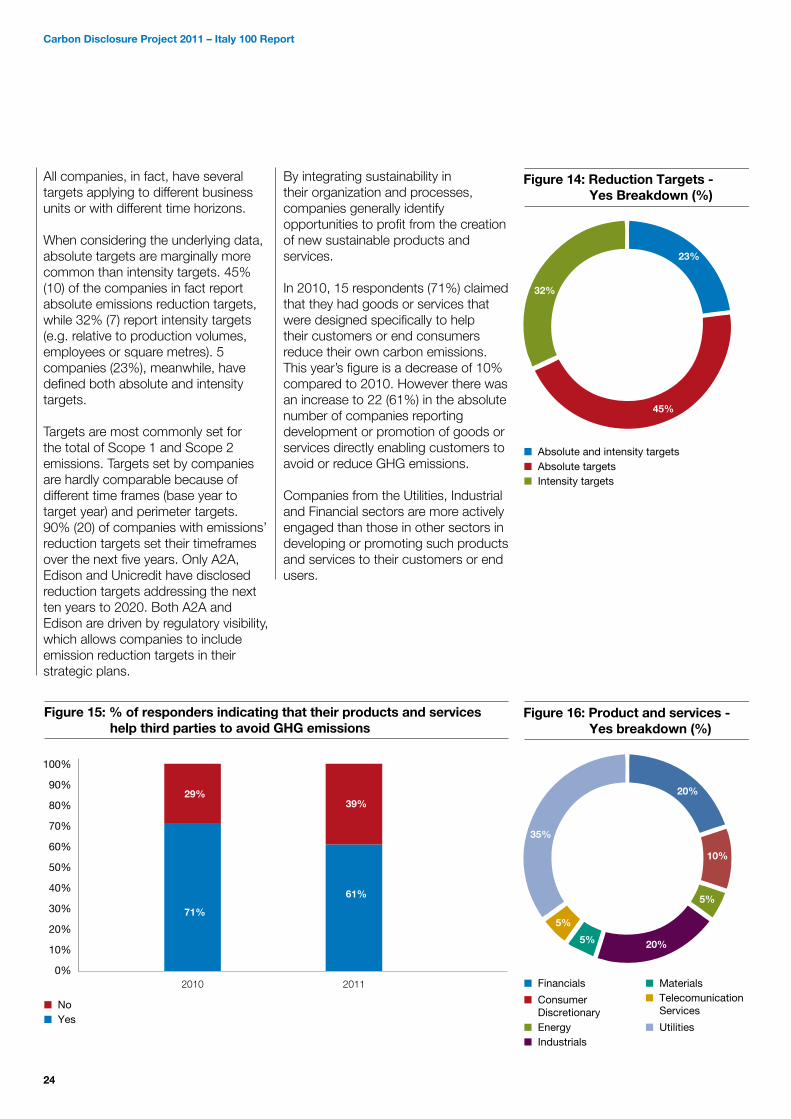
When considering the underlying data, absolute targets are marginally more common than intensity targets. 45% (10) of the companies in fact report absolute emissions reduction targets, while 32% (7) report intensity targets (e.g. relative to production volumes, employees or square metres). 5 companies (23%), meanwhile, have defined both absolute and intensity targets.
Targets are most commonly set for the total of Scope 1 and Scope 2 emissions. Targets set by companies are hardly comparable because of different time frames (base year to target year) and perimeter targets. 90% (20) of companies with emissions’ reduction targets set their timeframes over the next five years. Only A2A, Edison and Unicredit have disclosed reduction targets addressing the next ten years to 2020. Both A2A and Edison are driven by regulatory visibility, which allows companies to include emission reduction targets in their strategic plans.
By integrating sustainability in their organization and processes, companies generally identify opportunities to profit from the creation of new sustainable products and services.
In 2010, 15 respondents (71%) claimed that they had goods or services that were designed specifically to help their customers or end consumers reduce their own carbon emissions. This year’s figure is a decrease of 10% compared to 2010. However there was an increase to 22 (61%) in the absolute number of companies reporting development or promotion of goods or services directly enabling customers to avoid or reduce GHG emissions.
Companies from the Utilities, Industrial and Financial sectors are more actively engaged than those in other sectors in developing or promoting such products and services to their customers or end users.
Figure 14: Reduction Targets - Yes Breakdown (%)
32%
23%
45%
Absolute and intensity targetsAbsolute targetsIntensity targets
Figure 15: % of responders indicating that their products and services help third parties to avoid GHG emissions
NoYes
29%
71%
2010 2011
39%
61%
100%
90%
80%
70%
60%
50%
40%
30%
20%
10%
0%
Figure 16: Product and services - Yes breakdown (%)
Consumer Discretionary
Financials
35%
20%
10%
5%
20%5%
5%
Energy Industrials
MaterialsTelecomunication Services
Utilities
Carbon Disclosure Project 2011 – Italy 100 Report
25
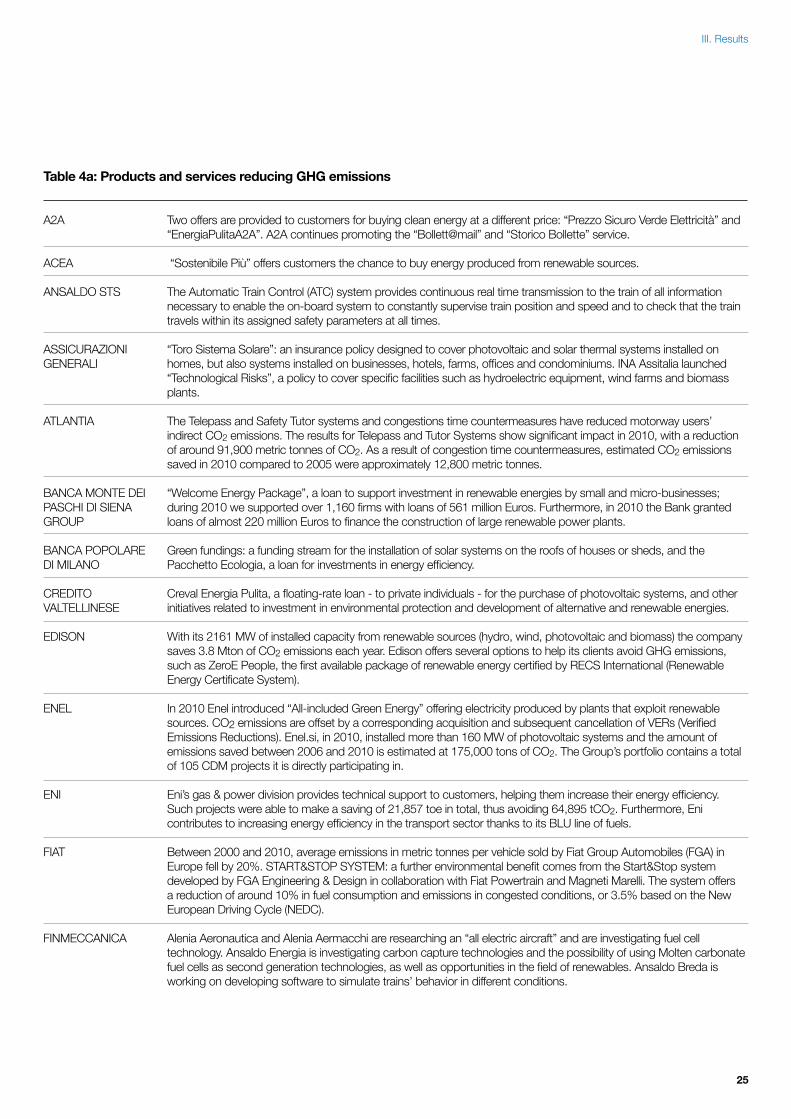
Table 4a: Products and services reducing GHG emissions
A2A Two offers are provided to customers for buying clean energy at a different price: “Prezzo Sicuro Verde Elettricità” and “EnergiaPulitaA2A”. A2A continues promoting the “Bollett@mail” and “Storico Bollette” service.
ACEA “Sostenibile Più” offers customers the chance to buy energy produced from renewable sources.
ANSALDO STS The Automatic Train Control (ATC) system provides continuous real time transmission to the train of all information necessary to enable the on-board system to constantly supervise train position and speed and to check that the train travels within its assigned safety parameters at all times.
ASSICURAZIONI “Toro Sistema Solare”: an insurance policy designed to cover photovoltaic and solar thermal systems installed on GENERALI homes, but also systems installed on businesses, hotels, farms, offices and condominiums. INA Assitalia launched “Technological Risks”, a policy to cover specific facilities such as hydroelectric equipment, wind farms and biomass plants.
ATLANTIA The Telepass and Safety Tutor systems and congestions time countermeasures have reduced motorway users’ indirect CO2 emissions. The results for Telepass and Tutor Systems show significant impact in 2010, with a reduction of around 91,900 metric tonnes of CO2. As a result of congestion time countermeasures, estimated CO2 emissions saved in 2010 compared to 2005 were approximately 12,800 metric tonnes.
BANCA MONTE DEI “Welcome Energy Package”, a loan to support investment in renewable energies by small and micro-businesses; PASCHI DI SIENA during 2010 we supported over 1,160 firms with loans of 561 million Euros. Furthermore, in 2010 the Bank granted GROUP loans of almost 220 million Euros to finance the construction of large renewable power plants.
BANCA POPOLARE Green fundings: a funding stream for the installation of solar systems on the roofs of houses or sheds, and theDI MILANO Pacchetto Ecologia, a loan for investments in energy efficiency.
CREDITO Creval Energia Pulita, a floating-rate loan - to private individuals - for the purchase of photovoltaic systems, and other VALTELLINESE initiatives related to investment in environmental protection and development of alternative and renewable energies.
EDISON With its 2161 MW of installed capacity from renewable sources (hydro, wind, photovoltaic and biomass) the company saves 3.8 Mton of CO2 emissions each year. Edison offers several options to help its clients avoid GHG emissions, such as ZeroE People, the first available package of renewable energy certified by RECS International (Renewable Energy Certificate System).
ENEL In 2010 Enel introduced “All-included Green Energy” offering electricity produced by plants that exploit renewable sources. CO2 emissions are offset by a corresponding acquisition and subsequent cancellation of VERs (Verified Emissions Reductions). Enel.si, in 2010, installed more than 160 MW of photovoltaic systems and the amount of emissions saved between 2006 and 2010 is estimated at 175,000 tons of CO2. The Group’s portfolio contains a total of 105 CDM projects it is directly participating in.
ENI Eni’s gas & power division provides technical support to customers, helping them increase their energy efficiency. Such projects were able to make a saving of 21,857 toe in total, thus avoiding 64,895 tCO2. Furthermore, Eni contributes to increasing energy efficiency in the transport sector thanks to its BLU line of fuels.
FIAT Between 2000 and 2010, average emissions in metric tonnes per vehicle sold by Fiat Group Automobiles (FGA) in Europe fell by 20%. START&STOP SYSTEM: a further environmental benefit comes from the Start&Stop system developed by FGA Engineering & Design in collaboration with Fiat Powertrain and Magneti Marelli. The system offers a reduction of around 10% in fuel consumption and emissions in congested conditions, or 3.5% based on the New European Driving Cycle (NEDC).
FINMECCANICA Alenia Aeronautica and Alenia Aermacchi are researching an “all electric aircraft” and are investigating fuel cell technology. Ansaldo Energia is investigating carbon capture technologies and the possibility of using Molten carbonate fuel cells as second generation technologies, as well as opportunities in the field of renewables. Ansaldo Breda is working on developing software to simulate trains’ behavior in different conditions.
III. Results
26
Table 4b: Products and services reducing GHG emissions
HERA District heating services make it possible to reduce third parties’ (household) emissions. Hera District Heating activities received an award from the International Energy Agency to recognize them as one of the leading European clean energy projects (9th May 2011). Furthermore, “VerdEnergia” offers companies the chance of buying energy from renewable sources.
INTESA SAN PAOLO FINANZIAMENTO FOTOVOLTAICO, a product loan to support the planning, construction and installation of power generation plants from photovoltaic panels. FINANZIAMENTO ENERGIA IMPRESE, a loan to support companies bringing on-stream efficient energy production systems. LEASENERGY links leasing advantages with the opportunity to produce energy from renewable sources.
ITALCEMENTI i.clime®, the innovative “thermal cement”, is an ecological product that reduces energy consumption in buildings. The new i.light® transparent cement, by bonding special resins into a unique mix, makes it possible to manufacture construction panels which are solid and insulated, yet light-transmitting.
LOTTOMATICA GTECH has started using more environmentally friendly paper for the forms used for manual forwarding of bets, introducing the use of mixed paper fiber. In addition, paper from all current suppliers has been certified SFI (Sustainable Forestry Initiative) and FSC (Forest Stewardship Council).
TELECOM ITALIA Telecom Italia offers a range of products/services spanning teleworking applications, reducing home-to-office commuting; on line invoicing and payments; telemedicine services, and smart monitoring systems. New Telecom Italia Green range of low environmental impact products starts with a Wi-Fi N ADSL Modem. The “green” Wi-Fi modem consumes around 40% less power and reduces greenhouse gas emissions by the same percentage (CO2 equivalent) compared with the previous generation of modems.
TERNA Reduction of grid losses; improvement in the production mix and interconnection with other countries as well as the connection of plants using renewable energy sources will produce a reduction of emissions equal to about 9 million tons a year.
UBI BANCA Centrobanca has financed 3,000 MW of installed photovoltaic panels, which will produce about 12,200,000 MWh per year.
UNICREDIT GROUP FINANZIAMENTO FOTOVOLTAICO for backing photovoltaic systems with “conto energia” contribution. ENERGY LEASING for financing photovoltaic, wind and hydroelectric projects.
UNIPOL Unipol offers financial services linked to renewable energy, for example photovoltaic financing, through the policies of “Protezione Fotovoltaico” and “Nuova Energia per il Futuro”.
Carbon Disclosure Project 2011 – Italy 100 Report
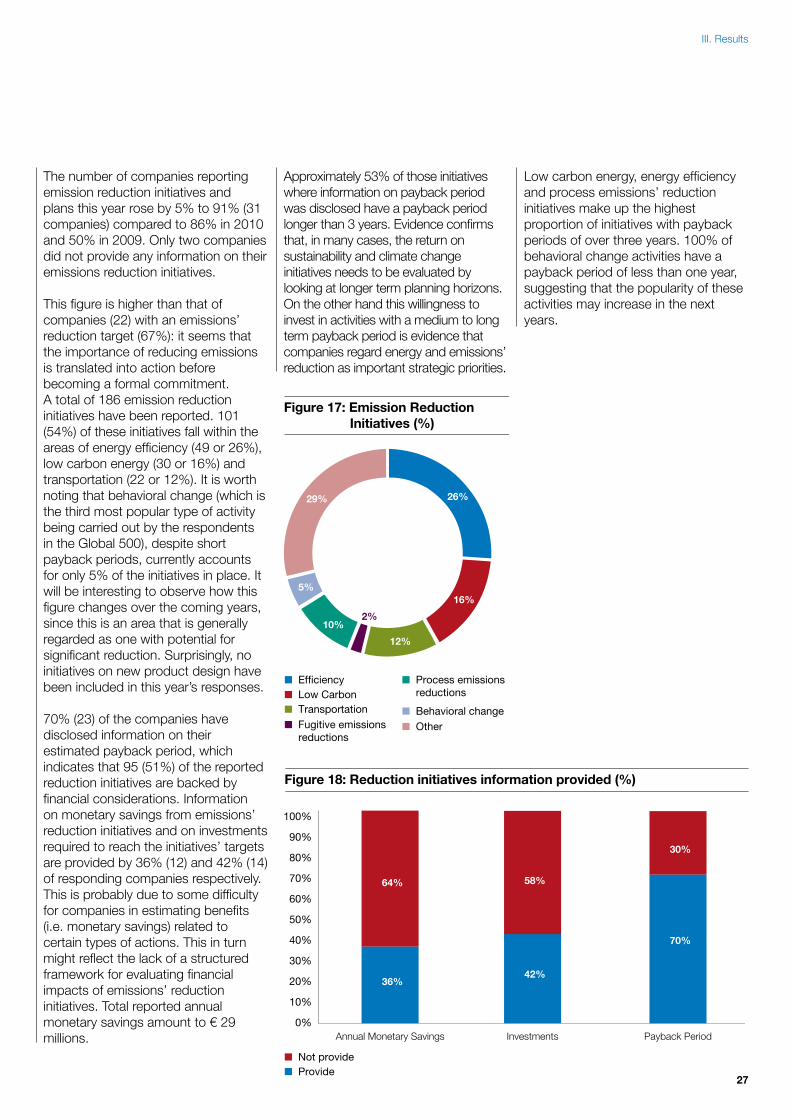
27
The number of companies reporting emission reduction initiatives and plans this year rose by 5% to 91% (31 companies) compared to 86% in 2010 and 50% in 2009. Only two companies did not provide any information on their emissions reduction initiatives.
This figure is higher than that of companies (22) with an emissions’ reduction target (67%): it seems that the importance of reducing emissions is translated into action before becoming a formal commitment. A total of 186 emission reduction initiatives have been reported. 101 (54%) of these initiatives fall within the areas of energy efficiency (49 or 26%), low carbon energy (30 or 16%) and transportation (22 or 12%). It is worth noting that behavioral change (which is the third most popular type of activity being carried out by the respondents in the Global 500), despite short payback periods, currently accounts for only 5% of the initiatives in place. It will be interesting to observe how this figure changes over the coming years, since this is an area that is generally regarded as one with potential for significant reduction. Surprisingly, no initiatives on new product design have been included in this year’s responses.
70% (23) of the companies have disclosed information on their estimated payback period, which indicates that 95 (51%) of the reported reduction initiatives are backed by financial considerations. Information on monetary savings from emissions’ reduction initiatives and on investments required to reach the initiatives’ targets are provided by 36% (12) and 42% (14) of responding companies respectively. This is probably due to some difficulty for companies in estimating benefits (i.e. monetary savings) related to certain types of actions. This in turn might reflect the lack of a structured framework for evaluating financial impacts of emissions’ reduction initiatives. Total reported annual monetary savings amount to € 29 millions.
Approximately 53% of those initiatives where information on payback period was disclosed have a payback period longer than 3 years. Evidence confirms that, in many cases, the return on sustainability and climate change initiatives needs to be evaluated by looking at longer term planning horizons. On the other hand this willingness to invest in activities with a medium to long term payback period is evidence that companies regard energy and emissions’ reduction as important strategic priorities.
Low carbon energy, energy efficiency and process emissions’ reduction initiatives make up the highest proportion of initiatives with payback periods of over three years. 100% of behavioral change activities have a payback period of less than one year, suggesting that the popularity of these activities may increase in the next years.
Figure 17: Emission Reduction Initiatives (%)
29% 26%
16%
12%
2%10%
5%
Process emissionsreductions
EfficiencyLow CarbonTransportationFugitive emissionsreductions
Behavioral changeOther
Figure 18: Reduction initiatives information provided (%)
Not provideProvide
64%
36%
Annual Monetary Savings Investments
58%
42%
Payback Period
30%
70%
100%
90%
80%
70%
60%
50%
40%
30%
20%
10%
0%
III. Results
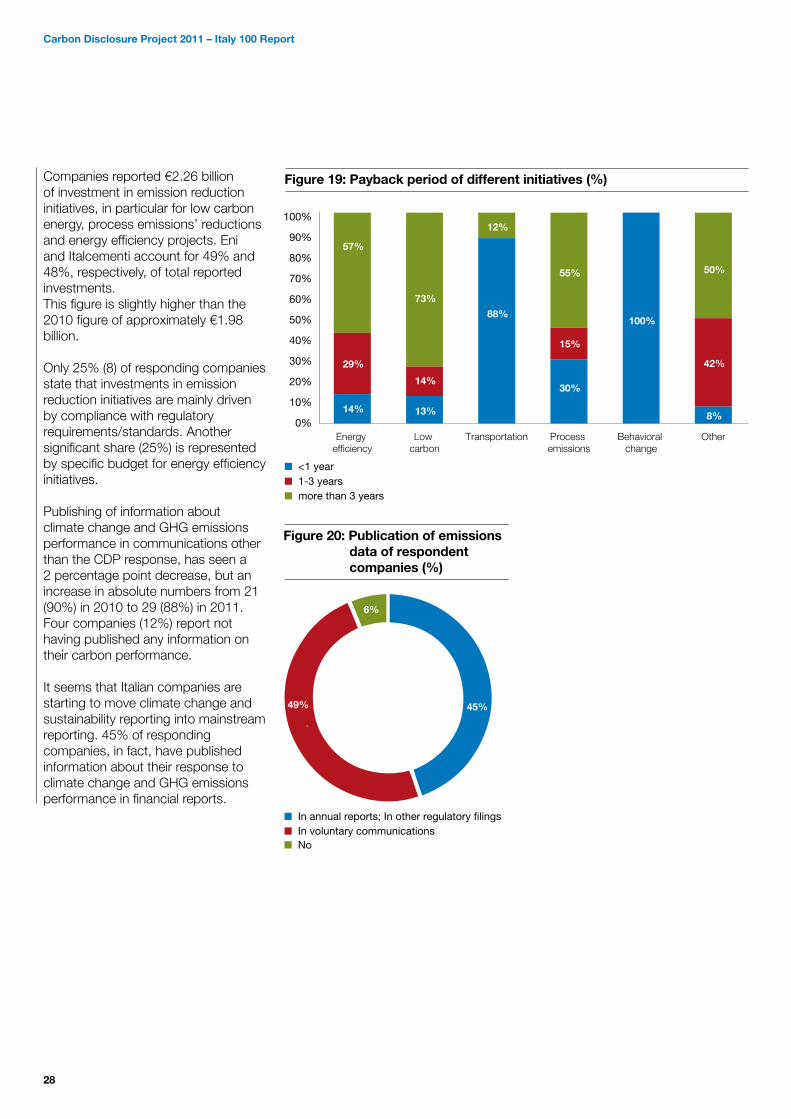
28
Companies reported €2.26 billion of investment in emission reduction initiatives, in particular for low carbon energy, process emissions’ reductions and energy efficiency projects. Eni and Italcementi account for 49% and 48%, respectively, of total reported investments. This figure is slightly higher than the 2010 figure of approximately €1.98 billion.
Only 25% (8) of responding companies state that investments in emission reduction initiatives are mainly driven by compliance with regulatory requirements/standards. Another significant share (25%) is represented by specific budget for energy efficiency initiatives.
Publishing of information about climate change and GHG emissions performance in communications other than the CDP response, has seen a 2 percentage point decrease, but an increase in absolute numbers from 21 (90%) in 2010 to 29 (88%) in 2011. Four companies (12%) report not having published any information on their carbon performance.
It seems that Italian companies are starting to move climate change and sustainability reporting into mainstream reporting. 45% of responding companies, in fact, have published information about their response to climate change and GHG emissions performance in financial reports.
Figure 19: Payback period of different initiatives (%)
100%
90%
80%
70%
60%
50%
40%
30%
20%
10%
0%
<1 year1-3 yearsmore than 3 years
Other
57%
29%
Energy efficiency
14%
Low carbon
73%
14%
13%
Transportation
12%
88%
Process emissions
55%
15%
30%
Behavioral change
100%
50%
42%
8%
Figure 20: Publication of emissions data of respondent companies (%)
In annual reports; In other regulatory filingsIn voluntary communications
49% 45%
No
6%
Carbon Disclosure Project 2011 – Italy 100 Report
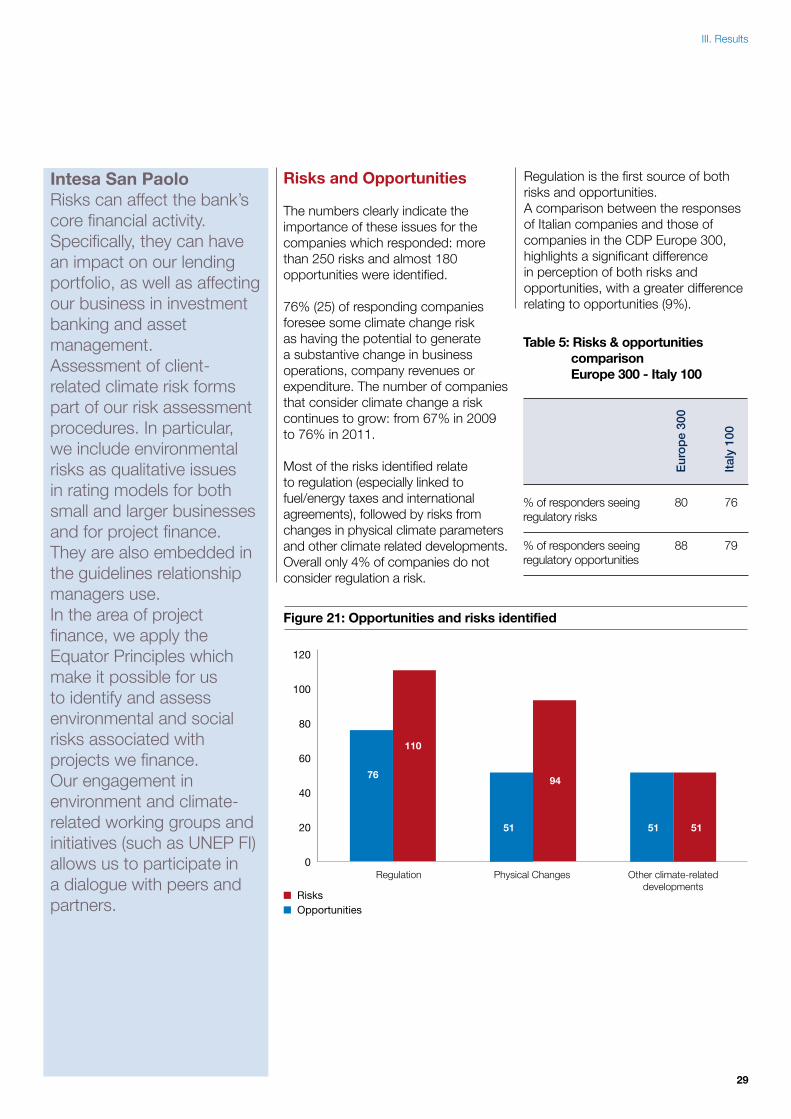
29
Risks and Opportunities
The numbers clearly indicate the importance of these issues for the companies which responded: more than 250 risks and almost 180 opportunities were identified.
76% (25) of responding companies foresee some climate change risk as having the potential to generate a substantive change in business operations, company revenues or expenditure. The number of companies that consider climate change a risk continues to grow: from 67% in 2009 to 76% in 2011.
Most of the risks identified relate to regulation (especially linked to fuel/energy taxes and international agreements), followed by risks from changes in physical climate parameters and other climate related developments. Overall only 4% of companies do not consider regulation a risk.
Regulation is the first source of both risks and opportunities.A comparison between the responses of Italian companies and those of companies in the CDP Europe 300, highlights a significant difference in perception of both risks and opportunities, with a greater difference relating to opportunities (9%).
Intesa San PaoloRisks can affect the bank’s core financial activity. Specifically, they can have an impact on our lending portfolio, as well as affecting our business in investment banking and asset management. Assessment of client-related climate risk forms part of our risk assessment procedures. In particular, we include environmental risks as qualitative issues in rating models for both small and larger businesses and for project finance. They are also embedded in the guidelines relationship managers use. In the area of project finance, we apply the Equator Principles which make it possible for us to identify and assess environmental and social risks associated with projects we finance. Our engagement in environment and climate-related working groups and initiatives (such as UNEP FI) allows us to participate in a dialogue with peers and partners.
Eur
op
e 30
0
Ital
y 10
0
% of responders seeing regulatory risks
% of responders seeing regulatory opportunities
80
88
76
79
Table 5: Risks & opportunities comparison Europe 300 - Italy 100
Figure 21: Opportunities and risks identified
RisksOpportunities
76
110
Regulation Physical Changes
51
94
Other climate-relateddevelopments
51 51
120
100
80
60
40
20
0
III. Results
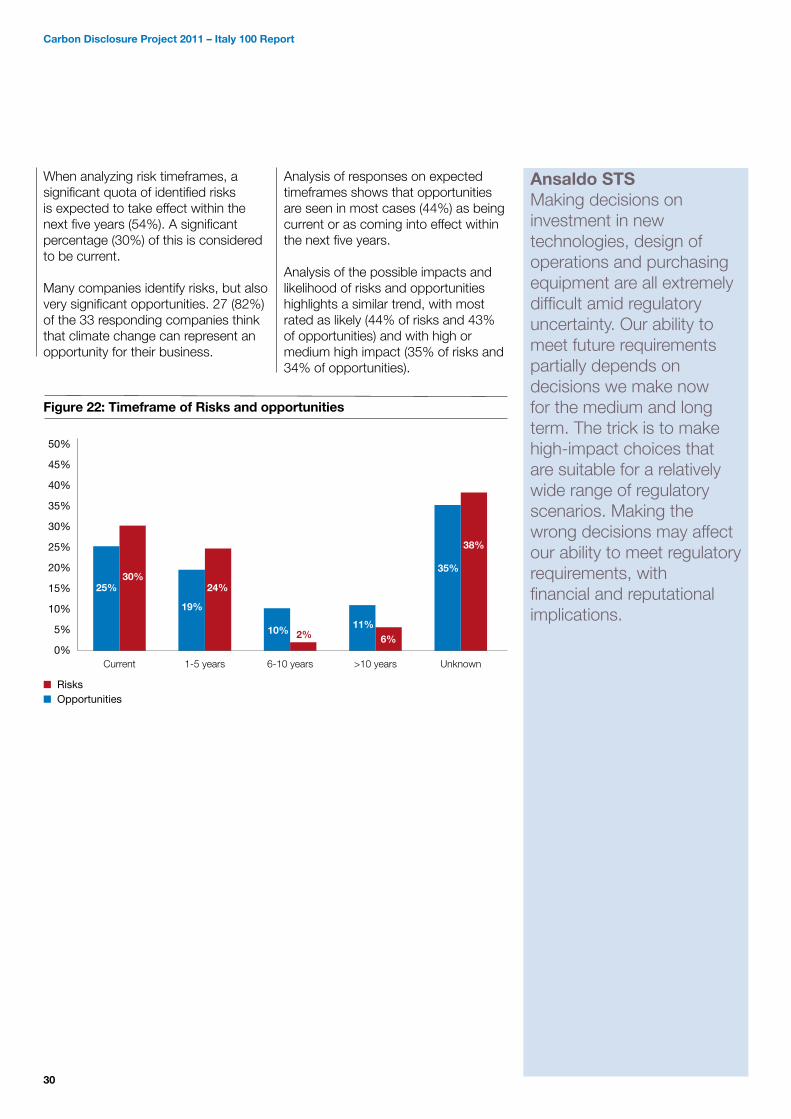
30
When analyzing risk timeframes, a significant quota of identified risks is expected to take effect within the next five years (54%). A significant percentage (30%) of this is considered to be current.
Many companies identify risks, but also very significant opportunities. 27 (82%) of the 33 responding companies think that climate change can represent an opportunity for their business.
Analysis of responses on expected timeframes shows that opportunities are seen in most cases (44%) as being current or as coming into effect within the next five years.
Analysis of the possible impacts and likelihood of risks and opportunities highlights a similar trend, with most rated as likely (44% of risks and 43% of opportunities) and with high or medium high impact (35% of risks and 34% of opportunities).
Ansaldo STSMaking decisions on investment in new technologies, design of operations and purchasing equipment are all extremely difficult amid regulatory uncertainty. Our ability to meet future requirements partially depends on decisions we make now for the medium and long term. The trick is to make high-impact choices that are suitable for a relatively wide range of regulatory scenarios. Making the wrong decisions may affect our ability to meet regulatory requirements, with financial and reputational implications.
1-5 yearsCurrent Unknown6-10 years >10 years
Figure 22: Timeframe of Risks and opportunities
RisksOpportunities
25%30%
19%
24%
10% 2%
50%
45%
40%
35%
30%
25%
20%
15%
10%
5%
0%
11%6%
35%
38%
Carbon Disclosure Project 2011 – Italy 100 Report
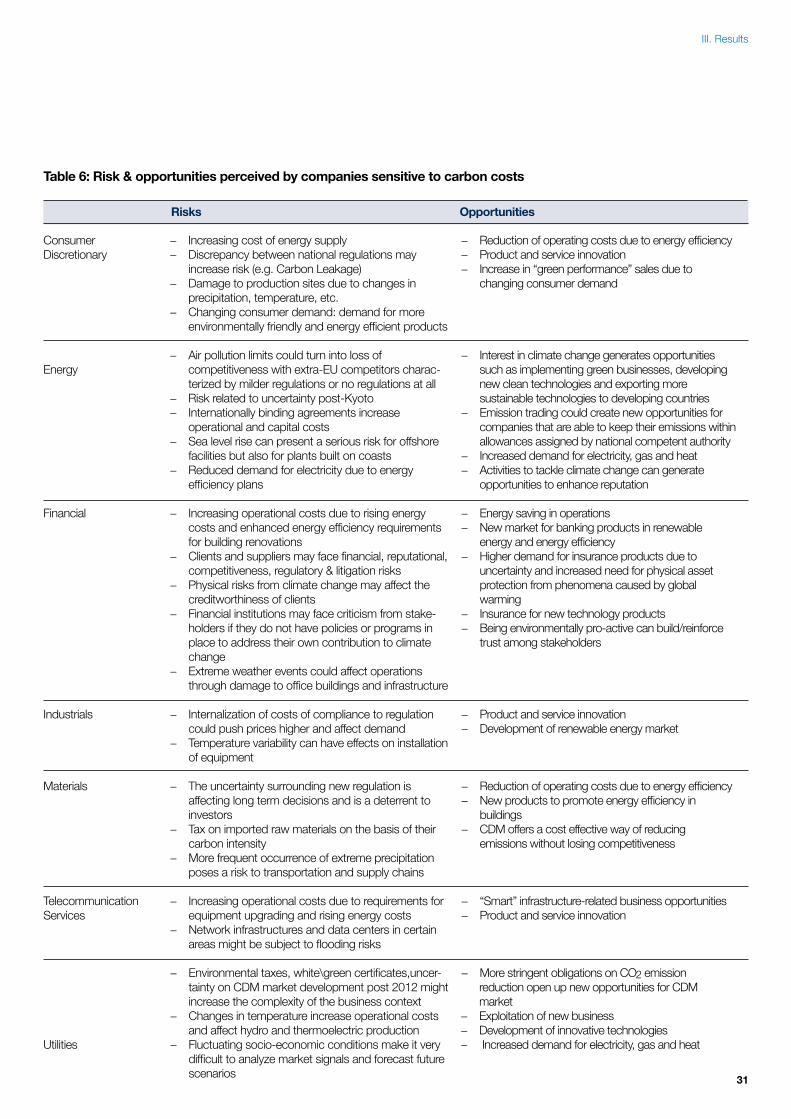
31
Table 6: Risk & opportunities perceived by companies sensitive to carbon costs
Risks Opportunities
Consumer Discretionary
Energy
Financial
Industrials
Materials
Telecommunication Services
Utilities
− Increasing cost of energy supply− Discrepancy between national regulations may increase risk (e.g. Carbon Leakage)− Damage to production sites due to changes in precipitation, temperature, etc.− Changing consumer demand: demand for more environmentally friendly and energy efficient products
− Air pollution limits could turn into loss of competitiveness with extra-EU competitors charac- terized by milder regulations or no regulations at all− Risk related to uncertainty post-Kyoto − Internationally binding agreements increase operational and capital costs− Sea level rise can present a serious risk for offshore facilities but also for plants built on coasts− Reduced demand for electricity due to energy efficiency plans
− Increasing operational costs due to rising energy costs and enhanced energy efficiency requirements for building renovations− Clients and suppliers may face financial, reputational, competitiveness, regulatory & litigation risks − Physical risks from climate change may affect the creditworthiness of clients− Financial institutions may face criticism from stake- holders if they do not have policies or programs in place to address their own contribution to climate change− Extreme weather events could affect operations through damage to office buildings and infrastructure
− Internalization of costs of compliance to regulation could push prices higher and affect demand− Temperature variability can have effects on installation of equipment
− The uncertainty surrounding new regulation is affecting long term decisions and is a deterrent to investors− Tax on imported raw materials on the basis of their carbon intensity− More frequent occurrence of extreme precipitation poses a risk to transportation and supply chains
− Increasing operational costs due to requirements for equipment upgrading and rising energy costs− Network infrastructures and data centers in certain areas might be subject to flooding risks
− Environmental taxes, white\green certificates,uncer- tainty on CDM market development post 2012 might increase the complexity of the business context− Changes in temperature increase operational costs and affect hydro and thermoelectric production− Fluctuating socio-economic conditions make it very difficult to analyze market signals and forecast future scenarios
− Reduction of operating costs due to energy efficiency− Product and service innovation − Increase in “green performance” sales due to changing consumer demand
− Interest in climate change generates opportunities such as implementing green businesses, developing new clean technologies and exporting more sustainable technologies to developing countries− Emission trading could create new opportunities for companies that are able to keep their emissions within allowances assigned by national competent authority− Increased demand for electricity, gas and heat − Activities to tackle climate change can generate opportunities to enhance reputation
− Energy saving in operations− New market for banking products in renewable energy and energy efficiency− Higher demand for insurance products due to uncertainty and increased need for physical asset protection from phenomena caused by global warming− Insurance for new technology products− Being environmentally pro-active can build/reinforce trust among stakeholders
− Product and service innovation− Development of renewable energy market
− Reduction of operating costs due to energy efficiency− New products to promote energy efficiency in buildings− CDM offers a cost effective way of reducing emissions without losing competitiveness
− “Smart” infrastructure-related business opportunities − Product and service innovation
− More stringent obligations on CO2 emission reduction open up new opportunities for CDM market− Exploitation of new business − Development of innovative technologies − Increased demand for electricity, gas and heat
III. Results
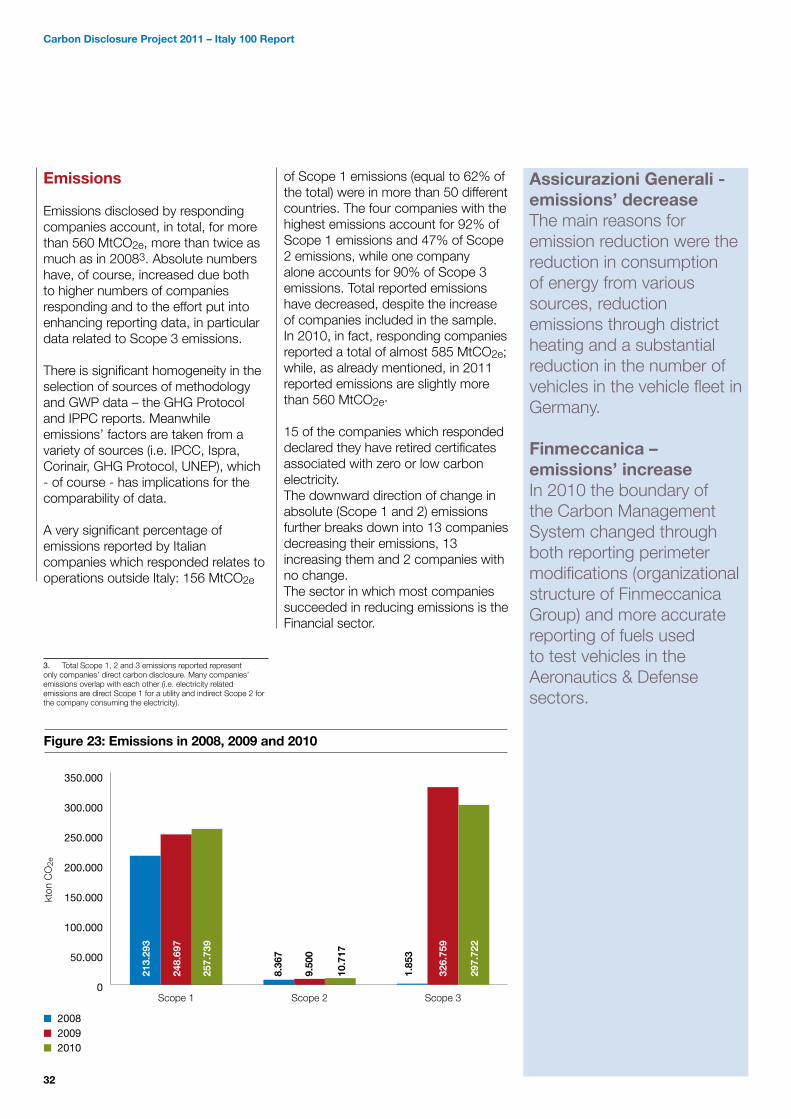
32
Emissions
Emissions disclosed by responding companies account, in total, for more than 560 MtCO2e, more than twice as much as in 20083. Absolute numbers have, of course, increased due both to higher numbers of companies responding and to the effort put into enhancing reporting data, in particular data related to Scope 3 emissions.
There is significant homogeneity in the selection of sources of methodology and GWP data – the GHG Protocol and IPPC reports. Meanwhile emissions’ factors are taken from a variety of sources (i.e. IPCC, Ispra, Corinair, GHG Protocol, UNEP), which - of course - has implications for the comparability of data.
A very significant percentage of emissions reported by Italian companies which responded relates to operations outside Italy: 156 MtCO2e
of Scope 1 emissions (equal to 62% of the total) were in more than 50 different countries. The four companies with the highest emissions account for 92% of Scope 1 emissions and 47% of Scope 2 emissions, while one company alone accounts for 90% of Scope 3 emissions. Total reported emissions have decreased, despite the increase of companies included in the sample. In 2010, in fact, responding companies reported a total of almost 585 MtCO2e; while, as already mentioned, in 2011 reported emissions are slightly more than 560 MtCO2e.
15 of the companies which responded declared they have retired certificates associated with zero or low carbon electricity. The downward direction of change in absolute (Scope 1 and 2) emissions further breaks down into 13 companies decreasing their emissions, 13 increasing them and 2 companies with no change.The sector in which most companies succeeded in reducing emissions is the Financial sector.
Assicurazioni Generali - emissions’ decreaseThe main reasons for emission reduction were the reduction in consumption of energy from various sources, reduction emissions through district heating and a substantial reduction in the number of vehicles in the vehicle fleet in Germany.
Finmeccanica – emissions’ increaseIn 2010 the boundary of the Carbon Management System changed through both reporting perimeter modifications (organizational structure of Finmeccanica Group) and more accurate reporting of fuels used to test vehicles in the Aeronautics & Defense sectors.
Scope 2Scope 1
Figure 23: Emissions in 2008, 2009 and 2010
350.000
300.000
250.000
200.000
150.000
100.000
50.000
0
200820092010
kton
CO
2e
Scope 3
213.
293
248.
697
257.
739
8.36
7
9.50
0
10.7
17
1.85
3
326.
759
297.
722
Carbon Disclosure Project 2011 – Italy 100 Report
3. Total Scope 1, 2 and 3 emissions reported represent only companies’ direct carbon disclosure. Many companies’ emissions overlap with each other (i.e. electricity related emissions are direct Scope 1 for a utility and indirect Scope 2 for the company consuming the electricity).
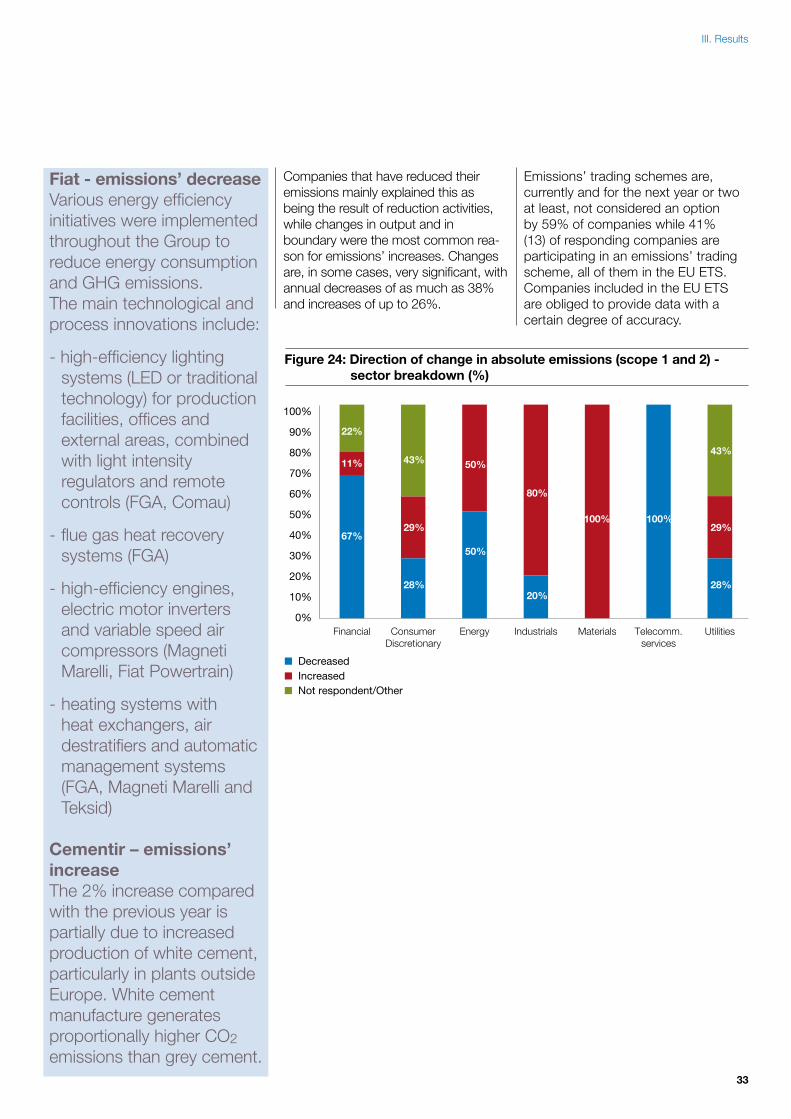
33
Fiat - emissions’ decreaseVarious energy efficiency initiatives were implemented throughout the Group to reduce energy consumption and GHG emissions. The main technological and process innovations include:
- high-efficiency lighting systems (LED or traditional technology) for production facilities, offices and external areas, combined with light intensity regulators and remote controls (FGA, Comau)
- flue gas heat recovery systems (FGA)
- high-efficiency engines, electric motor inverters and variable speed air compressors (Magneti Marelli, Fiat Powertrain)
- heating systems with heat exchangers, air destratifiers and automatic management systems (FGA, Magneti Marelli and Teksid)
Cementir – emissions’ increaseThe 2% increase compared with the previous year is partially due to increased production of white cement, particularly in plants outside Europe. White cement manufacture generates proportionally higher CO2 emissions than grey cement.
Companies that have reduced their emissions mainly explained this as being the result of reduction activities, while changes in output and in boundary were the most common rea-son for emissions’ increases. Changes are, in some cases, very significant, with annual decreases of as much as 38% and increases of up to 26%.
Emissions’ trading schemes are, currently and for the next year or two at least, not considered an option by 59% of companies while 41% (13) of responding companies are participating in an emissions’ trading scheme, all of them in the EU ETS.Companies included in the EU ETS are obliged to provide data with a certain degree of accuracy.
UtilitiesFinancial
Figure 24: Direction of change in absolute emissions (scope 1 and 2) - sector breakdown (%)
100%
90%
80%
70%
60%
50%
40%
30%
20%
10%
0%
DecreasedIncreasedNot respondent/Other
Telecomm.services
ConsumerDiscretionary
Energy Industrials Materials
50%
50%
80%
20%
100%
43%
29%
28%
100%
22%
11%
67%
43%
29%
28%
III. Results
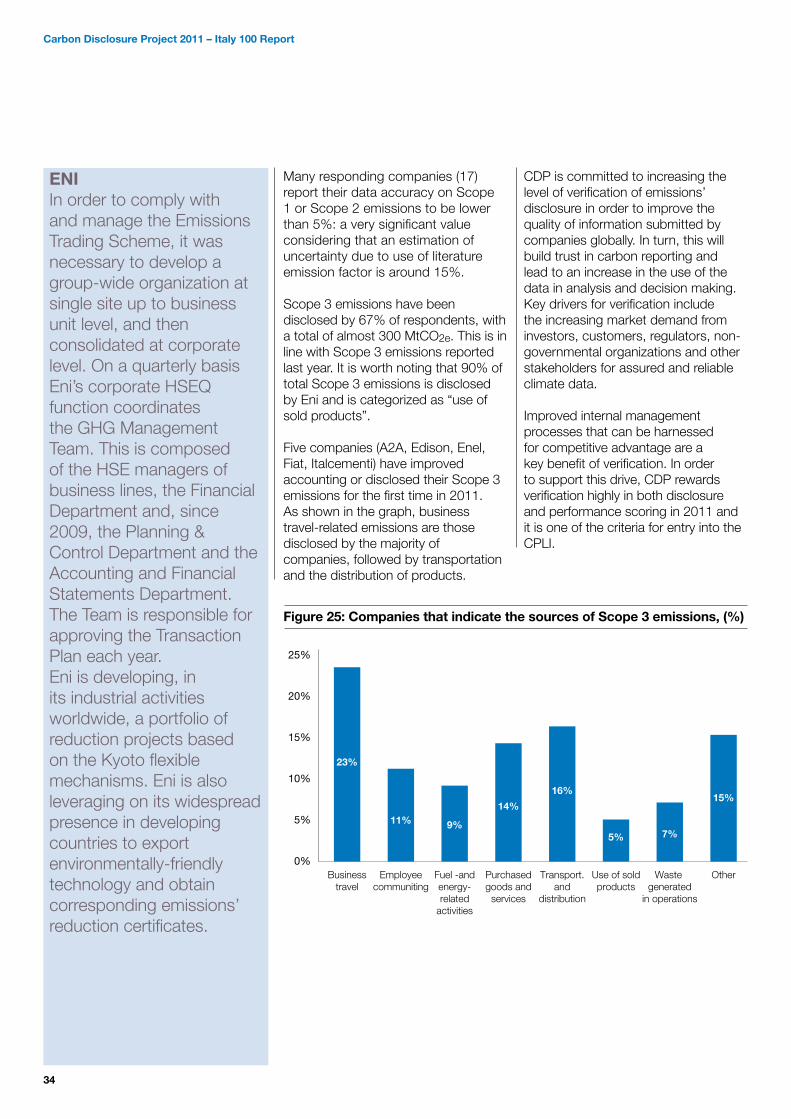
34
Many responding companies (17) report their data accuracy on Scope 1 or Scope 2 emissions to be lower than 5%: a very significant value considering that an estimation of uncertainty due to use of literature emission factor is around 15%.
Scope 3 emissions have been disclosed by 67% of respondents, with a total of almost 300 MtCO2e. This is in line with Scope 3 emissions reported last year. It is worth noting that 90% of total Scope 3 emissions is disclosed by Eni and is categorized as “use of sold products”.
Five companies (A2A, Edison, Enel, Fiat, Italcementi) have improved accounting or disclosed their Scope 3 emissions for the first time in 2011.As shown in the graph, business travel-related emissions are those disclosed by the majority of companies, followed by transportation and the distribution of products.
CDP is committed to increasing the level of verification of emissions’ disclosure in order to improve the quality of information submitted by companies globally. In turn, this will build trust in carbon reporting and lead to an increase in the use of the data in analysis and decision making. Key drivers for verification include the increasing market demand from investors, customers, regulators, non-governmental organizations and other stakeholders for assured and reliable climate data.
Improved internal management processes that can be harnessed for competitive advantage are a key benefit of verification. In order to support this drive, CDP rewards verification highly in both disclosure and performance scoring in 2011 and it is one of the criteria for entry into the CPLI.
ENI In order to comply with and manage the Emissions Trading Scheme, it was necessary to develop a group-wide organization at single site up to business unit level, and then consolidated at corporate level. On a quarterly basis Eni’s corporate HSEQ function coordinates the GHG Management Team. This is composed of the HSE managers of business lines, the Financial Department and, since 2009, the Planning & Control Department and the Accounting and Financial Statements Department. The Team is responsible for approving the Transaction Plan each year. Eni is developing, in its industrial activities worldwide, a portfolio of reduction projects based on the Kyoto flexible mechanisms. Eni is also leveraging on its widespread presence in developing countries to export environmentally-friendly technology and obtain corresponding emissions’ reduction certificates.
Figure 25: Companies that indicate the sources of Scope 3 emissions, (%)
25%
20%
15%
10%
5%
0%Fuel -andenergy-related
activities
9%
Purchasedgoods and
services
14%
Transport.and
distribution
16%
Waste generated
in operations
7%
Use of soldproducts
5%
Businesstravel
23%
Employeecommuniting
11%
Other
15%
Carbon Disclosure Project 2011 – Italy 100 Report
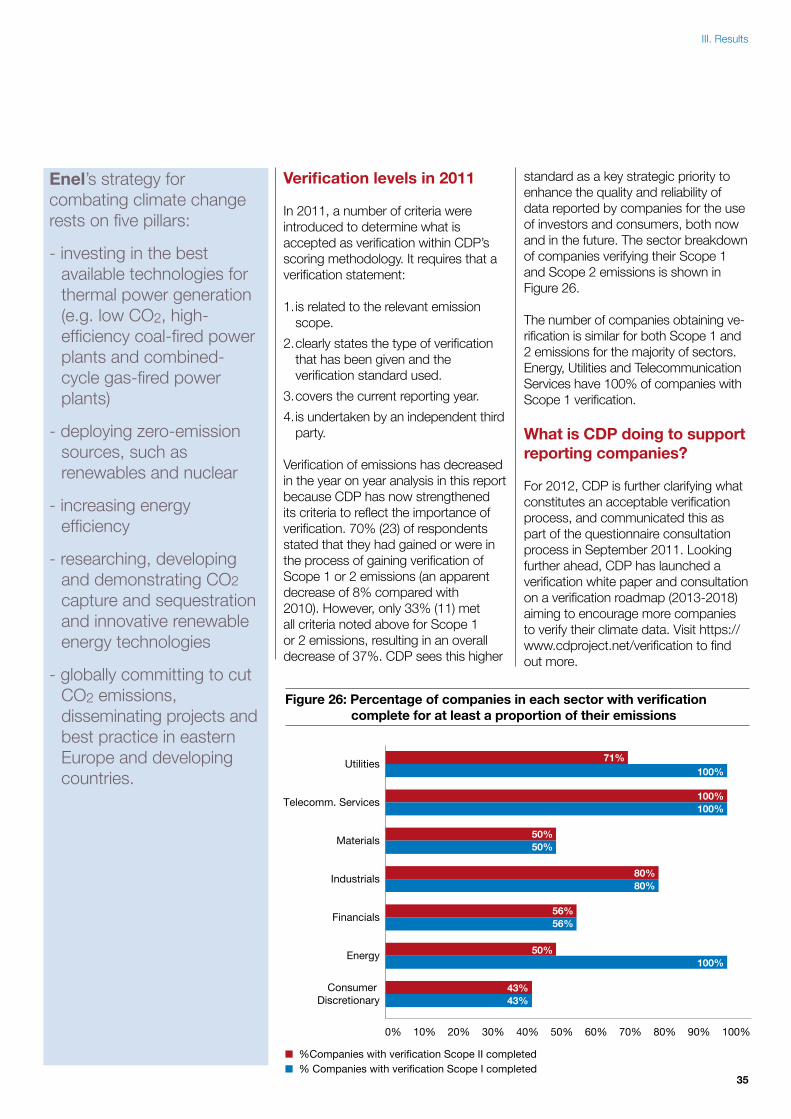
35
Enel’s strategy for combating climate change rests on five pillars:
- investing in the best available technologies for thermal power generation (e.g. low CO2, high- efficiency coal-fired power plants and combined- cycle gas-fired power plants)
- deploying zero-emission sources, such as renewables and nuclear
- increasing energy efficiency
- researching, developing and demonstrating CO2
capture and sequestration and innovative renewable energy technologies
- globally committing to cut CO2 emissions, disseminating projects and best practice in eastern Europe and developing countries.
Verification levels in 2011
In 2011, a number of criteria were introduced to determine what is accepted as verification within CDP’s scoring methodology. It requires that a verification statement:
1. is related to the relevant emission scope.
2. clearly states the type of verification that has been given and the verification standard used.
3. covers the current reporting year.
4. is undertaken by an independent third party.
Verification of emissions has decreased in the year on year analysis in this report because CDP has now strengthened its criteria to reflect the importance of verification. 70% (23) of respondents stated that they had gained or were in the process of gaining verification of Scope 1 or 2 emissions (an apparent decrease of 8% compared with 2010). However, only 33% (11) met all criteria noted above for Scope 1 or 2 emissions, resulting in an overall decrease of 37%. CDP sees this higher
standard as a key strategic priority to enhance the quality and reliability of data reported by companies for the use of investors and consumers, both now and in the future. The sector breakdown of companies verifying their Scope 1 and Scope 2 emissions is shown in Figure 26.
The number of companies obtaining ve-rification is similar for both Scope 1 and 2 emissions for the majority of sectors. Energy, Utilities and Telecommunication Services have 100% of companies with Scope 1 verification.
What is CDP doing to support reporting companies? For 2012, CDP is further clarifying what constitutes an acceptable verification process, and communicated this as part of the questionnaire consultation process in September 2011. Looking further ahead, CDP has launched a verification white paper and consultation on a verification roadmap (2013-2018) aiming to encourage more companies to verify their climate data. Visit https://www.cdproject.net/verification to find out more.
Figure 26: Percentage of companies in each sector with verification complete for at least a proportion of their emissions
0% 10% 20% 30% 40% 50% 60% 70% 80% 90% 100%
%Companies with verification Scope II completed% Companies with verification Scope I completed
Utilities
Telecomm. Services
Industrials
Financials
Energy
Consumer Discretionary
71%100%
Materials
100%100%
50%50%
80%80%
56%56%
50%100%
43%43%
III. Results
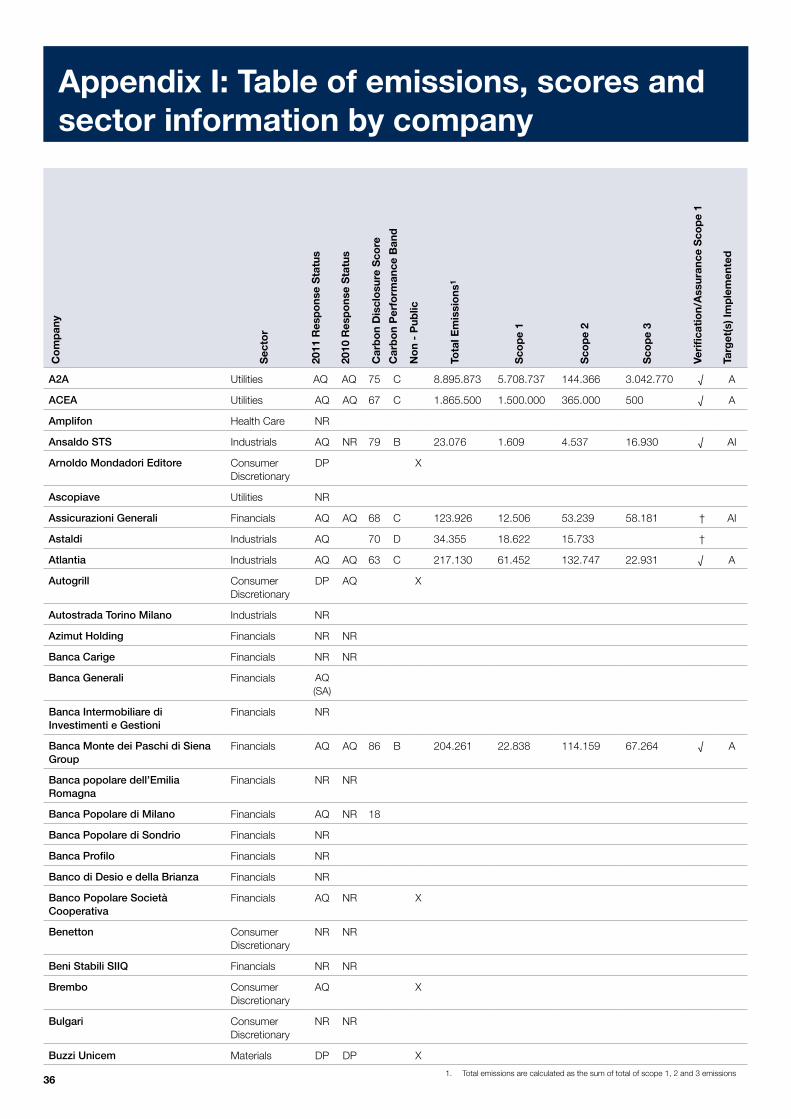
36
Appendix I: Table of emissions, scores and sector information by company
A2A Utilities AQ AQ 75 C 8.895.873 5.708.737 144.366 3.042.770 √ A
ACEA Utilities AQ AQ 67 C 1.865.500 1.500.000 365.000 500 √ A
Amplifon Health Care NR
Ansaldo STS Industrials AQ NR 79 B 23.076 1.609 4.537 16.930 √ AI
Arnoldo Mondadori Editore Consumer Discretionary
DP X
Ascopiave Utilities NR
Assicurazioni Generali Financials AQ AQ 68 C 123.926 12.506 53.239 58.181 † AI
Astaldi Industrials AQ 70 D 34.355 18.622 15.733 †
Atlantia Industrials AQ AQ 63 C 217.130 61.452 132.747 22.931 √ A
Autogrill Consumer Discretionary
DP AQ X
Autostrada Torino Milano Industrials NR
Azimut Holding Financials NR NR
Banca Carige Financials NR NR
Banca Generali Financials AQ(SA)
Banca Intermobiliare di Investimenti e Gestioni
Financials NR
Banca Monte dei Paschi di Siena Group
Financials AQ AQ 86 B 204.261 22.838 114.159 67.264 √ A
Banca popolare dell’Emilia Romagna
Financials NR NR
Banca Popolare di Milano Financials AQ NR 18
Banca Popolare di Sondrio Financials NR
Banca Profilo Financials NR
Banco di Desio e della Brianza Financials NR
Banco Popolare Società Cooperativa
Financials AQ NR X
Benetton Consumer Discretionary
NR NR
Beni Stabili SIIQ Financials NR NR
Brembo Consumer Discretionary
AQ X
Bulgari Consumer Discretionary
NR NR
Buzzi Unicem Materials DP DP X
Car
bo
n D
iscl
osu
re S
core
Co
mp
any
2011
Res
po
nse
Sta
tus
2010
Res
po
nse
Sta
tus
Car
bo
n P
erfo
rman
ce B
and
No
n -
Pub
lic
Tota
l Em
issi
ons
1
Sco
pe
1
Sco
pe
2
Sco
pe
3
Veri
fica
tio
n/A
ssur
ance
Sco
pe
1
Targ
et(s
) Im
ple
men
ted
Sec
tor
1. Total emissions are calculated as the sum of total of scope 1, 2 and 3 emissions
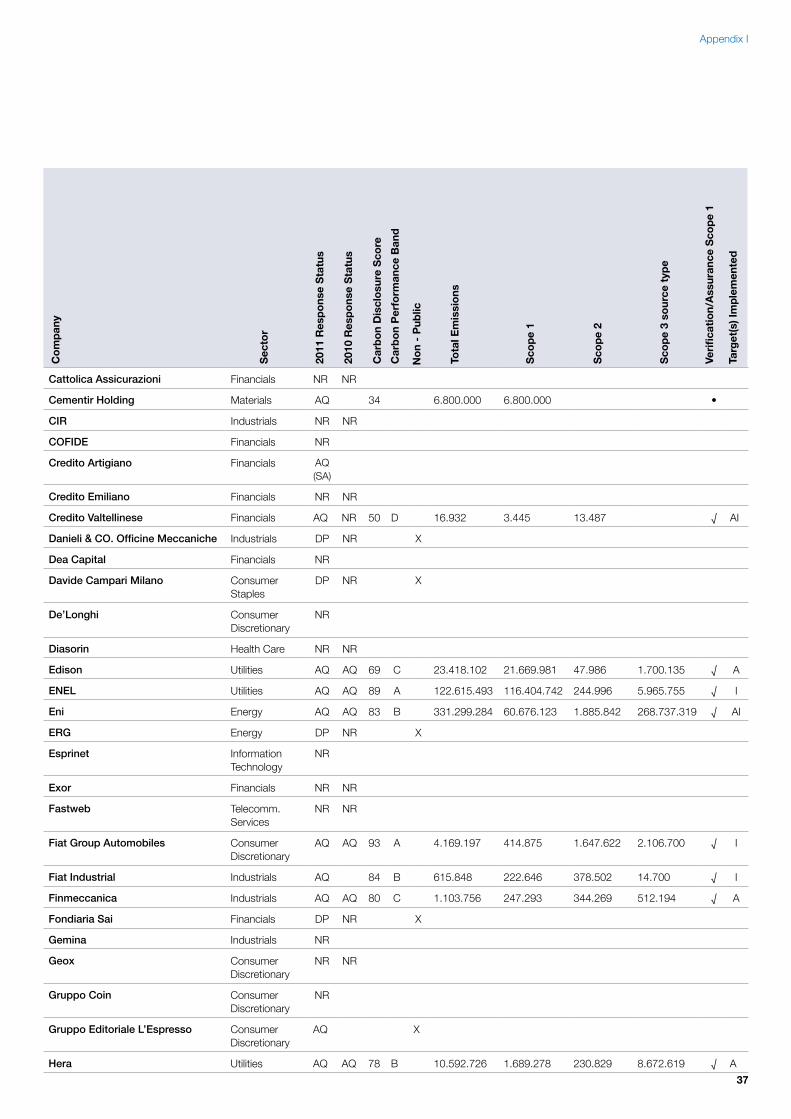
37
Cattolica Assicurazioni Financials NR NR
Cementir Holding Materials AQ 34 6.800.000 6.800.000 •
CIR Industrials NR NR
COFIDE Financials NR
Credito Artigiano Financials AQ(SA)
Credito Emiliano Financials NR NR
Credito Valtellinese Financials AQ NR 50 D 16.932 3.445 13.487 √ AI
Danieli & CO. Officine Meccaniche Industrials DP NR X
Dea Capital Financials NR
Davide Campari Milano Consumer Staples
DP NR X
De’Longhi Consumer Discretionary
NR
Diasorin Health Care NR NR
Edison Utilities AQ AQ 69 C 23.418.102 21.669.981 47.986 1.700.135 √ A
ENEL Utilities AQ AQ 89 A 122.615.493 116.404.742 244.996 5.965.755 √ I
Eni Energy AQ AQ 83 B 331.299.284 60.676.123 1.885.842 268.737.319 √ AI
ERG Energy DP NR X
Esprinet Information Technology
NR
Exor Financials NR NR
Fastweb Telecomm. Services
NR NR
Fiat Group Automobiles Consumer Discretionary
AQ AQ 93 A 4.169.197 414.875 1.647.622 2.106.700 √ I
Fiat Industrial Industrials AQ 84 B 615.848 222.646 378.502 14.700 √ I
Finmeccanica Industrials AQ AQ 80 C 1.103.756 247.293 344.269 512.194 √ A
Fondiaria Sai Financials DP NR X
Gemina Industrials NR
Geox Consumer Discretionary
NR NR
Gruppo Coin Consumer Discretionary
NR
Gruppo Editoriale L’Espresso Consumer Discretionary
AQ X
Hera Utilities AQ AQ 78 B 10.592.726 1.689.278 230.829 8.672.619 √ A
Car
bo
n D
iscl
osu
re S
core
Co
mp
any
2011
Res
po
nse
Sta
tus
2010
Res
po
nse
Sta
tus
Car
bo
n P
erfo
rman
ce B
and
No
n -
Pub
lic
Tota
l Em
issi
ons
Sco
pe
1
Sco
pe
2
Sco
pe
3 so
urce
typ
e
Veri
fica
tio
n/A
ssur
ance
Sco
pe
1
Targ
et(s
) Im
ple
men
ted
Sec
tor
Appendix I
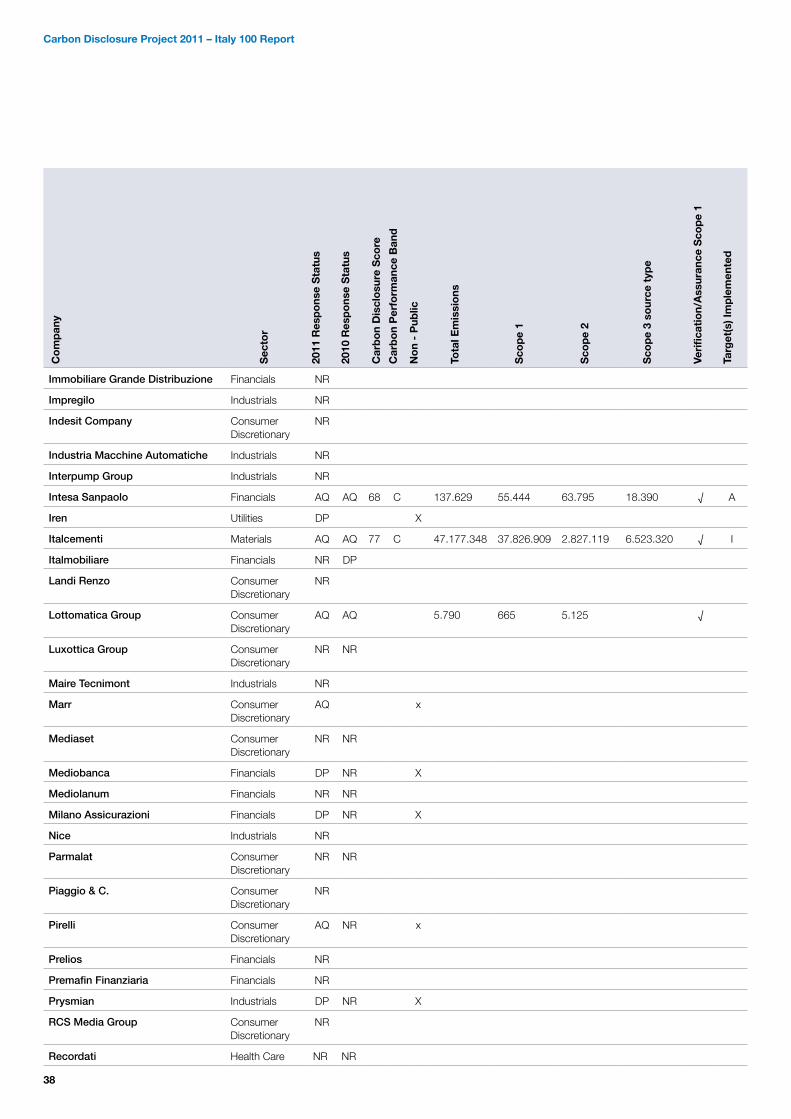
38
Immobiliare Grande Distribuzione Financials NR
Impregilo Industrials NR
Indesit Company Consumer Discretionary
NR
Industria Macchine Automatiche Industrials NR
Interpump Group Industrials NR
Intesa Sanpaolo Financials AQ AQ 68 C 137.629 55.444 63.795 18.390 √ A
Iren Utilities DP X
Italcementi Materials AQ AQ 77 C 47.177.348 37.826.909 2.827.119 6.523.320 √ I
Italmobiliare Financials NR DP
Landi Renzo Consumer Discretionary
NR
Lottomatica Group Consumer Discretionary
AQ AQ 5.790 665 5.125 √
Luxottica Group Consumer Discretionary
NR NR
Maire Tecnimont Industrials NR
Marr Consumer Discretionary
AQ x
Mediaset Consumer Discretionary
NR NR
Mediobanca Financials DP NR X
Mediolanum Financials NR NR
Milano Assicurazioni Financials DP NR X
Nice Industrials NR
Parmalat Consumer Discretionary
NR NR
Piaggio & C. Consumer Discretionary
NR
Pirelli Consumer Discretionary
AQ NR x
Prelios Financials NR
Premafin Finanziaria Financials NR
Prysmian Industrials DP NR X
RCS Media Group Consumer Discretionary
NR
Recordati Health Care NR NR
Car
bo
n D
iscl
osu
re S
core
Co
mp
any
2011
Res
po
nse
Sta
tus
2010
Res
po
nse
Sta
tus
Car
bo
n P
erfo
rman
ce B
and
No
n -
Pub
lic
Tota
l Em
issi
ons
Sco
pe
1
Sco
pe
2
Sco
pe
3 so
urce
typ
e
Veri
fica
tio
n/A
ssur
ance
Sco
pe
1
Targ
et(s
) Im
ple
men
ted
Sec
tor
Carbon Disclosure Project 2011 – Italy 100 Report
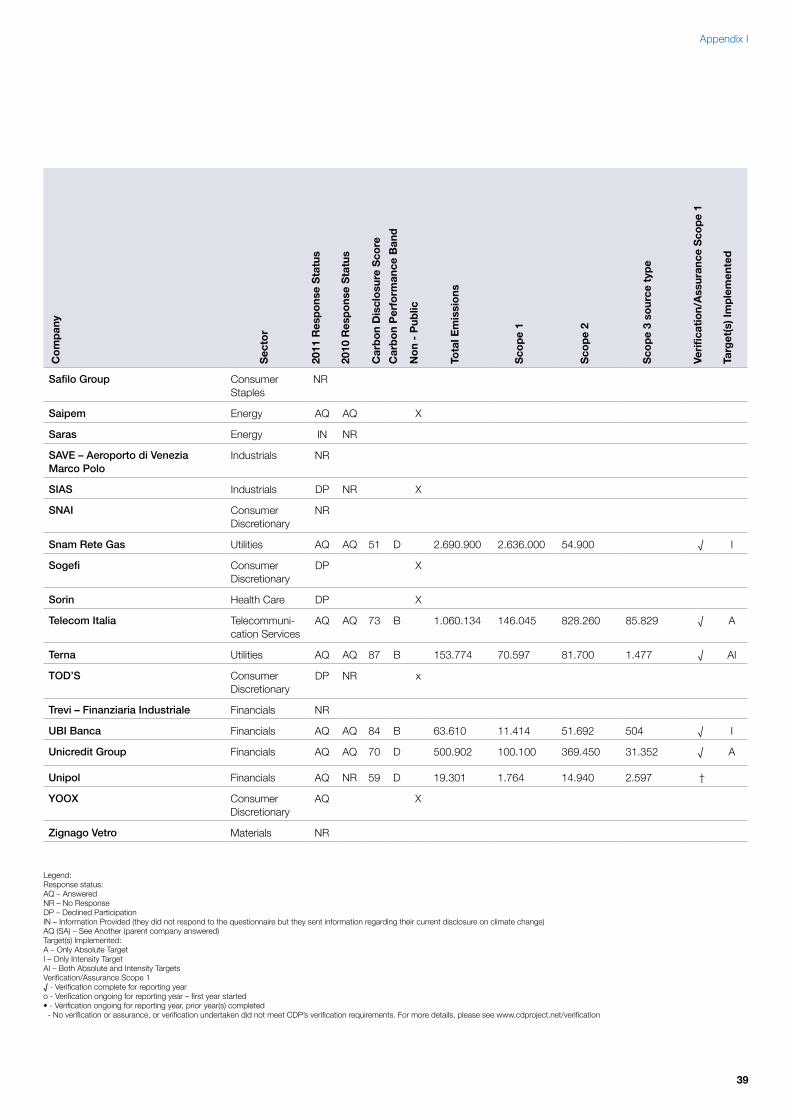
39
Safilo Group Consumer Staples
NR
Saipem Energy AQ AQ X
Saras Energy IN NR
SAVE – Aeroporto di Venezia Marco Polo
Industrials NR
SIAS Industrials DP NR X
SNAI Consumer Discretionary
NR
Snam Rete Gas Utilities AQ AQ 51 D 2.690.900 2.636.000 54.900 √ I
Sogefi Consumer Discretionary
DP X
Sorin Health Care DP X
Telecom Italia Telecommuni-cation Services
AQ AQ 73 B 1.060.134 146.045 828.260 85.829 √ A
Terna Utilities AQ AQ 87 B 153.774 70.597 81.700 1.477 √ AI
TOD’S Consumer Discretionary
DP NR x
Trevi – Finanziaria Industriale Financials NR
UBI Banca Financials AQ AQ 84 B 63.610 11.414 51.692 504 √ I
Unicredit Group Financials AQ AQ 70 D 500.902 100.100 369.450 31.352 √ A
Unipol Financials AQ NR 59 D 19.301 1.764 14.940 2.597 †
YOOX Consumer Discretionary
AQ X
Zignago Vetro Materials NR
Car
bo
n D
iscl
osu
re S
core
Co
mp
any
2011
Res
po
nse
Sta
tus
2010
Res
po
nse
Sta
tus
Car
bo
n P
erfo
rman
ce B
and
No
n -
Pub
lic
Tota
l Em
issi
ons
Sco
pe
1
Sco
pe
2
Sco
pe
3 so
urce
typ
e
Veri
fica
tio
n/A
ssur
ance
Sco
pe
1
Targ
et(s
) Im
ple
men
ted
Sec
tor
Legend:Response status:AQ – AnsweredNR – No ResponseDP – Declined ParticipationIN – Information Provided (they did not respond to the questionnaire but they sent information regarding their current disclosure on climate change)AQ (SA) – See Another (parent company answered)Target(s) Implemented:A – Only Absolute Target I – Only Intensity TargetAI – Both Absolute and Intensity TargetsVerification/Assurance Scope 1√ - Verification complete for reporting yearo - Verification ongoing for reporting year – first year started• - Verification ongoing for reporting year, prior year(s) completed - No verification or assurance, or verification undertaken did not meet CDP’s verification requirements. For more details, please see www.cdproject.net/verification
Appendix I
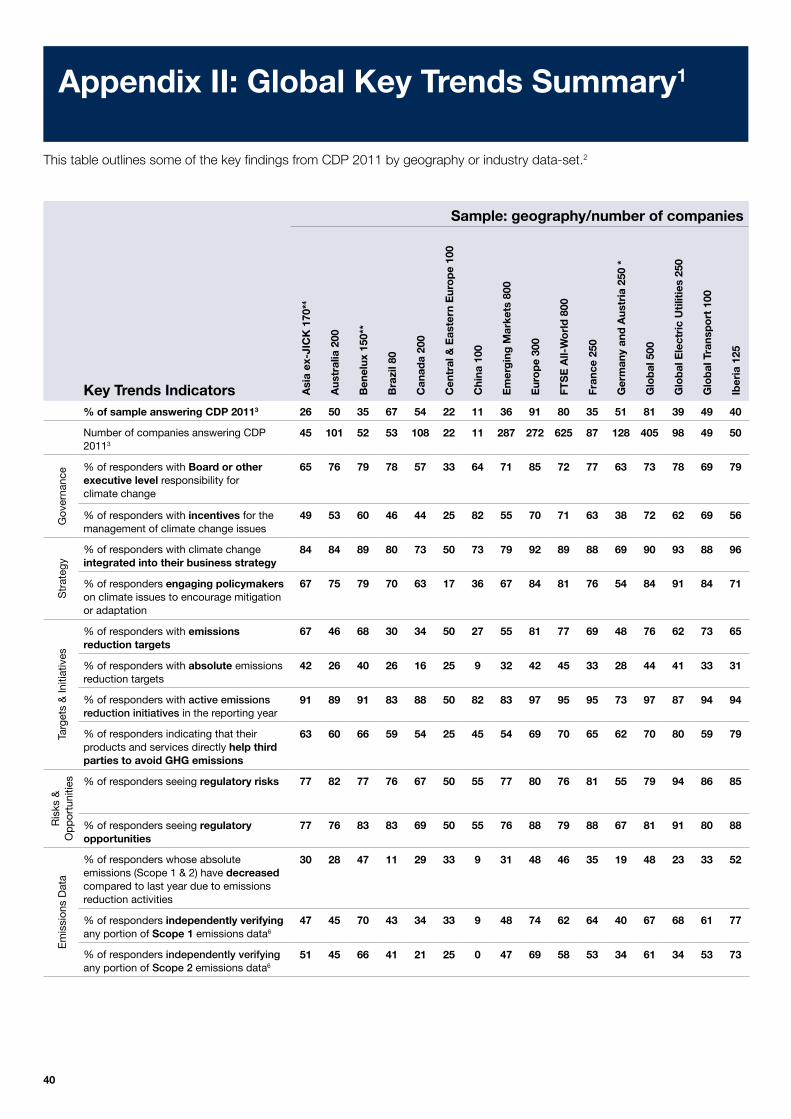
40
% of sample answering CDP 20113 26 50 35 67 54 22 11 36 91 80 35 51 81 39 49 40
Number of companies answering CDP 20113
45 101 52 53 108 22 11 287 272 625 87 128 405 98 49 50
Gov
erna
nce % of responders with Board or other
executive level responsibility for climate change
65 76 79 78 57 33 64 71 85 72 77 63 73 78 69 79
% of responders with incentives for the management of climate change issues
49 53 60 46 44 25 82 55 70 71 63 38 72 62 69 56
Str
ateg
y
% of responders with climate change integrated into their business strategy
84 84 89 80 73 50 73 79 92 89 88 69 90 93 88 96
% of responders engaging policymakers on climate issues to encourage mitigation or adaptation
67 75 79 70 63 17 36 67 84 81 76 54 84 91 84 71
Targ
ets
& In
itiat
ives
% of responders with emissions reduction targets
67 46 68 30 34 50 27 55 81 77 69 48 76 62 73 65
% of responders with absolute emissions reduction targets
42 26 40 26 16 25 9 32 42 45 33 28 44 41 33 31
% of responders with active emissions reduction initiatives in the reporting year
91 89 91 83 88 50 82 83 97 95 95 73 97 87 94 94
% of responders indicating that their products and services directly help third parties to avoid GHG emissions
63 60 66 59 54 25 45 54 69 70 65 62 70 80 59 79
Ris
ks &
O
pp
ortu
nitie
s % of responders seeing regulatory risks 77 82 77 76 67 50 55 77 80 76 81 55 79 94 86 85
% of responders seeing regulatory opportunities
77 76 83 83 69 50 55 76 88 79 88 67 81 91 80 88
Em
issi
ons
Dat
a
% of responders whose absolute emissions (Scope 1 & 2) have decreased compared to last year due to emissions reduction activities
30 28 47 11 29 33 9 31 48 46 35 19 48 23 33 52
% of responders independently verifying any portion of Scope 1 emissions data6
47 45 70 43 34 33 9 48 74 62 64 40 67 68 61 77
% of responders independently verifying any portion of Scope 2 emissions data6
51 45 66 41 21 25 0 47 69 58 53 34 61 34 53 73
Appendix II: Global Key Trends Summary1
This table outlines some of the key findings from CDP 2011 by geography or industry data-set.2
Key Trends Indicators
Sample: geography/number of companies
Asi
a ex
-JIC
K 1
70*4
Aus
tral
ia 2
00
Ben
elux
150
**
Bra
zil 8
0
Can
ada
200
Cen
tral
& E
aste
rn E
uro
pe
100
Chi
na 1
00
Em
erg
ing
Mar
kets
800
Eur
op
e 30
0
FTS
E A
ll-W
orl
d 8
00
Fran
ce 2
50
Ger
man
y an
d A
ustr
ia 2
50 *
Glo
bal
500
Glo
bal
Ele
ctri
c U
tilit
ies
250
Glo
bal
Tra
nsp
ort
100
Iber
ia 1
25
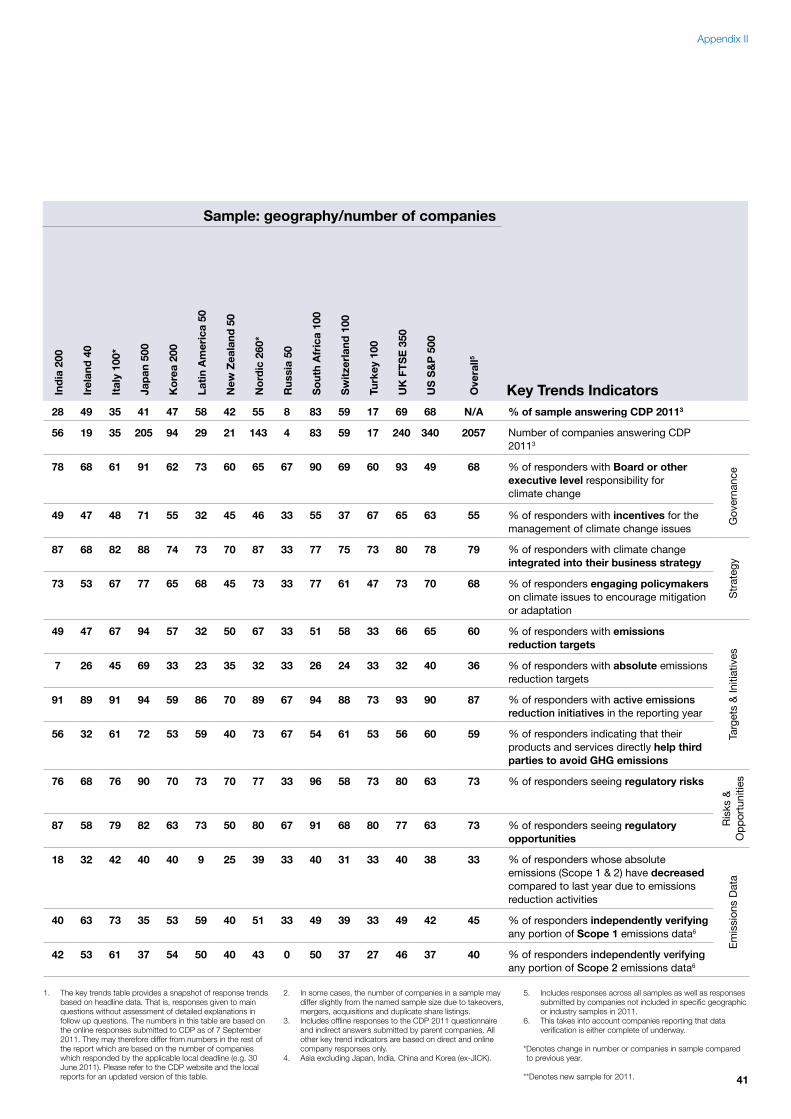
41
28 49 35 41 47 58 42 55 8 83 59 17 69 68 N/A % of sample answering CDP 20113
56 19 35 205 94 29 21 143 4 83 59 17 240 340 2057 Number of companies answering CDP 20113
78 68 61 91 62 73 60 65 67 90 69 60 93 49 68 % of responders with Board or other executive level responsibility for climate change
Gov
erna
nce
49 47 48 71 55 32 45 46 33 55 37 67 65 63 55 % of responders with incentives for the management of climate change issues
87 68 82 88 74 73 70 87 33 77 75 73 80 78 79 % of responders with climate change integrated into their business strategy
Str
ateg
y
73 53 67 77 65 68 45 73 33 77 61 47 73 70 68 % of responders engaging policymakers on climate issues to encourage mitigation or adaptation
49 47 67 94 57 32 50 67 33 51 58 33 66 65 60 % of responders with emissions reduction targets
Targ
ets
& In
itiat
ives
7 26 45 69 33 23 35 32 33 26 24 33 32 40 36 % of responders with absolute emissions reduction targets
91 89 91 94 59 86 70 89 67 94 88 73 93 90 87 % of responders with active emissions reduction initiatives in the reporting year
56 32 61 72 53 59 40 73 67 54 61 53 56 60 59 % of responders indicating that their products and services directly help third parties to avoid GHG emissions
76 68 76 90 70 73 70 77 33 96 58 73 80 63 73 % of responders seeing regulatory risks
Ris
ks &
O
pp
ortu
nitie
s
87 58 79 82 63 73 50 80 67 91 68 80 77 63 73 % of responders seeing regulatory opportunities
18 32 42 40 40 9 25 39 33 40 31 33 40 38 33 % of responders whose absolute emissions (Scope 1 & 2) have decreased compared to last year due to emissions reduction activities
Em
issi
ons
Dat
a
40 63 73 35 53 59 40 51 33 49 39 33 49 42 45 % of responders independently verifying any portion of Scope 1 emissions data6
42 53 61 37 54 50 40 43 0 50 37 27 46 37 40 % of responders independently verifying any portion of Scope 2 emissions data6
1. The key trends table provides a snapshot of response trends based on headline data. That is, responses given to main questions without assessment of detailed explanations in follow up questions. The numbers in this table are based on the online responses submitted to CDP as of 7 September 2011. They may therefore differ from numbers in the rest of the report which are based on the number of companies which responded by the applicable local deadline (e.g. 30 June 2011). Please refer to the CDP website and the local reports for an updated version of this table.
2. In some cases, the number of companies in a sample may differ slightly from the named sample size due to takeovers, mergers, acquisitions and duplicate share listings.
3. Includes offline responses to the CDP 2011 questionnaire and indirect answers submitted by parent companies. All other key trend indicators are based on direct and online company responses only.
4. Asia excluding Japan, India, China and Korea (ex-JICK).
5. Includes responses across all samples as well as responses submitted by companies not included in specific geographic or industry samples in 2011.
6. This takes into account companies reporting that data verification is either complete of underway.
* Denotes change in number or companies in sample compared to previous year.
**Denotes new sample for 2011.
Appendix II
Sample: geography/number of companies
Key Trends IndicatorsInd
ia 2
00
Irel
and
40
Ital
y 10
0*
Jap
an 5
00
Ko
rea
200
Lati
n A
mer
ica
50
New
Zea
land
50
No
rdic
260
*
Rus
sia
50
So
uth
Afr
ica
100
Sw
itze
rlan
d 1
00
Turk
ey 1
00
UK
FT
SE
350
US
S&
P 5
00
Ove
rall5
42
Appendix III: Investor CDP 2011 information request (questionnaire)
Introduction
Q0.1: IntroductionPlease give a general description and introduction to your organization. You are not required to give an introduction to your corporation, but please do so if you wish.
Q0.2: Reporting Year. Please state the start and end date of the year for which you are reporting data.
Q0.3: Country list configuration. Please select the countries for which you will be supplying data.
Q0.4: Currency selection.Please select the currency in which you would like to submit your response.
Q0.5: Please select if you wish to complete a shorter information request.
Q0.6: ModulesAs part of the Investor CDP information request, electric utilities, companies with electric utility activities or assets, com-panies in the automobile or auto com-ponent manufacture sectors and com-panies in the oil and gas industry should complete supplementary questions in addition to the main questionnaire. The presentation of these modules depends on your company’s classification accor-ding to the Global Industry Classification Standard (GICS). Those that apply are:o 55101010 Electric Utilitieso 55103010 Multi-Utilitieso 10102020 Oil & Gas E&Po 10102010 Integrated Oil & Gaso 25101010 Auto Parts & Equipmento 25102010 Automobile Manufacturers
Management Module
Q.1.1: Where is the highest level of direct responsibility for climate change within your company?• Individual/sub-set of the Board or other committee appointed by the Board
• Senior manager/officer• Other manager/officer• No individual or committee with overall responsibility for climate change.
Q1.1a: Please identify the position of the individual or name of the committee with this responsibility
Q1.2: Do you provide incentives for the management of climate change issues, including the attainment of targets?• Yes• No
Q1.2a: Please complete the table to identify who is entitled to benefit from these incentives?• Who is entitled to benefit• The type of incentives• Incentivized performance indicator
Strategy page
Q2.1: Please select the option that best describes your risk management procedures with regard to climate change risks and opportunities• Integrated into multi-disciplinary company-wide risk management processes• A specific climate change risk management process• There are no documented processes for assessing and managing risk and opportunities from climate change
Q2.1a: Please provide further detailsi. the scope of the process, i.e. the type of risks and opportunities considered by the process such as regulatory, customer behavior changes, reputational and weather-related;
ii. how risks/opportunities are assessed at a company level (e.g. reputational risk can impact on the full corporation);
iii. how risks/opportunities are assessed at an asset level (e.g. physical impacts can affect individual facilities);
iv. the frequency of monitoring;
v. criteria for determining materiality/priorities, and
vi. to whom are the results reported?
Q2.2: Is climate change integrated into your business strategy?• Yes• No
Q.2.2a: Please describe the process and outcomesi. How the business strategy has been influenced, i.e. the internal communication/reporting processes that achieve this;
ii. What aspects of climate change have influenced the strategy, e.g. how the strategy is linked to risks, opportunities and emissions’ reduction targets (requested in subsequent sections of the information request)
iii. The most important components of the short term strategy that have been influenced by climate change (e.g. changes in operational practices, changing the way business is communicated, etc.). If climate change has only affected the long term strategy, this should be stated;
iv. The most important components of the long term strategy that have been influenced by climate change (e.g. changing core business focus, development and incorporation of new technologies, etc.). In the less likely event that climate change has only affected the short term strategy, this should be stated;
v. How this is gaining you strategic advantage over your competitors;
vi. What are the most substantial business decisions made during the reporting year that have been influenced by climate change-driven aspects of the strategy (e.g. investment, location, procurement, M&A, R&D). Both the business decision and the aspect of climate change that has influenced the business decision must be made clear in the answer. If there are none to report, this should be stated.
43
Q2.2b: Please explain why not
Q2.3: Do you engage with policy makers to encourage further action on mitigation and/or adaptation?• Yes• No
Q2.3a: Please explain (i) the engagement process and (ii) actions you are advocating(i) Engagement process i. Method of engagement – e.g. through a trade organization, as an individual company, through funding of a third party, etc. and public or private;
ii. Topic of engagement – e.g. legislation, policy, products/ technologies;
iii. Nature of engagement – e.g. responding to a consultation, participating in policy research;
(ii) Actions advocated i. The nature of advice given, e.g. were you encouraging action on mitigation, on adaptation, endorsement or opposition of policy proposals?
Targets & Initiatives
Q3.1: Did you have an emissions’ reduction target that was active (ongoing or reached completion) in the reporting year?• Absolute target• Intensity target• Absolute and intensity targets• No
Q3.1a: Please provide details of your absolute target• ID• Scope• % of emissions in scope• % of reduction from base year• Base year• Base year emissions (metric tonnes CO2e)• Target year• Comment
Q3.1b: Please provide details of your intensity target
• ID• Scope• % of emissions in scope• % of reduction from base year• Base year• Base year emissions (metric tonnes CO2e)• Target year• Comment
Q3.1c: Please also indicate what change in absolute emissions this intensity target reflects• ID• Direction of change anticipated in absolute Scope 1+2 emissions at target completion?• % change anticipated in absolute Scope 1+2 emissions• Direction of change anticipated in absolute Scope 3 emissions at target completion?• % change anticipated in absolute Scope 3 emissions• Comment
3.1d: Please provide details on your progress against this target made in the reporting year• ID• % complete (time)• % complete (emissions)• Comment
Q3.1e: Please explain (i) why not; and (ii) forecast how your emissions will change over the next five years
Q3.2: Does the use of your goods and/or services directly enable a third party to avoid GHG emissions?• Yes• No
Q3.2a: Please provide detailsi. How the emissions are/were avoided;
ii. An estimate of the amount of emissions that are/were avoided over time, e.g. x metric tonnes CO2e per year with a 2007 baseline; x metric tonnes per year over a period of 10 years (2003-2013);
iii. The methodology, assumptions, emission factors and global warming
potentials used for your estimations;
iv. Whether you are considering generating CERs or ERUs within the framework of CDM or JI (UNFCCC).
Q3.3: Did you have emissions’ reduction initiatives that were active within the reporting year (this can include those in the planning and implementation phases)• Yes• No
Q3.3a: Please provide details in the table below• Activity type• Description of activity• Annual monetary savings (unit currency)• Investment required (unit currency)• Payback period
Q3.3b: What methods do you use to drive investment in emissions’ reduction activities?
Q3.3c: If you do not have any emissions’ reduction initiatives, please explain why not
Communications
Q4.1: Have you published information about your company’s response to climate change and GHG emissions performance for this reporting year in places other than in your CDP response? If so, please attach the publication(s)
Risk & Opportunities ModuleClimate Change Risks
Q5.1 Have you identified any climate change risks (current or future) that have the potential to generate a substantive change in your business operations, revenue or expenditure?• Risks driven by regulation• Risks driven by changes in physical climate parameters• Risks driven by changes in other climate-related developments
Appendix III
44
Q5.1a: Please describe your risks driven by changes in regulation• ID
• Risk driver o International agreements o Air pollution limits o Carbon taxes o Cap and trade schemes o Emission reporting obligations o Fuel/energy taxes and regulations o Product efficiency regulations and standards o Product labeling regulations and standards o Voluntary agreements o General environmental regulations, including planning o Uncertainty surrounding new regulation o Lack of regulation o Other regulatory drivers
• Description
• Potential impact o Increased capital cost o Reduced demand for goods/ services o Reduction/disruption in production capacity o Reduction in capital availability o Reduced stock price o Inability to do business o Wider social disadvantages o Other
• Timeframe o Current o 1-5 years o 6-10 years o >10 years o Unknown
• Direct/Indirect o Direct o Indirect (Supply chain) o Indirect (Client)
• Likelihood o Virtually certain o Very likely o More likely than not o About as likely as not o Unlikely
o Very unlikely o Exceptionally unlikely o Unknown
• Magnitude of impact o High o Medium - High o Medium o Low – Medium o Low o Unknown
Q5.1b Please describe (i) the potential financial implications of this risk before taking action; (ii) the methods you are using to manage this risk and (iii) the costs associated with these actions
Q5.1c: Please describe your risks that are driven by change in physical climate parameters• Risk driver• Description• Potential impact; Timeframe; Direct/ Indirect; Likelihood; Magnitude of impact
Q5.1d Please describe (i) the potential financial implications of this risk before taking action; (ii) the methods you are using to manage this risk and (iii) the costs associated with these actions
Q5.1e: Please describe your risks that are driven by changes in other climate-related developments• Risk driver• Description• Potential impact; Timeframe; Direct/ Indirect; Likelihood; Magnitude of impact5.1f Please describe (i) the potential financial implications of this risk before taking action; (ii) the methods you are using to manage this risk and (iii) the costs associated with these actions
Q5.1g: Please explain why you do not consider your company to be exposed to risks driven by changes in regulation that have the potential to generate a substantive change in your business operations, revenue or expenditure.
Q5.1h: Please explain why you do not consider your company to be exposed to risks driven by physical climate parameters that have the potential to generate a substantive change in your business operations, revenue or expenditure.
Q5.1i: Please explain why you do not consider your company to be exposed to risks driven by changes in other climate-related developments that have the potential to generate a substantive change in your business operations, revenue or expenditure.
Climate Change Opportunities
Q6.1 Have you identified any climate change opportunities (current or future) that have the potential to generate a substantive change in your business operations, revenue or expenditure?• Opportunities driven by changes in regulation• Opportunities driven by changes in physical climate parameters• Opportunities driven by changes in other climate-related developments
Q6.1a: Please describe your opportunities that are driven by changes in regulation• ID
• Opportunity driver o International agreements o Air pollution limits o Carbon taxes o Cap and trade schemes o Emission reporting obligations o Fuel/energy taxes and regulations o Product efficiency regulations and standards o Product labeling regulations and standards o Voluntary agreements o General environmental regulations, including planning
Carbon Disclosure Project 2011 – Italy 100 Report
45
Appendix III
o Uncertainty surrounding new regulation o Lack of regulation o Other regulatory drivers
• Description
• Potential impacts o Reduced operational costs o Reduced capital cost o Increased demand for for existing products/services • Premium price opportunities o Increased production capacity o Increase in capital availability – opportunities to attract capital investment o Increased stock price o New products/business services o Investment opportunities o Wider social benefits
• Timeframe o Current o 1-5 years o 6-10 years o >10 years o Unknown
• Direct/Indirect o Direct o Indirect (Supply chain) o Indirect (Client)
• Likelihood o Virtually certain o Very likely o More likely than not o About as likely as not o Unlikely o Very unlikely o Exceptionally unlikely o Unknown
• Magnitude of impact o High o Medium - High o Medium o Low – Medium o Low o Unknown
Q6.1b Please describe (i) the po-tential financial implications of the opportunity; (ii) the methods you
are using to manage this opportu-nity and (iii) the costs associated with these actions
Q6.1c: Please describe the opportunities that are driven by changes in physical climate parameters• Opportunity driver• Description• Potential impact; Timeframe; Direct/ Indirect; Likelihood; Magnitude of impact
Q6.1d Please describe (i) the po-tential financial implications of this opportunity; (ii) the methods you are using to manage this opportu-nity and (iii) the costs associated with these actions
Q6.1e: Please describe the opportunities that are driven by changes in other climate-relateddevelopments• Opportunity driver• Description• Potential impact; Timeframe; Direct/ Indirect; Likelihood; Magnitude of impact
Q6.1f Please describe (i) the potential financial implications of this opportunity; (ii) the methods you are using to manage this opportunity and (iii) the costs associated with these actions
Q6.1g: Please explain why you do not consider your company to be exposed to opportunities driven by changes in regulation that have the potential to generate a substantive change in your business operations, revenue or expenditure.
Q6.1h: Please explain why you do not consider your company to be exposed to opportunities driven by physical climate parameters that have the potential to generate a substantive change in your business operations, revenue or expenditure.
Q6.1i: Please explain why you do not consider your company to be exposed to opportunities driven by changes in other climate-related developments that have the poten-tial to generate a substantive chan-ge in your business operations, revenue or expenditure
Emissions ModuleEmissions Methodology
Q7.1: Please provide your base year and base year emissions (Scopes 1 and 2).
Q7.2: Please give the name of the standard, protocol or methodology you have used to collect activity data and calculate Scope 1 and Scope 2 emissions.
Q7.2a: If you have selected “Other”, please provide details below. If you have selected “Other” in answer to Question 7.2 please provide a response to this question.
Q7.3: Please give the source for the global warming potentials you have used• Gas• Reference
Q7.4: Please give the emissions factors you have applied and their origin; alternatively, please attach an Excel spreadsheet with this data• Fuel/Material/Energy• Emission Factor• Unit• Reference
Emissions Data
Q8.1: Please select the boundary you are using for your Scope 1 and 2 greenhouse gas inventory• Financial control• Operational control• Equity share• Climate Change Reporting Framework (CCRF)• Other
46
Q8.2a: Please provide your gross global Scope 1 emissions figures in metric tonnes CO2e
Q8.2b: Please provide your gross global Scope 1 emissions figures in metric tonnes CO2e – Part 1Breakdown• Boundary• Gross Global Scope 1 emissions (metric tonnes CO2e)• Comment
Q8.2c: Please provide your gross global Scope 1 emissions figures in metric tonnes CO2e – Part 1 Total• Gross Global Scope 1 emissions (metric tonnes CO2e) – Total Part 1• Comment
Q8.2d: Please provide your gross global Scope 1 emissions figures in metric tonnes CO2e – Part 2• Gross Global Scope 1 emissions (metric tonnes CO2e) – Other operationally controlled entities, activities or facilities• Comment
Q8.3a: Please provide your gross global Scope 2 emissions figures in metric tonnes CO2e
Q8.3b: Please provide your gross global Scope 2 emissions figures in metric tonnes CO2e – Part 1Breakdown• Boundary• Gross Global Scope 2 emissions (metric tonnes CO2e)• Comment
Q8.3c: Please provide your gross global Scope 2 emissions figures in metric tonnes CO2e – Total Part 1• Gross Global Scope 2 emissions (metric tonnes CO2e) – Total Part 1• Comment
Q8.3d: Please provide your gross global Scope 2 emissions figures in metric tonnes CO2e – Part 2• Gross Global Scope 2 emissions (metric tonnes CO2e) – Other operationally controlled entities, activities or facilities• Comment
Q8.4: Are there any sources (e.g. facilities, specific GHGs, activities, geographies etc.) of Scope 1 and Scope 2 emissions which are not included in your disclosure?General reasons for exclusions can include the following:• Incomplete information for the period in question;
• Structural changes to the organization including: o Mergers, o Acquisitions, o Divestments;
• Outsourcing and/or insourcing of activities, and
• Unreliable information
Q8.4a: Please complete the tableThis question only appears if you answer “yes” to Question 8.4• Reporting entity• Source• Scope• Explain why the source is excluded
Q8.5: Please estimate the level of uncertainty of the total gross global Scope 1 and 2 emissionsfigures that you have supplied and specify the sources of uncertainty in your data gathering, handlingand calculations• Scope• Uncertainty range• Main sources of uncertainty• Please expand on the uncertainty in your data
Q8.6: Please indicate the verification/assurance status that applies to your Scope 1 emissions• No emissions data provided• Not verified or assured• Verification or assurance underway but not yet complete - first year it has taken place• Verification or assurance underway but not yet complete - last year’s certificate available• Verification or assurance complete
Q8.6a: Please indicate the propor-tion of your Scope 1 emissions that are verified/assured. • More than 0% but less than or equal to 20%• More than 20% but less than or equal to 40%• More than 40% but less than or equal to 60%• More than 60% but less than or equal to 80%• More than 80% but less than or equal to 90%• More than 90% but less than or equal to 100%
Q8.6b: Please provide further details of the verification/assurance undertaken, and attach the relevant statements• Type of verification or assurance• Relevant standard• Relevant statement attached
Q8.7: Please indicate the verification/assurance status that applies to your Scope 2 emissions• No emissions data provided• Not verified or assured• Verification or assurance underway but not yet complete - first year it has taken place• Verification or assurance underway but not yet complete - last year’s certificate available• Verification or assurance complete
Q8.7a: Please indicate the proportion of your Scope 2 emissions that are verified/assured• More than 0% but less than or equal to 20%• More than 20% but less than or equal to 40%• More than 40% but less than or equal to 60%• More than 60% but less than or equal to 80%• More than 80% but less than or equal to 90%• More than 90% but less than or equal to 100%
Q8.7b: Please provide further details of the verification/assurance undertaken, and attach the relevant statements
Carbon Disclosure Project 2011 – Italy 100 Report
47
• Type of verification or assurance• Relevant standard• Relevant statement attached
Q8.8: Are carbon dioxide emissions from the combustion of biologically sequestered carbon (i.e. carbon dioxide emissions from burning biomass/biofuels) relevant to your company?
Q8.8a: Please provide the emissions in metric tonnes CO2e• Yes• No
Scope 1 Emissions Breakdown
Q9.1: Do you have Scope 1 emissions sources in more than one country or region (if covered by emissions regulation at a regional level)?• Yes• No
Q9.1a: Please complete the table below• Country/Region• Scope 1 metric tonnes CO2e
Q9.2: Please indicate which other Scope 1 emissions breakdowns you are able to provide• By business division• By facility• By GHG type• By activity
Q9.2a: Please break down your total gross global Scope 1 emissions by business division• Business division• Scope 1 emissions (metric tonnes CO2e)
Q9.2b: Please break down your total gross global Scope 1 emissions by facility• Facility• Scope 1 emissions (metric tonnes CO2e)
Q9.2c: Please break down your total gross global Scope 1 emissions by GHG type• GHG type• Scope 1 emissions (metric tonnes CO2e)
Q9.2d: Please break down your total gross global Scope 1 emissions by activity• Activity• Scope 1 emissions (metric tonnes CO2e)
Scope 2 Emissions Breakdown
Q10.1: Do you have Scope 2 emis-sions’ sources in more than one country or region (if covered by emis-sions regulation at a regional level)?
Q10.1a: Please complete the table below• Country/Region• Scope 2 metric tonnes CO2e
Q10.2: Please indicate which other Scope 2 emissions breakdowns you are able to provide• By business division• By facility• By activity
Q10.2a: Please break down your total gross global Scope 2 emissions by business division• Business division• Scope 2 emissions (metric tonnes CO2e)
Q10.2b: Please break down your total gross global Scope 2 emissions by facility• Facility• Scope 2 emissions (metric tonnes CO2e)
Q10.2c: Please break down your total gross global Scope 2 emissions by activity• Activity• Scope 2 emissions (metric tonnes CO2e)
Scope 2 Contractual Emissions
Q11.1: Do you consider that the grid average factors used to report Sco-pe 2 emissions in Question 8.3 re-flect the contractual arrangements you have with electricity suppliers? • Yes• No
Q11.1a: You may report a total con-tractual Scope 2 figure in response to this question. Please provide your total global contractual Scope 2 GHG emissions figure in metric tonnes CO2e.
Q11.1b: Explain the basis of the alternative figure
Q11.2: Has your organization retired any certificates, e.g. Renewable Energy Certificates, associated with zero or low carbon electricity within the reporting year or has this been done on your behalf?
Q11.2a: Please provide details including the number and type of certificates• Type of certificates• Number of certificates• Comments
Energy
Q12.1: What percentage of your total operational spend in the reporting year was on energy?o 0%o More than 0% but less than or equal to 5%o More than 5% but less than or equal to 10%o More than 10% but less than or equal to 15%o More than 15% but less than or equal to 20%o More than 20% but less than or equal to 25%o More than 25% but less than or equal to 30%o More than 30% but less than or equal to 35%o More than 35% but less than or equal to 40%
Appendix III
48
o More than 40% but less than or equal to 45%o More than 45% but less than or equal to 50%o More than 50% but less than or equal to 55%o More than 55% but less than or equal to 60%o More than 60% but less than or equal to 65%o More than 65% but less than or equal to 70%o More than 70% but less than or equal to 75%o More than 75% but less than or equal to 80%o More than 80% but less than or equal to 85%o More than 85% but less than or equal to 90%o More than 90% but less than or equal to 95%o More than 95% but less than or equal to 100%
Q12.2: Please state how much fuel, electricity, heat, steam and cooling in MWh your organization has consumed during the reporting year• Energy type• MWh
Q12.3: Please complete the table by breaking down the total “Fuel” figure entered above by fuel type• Fuels• MWh
Emissions performance
Q13.1: How do your absolute emissions (Scope 1 and 2 combined) for the reporting year compare to the previous year?• Increased• Decreased• No change• This is our first year of estimation• We don’t have any emissions data
Q13.1a: Please complete the table• Reason• Emissions value (percentage)• Direction of change• Comment
Q13.2: Please describe your gross combined Scope 1 and 2 emissions for the reporting year in metric tonnes CO2e per unit currency total revenue• Intensity figure• Metric numerator• Metric denominator• % change from the previous year• Direction of change from the previous year• Explanation
Q13.3: Please describe your gross combined Scope 1 and 2 emissions for the reporting year in metric tonnes CO2e per full time equivalent (FTE) employee• Intensity figure• Metric numerator• Metric denominator• % change from the previous year• Direction of change from the previous year• Explanation
Q13.4: Please provide an additional intensity (normalized) metric that is appropriate to your business operations• Intensity figure• Metric numerator• Metric denominator• % of change from the previous year• Direction of change from the previous year• Explanation
Emissions trading
Q14.1: Do you participate in any emissions trading schemes?• Yes• No, but we anticipate doing so in the next 2 years• No, and we do not currently anticipate doing so in the next 2 years
Q14.1a: Please complete the following table for each of the emission trading schemes in which you participate. • Scheme name• Period for which data is supplied• Allowances allocated
• Allowances purchased• Verified emissions in metric tonnes CO2e• Details of ownership
Q14.1b: What is your strategy for complying with the schemes in which you participate or anticipate participating?
Q14.2: Has your company originated any project-based carbon credits or purchased any within the reporting period?• Yes• No
Q14.2a: Please complete the table• Credit organization or credit purchase• Project type• Project identification• Verified to which standard• Number of credits (metric tonnesCO2e)• Number of credits (metric tonnes CO2): Risk adjusted volume• Credits retired• Purpose, e.g. compliance
Scope 3 Emissions
Q15.1: Please provide data on sources of Scope 3 emissions that are relevant to your organization• Source of Scope 3 emissions• Metric tonnes CO2e• Methodology• If you cannot provide a figure for emissions, please describe them
Q15.2: Please indicate the verification/assurance status that applies to your Scope 3 emissions• No emissions data provided• Not verified or assured• Verification or assurance underway but not yet complete - first year it has taken place• Verification or assurance underway but not yet complete - last year’s certificate attached• Verification or assurance complete
Carbon Disclosure Project 2011 – Italy 100 Report
49
Q15.2a: Please indicate the proportion of your Scope 3 emissions that are verified/assured• More than 0% but less than or equal to 20%• More than 20% but less than or equal to 40%• More than 40% but less than or equal to 60%• More than 60% but less than or equal to 80%• More than 80% but less than or equal to 90%• More than 90% but less than or equal to 100%
Q15.2b: Please provide further details of the verification/assurance undertaken, and attach the relevant statements• Type of verification or assurance• Relevant standard• Relevant statement attached
Q15.3: How do your absolute Scope 3 emissions for the reporting year compare to the previous year?• Increased• Decreased• No change• This is our first year of estimation• We don’t have any emissions data
Q15.3a: Please complete the table• Reason• Emissions value (percentage)• Direction of change• Comment
Appendix III

50
Carbon Disclosure Project 2011 – Italy 100 Report
Notes
51
Partner CDP Italy
Italian scorer
Partner CDP Italy and Report Writer
Event Sponsor
Carbon Disclosure Project 2011 – Italy 100 Report
52
Important NoticeThe contents of this report may be used by anyone providing acknowledgement is given to Carbon Disclosure Project (CDP). This does not represent a license to repack-age or resell any of the data reported to CDP and presented in this report. If you intend to do this, you need to obtain express permission from CDP before doing so. Accenture and CDP prepared the data and analysis in this report based on responses to the 2011 CDP information request. Accenture and CDP do not guarantee the ac-curacy or completeness of this information. Company scoring was prepared by Kyoto Club and PwC UK on the basis of CDP’s own methodology, without any Accenture involvement. Accenture, therefore, does not take any responsibility for ranking accuracy.Accenture and CDP make no representation or warranty, express or implied, and accept no liability concerning the fairness, accuracy, or completeness of the information and opinions contained herein or for any consequences of you or anyone else acting, or refraining from action, in reliance on the information contained in this publication or for any decision based on it. You should not act upon the information contained in this publication without obtaining specific professional advice. All information and views expressed herein by CDP and Accenture are based on their judgment at the time of this report and are subject to change without notice due to economic, political, industry and firm-specific factors. Guest commentaries, where included in this report, reflect the views of their respective authors; their inclusion is not an endorsement of them.Accenture and CDP and their affiliated member firms or companies, or their respective shareholders, members, partners, principals, directors, officers and/or employees, may have an interest in the securities of the companies discussed herein. The securities of the companies mentioned in this document may not be eligible for sale in some states or countries, nor suitable for all types of investors; their value and the income they produce may fluctuate and/or be adversely affected by exchange rates.‘Accenture’ refers to Accenture S.p.A.
‘Carbon Disclosure Project’ and ‘CDP’ refer to Carbon Disclosure Project, a United Kingdom company limited by guarantee, registered as a United Kingdom charity number 1122330.
© 2011 Carbon Disclosure Project. All rights reserved.
CDP Contacts
Diana GuzmanSouthern Europe [email protected]
Elina RolfeAccount Manager Reporter [email protected]
Sue Sue Howells Head of Global Operations
Daniel TurnerHead of Disclosure
Marcus NortonHead Investor CDP andCDP Water Disclosure
Frances WayProgram Director
Carbon Disclosure Project40 Bowling Green LaneLondon, EC1R 0NEUnited KingdomTel: + 44 (0) 20 7970 5660Fax: + 44 (0) 20 7691 [email protected]
Emanuele CacciatoreSenior [email protected]
Accenture S.p.A.Via Maurizio Quadrio 1720154 Milano
Report Writer Contacts
Danilo [email protected]
Beatrice LamonicaSenior [email protected]
CDP Italy Partner
Banca Monte dei Paschi di Siena
Piazza Salimbeni, 353100 [email protected]
CDP Board of Trustees
Chairman: Alan Brown Schroders
Jeremy Smith Berkeley Energy
James Cameron Climate Change Capital
Takejiro Sueyoshi
Chris Page Rockefeller Philanthropy Advisors
Tessa Tennant The Ice Organisation
Dr. Christoph Schroeder TVM Capital
Martin Wise Relationship Capital Partners
CDP Italy Scorer
Kyoto Club
Via Genova, 2300184 Romawww.kyotoclub.org