
CDFIs Stepping into the Breach: An Impact Evaluation ... Stepping...CDFIs Stepping into the Breach:...
58
1 CDFIs Stepping into the Breach: An Impact Evaluation—Summary Report Research conducted for Office of Financial Strategies and Research Community Development Financial Institutions Fund U.S. Department of the Treasury Research conducted by Michael Swack Eric Hangen Jack Northrup The Carsey School of Public Policy University of New Hampshire August 2014
Transcript of CDFIs Stepping into the Breach: An Impact Evaluation ... Stepping...CDFIs Stepping into the Breach:...
1
CDFIs Stepping into the Breach: An Impact Evaluation—Summary Report
Research conducted for
Office of Financial Strategies and Research Community Development Financial Institutions Fund
U.S. Department of the Treasury
Research conducted by
Michael Swack Eric Hangen
Jack Northrup
The Carsey School of Public Policy University of New Hampshire
August 2014
2
Table of Contents
Study Overview ........................................................................................................................................ 4
The State of Impact Measurement in the CDFI Industry ......................................................... 7
Measuring Impact of CDFIs ............................................................................................................ 7
Development of Impact Measurement Tools for the Industry ......................................... 8
GIIN and the IRIS Metrics ................................................................................................................ 8
Moody’s Analytics—Social Performance Assessment to Assess How Well a Microfinance Institution Achieves Social Goals...................................................................... 8
Aspen MicroTracker.......................................................................................................................... 9
Success Measures ............................................................................................................................... 9
Analysis of CDFI Lending Activity .................................................................................................... 9
Methodology and Limitations .................................................................................................... 10
Finding 1: The CDFI industry has grown substantially, leveraging investment and growing its lending activity even in the face of a recession and dramatic changes in the financial environment. It remains, however, a tiny sector relative to mainstream financial institutions. ............................................................................................ 14
Finding 2: CDFIs are delivering the majority of their lending to borrowers from targeted, historically underserved groups such as low-income or minority borrowers. ......................................................................................................................................... 22
Finding 3: CDFIs are concentrating lending activity in census tracts with signs of distress such as high poverty or unemployment rates—much more so than conventional lenders. .................................................................................................................... 26
Finding 4: CDFIs are meeting needs for financing with “plain vanilla” products that minimize risks to the borrower. However, they struggle to meet market needs for longer-term loans. ....................................................................................................... 30
Finding 5: There is little evidence of a spatial-temporal relationship between CDFI lending and mainstream lending activity, although data limitations impact this analysis. ............................................................................................................................................... 32
Finding 6: No relationship between concentrated and sustained CDFI lending activity was detected in a particular census tract and subsequent improvement of neighborhood conditions in that census tract. However, data and methodology limitations again are very likely impacting the analysis. ................................................. 35
Impact of CDFI Fund Awards on CDFI Financial Health and Activity Levels ................ 38
3
Regression Discontinuity Analysis ........................................................................................... 38
A Note on Debt Versus Equity Financing ............................................................................... 42
Key Themes and Findings from Interviews and Focus Groups ..................................... 47
Recommendations for Future Evaluation Efforts ................................................................... 52
Focus Additional Research on the Most Effective Strategies to Support Growth of the CDFI Industry ............................................................................................................................ 52
Standardize Definitions ................................................................................................................ 53
Develop Shared Measurement Systems, Including Encouraging Fuller Use of the Fund’s Impact Reporting System .............................................................................................. 54
Develop Proxy Measures .............................................................................................................. 56
Carry Out Regular External Evaluations ................................................................................ 56
Final Recommendation—A CDFI “Infrastructure and Innovation” Fund .................. 57
4
Study Overview
This report summarizes research undertaken by the Carsey School of Public Policy to evaluate impacts of the Community Development Financial Institutions (CDFI) Fund on CDFIs and of the CDFI industry on the people and communities it serves. Major research tasks included:
• Structured interviews with staff leadership at 22 CDFIs to discuss their impact evaluation activities and challenges, and opportunities they face for impact evaluation work. These interviews were complemented by additional reports, documents and evaluations provided by the CDFIs.
• A detailed analysis of CDFI Fund Transaction Level Report (TLR) data to study the types of borrowers and communities that CDFIs are serving, and the types and terms of financing they are providing.
• A multivariate analysis combining TLR data with other data sources to explore the relationships between CDFI activity and mainstream lending—specifically whether CDFIs play a role in “priming the pump” for mainstream lending, or whether they act to fill gaps left behind by mainstream lenders.
• An exploratory analysis of the neighborhood impacts of concentrated CDFI lending activity, looking at 15 census tracts that have received large and consistent levels of CDFI investment between 2007 and 2011, versus a set of comparison tracts matched on indicators of distress such as poverty and unemployment rates.
• An analysis seeking to determine the impacts that CDFI Fund awards have on the subsequent growth and health of CDFI loan funds. The analysis used a regression discontinuity approach to compare organizations that fell just below and above the scoring cutoff points for funding on their CDFI Financial Award applications.
Key findings of this research are laid out in this report, with supporting analysis presented in more detail in a series of technical appendices.
In summary, we find a variety of evidence indicating that CDFIs are advancing the statutory purposes of the CDFI Fund to promote economic revitalization and community development through the provision of credit, capital and financial services to underserved populations and communities in the United States. More specifically, our main findings are that:
• CDFIs are using a broad range of metrics to track success across a very broad range of outcomes. The diversity of missions that different CDFIs are pursuing presents one of the principal challenges to developing shared impact measurement systems, including the Community Investment Impact
5
System (CIIS) used by the CDFI Fund. Nevertheless, we see a number of promising evaluation initiatives underway in the field. These range from rigorous evaluation work undertaken by leading CDFIs to efforts to develop impact measurement systems and proxy measures that could pave the way to broader engagement in meaningful evaluation activity across the field.
• The CDFI industry has grown substantially, leveraging investment and increasing its lending activity even in the face of a recession and cataclysmic changes in the financial environment. CDFIs have grown their lending volume far in excess of what would be expected if they depended solely on CDFI Fund financial awards for their capital. However, the CDFI sector remains tiny relative to mainstream financial institutions.
• CDFIs are delivering the majority of their lending to borrowers from targeted, historically underserved groups such as low-income or minority borrowers. Depending on loan purpose, CDFIs are delivering from roughly 65 to over 90 percent of loan volume to historically underserved borrowers. These borrowers include low-income households and business owners, minorities, unbanked borrowers, first-time homebuyers, nonprofit or tribal organizations, female-headed households, or borrowers living in a CDFI Fund designated Investment Area.
• CDFIs are concentrating lending activity in census tracts with signs of distress such as high-poverty or unemployment rates—much more so than conventional lenders. This evidence suggests that CDFIs do indeed “fill the gap” that is left by conventional lenders. However, the results from a multivariate analysis of whether tracts with lower levels of mainstream lending are more likely to receive CDFI loans than other tracts that are distressed in other ways are inconclusive—although data and methodological limitations may be largely responsible for this result.
• CDFIs are meeting needs for financing with “plain vanilla” products that minimize risks to the borrower. Most financing offered by CDFIs is on terms that decrease borrower risks—for example, most financing is offered on a fixed rate, and balloon payments are rarely a feature of CDFI loans outside the real estate development sector, where such features are to be expected. However, many CDFIs appear to struggle to meet market needs for longer-term loans, a dynamic that may relate to the lack of access to long-term capital in the sector.
There are some noteworthy limitations in the data and methods that are discussed in the body of the report:
• Only CDFIs that have received an award from the CDFI Fund within the past three years are required to report detailed data to the Fund.
6
• There is a need for the industry to standardize definitions of both financial indicators and outcome indicators (such as jobs created). This lack of standardization presents obstacles to more refined approaches of evaluating the impact of the CDFI industry on the communities it serves, and of the impact of the CDFI Fund on the industry.
• Community Reinvestment Act (CRA) data coverage for mortgage and small-business lending varies by type of lender and assessment area and is generally limited for smaller financial institutions. Because of this, it is not possible to compare the lending patterns of smaller regulated institutions with CDFIs.
• We were unable to find significant effects of concentrated CDFI investments on a limited number of neighborhood revitalization metrics, and the results from attempting to determine the impacts of CDFI Fund financial awards on the growth and financial health of CDFI nonprofit loan funds were inconclusive. In both cases, the data and methodological limitations may be at play.
7
The State of Impact Measurement in the CDFI Industry
Measuring Impact of CDFIs
The CDFI sector has grown rapidly since the mid-1990s, with approximately 1,000 CDFIs across the country today. Evaluations of their operations, including our own industry analysis, have generally painted a positive picture of the sector.1 Yet questions remain. Insufficient data and poor data quality—in part because of the relative newness of the sector—pose particular problems. Additionally, there is no single set of performance measures that can be applied to the CDFI sector as a whole. Instead, the field must develop a performance measurement framework that can be used as a tool to monitor the individual stakeholder relationships of each CDFI.
Measuring impact or performance is a complicated endeavor because communities are complex systems.2 They consist of many interrelated structures and activities that, along with external factors, influence the very conditions any community or economic development program, including CDFIs, seek to affect. It is also the case that most CDFI investments are small relative to both the size and need of the neighborhoods or communities they target. As a result, it is often unrealistic to expect to measure investment or project impacts, let alone broader impacts such as effects on poverty levels or property values. Thus, identifying proper outcome measurements, determining whether benefits flow to those with greater needs, and sorting out (both short-term and long-term) causes and effects are difficult tasks.3
Program-specific evaluation challenges exist as well. For example, the fact that the CDFI Fund provides funds to CDFIs that serve specific communities as well as low-income individuals, whether or not they live in a poor community, means that evaluations must measure the benefit to people as well as places. In addition, individual CDFIs make investment decisions so evaluators must consider as legitimate multiple conceptions of need and impact, as articulated by different CDFIs. Finally, the fact that CDFIs finance a wide array of projects—from housing to financial counseling—means that there is no single outcome metric that applies to all projects and/or CDFIs.
Additionally, many CDFIs use their internally collected data to recognize patterns of impact without the use of randomized trials and other external evaluations. Using comparative data over time, they are often able to identify key differences in their activities that correlate with better long-term outcomes, providing informal but
1 Swack, Northrup and Hangen. CDFI Industry Analysis: Summary Report. Carsey Institute, 2012 2 For a full discussion of the literature, see Abravanel, Martin, Nancy M Pindus, and Brett Theodo. Evaluating Community And Economic Development Programs: A Literature Review To Inform Evaluation Of The New Markets Tax Credit Program. The Urban Institute, 2010. 3 For a detailed discussion of research design issues related to measuring outcomes for CDFIs see Immergluck, Dan. What Might We Know? Research Design Issues for Measuring CDFI Subsector Impacts. Georgia Institute of Technology, 2006. www.prism.gatech.edu/~di17/Macarthur.pdf.
8
useful lessons on how to improve their lending activities and increase their effectiveness.
Development of Impact Measurement Tools for the Industry
The fields of community development and community development finance have begun to develop various metrics and tools that attempt to measure impact of investments on individuals and communities. Tools developed by the field include the Investors Reporting and Investment Standard (IRIS) metrics developed by the Global Impact Investment Network (GIIN), the microTest developed by the Aspen Institute, the Success Measures program managed by NeighborWorks, and the Social Performance Assessment tool developed by Moody’s Analytics. Each is briefly described in the following sections.
GIIN and the IRIS Metrics
The IRIS catalog, developed by GIIN, contains generally-accepted performance metrics that can be used to understand an organization’s social, environmental, and financial performance.4 Each IRIS metric is accompanied by a standardized definition and user guidance. With IRIS metrics, investors can compare performance information across their portfolio, or within specific sectors or investment objectives.
Using IRIS does not result in a certification or performance rating. Instead, IRIS metrics provide the foundation for any impact measurement system, and can be incorporated into different performance systems, such as assessment tools, scorecards, and methodologies. Organizations tracking performance data aligned with other measurement systems may already track IRIS-compatible data through the network of third-party standards, reporting frameworks, and compatible impact measurement tools.5
Moody’s Analytics—Social Performance Assessment to Assess How Well a Microfinance Institution Achieves Social Goals
The Social Performance Assessment (SPA) is a tool that provides investors and Microfinance Institutions (MFIs) with:
• A global scale for evaluating social performance
• A means of communicating social performance to stakeholders
• Transparency on factors, practices and indicators
• Concise, consistent and comparable reports
4 See http://iris.thegiin.org/metrics/list. 5 See http://iris.thegiin.org/about/complementary-impact-measurement-tools.
9
The SPA analyzes the infrastructure and processes an MFI has in place to achieve its social objectives.6 It combines field evaluations with comprehensive scoring and monitoring of an MFI’s practices to provide a globally comparable assessment grade. The SPA enables investors to make better-informed socially-oriented decisions, highlights an MFI’s strengths and limitations, and assesses the likelihood of an MFI having a positive effect on the lives of its customers.
Aspen MicroTracker
The microTracker helps microenterprise programs, donors, and investors track the performance and client outcomes of microenterprise organizations nationwide.7 MicroTracker builds on FIELD’s 20-year history, collecting data through the U.S. Microenterprise Census and MicroTest to allow for comparisons and benchmarks using standard measures across the U.S. microenterprise industry.
Success Measures
Success Measures is a program based at NeighborWorks America. It supports community-based organizations, their funding and intermediary partners to plan and conduct evaluations using participatory methods and a well-vetted suite of more than 250 data-collection tools. The Success Measures Data System (SMDS) is a secure, online environment that provides organizations with access to Success Measures’ outcome indicators and data-collection tools. It enables users to collect, tabulate, aggregate, store, export and share data, as well as customize their evaluations.
Analysis of CDFI Lending Activity
The results of our analysis show that CDFIs are actively involved in the promotion of the mission for which the CDFI Fund was formed—to provide credit for traditionally underserved groups of borrowers and in traditionally underserved geographies. Key findings of this section are that:
• The CDFI industry has grown substantially, leveraging investment and growing its lending activity, even in the face of a recession and cataclysmic changes in the financial environment. However, it remains a tiny sector relative to mainstream financial institutions.
• CDFIs are delivering the majority of their lending to borrowers from targeted, historically underserved groups such as low-income or minority borrowers.
6 See www.moodysanalytics.com/products-and-solutions/credit-research-risk-measurement/microfinance/social-performance-assessment. 7 See http://dev.microtracker.org.
10
• CDFIs are concentrating lending activity in census tracts with signs of distress such as high-poverty or unemployment rates—much more so than conventional lenders.
• CDFIs are meeting needs for financing with “plain vanilla” products that minimize risks to the borrower. However, they struggle to meet market needs for longer-term loans.
Methodology and Limitations
This section reviews TLRs from 333 CDFIs submitted for new loans and investments, from fiscal years 2003 through 2012. Before analyses, these data were filtered to look only at TLR records reporting a new origination of a loan or investment. The resulting loan-level dataset contains information on 143,084 loans and investments totaling $8.31 billion in volume. It is relevant to note that the 2003 data provides only partial coverage as the TLR was launched in 2003 (226 observations).
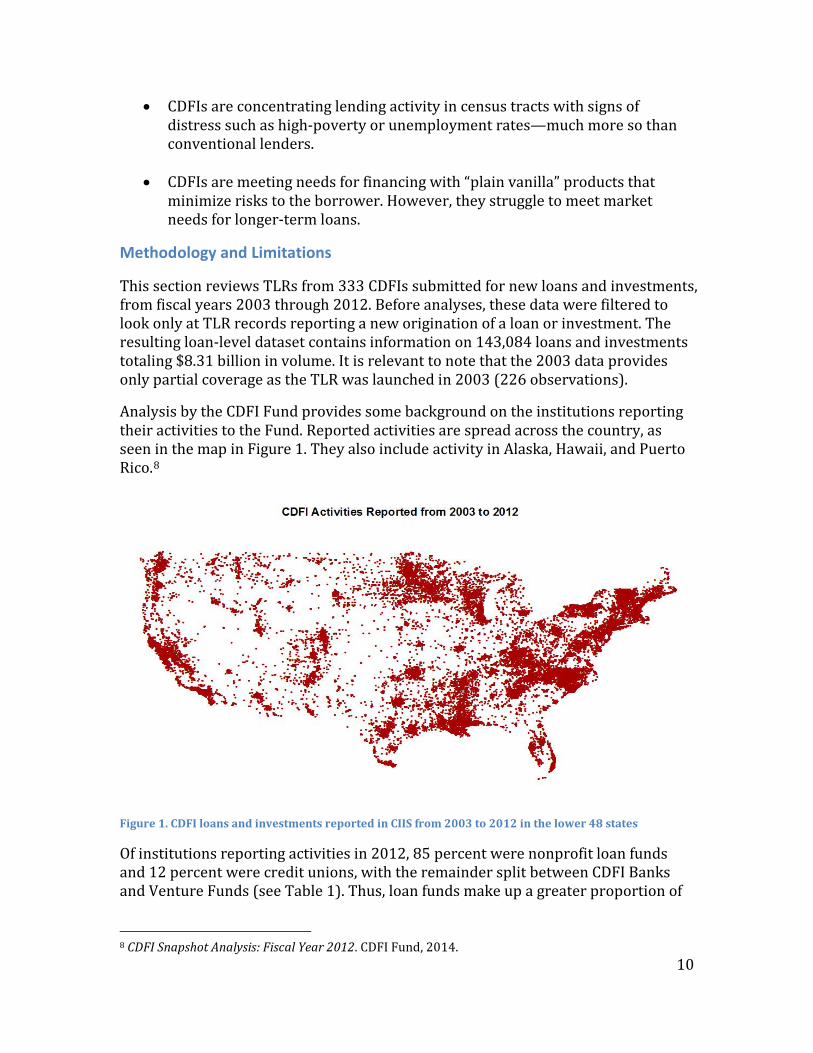
Analysis by the CDFI Fund provides some background on the institutions reporting their activities to the Fund. Reported activities are spread across the country, as seen in the map in Figure 1. They also include activity in Alaska, Hawaii, and Puerto Rico.8
Figure 1. CDFI loans and investments reported in CIIS from 2003 to 2012 in the lower 48 states
Of institutions reporting activities in 2012, 85 percent were nonprofit loan funds and 12 percent were credit unions, with the remainder split between CDFI Banks and Venture Funds (see Table 1). Thus, loan funds make up a greater proportion of
8 CDFI Snapshot Analysis: Fiscal Year 2012. CDFI Fund, 2014.
11
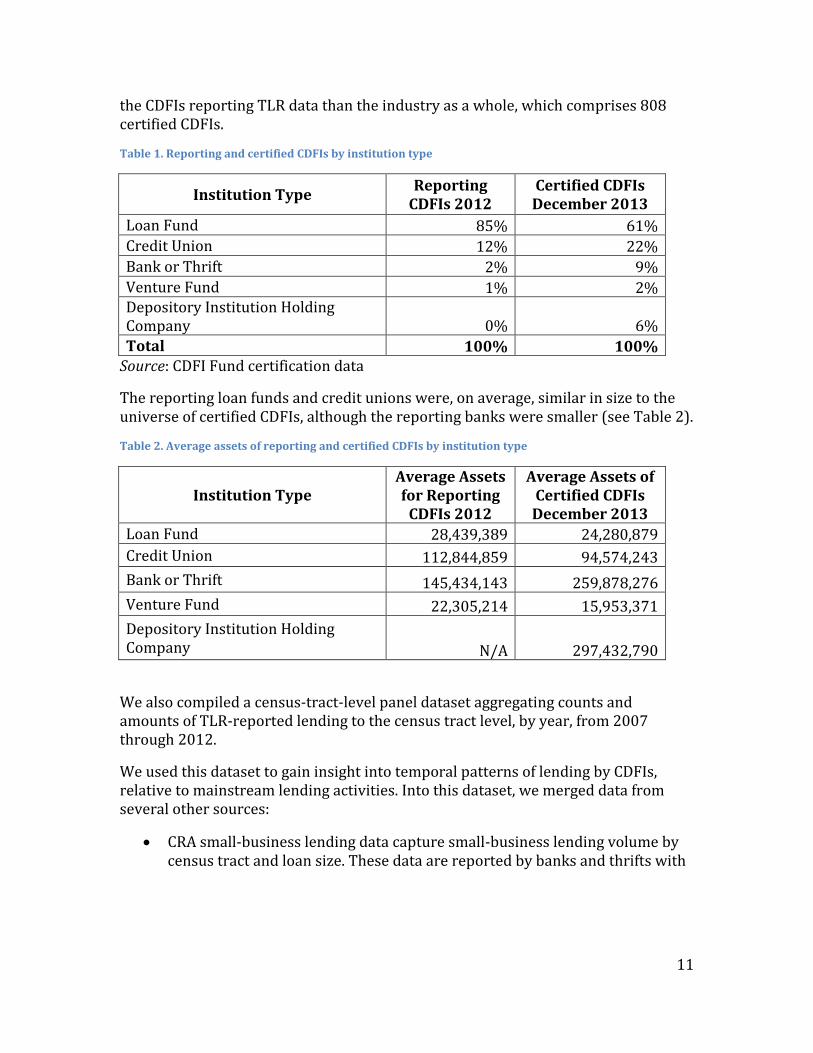
the CDFIs reporting TLR data than the industry as a whole, which comprises 808 certified CDFIs.
Table 1. Reporting and certified CDFIs by institution type
Institution Type Reporting CDFIs 2012
Certified CDFIs December 2013
Loan Fund 85% 61% Credit Union 12% 22% Bank or Thrift 2% 9% Venture Fund 1% 2% Depository Institution Holding Company 0% 6% Total 100% 100%
Source: CDFI Fund certification data
The reporting loan funds and credit unions were, on average, similar in size to the universe of certified CDFIs, although the reporting banks were smaller (see Table 2).
Table 2. Average assets of reporting and certified CDFIs by institution type
Institution Type Average Assets for Reporting
CDFIs 2012
Average Assets of Certified CDFIs
December 2013 Loan Fund 28,439,389 24,280,879 Credit Union 112,844,859 94,574,243 Bank or Thrift 145,434,143 259,878,276 Venture Fund 22,305,214 15,953,371 Depository Institution Holding Company N/A 297,432,790
We also compiled a census-tract-level panel dataset aggregating counts and amounts of TLR-reported lending to the census tract level, by year, from 2007 through 2012.
We used this dataset to gain insight into temporal patterns of lending by CDFIs, relative to mainstream lending activities. Into this dataset, we merged data from several other sources:
• CRA small-business lending data capture small-business lending volume by census tract and loan size. These data are reported by banks and thrifts with
12
total assets greater than $1 billion dollars and covers loans in amounts of $1 million or less.9
• Home Mortgage Disclosure Act (HMDA) data provide information on the disposition of mortgage loan applications by census tract, loan purpose, lender and loan type.10
• American Community Survey five-year averages for 2008 to 2012 and 2010 Census Data both provide demographic information down to the census tract level.11
• County Business Patterns data track the number of businesses and employees at the County level.12
To ensure consistent reporting of trends in the tracts studied, the dataset was limited to only tracts that did not change boundaries between the 2000 and 2010 Census. The resulting dataset covers 46,470 census tracts, in which reporting CDFIs made 34,829 loans totaling $3.76 billion.
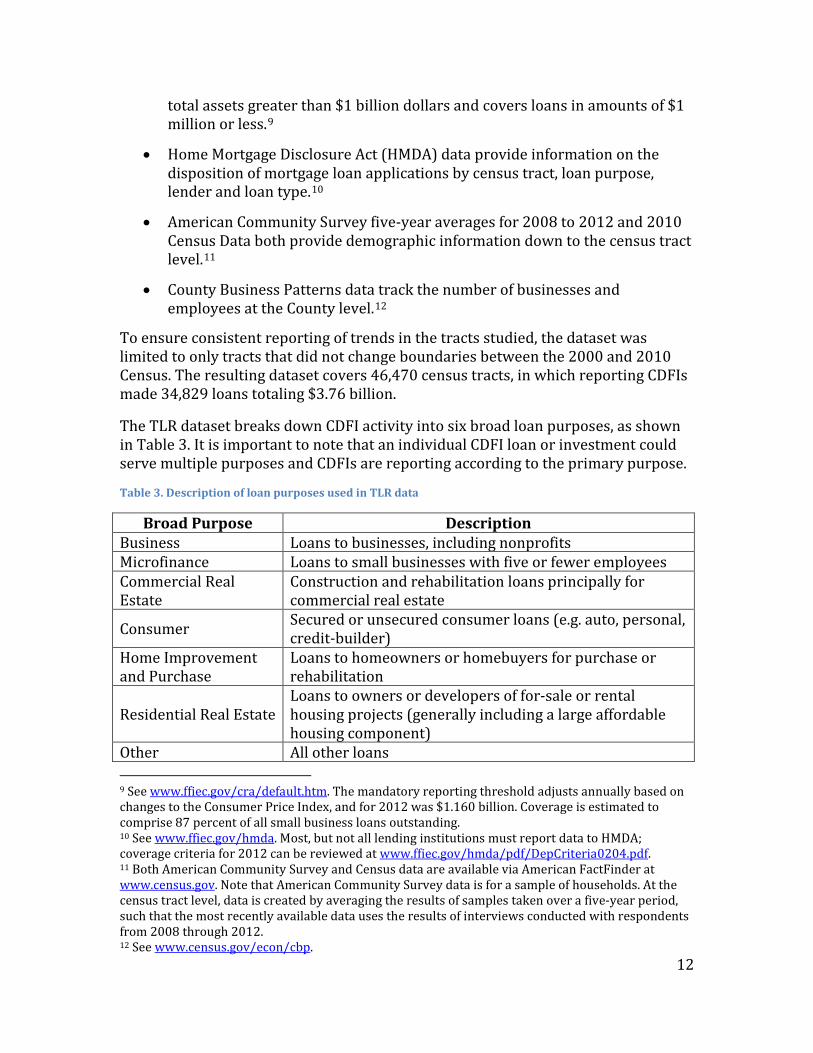
The TLR dataset breaks down CDFI activity into six broad loan purposes, as shown in Table 3. It is important to note that an individual CDFI loan or investment could serve multiple purposes and CDFIs are reporting according to the primary purpose.
Table 3. Description of loan purposes used in TLR data
Broad Purpose Description Business Loans to businesses, including nonprofits Microfinance Loans to small businesses with five or fewer employees Commercial Real Estate
Construction and rehabilitation loans principally for commercial real estate
Consumer Secured or unsecured consumer loans (e.g. auto, personal, credit-builder)
Home Improvement and Purchase
Loans to homeowners or homebuyers for purchase or rehabilitation
Residential Real Estate Loans to owners or developers of for-sale or rental housing projects (generally including a large affordable housing component)
Other All other loans 9 See www.ffiec.gov/cra/default.htm. The mandatory reporting threshold adjusts annually based on changes to the Consumer Price Index, and for 2012 was $1.160 billion. Coverage is estimated to comprise 87 percent of all small business loans outstanding. 10 See www.ffiec.gov/hmda. Most, but not all lending institutions must report data to HMDA; coverage criteria for 2012 can be reviewed at www.ffiec.gov/hmda/pdf/DepCriteria0204.pdf. 11 Both American Community Survey and Census data are available via American FactFinder at www.census.gov. Note that American Community Survey data is for a sample of households. At the census tract level, data is created by averaging the results of samples taken over a five-year period, such that the most recently available data uses the results of interviews conducted with respondents from 2008 through 2012. 12 See www.census.gov/econ/cbp.
13
The results of our analysis should be interpreted with caution, given the following limitations in data coverage:
• TLR data do not comprehensively cover the activities of the CDFI industry and heavily reflect the activities of a relatively small number of large CDFIs. Fifteen organizations account for 51 percent of the records in the scrubbed dataset, and 44 organizations account for 75 percent of the records. Furthermore, the total of 333 organizations reporting represents about 41 percent of the 808 certified CDFIs reported in the industry by the CDFI Fund as of December 2013. Only CDFIs that have a Financial Assistance award from the Fund are required to report TLR data, and these CDFIs may be different from the industry as a whole in other important ways. Moreover, for certain kinds of analysis, such as studying the relationship between mainstream lending presence and CDFI lending presence across census tracts, the incomplete coverage of the TLR data introduces problems of bias for which it is difficult to adequately control. In addition, the lack of CRA reporting data by smaller banks also introduces methodological issues as these smaller institutions may have a significant presence in the same census tracts as CDFIs, particularly for small-business lending.
• In describing borrower characteristics, many responses are either missing or the CDFI responded “not applicable” for particular variables. For example, while CDFIs reported 63,446 consumer loans in the TLR data, only 29,064 records contain information sufficient to determine the low-income status of the borrower, and only 2,697 report whether the borrower was banked at the time of intake. It is important to note that, for our research purposes, “not applicable” responses are as unsuitable as missing responses, as they provide no basis for determination of whether the borrower met a given characteristic or not.13 For this reason we also characterize such responses as missing. It is likely that the records with missing values for these variables may be different from the records with reported values—for example, that the proportion of unbanked borrowers is lower. On the other hand, for most loans, CDFIs reported on at least one target borrower characteristic. For this reason, in the summary report we focus on presenting a picture of whether borrowers met any one of multiple characteristics signaling a traditionally underserved borrower type (for example, low-income, unbanked or minority). For these analyses we consider an observation to have missing data only if all of the variables in question have missing values. Issues with missing responses are most prevalent for earlier years in the dataset. Data quality appears to have improved steadily over
13 This aspect of the data does not mean that CDFIs are not complying with data reporting requirements. CDFIs are required to make 60 percent or more of their loans, not all of their loans available to an eligible target market. Also, by law they may not force borrowers to disclose certain characteristics such as race.
14
time, and for that reason we also provide some analyses of isolated 2012 data.
• Certain data fields are required only for certain types of loans. For example, CDFIs are only required to report permanent jobs data for business and microfinance, and construction jobs are only required to report data for real estate loans—although CDFIs making other types of loans may also elect to report this data.
• Jobs data and other community impact data represent projected gross impacts. These are, as the CDFI Fund notes, not pro-rated for the percentage of financing provided by the CDFI to the business or project. Historically, the numbers reported in the TLR have been projected job creation numbers for the project or business at the time of CDFI investment. Job impacts are reported only for certain loan types (such as business and real estate lending) even though other loan types (such as home or consumer financing) would also be expected to indirectly stimulate spending and jobs in the local economy. CDFIs are now required to report on the actual number of jobs resulting from the business loans, as well as the source of the estimates, such as actual employment counts by the business, economic modeling or estimates based on wages. Yet, the CDFI Fund recognizes the need for methods to better estimate and benchmark job outcomes. Thus, the cumulative job numbers reported in the TLR do not provide an attribution of the effect of the CDFI loan on job creation or retention. A more challenging research question is determining whether a business gained more jobs than it would have otherwise (or, given the recessionary period covered in the data, whether it lost fewer jobs than it would have otherwise). Further research is needed to evaluate jobs impacts of CDFI lending, ideally using longitudinal business-level data and matched comparison group research design.
It is also worth noting that some outliers were observed for variables describing the terms of loans—for example, some interest rates were reported where it is very likely that a decimal should have been entered (such as 62 percent instead of 6.2 percent). As a way of addressing outliers, and mitigating any impact they might have on the results, the median rather than mean values were reported for most analyses.
Finding 1: The CDFI industry has grown substantially, leveraging investment and growing its lending activity even in the face of a recession and dramatic changes in the financial environment. It remains, however, a tiny sector relative to mainstream financial institutions.
Economic conditions in the period we are studying are such that one would have expected CDFI lending activity to decrease substantially.
15
The period we are studying, from 2003 to 2012, witnessed a series of seismic financial events:
• Explosive growth in subprime mortgage products fed a house price bubble, and both house prices and the subprime mortgage market subsequently collapsed as borrowers defaulted on their mortgages. The Case-Shiller national house price index fell 32 percent from its peak in the second quarter of 2006 to the trough in the first quarter of 2009,14 and approximately 4.1 million foreclosures were completed from the beginning of the financial crisis in September 2008 through December 2012.15
• The resulting financial crisis placed severe stresses on the financial industry, with the collapse or takeover of major players such as Lehman Brothers, Countrywide, Wachovia, and Bear Stearns; Troubled Asset Relief Program (TARP) bailouts of most remaining banks; and government conservatorship of Freddie Mac and Fannie Mae. The number of Federal Deposit Insurance Corporation (FDIC) Problem Institutions mushroomed from 50 in 2006 to a high of 884 in 2010, and 465 institutions failed from 2008 through 2012.16
• Banking consolidation continued a long trend, with the FDIC reporting 2,277 bank mergers from 2003 to 2012. A Federal Reserve study notes that by 2010, the ten largest organizations held approximately 50 percent of banking assets, and the number of banks and thrifts had declined by over 60 percent since 1980.17
• Business and job growth were depressed, with seasonally adjusted unemployment rising from a low of 4.4 percent in May 2006 to a high of 10.0 percent in October 2009, and seasonally adjusted employment dropping by 6 percent between January 2008 and January 2010.18
• A number of important community and economic development tools were disrupted by the recession. CRA-reported community development lending was 37 percent lower during 2009 to 2011 than it was during 2006 to 2008.19 Single-family housing tax-exempt bond issuance was down 68 percent from 2007 to 2011, while multifamily bond issuance dropped 14 percent.20 Low-income housing tax credit pricing collapsed as bank investors no longer needed credits, requiring the government to create the tax credit
14 See http://us.spindices.com/index-family/real-estate/sp-case-shiller. 15 See www.corelogic.com/research/foreclosure-report/national-foreclosure-report-december-2012.pdf. 16 See www.fdic.gov/bank/statistical/stats/2012dec/fdic.html. 17 Adams, Robert. Consolidation and Merger Activity in the United States Banking Industry from 2000 through 2010. Division of Research and Statistics, Board of Governors of the Federal Reserve System, 2012. 18 Bureau of Labor Statistics Labor Force Statistics. 19 FFIEC CRA statistics. 20 See www.standardandpoors.com/spf/upload/Ratings_US/Housing_Finance_Agencies_3_26_12.pdf.
16
assistance and exchange programs as stopgap measures.21 New Markets Tax Credits also saw a drop in pricing, from around $0.75 to $0.80 per dollar pre-recession down to $0.65 to $0.70 in 2009.22
• Subsequent to the recession, a wave of regulation spearheaded by the Dodd-Frank Wall Street Reform and Consumer Protection Act has created new oversight for financial institutions as the bill sought to rein in lending practices now understood to be too risky.
• These trends created both capitalization challenges for CDFIs as banks and other funders cut back on investments in CDFIs,23 and strains on CDFI borrowers as low- and moderate-income individuals and families were hit particularly hard by the recession.24
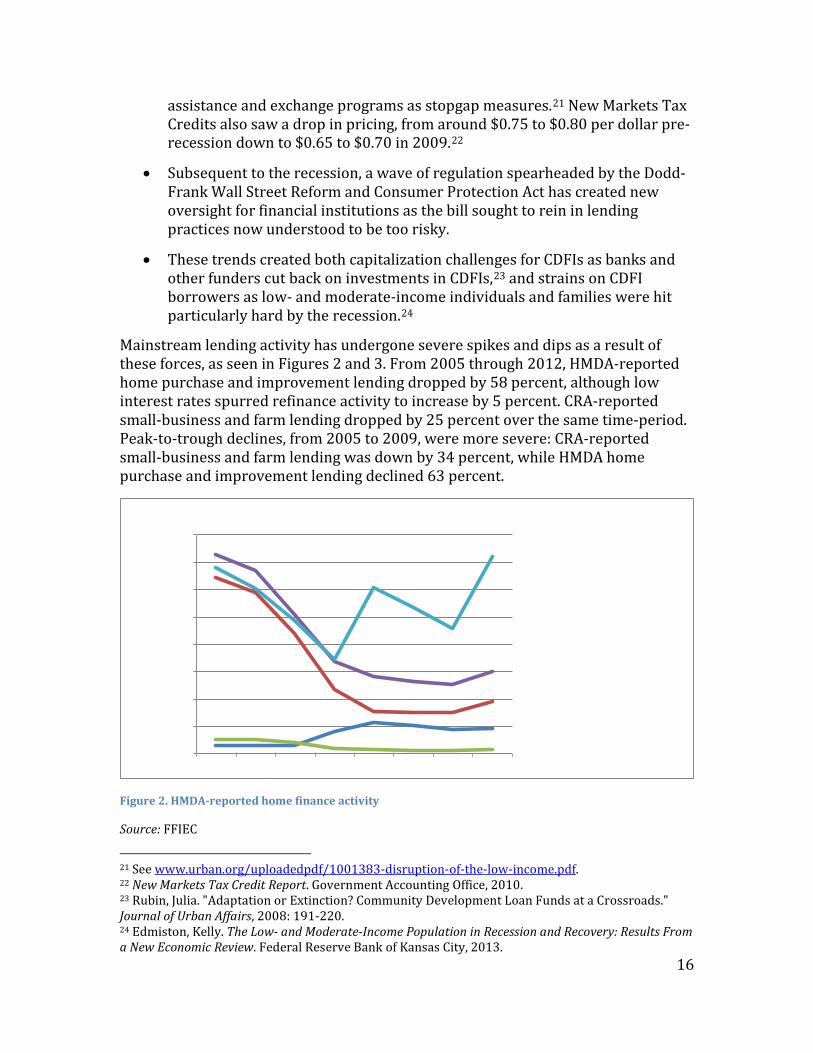
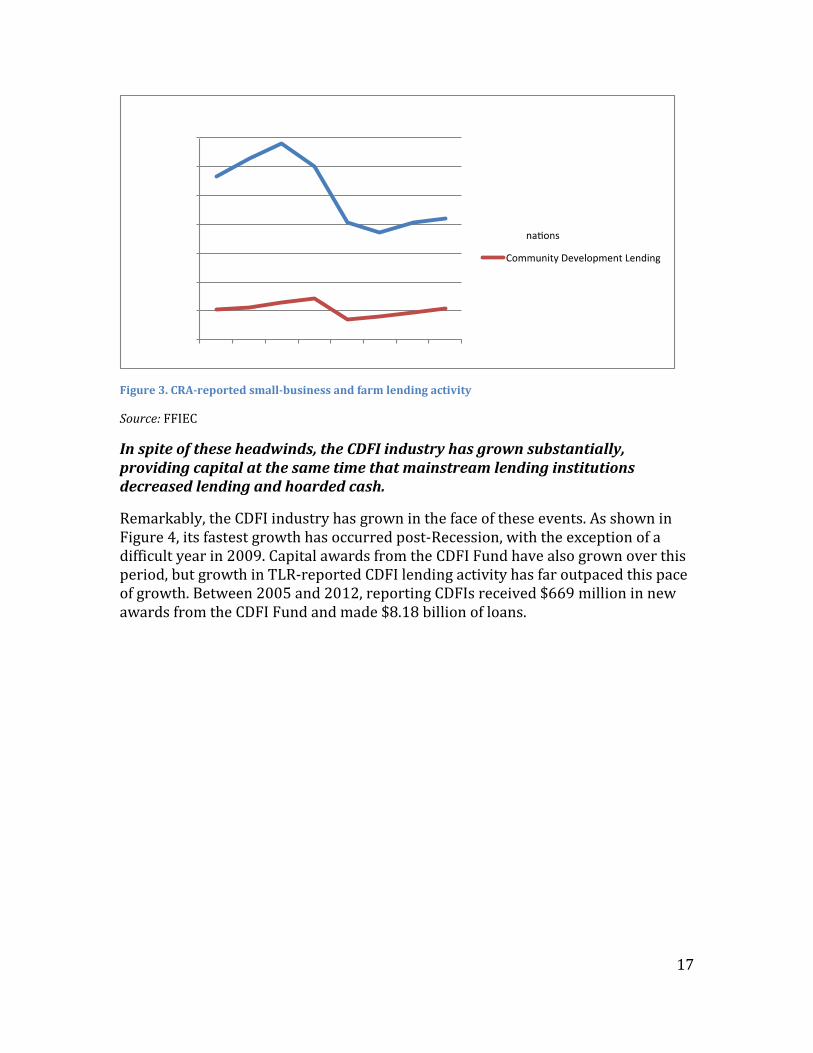
Mainstream lending activity has undergone severe spikes and dips as a result of these forces, as seen in Figures 2 and 3. From 2005 through 2012, HMDA-reported home purchase and improvement lending dropped by 58 percent, although low interest rates spurred refinance activity to increase by 5 percent. CRA-reported small-business and farm lending dropped by 25 percent over the same time-period. Peak-to-trough declines, from 2005 to 2009, were more severe: CRA-reported small-business and farm lending was down by 34 percent, while HMDA home purchase and improvement lending declined 63 percent.
Figure 2. HMDA-reported home finance activity
Source: FFIEC
21 See www.urban.org/uploadedpdf/1001383-disruption-of-the-low-income.pdf. 22 New Markets Tax Credit Report. Government Accounting Office, 2010. 23 Rubin, Julia. "Adaptation or Extinction? Community Development Loan Funds at a Crossroads." Journal of Urban Affairs, 2008: 191-220. 24 Edmiston, Kelly. The Low- and Moderate-Income Population in Recession and Recovery: Results From a New Economic Review. Federal Reserve Bank of Kansas City, 2013.
17
Figure 3. CRA-reported small-business and farm lending activity
Source: FFIEC
In spite of these headwinds, the CDFI industry has grown substantially, providing capital at the same time that mainstream lending institutions decreased lending and hoarded cash.
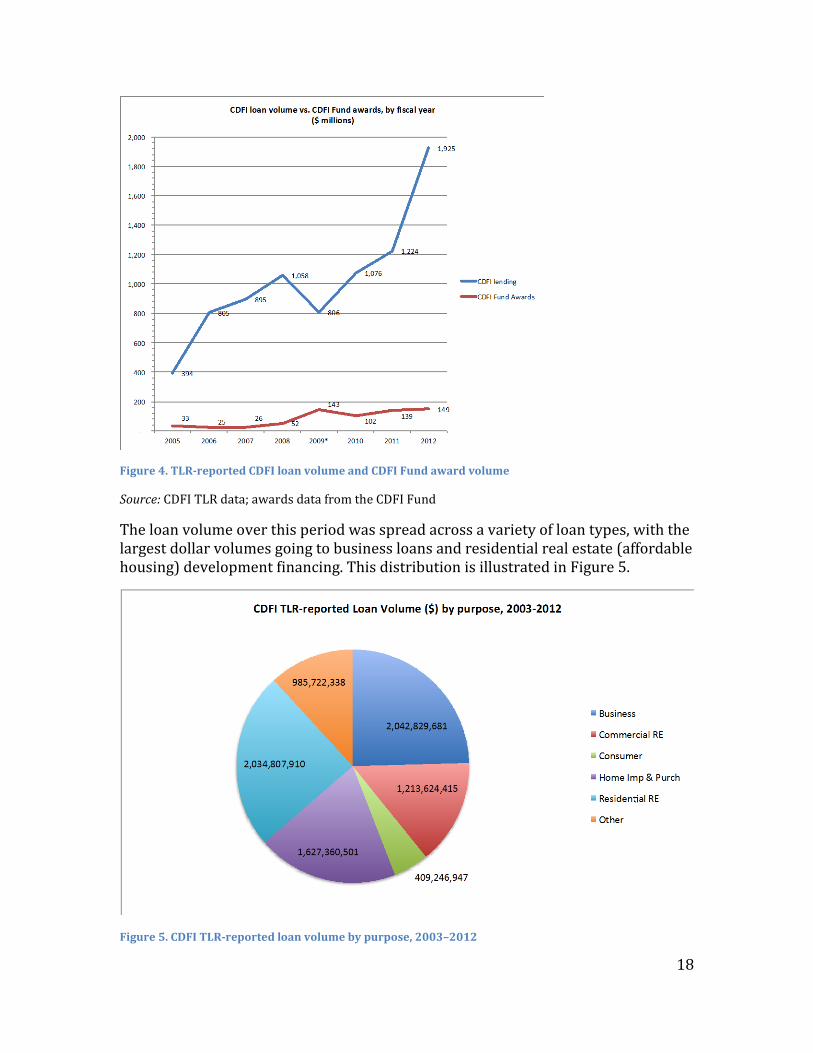
Remarkably, the CDFI industry has grown in the face of these events. As shown in Figure 4, its fastest growth has occurred post-Recession, with the exception of a difficult year in 2009. Capital awards from the CDFI Fund have also grown over this period, but growth in TLR-reported CDFI lending activity has far outpaced this pace of growth. Between 2005 and 2012, reporting CDFIs received $669 million in new awards from the CDFI Fund and made $8.18 billion of loans.
18
Figure 4. TLR-reported CDFI loan volume and CDFI Fund award volume
Source: CDFI TLR data; awards data from the CDFI Fund
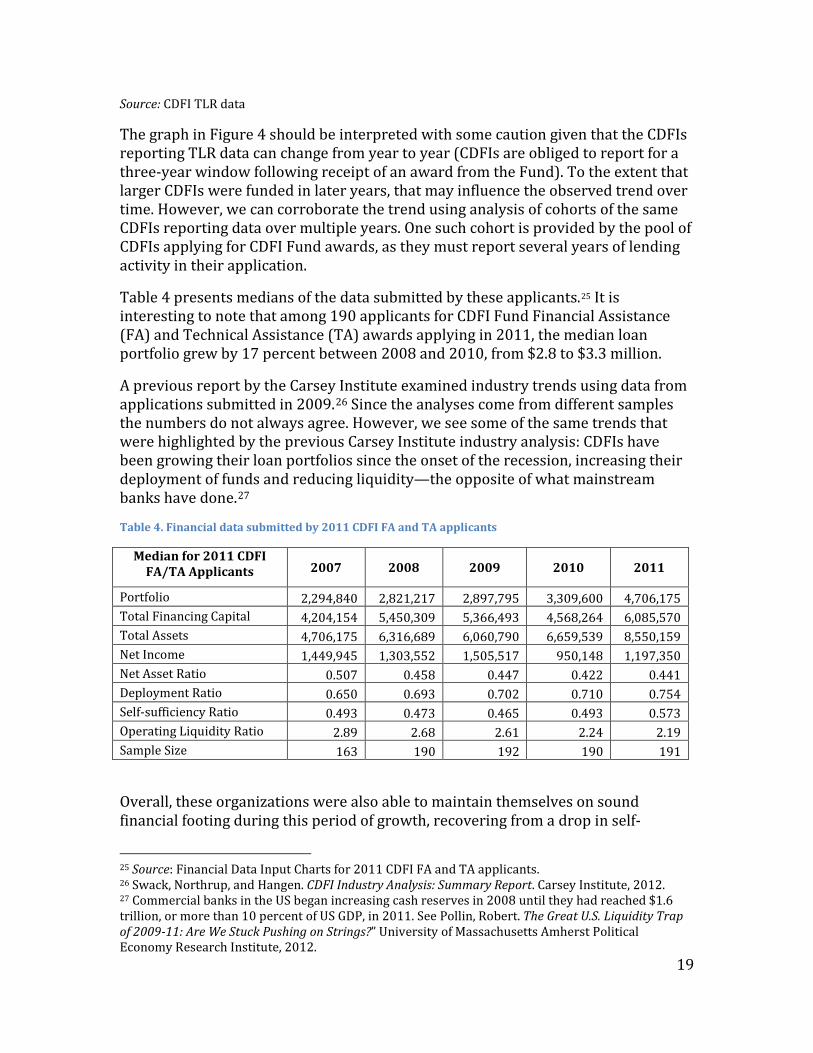
The loan volume over this period was spread across a variety of loan types, with the largest dollar volumes going to business loans and residential real estate (affordable housing) development financing. This distribution is illustrated in Figure 5.
Figure 5. CDFI TLR-reported loan volume by purpose, 2003–2012
19
Source: CDFI TLR data
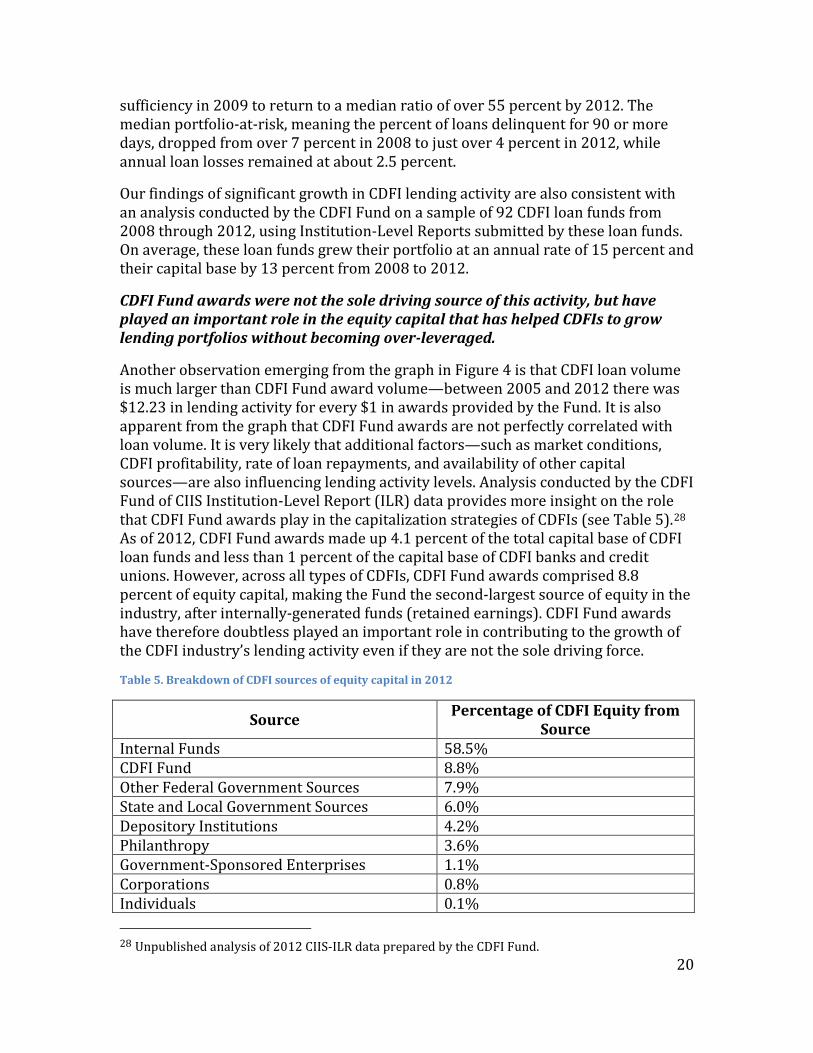
The graph in Figure 4 should be interpreted with some caution given that the CDFIs reporting TLR data can change from year to year (CDFIs are obliged to report for a three-year window following receipt of an award from the Fund). To the extent that larger CDFIs were funded in later years, that may influence the observed trend over time. However, we can corroborate the trend using analysis of cohorts of the same CDFIs reporting data over multiple years. One such cohort is provided by the pool of CDFIs applying for CDFI Fund awards, as they must report several years of lending activity in their application.
Table 4 presents medians of the data submitted by these applicants.25 It is interesting to note that among 190 applicants for CDFI Fund Financial Assistance (FA) and Technical Assistance (TA) awards applying in 2011, the median loan portfolio grew by 17 percent between 2008 and 2010, from $2.8 to $3.3 million.
A previous report by the Carsey Institute examined industry trends using data from applications submitted in 2009.26 Since the analyses come from different samples the numbers do not always agree. However, we see some of the same trends that were highlighted by the previous Carsey Institute industry analysis: CDFIs have been growing their loan portfolios since the onset of the recession, increasing their deployment of funds and reducing liquidity—the opposite of what mainstream banks have done.27
Table 4. Financial data submitted by 2011 CDFI FA and TA applicants
Median for 2011 CDFI FA/TA Applicants
2007 2008 2009 2010 2011
Portfolio 2,294,840 2,821,217 2,897,795 3,309,600 4,706,175 Total Financing Capital 4,204,154 5,450,309 5,366,493 4,568,264 6,085,570 Total Assets 4,706,175 6,316,689 6,060,790 6,659,539 8,550,159 Net Income 1,449,945 1,303,552 1,505,517 950,148 1,197,350 Net Asset Ratio 0.507 0.458 0.447 0.422 0.441 Deployment Ratio 0.650 0.693 0.702 0.710 0.754 Self-sufficiency Ratio 0.493 0.473 0.465 0.493 0.573 Operating Liquidity Ratio 2.89 2.68 2.61 2.24 2.19 Sample Size 163 190 192 190 191
Overall, these organizations were also able to maintain themselves on sound financial footing during this period of growth, recovering from a drop in self-
25 Source: Financial Data Input Charts for 2011 CDFI FA and TA applicants. 26 Swack, Northrup, and Hangen. CDFI Industry Analysis: Summary Report. Carsey Institute, 2012. 27 Commercial banks in the US began increasing cash reserves in 2008 until they had reached $1.6 trillion, or more than 10 percent of US GDP, in 2011. See Pollin, Robert. The Great U.S. Liquidity Trap of 2009-11: Are We Stuck Pushing on Strings?” University of Massachusetts Amherst Political Economy Research Institute, 2012.
20
sufficiency in 2009 to return to a median ratio of over 55 percent by 2012. The median portfolio-at-risk, meaning the percent of loans delinquent for 90 or more days, dropped from over 7 percent in 2008 to just over 4 percent in 2012, while annual loan losses remained at about 2.5 percent.
Our findings of significant growth in CDFI lending activity are also consistent with an analysis conducted by the CDFI Fund on a sample of 92 CDFI loan funds from 2008 through 2012, using Institution-Level Reports submitted by these loan funds. On average, these loan funds grew their portfolio at an annual rate of 15 percent and their capital base by 13 percent from 2008 to 2012.
CDFI Fund awards were not the sole driving source of this activity, but have played an important role in the equity capital that has helped CDFIs to grow lending portfolios without becoming over-leveraged.
Another observation emerging from the graph in Figure 4 is that CDFI loan volume is much larger than CDFI Fund award volume—between 2005 and 2012 there was $12.23 in lending activity for every $1 in awards provided by the Fund. It is also apparent from the graph that CDFI Fund awards are not perfectly correlated with loan volume. It is very likely that additional factors—such as market conditions, CDFI profitability, rate of loan repayments, and availability of other capital sources—are also influencing lending activity levels. Analysis conducted by the CDFI Fund of CIIS Institution-Level Report (ILR) data provides more insight on the role that CDFI Fund awards play in the capitalization strategies of CDFIs (see Table 5).28 As of 2012, CDFI Fund awards made up 4.1 percent of the total capital base of CDFI loan funds and less than 1 percent of the capital base of CDFI banks and credit unions. However, across all types of CDFIs, CDFI Fund awards comprised 8.8 percent of equity capital, making the Fund the second-largest source of equity in the industry, after internally-generated funds (retained earnings). CDFI Fund awards have therefore doubtless played an important role in contributing to the growth of the CDFI industry’s lending activity even if they are not the sole driving force.
Table 5. Breakdown of CDFI sources of equity capital in 2012
Source Percentage of CDFI Equity from Source
Internal Funds 58.5% CDFI Fund 8.8% Other Federal Government Sources 7.9% State and Local Government Sources 6.0% Depository Institutions 4.2% Philanthropy 3.6% Government-Sponsored Enterprises 1.1% Corporations 0.8% Individuals 0.1% 28 Unpublished analysis of 2012 CIIS-ILR data prepared by the CDFI Fund.
21
Other 8.9% Source: CDFI Fund analysis of 2012 CIIS-ILR data
Growth in lending activity has facilitated other important community development outcomes and outputs.
CDFIs that submitted TLR data also reported that between 2003 and 2012, they:
• Generated a projected 63,249 permanent jobs and 47,866 construction jobs through the projects they funded
• Supported the development or preservation of 159,739 units of affordable rental housing and 23,302 units of affordable for-sale housing
• Increased educational facility capacity by 515,384 units
• Increased child-care facility capacity by 31,895 units
• Increased health-care facility capacity by 2,068,932 patient visits
• Increased community-arts facility capacity by 66,402 units
• Supported the creation of 13.4 million square feet of office space, 4.7 million square feet of retail space, and 1 million square feet of manufacturing space
Despite its growth and productivity, the CDFI industry remains a tiny one. In 2012, for example, TLR-reporting CDFIs made a total of $1.92 billion in loans, including $455 million in business lending, $278 million in commercial real estate lending, and $480 million in home purchase and improvement lending. By comparison, in 2012:
• HMDA-reported home-purchase and home-improvement lending was $605.2 billion, or 1,260 times the home purchase and improvement loans reported by CDFIs.
• CRA-reported small-business and farm lending was $211.1 billion, or 464 times the business-lending volume, and 288 times the combined business and commercial real estate lending volume reported by CDFIs.
• Even bank community development lending in 2012, at $54.8 billion, was 28 times CDFI TLR-reported lending in that year.
While these figures may significantly underestimate activity of the entire CDFI industry, to the extent that TLR-reporting CDFIs only represent 41 percent of all CDFIs, it is unlikely that loan volume at the non-reporting CDFIs would put the industry anywhere near the volumes generated by mainstream lenders.
22
In summary, the CDFI industry appears to have provided a counter-cyclical boost to the economy, albeit a small one, with important community development benefits, over the same time that the mainstream lending industry sharply curtailed its activity. Moreover, as we discuss in detail in Finding 2, CDFIs are directing their loans to historically underserved groups most in need of financing. The combination of the small size of the industry and its apparent usefulness in meeting underserved capital needs suggests that it would be wise to invest substantially in growing the industry. We then face the policy question about how best to do so (such as whether funders seeking to grow the industry should focus more on debt or equity financing, a topic we briefly explore later in this report).
Finding 2: CDFIs are delivering the majority of their lending to borrowers from targeted, historically underserved groups such as low-income or minority borrowers.
We investigated whether CDFI loans were made to borrowers or projects meeting one or more characteristics associated with underserved borrowers.29
Most of the categories are self-explanatory, but there are also three “target market” categories tracked by the CDFI Fund defined more precisely in the detailed companion report:
• Low-Income Target Population (LITP), generally referring to low-income borrowers or project end-users
• Other Target Population (OTP), generally referring to minority borrowers or project end-users
• Investment Area (IA), generally referring to borrowers or projects located in census tracts that meet criteria for distress set out by the CDFI Fund
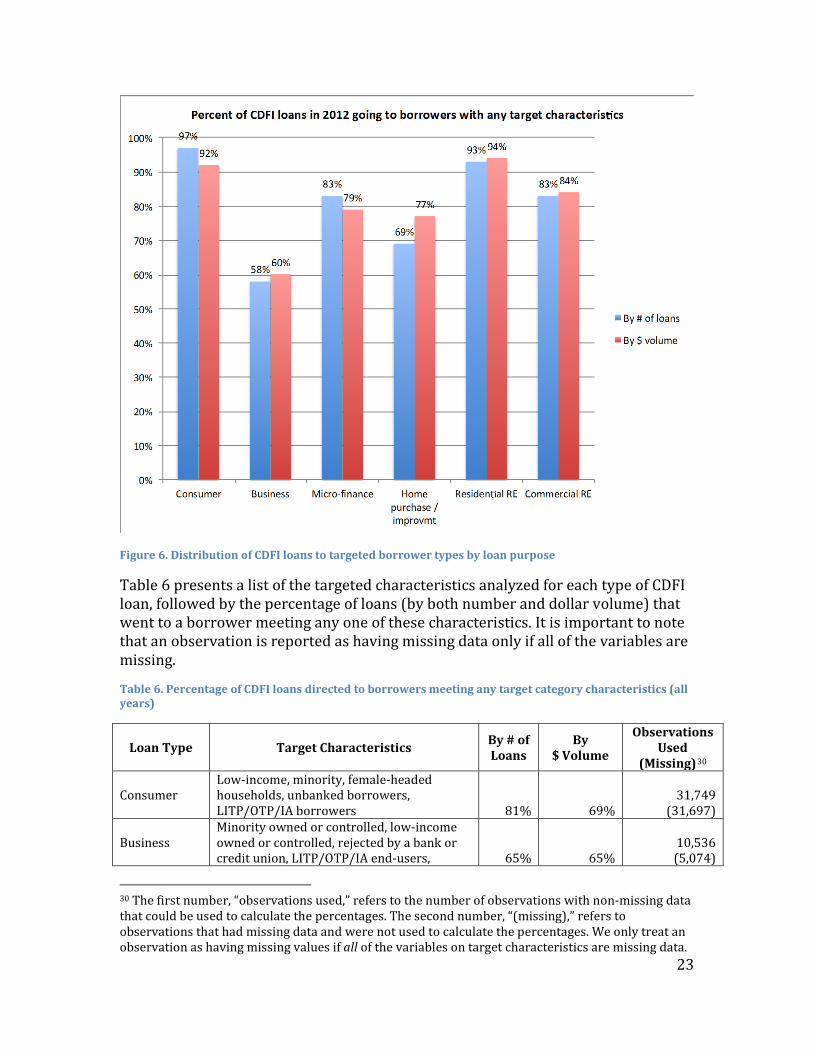
As shown in Figure 6, the strong majority of CDFI lending activity is directed to borrowers or projects meeting one or more target “underserved” characteristics. Across all loan types in 2012, 77 percent of CDFI loans, and 79 percent of loans by dollar volume, went to targeted borrower types.
29 By underserved borrowers, we mean borrowers who are less likely to access mainstream lending products and financial services. For example, FDIC Chari Martin Gruenberg notes that unbanked and underbanked rates are particularly high among lower-income, less educated, younger and unemployed households, non-Asian minorities, and unmarried families with dependents such as single mothers. See www.fdic.gov/news/news/speeches/archives/2013/spdec0513.html.
23
Figure 6. Distribution of CDFI loans to targeted borrower types by loan purpose
Table 6 presents a list of the targeted characteristics analyzed for each type of CDFI loan, followed by the percentage of loans (by both number and dollar volume) that went to a borrower meeting any one of these characteristics. It is important to note that an observation is reported as having missing data only if all of the variables are missing.
Table 6. Percentage of CDFI loans directed to borrowers meeting any target category characteristics (all years)
Loan Type Target Characteristics By # of Loans
By $ Volume
Observations Used
(Missing)30
Consumer Low-income, minority, female-headed households, unbanked borrowers, LITP/OTP/IA borrowers 81% 69%
31,749 (31,697)
Business Minority owned or controlled, low-income owned or controlled, rejected by a bank or credit union, LITP/OTP/IA end-users, 65% 65%
10,536 (5,074)
30 The first number, “observations used,” refers to the number of observations with non-missing data that could be used to calculate the percentages. The second number, “(missing),” refers to observations that had missing data and were not used to calculate the percentages. We only treat an observation as having missing values if all of the variables on target characteristics are missing data.
24
nonprofit or tribal borrowers
Microfinance
Low-income owned or controlled, minority owned or controlled, minority or low-income borrower, unbanked borrower, female-headed household, LITP/OTP/IA end-users 82% 78%
20,282 (2,314)
Home Purchase / Improvement
Low-income, minority, female-headed households, first-time homebuyers, unbanked borrowers, LITP/OTP/IA borrowers 77% 74%
27,518 (1,909)
Residential Real Estate
LITP/OTP/IA end-users, nonprofit or tribal borrowers 76% 70%
2,730 (2,000)
Commercial Real Estate
LITP/OTP/IA end-users, nonprofit or tribal borrowers 86% 91%
1,545 (394)
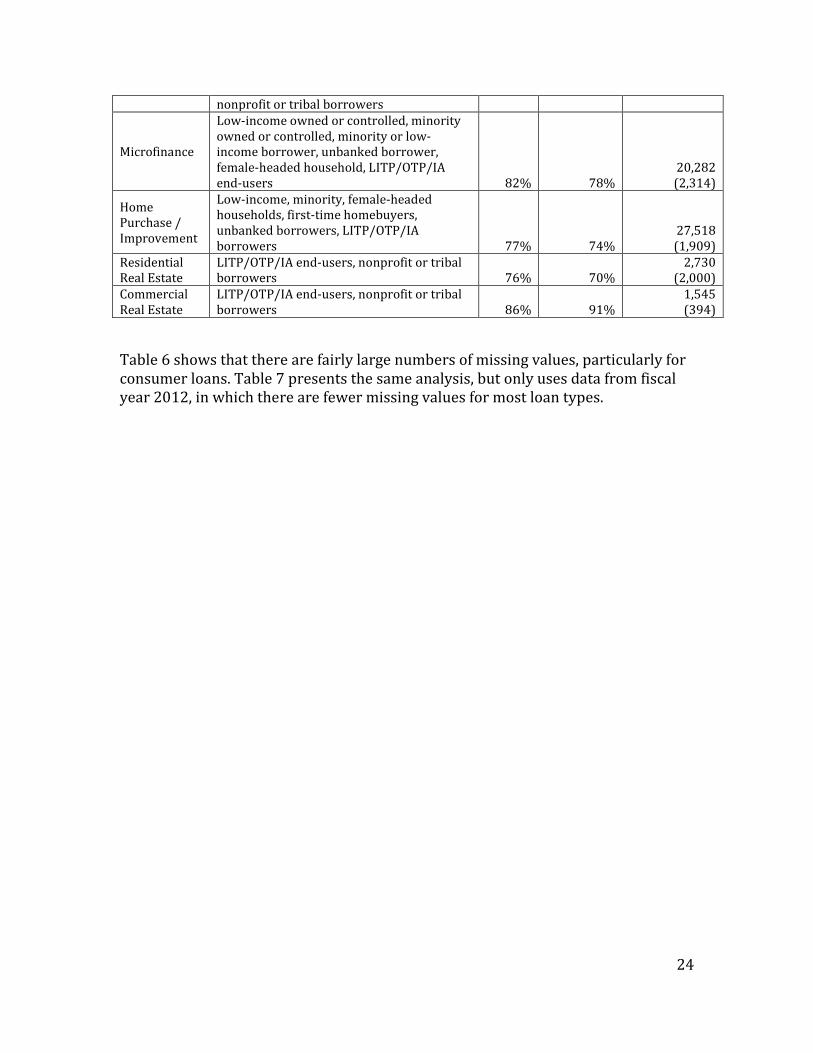
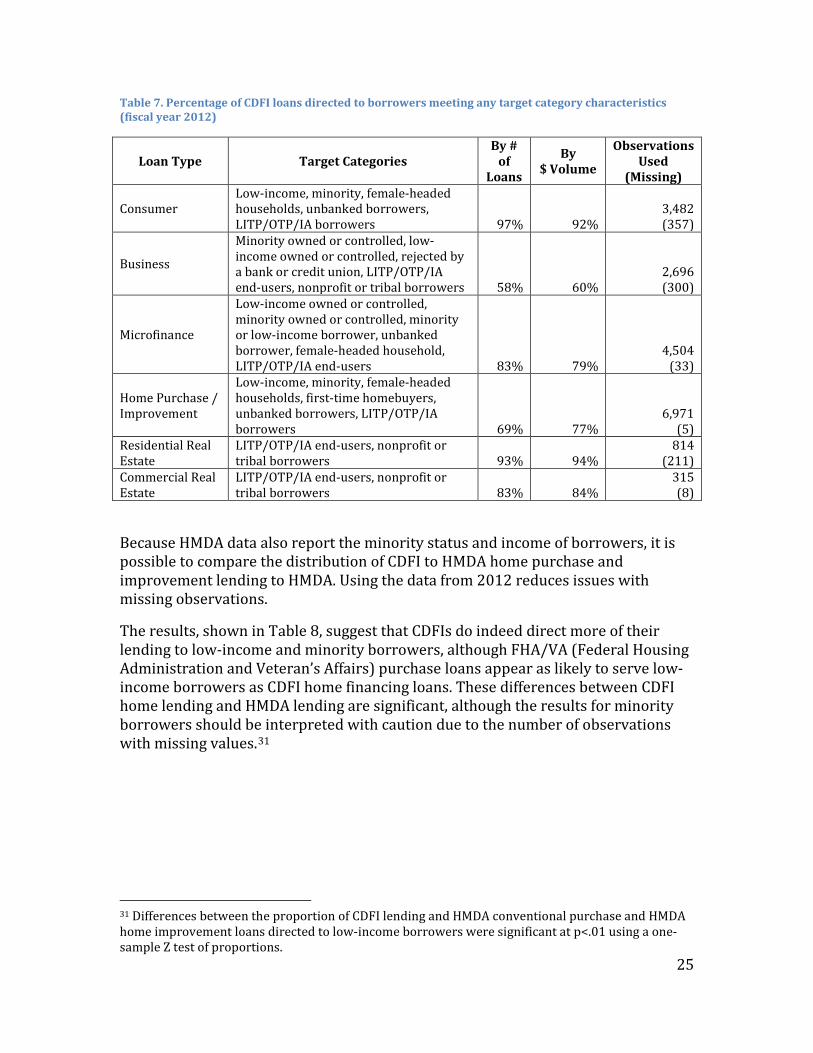
Table 6 shows that there are fairly large numbers of missing values, particularly for consumer loans. Table 7 presents the same analysis, but only uses data from fiscal year 2012, in which there are fewer missing values for most loan types.
25
Table 7. Percentage of CDFI loans directed to borrowers meeting any target category characteristics (fiscal year 2012)
Loan Type Target Categories By #
of Loans
By $ Volume
Observations Used
(Missing)
Consumer Low-income, minority, female-headed households, unbanked borrowers, LITP/OTP/IA borrowers 97% 92%
3,482 (357)
Business
Minority owned or controlled, low-income owned or controlled, rejected by a bank or credit union, LITP/OTP/IA end-users, nonprofit or tribal borrowers 58% 60%
2,696 (300)
Microfinance
Low-income owned or controlled, minority owned or controlled, minority or low-income borrower, unbanked borrower, female-headed household, LITP/OTP/IA end-users 83% 79%
4,504 (33)
Home Purchase / Improvement
Low-income, minority, female-headed households, first-time homebuyers, unbanked borrowers, LITP/OTP/IA borrowers 69% 77%
6,971 (5)
Residential Real Estate
LITP/OTP/IA end-users, nonprofit or tribal borrowers 93% 94%
814 (211)
Commercial Real Estate
LITP/OTP/IA end-users, nonprofit or tribal borrowers 83% 84%
315 (8)
Because HMDA data also report the minority status and income of borrowers, it is possible to compare the distribution of CDFI to HMDA home purchase and improvement lending to HMDA. Using the data from 2012 reduces issues with missing observations.
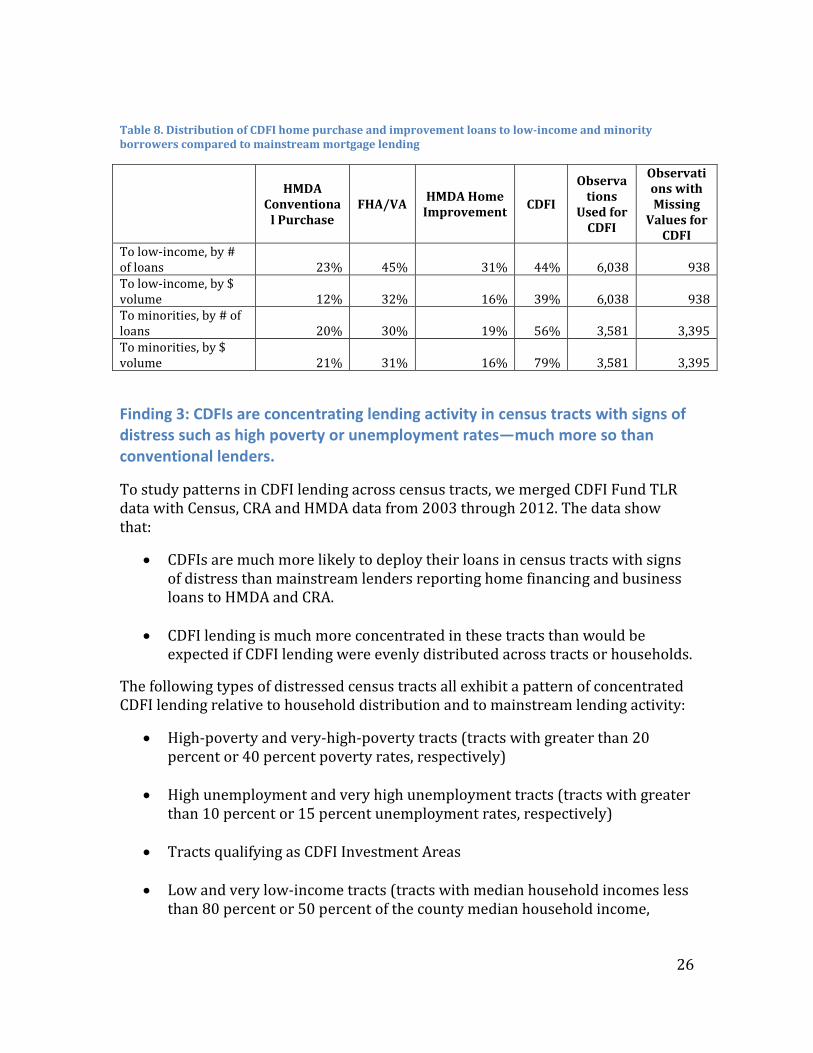
The results, shown in Table 8, suggest that CDFIs do indeed direct more of their lending to low-income and minority borrowers, although FHA/VA (Federal Housing Administration and Veteran’s Affairs) purchase loans appear as likely to serve low-income borrowers as CDFI home financing loans. These differences between CDFI home lending and HMDA lending are significant, although the results for minority borrowers should be interpreted with caution due to the number of observations with missing values.31
31 Differences between the proportion of CDFI lending and HMDA conventional purchase and HMDA home improvement loans directed to low-income borrowers were significant at p<.01 using a one-sample Z test of proportions.
26
Table 8. Distribution of CDFI home purchase and improvement loans to low-income and minority borrowers compared to mainstream mortgage lending
HMDA Conventiona
l Purchase FHA/VA HMDA Home
Improvement CDFI
Observations
Used for CDFI
Observations with Missing
Values for CDFI
To low-income, by # of loans 23% 45% 31% 44% 6,038 938 To low-income, by $ volume 12% 32% 16% 39% 6,038 938 To minorities, by # of loans 20% 30% 19% 56% 3,581 3,395 To minorities, by $ volume 21% 31% 16% 79% 3,581 3,395
Finding 3: CDFIs are concentrating lending activity in census tracts with signs of distress such as high poverty or unemployment rates—much more so than conventional lenders.
To study patterns in CDFI lending across census tracts, we merged CDFI Fund TLR data with Census, CRA and HMDA data from 2003 through 2012. The data show that:
• CDFIs are much more likely to deploy their loans in census tracts with signs of distress than mainstream lenders reporting home financing and business loans to HMDA and CRA.
• CDFI lending is much more concentrated in these tracts than would be expected if CDFI lending were evenly distributed across tracts or households.
The following types of distressed census tracts all exhibit a pattern of concentrated CDFI lending relative to household distribution and to mainstream lending activity:
• High-poverty and very-high-poverty tracts (tracts with greater than 20 percent or 40 percent poverty rates, respectively)
• High unemployment and very high unemployment tracts (tracts with greater than 10 percent or 15 percent unemployment rates, respectively)
• Tracts qualifying as CDFI Investment Areas
• Low and very low-income tracts (tracts with median household incomes less than 80 percent or 50 percent of the county median household income,
27
respectively)
• Tracts with both high poverty and high unemployment
It is relevant to note that the analysis is focused on the types of census tracts to which loans are made, and not the individual borrowers. For example, a loan to a high-income household in a high-poverty census tract would count as a loan to a high-poverty tract, regardless of the income of the borrower.
There are three key comparisons that demonstrate how CDFI lending activity is distributed across census tracts:
1. How all CDFI lending activity is distributed among distressed versus non-distressed census tracts, compared to how households are distributed. While this is an imperfect comparison, if CDFIs did not focus on particular neighborhoods, most CDFI loan volume should presumably be distributed across census tracts roughly in the same proportion as households are distributed, since households are a fundamental driver of demand for most types of lending.
2. How CDFI business-lending activity is distributed among distressed versus non-distressed census tracts, compared to how CRA-reported small-business lending is distributed.
3. How CDFI home purchase and improvement lending activity is distributed among distressed versus non-distressed census tracts, compared to how HMDA-reported home purchase and improvement lending is distributed.
We find significant differences using these comparisons.32 There are slightly more mixed results looking at the distribution of CDFI loans to census tracts with high concentrations of minorities.
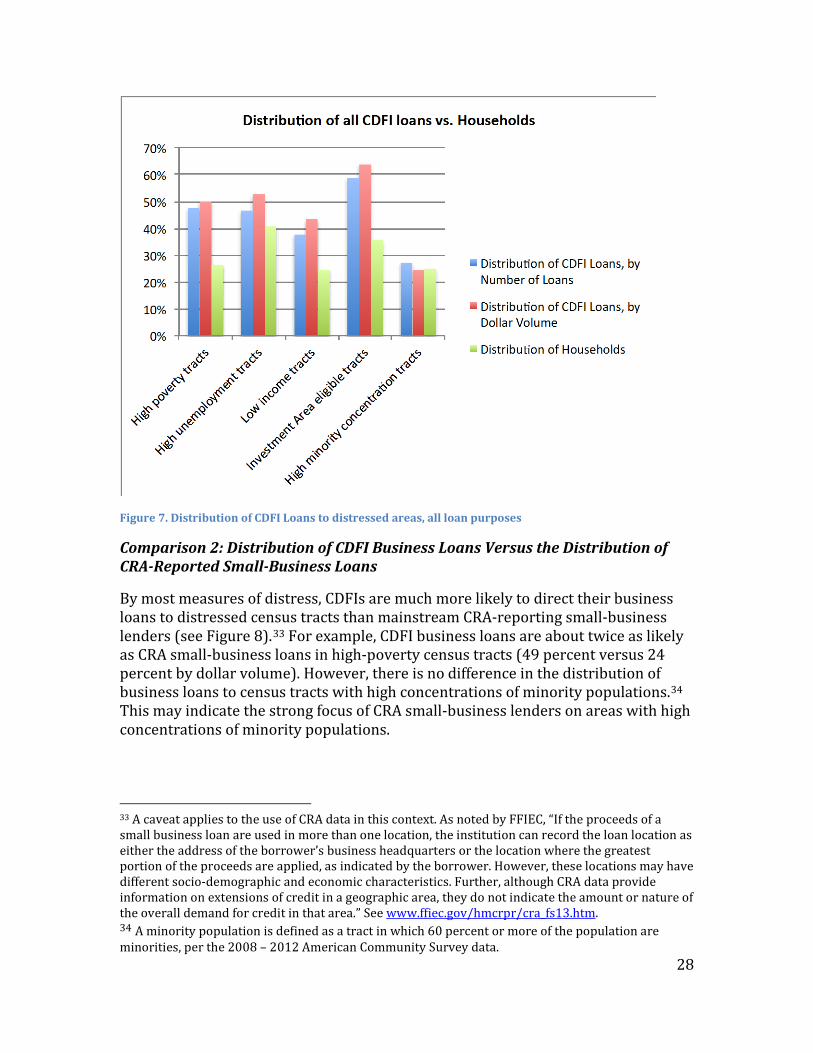
Comparison 1: Distribution of All CDFI Lending Versus the Distribution of Households
CDFIs are much more likely to make loans to distressed census tracts than would be expected if they were indifferent to where they lend (see Figure 7). For example, 26 percent of households across all the census tracts studied live in high-poverty census tracts. However, CDFIs deliver nearly twice as many of their loans to such tracts—50 percent by dollar volume and 48 percent by number.
32 Tests were performed on differences between the distribution of all CDFI lending versus the distribution of households across census tracts, between the distribution of CDFI business lending versus the distribution of CRA small business loans across Census Tracts, and between the distribution of CDFI home purchase and improvement lending versus the distribution of HMDA home purchase and improvement loans across tracts. All differences were significant at p<.01 using a one-sample Z test of proportions. See the section on the Analysis of CDFI Lending Activity for a more detailed discussion.
28
Figure 7. Distribution of CDFI Loans to distressed areas, all loan purposes
Comparison 2: Distribution of CDFI Business Loans Versus the Distribution of CRA-Reported Small-Business Loans
By most measures of distress, CDFIs are much more likely to direct their business loans to distressed census tracts than mainstream CRA-reporting small-business lenders (see Figure 8).33 For example, CDFI business loans are about twice as likely as CRA small-business loans in high-poverty census tracts (49 percent versus 24 percent by dollar volume). However, there is no difference in the distribution of business loans to census tracts with high concentrations of minority populations.34 This may indicate the strong focus of CRA small-business lenders on areas with high concentrations of minority populations.
33 A caveat applies to the use of CRA data in this context. As noted by FFIEC, “If the proceeds of a small business loan are used in more than one location, the institution can record the loan location as either the address of the borrower’s business headquarters or the location where the greatest portion of the proceeds are applied, as indicated by the borrower. However, these locations may have different socio-demographic and economic characteristics. Further, although CRA data provide information on extensions of credit in a geographic area, they do not indicate the amount or nature of the overall demand for credit in that area.” See www.ffiec.gov/hmcrpr/cra_fs13.htm. 34 A minority population is defined as a tract in which 60 percent or more of the population are minorities, per the 2008 – 2012 American Community Survey data.
29
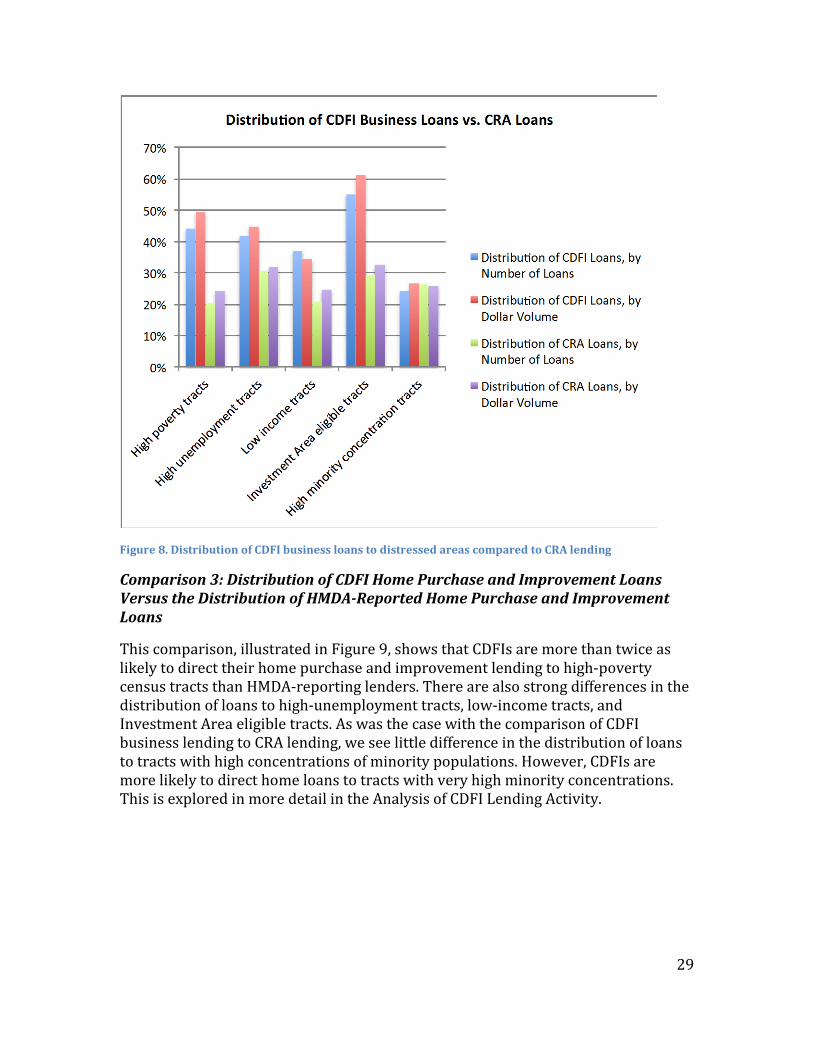
Figure 8. Distribution of CDFI business loans to distressed areas compared to CRA lending
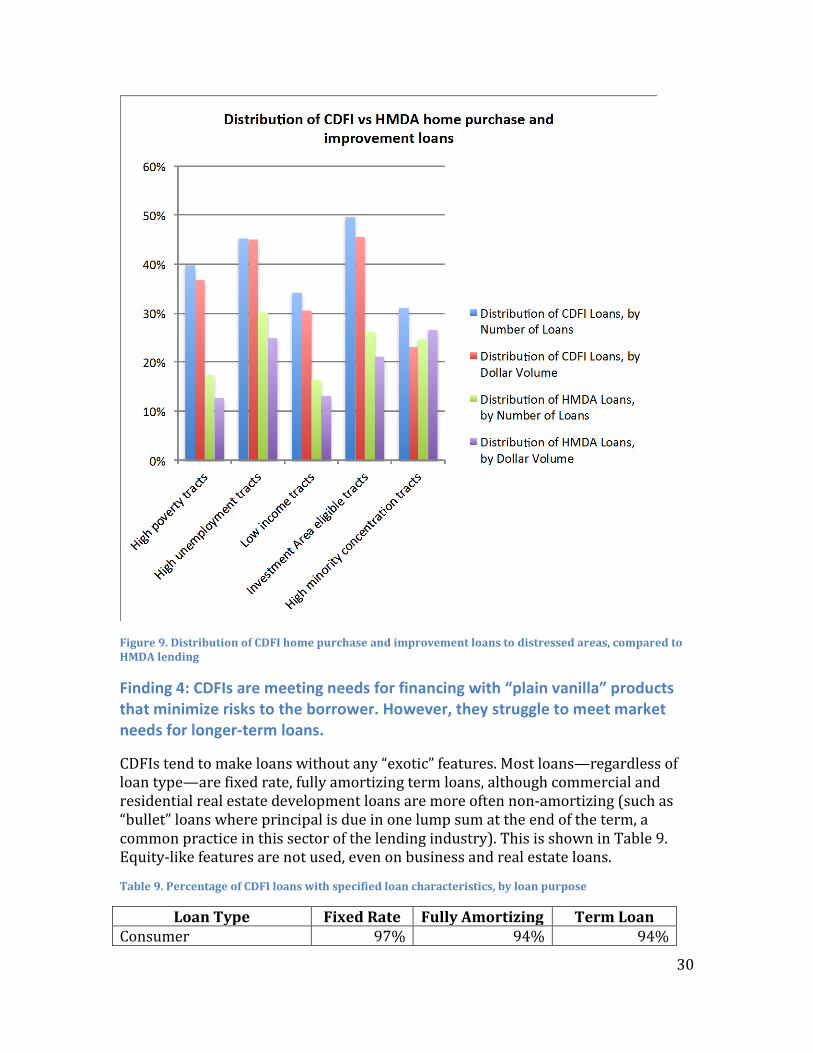
Comparison 3: Distribution of CDFI Home Purchase and Improvement Loans Versus the Distribution of HMDA-Reported Home Purchase and Improvement Loans
This comparison, illustrated in Figure 9, shows that CDFIs are more than twice as likely to direct their home purchase and improvement lending to high-poverty census tracts than HMDA-reporting lenders. There are also strong differences in the distribution of loans to high-unemployment tracts, low-income tracts, and Investment Area eligible tracts. As was the case with the comparison of CDFI business lending to CRA lending, we see little difference in the distribution of loans to tracts with high concentrations of minority populations. However, CDFIs are more likely to direct home loans to tracts with very high minority concentrations. This is explored in more detail in the Analysis of CDFI Lending Activity.
30
Figure 9. Distribution of CDFI home purchase and improvement loans to distressed areas, compared to HMDA lending
Finding 4: CDFIs are meeting needs for financing with “plain vanilla” products that minimize risks to the borrower. However, they struggle to meet market needs for longer-term loans.
CDFIs tend to make loans without any “exotic” features. Most loans—regardless of loan type—are fixed rate, fully amortizing term loans, although commercial and residential real estate development loans are more often non-amortizing (such as “bullet” loans where principal is due in one lump sum at the end of the term, a common practice in this sector of the lending industry). This is shown in Table 9. Equity-like features are not used, even on business and real estate loans.
Table 9. Percentage of CDFI loans with specified loan characteristics, by loan purpose
Loan Type Fixed Rate Fully Amortizing Term Loan Consumer 97% 94% 94%
31
Business 88% 75% 87% Microfinance 99% 97% 98% Home Purchase and Improvement 85% 82%35 92% Residential Real Estate 84% 21% 72% Commercial Real Estate 92% 47% 88%
Origination fees tend to be modest (see Table 10). As many CDFI borrowers might not qualify for loans from mainstream sources, it is difficult to directly compare interest rates to a market benchmark, but in general rates do not appear exorbitant. For example, the median CDFI home purchase and improvement loan interest rate is 4.75 percent, which is comparable to an average market rate ranging from 3.35 to 3.98 percent on 30-year fixed-rate mortgages in 2012.36
Business loan rates, also shown in Table 10, were within the range of Small Business Administration program interest rates in 2012 (which run from 2.25 to 6.5 points over prime, depending on the program, term and loan size).37 Very high interest rates are rare. For example, even at the 95th percentile observation, the interest rate on a CDFI microfinance loan was 16 percent; the 95th percentile rate on a CDFI consumer loan was 18 percent. While these rates are high relative to the risk-free interest rate, they are still comparable to many credit card rates.
Table 10. Median loan term, and 2012 median interest rate at the specified term, by loan purpose
Loan Type Median Term (Months)
2012 Median Interest Rate
Median Origination
Fee Consumer 24 8.00% (24 mo) 0.00% Business 48 7.75% (48 mo) 0.20% Microfinance 31 9.38% (36 mo) 0.60% Home Purchase and Improvement 240 4.75% (360 mo) 0.00% Residential Real Estate 21 5.00% (24 mo) 0.50% Commercial Real Estate 60 5.25% (60 mo) 0.00%
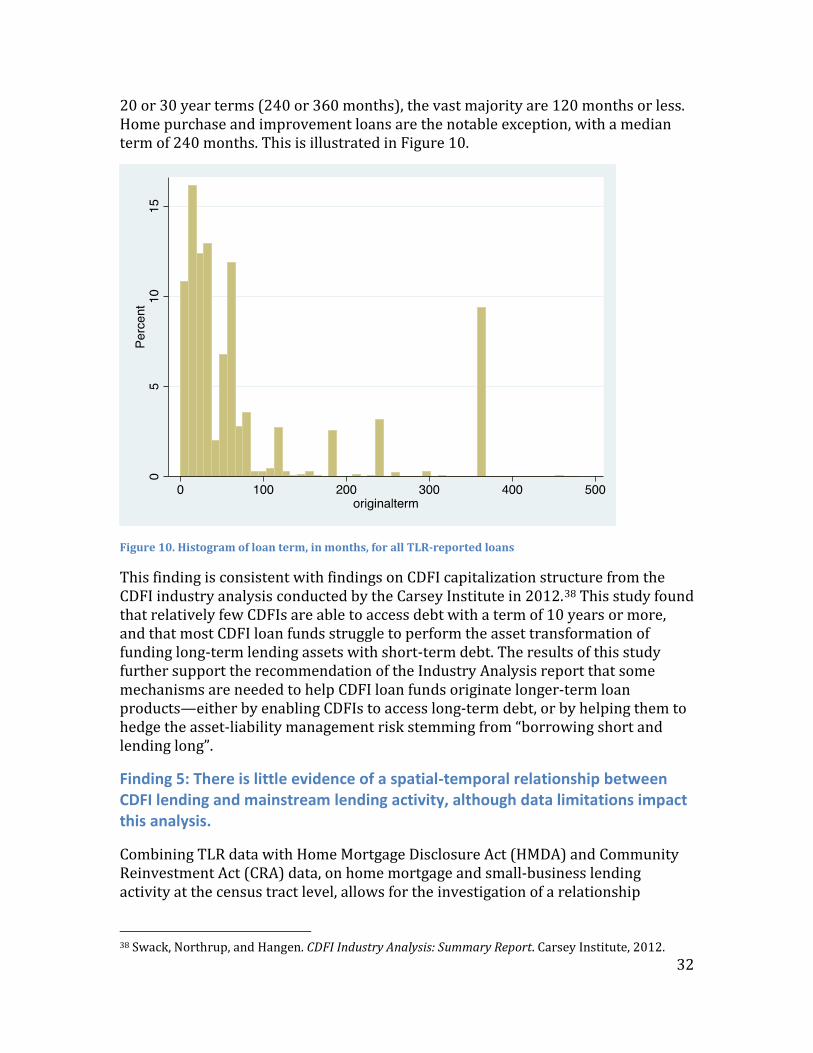
A notable feature of the loans in the TLR database is that most tend to be relatively short-term loans (see Table 10). Seventy-five percent of the loans in the database had a term of 72 months or less, and the median term across all loan types was 36 months. As seen in the histogram below, while some loans are being originated for 35 An additional 7 percent of home finance loans were reported as non-amortizing—presumably these are deferred, “due on sale” loans. 36 See www.freddiemac.com/pmms/archive.html?year=2012. 37 See www.sba.gov/sites/default/files/files/Loan%20Chart%20Baltimore%20March%202014_20140414.pdf.
32
20 or 30 year terms (240 or 360 months), the vast majority are 120 months or less. Home purchase and improvement loans are the notable exception, with a median term of 240 months. This is illustrated in Figure 10.
Figure 10. Histogram of loan term, in months, for all TLR-reported loans
This finding is consistent with findings on CDFI capitalization structure from the CDFI industry analysis conducted by the Carsey Institute in 2012.38 This study found that relatively few CDFIs are able to access debt with a term of 10 years or more, and that most CDFI loan funds struggle to perform the asset transformation of funding long-term lending assets with short-term debt. The results of this study further support the recommendation of the Industry Analysis report that some mechanisms are needed to help CDFI loan funds originate longer-term loan products—either by enabling CDFIs to access long-term debt, or by helping them to hedge the asset-liability management risk stemming from “borrowing short and lending long”.
Finding 5: There is little evidence of a spatial-temporal relationship between CDFI lending and mainstream lending activity, although data limitations impact this analysis.
Combining TLR data with Home Mortgage Disclosure Act (HMDA) and Community Reinvestment Act (CRA) data, on home mortgage and small-business lending activity at the census tract level, allows for the investigation of a relationship
38 Swack, Northrup, and Hangen. CDFI Industry Analysis: Summary Report. Carsey Institute, 2012.
33
between CDFI lending activity and mainstream lending activity. We ran several exploratory analyses to test two possible hypotheses for this relationship:
1. CDFIs “prime the pump” for mainstream lending in distressed tracts by making sustained investments in these tracts to demonstrate the market opportunity and pave the way for mainstream lenders.
2. CDFIs “fill the gaps” left by mainstream lenders in distressed areas, purposefully directing their resources to places where mainstream lending activity is low.
We did not find strong evidence for either of these hypotheses, although the lack of strong evidence is almost certainly impacted by data limitations. Many certified CDFIs may be serving distressed areas, but are not required to report their lending activity via TLR reports to the CDFI Fund if they have not received an award. In addition, the lack of CRA reporting data by intermediate and smaller banks introduces methodological issues, as these smaller institutions may have a significant presence in the same census tracts as CDFIs.
Priming the Pump? One hypothesis is that CDFIs “prime the pump” for mainstream lending in distressed areas. If CDFIs make sustained investments in a given community, perhaps partnering with mainstream institutions to do so, it is possible that the mainstream lenders then begin to perceive greater market opportunities and/or reduced risks in these communities.
We used a “difference in differences” approach to investigate whether census tracts with high levels of CDFI lending activity were able to generate a more positive trend for CRA- and HMDA-reported lending than tracts that did not have high levels of CDFI activity. For convenience, we limited the analysis to studying changes between 2007 and 2010, in census tracts that did not change geographic boundaries over this time. A variety of control variables were used for potential drivers of mainstream lending activity—such as local population and employment trends, regional lending industry trends, and census tract demographics. We ran a variety of analytic models to explore the data.
Before employing any control variables, the analysis showed mainstream lending declined more sharply in tracts with high levels of CDFI activity than in other tracts. After employing control variables, it became apparent that there is a mix of results across the large number of models. In most models, there is no apparent effect of CDFI activity on subsequent private sector lending activity. In the few models where there is an apparent effect, the nature of the effect (positive or negative) varies across models, and the size of the effect is quite small.
It is still quite possible that CDFIs do stimulate mainstream lenders’ interest in investing in distressed communities, but do so by attracting investments into the CDFI, which are subsequently re-lent to the community rather than stimulating
34
direct lending activity. Such investments in CDFIs might further the banks’ community reinvestment-related goals while reducing risk.
At least anecdotally, this practice is also quite common in the industry. In a 2009 paper on relationships between community development financial institutions and conventional lenders in small-business finance, Smith et al discuss the existence of collaborative relationships between banks and CDFIs that include investment of bank capital into the CDFI and referrals of customers from the bank to the CDFI.39
The Carsey Institute looked at this form of investment leveraging in an analysis of the CDFI industry.40 It found high levels of leverage among CDFI banks and credit unions, with a median amount of $9.20 in debt for every $1 in net assets among CDFI banks, and $9.91 in debt for every $1 in net assets among CDFI credit unions. Among CDFI loan funds, the analysis found lower levels of leverage, but 52 percent of loan funds had leveraged at least $1 in debt for every $1 in net assets, and 16 percent had leveraged at least $4 in debt for every $1 in net assets. The study found that banks were the leading source of capital that CDFIs used to generate this leverage.
Filling the Gaps? Another possibility is that CDFIs function to “fill the gaps” in geographic areas that are underserved by mainstream lenders. As Smith et al note, “substantial research has documented that… firms in lower-income and predominantly minority communities, and firms in rural areas have difficulty accessing capital for small-business development.”41
By devoting their resources to such areas, CDFIs may be helping to serve unaddressed needs. To test this hypothesis, we examine whether tracts with low levels of HMDA-reported or CRA-reported lending receive greater levels of CDFI home or business lending, respectively.
There is modest evidence that CDFIs focus home lending activity on tracts with low levels of HMDA-reported lending. We look at CDFI home lending to census tracts with low HMDA lending rates (numbers of purchase and home improvement originations per 100 homeowners). In 2012, CDFIs delivered 29 percent of their home financing loans by number (30 percent by dollar volume) to tracts with a HMDA lending rate less than half of the corresponding county rate. This proportion exceeds the proportion of homeowners living in such tracts (26 percent), and the difference is significant at p<.05. We find a slightly stronger difference (significant at
39 Smith, Geoff, Jennifer Newon, Sean Zielenbach and Sarah Duda. Collaborators or Competitors? Exploring the Relationships between Community Development Financial Institutions and Conventional Lenders in Small Business Finance. Federal Reserve Bank of San Francisco, 2009. 40 Swack, Northrup and Hangen. CDFI Industry Analysis: Summary Report. Carsey Institute, 2012. 41 Smith, Geoff, Jennifer Newon, Sean Zielenbach and Sarah Duda. Collaborators or Competitors? Exploring the Relationships between Community Development Financial Institutions and Conventional Lenders in Small Business Finance. Federal Reserve Bank of San Francisco, 2009.
35
p<.01) looking at tracts with a HMDA lending rate less than one-quarter of the corresponding county rate.
We also perform a multivariate analysis to predict the amount of CDFI lending in a census tract based on the distress characteristics of the tract (such as poverty, unemployment, and Investment Area eligibility) and on the volume of HMDA- and CRA-reported lending in the tract. We try various combinations of years in the data (such as predicting 2012 CDFI lending volume based on 2010 HMDA and CRA data, or 2010 volume based on 2007 HMDA and CRA data).
Generally, we do not find strong evidence that either the distress level of a census tract or lower levels of mainstream lending in a tract are predictive of CDFI lending activity. (There is a very modest effect in which CDFI business lending grew slightly faster in census tracts that saw a drop in CRA-reported small-business lending.) This result is counter-intuitive, given that the data on CDFI loans show that they are indeed distributed disproportionately to distressed census tracts. (In other words, given a CDFI loan, we know that it is often delivered to a distressed tract; but given a distressed tract, we do not see significantly greater likelihood of it receiving a CDFI loan than other tracts). This issue may stem from two factors:
• The generally small level of CDFI lending activity. Only about 15 percent of all the census tracts studied received more than two TLR-reported loans from a CDFI between 2007 and 2012, and about 5 percent received more than five TLR-reported loans.
• Lack of full coverage of the TLR dataset of the activities of the CDFI industry. It is very likely that many distressed tracts are in fact receiving CDFI investment that cannot be tracked in our dataset, as many CDFIs are not required to report their activities to the Fund (since they have not received an award).
We attempted to mitigate these limitations by including another variable in the analysis that tracks the number of CDFIs indicating that they serve a given census tract (even when they do not report TLR data). However, this control is imperfect, as including a tract in one’s market area does not necessarily mean it is a focus for lending. We also ran analyses limited to tracts where at least one CDFI loan was reported, to see if lending volume is greater when the tract is more distressed or mainstream lending levels are lower. Again, we did not find strong results.
Finding 6: No relationship between concentrated and sustained CDFI lending activity was detected in a particular census tract and subsequent improvement of neighborhood conditions in that census tract. However, data and methodology limitations again are very likely impacting the analysis.
As noted earlier in this report, most census tracts do not receive a concentrated volume of CDFI lending. However, some do. Tracts receiving a sustained concentration of CDFI investment during 2007 through 2011 were investigated to
36
determine whether they show neighborhood improvement relative to similar tracts not receiving such investment. We used HMDA data for 2007 and 2012, specifically the mortgage approval rate and the median mortgage amount, as “pre” and “post” measures of neighborhood quality. In a 2005, Galster et al determined that these two measures serve as proxy indicators for neighborhood prestige and social disadvantage.42 We identified 15 census tracts as the subjects of our analysis that were in the top decile for CDFI investment by dollar volume, and that received at least $100,000 in CDFI investments each year from 2007 through 2011.
Low-income areas are affected by powerful and complex economic forces, and a variety of literature suggests that these areas were hit particularly hard by the recession and have been slower to recover. For example, in an analysis of credit conditions by neighborhood in Massachusetts, Muñoz finds that low- and moderate-income census tracts in have fared worse than middle- and high-income tracts in regards to credit conditions from 2006 to 2012, as measured by the percentage of individuals with credit accounts, media balances, monthly payments, delinquency rates, and credit scores.43 In a survey analysis of low- and moderate-income populations, Edmiston finds that, since the economic recovery began in 2009, the low- and moderate-income population has continued to fare worse than higher-income groups.44 In an analysis of the housing market recovery of the 12th district in San Francisco, Choi finds a wave of investor purchases of distressed properties that may impact neighborhood conditions.45 It is also relevant to note that CDFIs play a very small role in the economy of a census tract.
As, intuitively, one would expect CDFI investments to benefit the communities they serve, future research may be needed to explore other community and economic benefits that may be associated with CDFI investments. Some of the evaluation studies that individual CDFIs have produced provide good models for future research, and are discussed in the section on The State of Impact Evaluation in the CDFI Industry.
Therefore, a propensity scoring design was used to identify comparison tracts within the same county that are similar along measures of initial distress—including poverty rate, median household income, percentage of minority population, and unemployment rate—but that did not receive significant CDFI investment.46 In most,
42 Galster, George, Chris Hayes, and Jennifer Johnson. "Identifying Robust, Parsimonious Neighborhood Indicators." Journal of Planning Education and Research, 2005: 265-280. 43 Muñoz, Ana Patricia. Credit Conditions by Neighborhood Income: The Picture in Massachusetts. Federal Reserve Bank of Boston, 2013 44 Edmiston, Kelly. The Low- and Moderate-Income Population in Recession and Recovery: Results From a New Economic Review. Federal Reserve Bank of Kansas City, 2013. 45 Choi, Laura. Housing Market Recovery in the 12th District: Implications for Low- and Moderate-Income Communities. Federal Reserve Bank of San Francisco Community Development, 2013. 46 The propensity score is the probability of treatment assignment conditional on observed baseline characteristics. The propensity score allows one to design and analyze an observational (nonrandomized) study so that it mimics some of the particular characteristics of a randomized controlled trial. In particular, the propensity score is a balancing score: conditional on the propensity
37
the results show that the tracts with intensive CDFI investment performed somewhat worse than their corresponding comparison tract in the county.
Again, data limitations come into play. First of all, our HMDA indicators have small numbers of observations at the tract level; because these are used on an annual basis (rather than the two-year rolling average used by Galster et al) additional unreliability is introduced. Outliers—generated, for example, when a person uses a smaller mortgage than usual to buy a home, or buys a smaller or larger home worth much more or less than the norm for the neighborhood—add a substantial amount of noise. The dataset is not sufficient to add controls (for example, information on property and neighborhood characteristics that would allow for such an analysis). Additionally, there is the possibility that the comparison tracts received either investments from a CDFI that were not reported on the TLR, or some other form of community development intervention which was not accounted for.
score, the distribution of observed baseline covariates will be similar between treated and untreated subjects. The propensity score attempts to level the playing field before assignment of the treatment variable. The playing field that was leveled comprised the distress indicators of unemployment, percent minority, poverty rate and household income.
38
Impact of CDFI Fund Awards on CDFI Financial Health and Activity Levels
Regression Discontinuity Analysis
What impact does receiving an award from the CDFI Fund have on the financial health and performance of a CDFI loan fund?47
To investigate this question, the research team used information on three years of CDFI FA application scoring and award amounts from the CDFI Fund, combined with financial data from later CDFI applications as well as IRS 990 forms, on individual CDFIs for the year of the application plus the following years.
The research design involved comparing CDFIs that scored close to the threshold for receiving a funding award—some that were funded and some that were not. Presumably, the organizations that were not funded but scored close to the cutoff had similar management and business plan quality as those that were funded. This Regression Discontinuity (RD) design enabled analysis of the data as if it came from a randomized experiment. If variation in the treatment near the threshold is approximately randomized, then it follows that all “baseline characteristics”—all those variables determined prior to the realization of the assignment variable—should have the same distribution just above and just below the cutoff.
Previous literature has found positive effects of CDFI Fund financing on CDFI credit unions, which regulated institutions must provide detailed annual data on their financial condition. In their paper on government subsidized lending, Cortés and Lerner use a similar RD approach to study the impact of CDFI Fund awards on credit union activity, using credit union call report data. They find that loan activity at credit unions receiving an award increased by $1.60 over three years for each dollar awarded.48
Since the receipt of a CDFI Fund FA award could have a different impact on small and emerging (SECA) CDFIs than larger (Core) CDFIs, we divided the analysis to look at SECA and Core CDFIs separately. Results are presented in detail in the Recommendations for Future Evaluation Efforts, but we highlight some of the most interesting results here:
• SECA and Core results are different. Generally, more significant results are seen in Core CDFIs. This may be due to the larger asset size of Core CDFIs, more robust and accurate financial reporting and presumed likelihood of having received multiple FA awards.
47 This analysis is conducted with CDFI loan fund data only, and does not include regulated financial institutions. 48 Cortés, Kristle Romero, and Josh Lerner. "Bridging the Gap? Government Subsidized Lending and Access to Capital." Review of Corporate Finance Studies, 2013: 98-128.
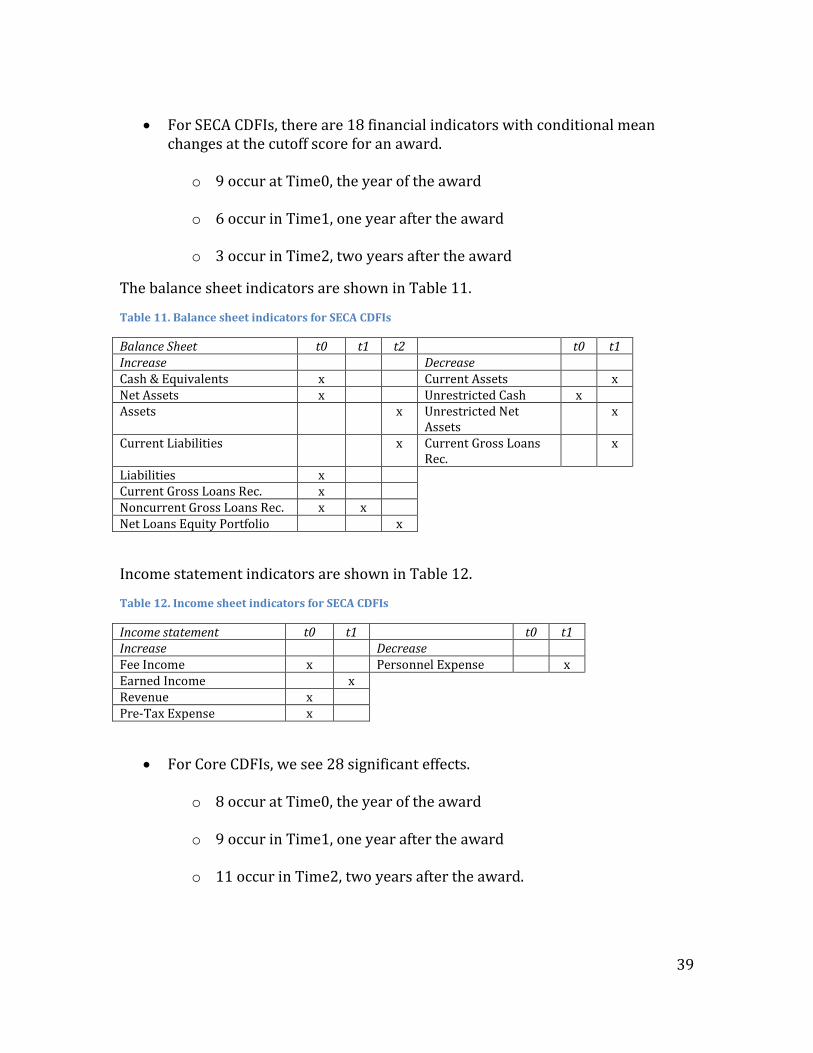
39
• For SECA CDFIs, there are 18 financial indicators with conditional mean
changes at the cutoff score for an award.
o 9 occur at Time0, the year of the award
o 6 occur in Time1, one year after the award
o 3 occur in Time2, two years after the award
The balance sheet indicators are shown in Table 11.
Table 11. Balance sheet indicators for SECA CDFIs
Balance Sheet t0 t1 t2 t0 t1 Increase Decrease Cash & Equivalents x Current Assets x Net Assets x Unrestricted Cash x Assets x Unrestricted Net
Assets x
Current Liabilities x Current Gross Loans Rec.
x
Liabilities x Current Gross Loans Rec. x Noncurrent Gross Loans Rec. x x Net Loans Equity Portfolio x
Income statement indicators are shown in Table 12.
Table 12. Income sheet indicators for SECA CDFIs
Income statement t0 t1 t0 t1 Increase Decrease Fee Income x Personnel Expense x Earned Income x Revenue x Pre-Tax Expense x
• For Core CDFIs, we see 28 significant effects.
o 8 occur at Time0, the year of the award
o 9 occur in Time1, one year after the award
o 11 occur in Time2, two years after the award.

40
The balance sheet indicators are shown in Table 13.
Table 13. Balance sheet indicators for Core CDFIs
Balance Sheet t0 t1 t2 t0 t1 t2 Increase Decrease Unrestricted Net Assets x Land Building & Equip x Temp. Restricted Net Assets x Noncurrent Gross Loans
Rec. x x
Months Cash & Investments x Net Loans Rec. Equity Investment Portfolio
x
Months Unrestricted Liquid Assets
x Off Bal. Sheet Assets Avail.
x
Cash & Equivalents x Unrestricted Net Assets x Loan Loss Reserve x Net Assets Avail. For
Financing x
Current Liabilities x x x Net Assets Avail. For Financing x Off Bal. Sheet Liabilities x Long-Term Maturities Due x x
Income statement indicators are shown in Table 14.
Table 14. Income statement indicators for Core CDFIs
Income Statement t0 t1 t2 t0 t1 t2 Increase Decrease Program Service Revenue x x Other Grants & Contr. x Revenue x Fee Income Fin. Prod. &
Svcs. x
Interest Payment Fin. Products
x Earned Income x x
The results indicate that CDFI funding does have an overall positive impact on the financial indicators of the recipient organizations. These effects are most often felt in the first year after the award.
The analysis suffers from severe limitations, including a small number of total observations that are close to the scoring cutoff points, the presence of different fiscal year start and end periods, lack of lending-specific data on IRS 990 forms, and particular sensitivity of RD results to outliers.
Discussion
CDFIs are businesses and must generate revenue. The business model of a combination of loans/development services and interest and fees/grants generates less than useful information trying to compare CDFIs using any indicator. However, many of the effects described above make intuitive sense. Using Ronald Coase’s logic, growth of the firm results or can be caused by scale effects which lower
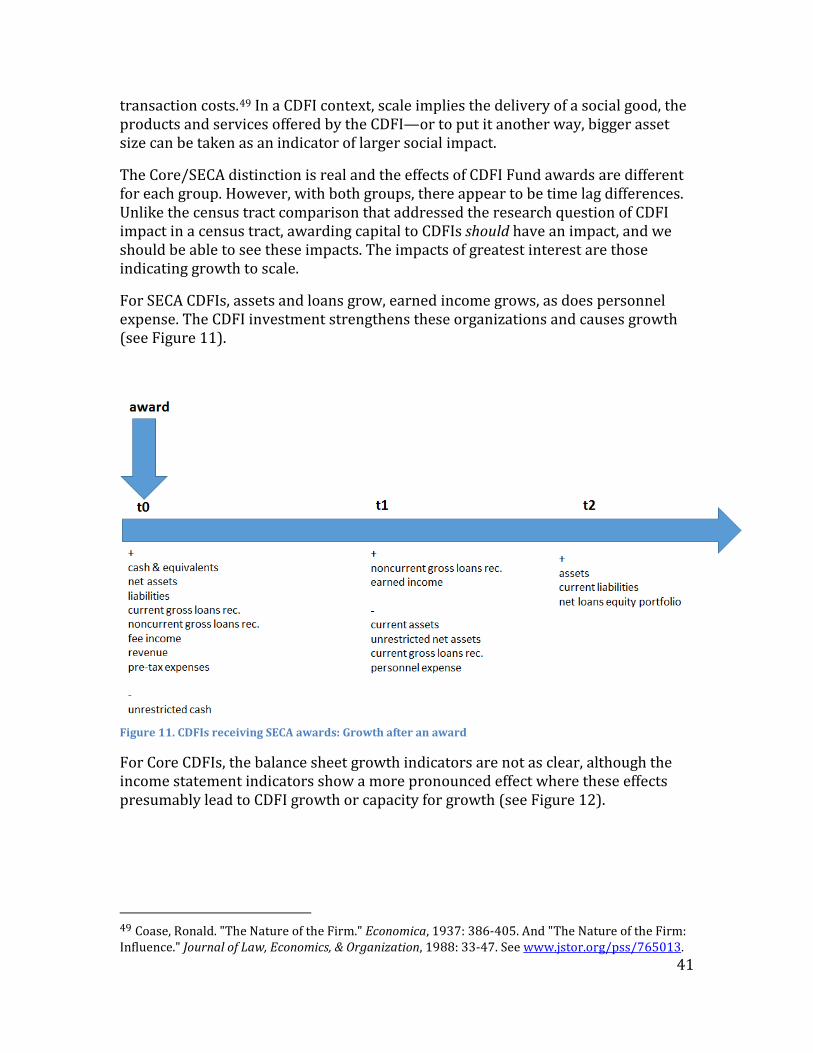
41
transaction costs.49 In a CDFI context, scale implies the delivery of a social good, the products and services offered by the CDFI—or to put it another way, bigger asset size can be taken as an indicator of larger social impact.
The Core/SECA distinction is real and the effects of CDFI Fund awards are different for each group. However, with both groups, there appear to be time lag differences. Unlike the census tract comparison that addressed the research question of CDFI impact in a census tract, awarding capital to CDFIs should have an impact, and we should be able to see these impacts. The impacts of greatest interest are those indicating growth to scale.
For SECA CDFIs, assets and loans grow, earned income grows, as does personnel expense. The CDFI investment strengthens these organizations and causes growth (see Figure 11).
Figure 11. CDFIs receiving SECA awards: Growth after an award
For Core CDFIs, the balance sheet growth indicators are not as clear, although the income statement indicators show a more pronounced effect where these effects presumably lead to CDFI growth or capacity for growth (see Figure 12).
49 Coase, Ronald. "The Nature of the Firm." Economica, 1937: 386-405. And "The Nature of the Firm: Influence." Journal of Law, Economics, & Organization, 1988: 33-47. See www.jstor.org/pss/765013.
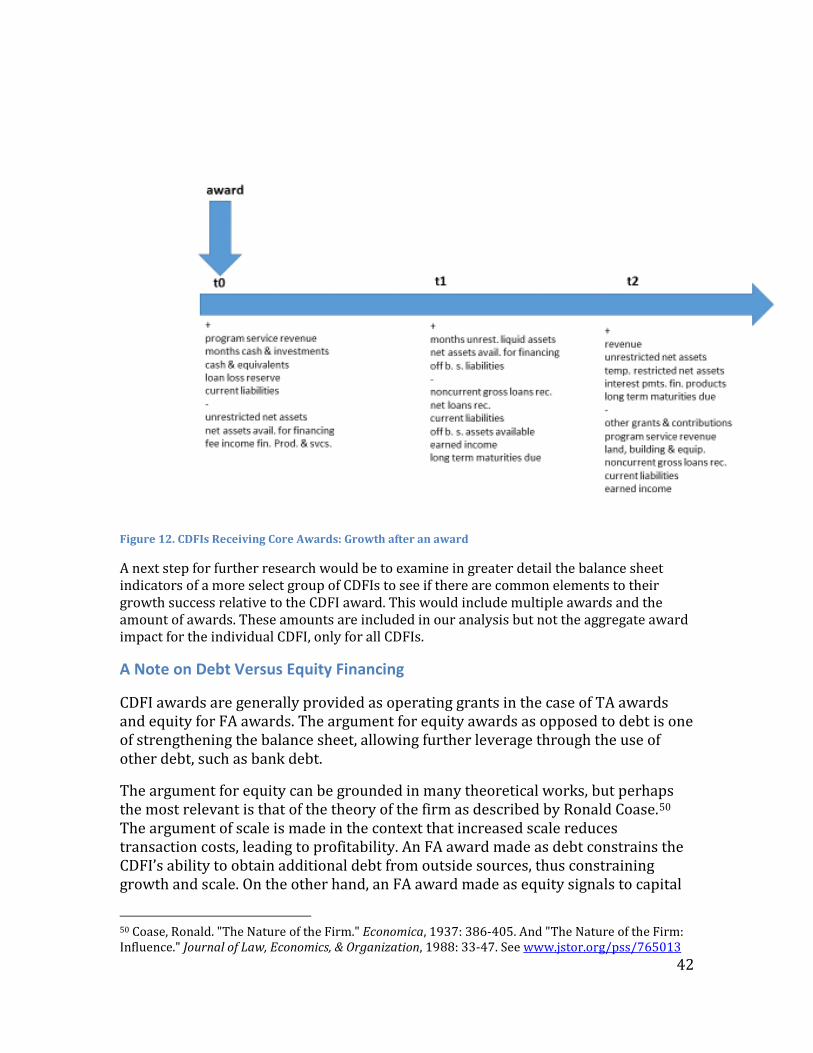
42
Figure 12. CDFIs Receiving Core Awards: Growth after an award
A next step for further research would be to examine in greater detail the balance sheet indicators of a more select group of CDFIs to see if there are common elements to their growth success relative to the CDFI award. This would include multiple awards and the amount of awards. These amounts are included in our analysis but not the aggregate award impact for the individual CDFI, only for all CDFIs.
A Note on Debt Versus Equity Financing
CDFI awards are generally provided as operating grants in the case of TA awards and equity for FA awards. The argument for equity awards as opposed to debt is one of strengthening the balance sheet, allowing further leverage through the use of other debt, such as bank debt.
The argument for equity can be grounded in many theoretical works, but perhaps the most relevant is that of the theory of the firm as described by Ronald Coase.50 The argument of scale is made in the context that increased scale reduces transaction costs, leading to profitability. An FA award made as debt constrains the CDFI’s ability to obtain additional debt from outside sources, thus constraining growth and scale. On the other hand, an FA award made as equity signals to capital
50 Coase, Ronald. "The Nature of the Firm." Economica, 1937: 386-405. And "The Nature of the Firm: Influence." Journal of Law, Economics, & Organization, 1988: 33-47. See www.jstor.org/pss/765013
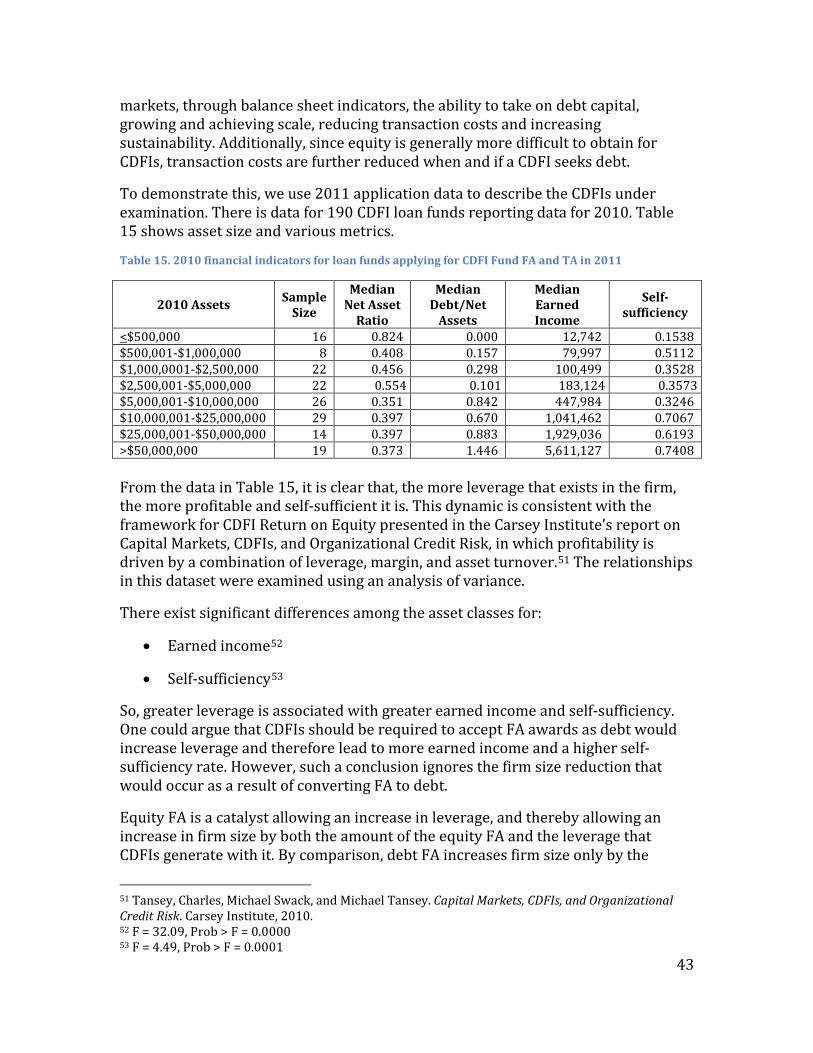
43
markets, through balance sheet indicators, the ability to take on debt capital, growing and achieving scale, reducing transaction costs and increasing sustainability. Additionally, since equity is generally more difficult to obtain for CDFIs, transaction costs are further reduced when and if a CDFI seeks debt.
To demonstrate this, we use 2011 application data to describe the CDFIs under examination. There is data for 190 CDFI loan funds reporting data for 2010. Table 15 shows asset size and various metrics.
Table 15. 2010 financial indicators for loan funds applying for CDFI Fund FA and TA in 2011
2010 Assets Sample Size
Median Net Asset
Ratio
Median Debt/Net
Assets
Median Earned Income
Self-sufficiency
<$500,000 16 0.824 0.000 12,742 0.1538 $500,001-$1,000,000 8 0.408 0.157 79,997 0.5112 $1,000,0001-$2,500,000 22 0.456 0.298 100,499 0.3528 $2,500,001-$5,000,000 22 0.554 0.101 183,124 0.3573 $5,000,001-$10,000,000 26 0.351 0.842 447,984 0.3246 $10,000,001-$25,000,000 29 0.397 0.670 1,041,462 0.7067 $25,000,001-$50,000,000 14 0.397 0.883 1,929,036 0.6193 >$50,000,000 19 0.373 1.446 5,611,127 0.7408 From the data in Table 15, it is clear that, the more leverage that exists in the firm, the more profitable and self-sufficient it is. This dynamic is consistent with the framework for CDFI Return on Equity presented in the Carsey Institute’s report on Capital Markets, CDFIs, and Organizational Credit Risk, in which profitability is driven by a combination of leverage, margin, and asset turnover.51 The relationships in this dataset were examined using an analysis of variance.
There exist significant differences among the asset classes for:
• Earned income52
• Self-sufficiency53
So, greater leverage is associated with greater earned income and self-sufficiency. One could argue that CDFIs should be required to accept FA awards as debt would increase leverage and therefore lead to more earned income and a higher self-sufficiency rate. However, such a conclusion ignores the firm size reduction that would occur as a result of converting FA to debt.
Equity FA is a catalyst allowing an increase in leverage, and thereby allowing an increase in firm size by both the amount of the equity FA and the leverage that CDFIs generate with it. By comparison, debt FA increases firm size only by the
51 Tansey, Charles, Michael Swack, and Michael Tansey. Capital Markets, CDFIs, and Organizational Credit Risk. Carsey Institute, 2010. 52 F = 32.09, Prob > F = 0.0000 53 F = 4.49, Prob > F = 0.0001
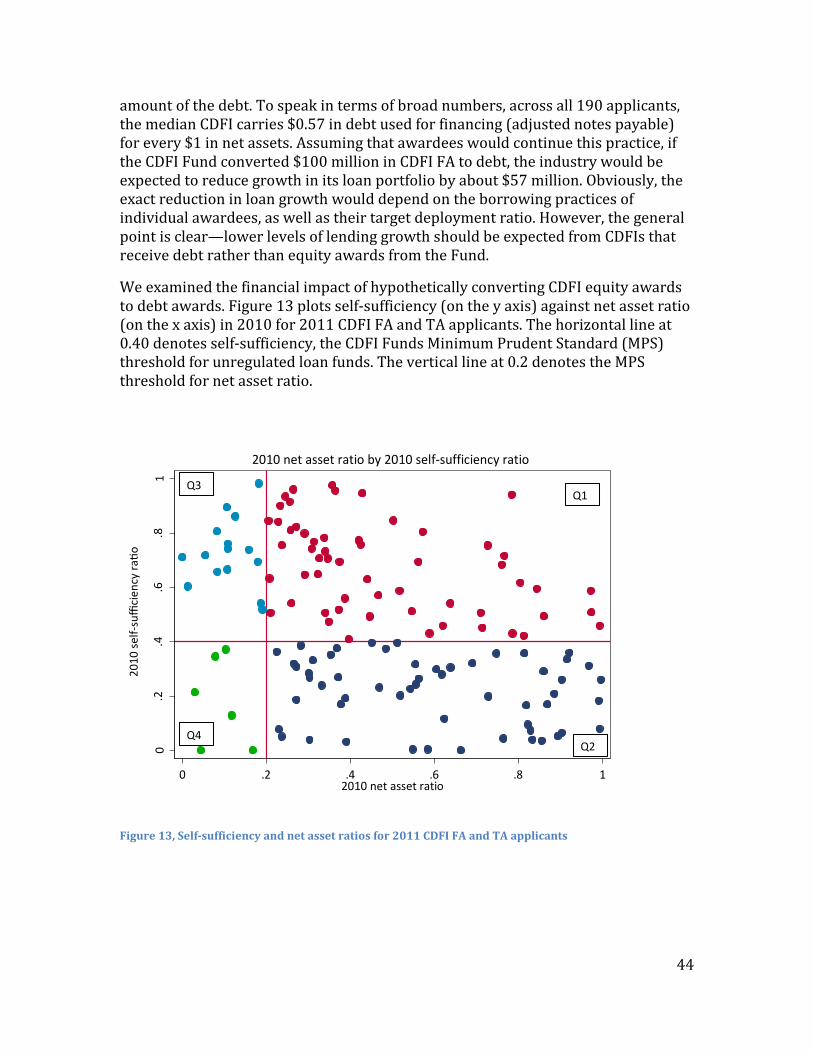
44
amount of the debt. To speak in terms of broad numbers, across all 190 applicants, the median CDFI carries $0.57 in debt used for financing (adjusted notes payable) for every $1 in net assets. Assuming that awardees would continue this practice, if the CDFI Fund converted $100 million in CDFI FA to debt, the industry would be expected to reduce growth in its loan portfolio by about $57 million. Obviously, the exact reduction in loan growth would depend on the borrowing practices of individual awardees, as well as their target deployment ratio. However, the general point is clear—lower levels of lending growth should be expected from CDFIs that receive debt rather than equity awards from the Fund.
We examined the financial impact of hypothetically converting CDFI equity awards to debt awards. Figure 13 plots self-sufficiency (on the y axis) against net asset ratio (on the x axis) in 2010 for 2011 CDFI FA and TA applicants. The horizontal line at 0.40 denotes self-sufficiency, the CDFI Funds Minimum Prudent Standard (MPS) threshold for unregulated loan funds. The vertical line at 0.2 denotes the MPS threshold for net asset ratio.
Figure 13, Self-sufficiency and net asset ratios for 2011 CDFI FA and TA applicants
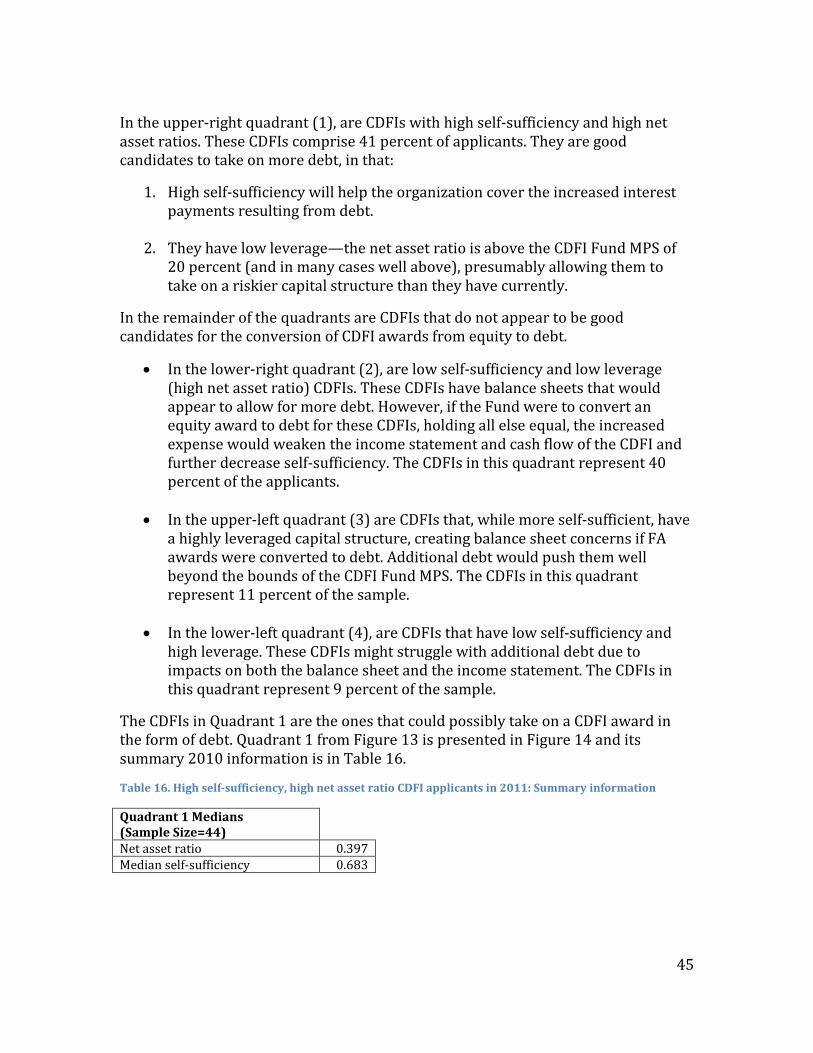
45
In the upper-right quadrant (1), are CDFIs with high self-sufficiency and high net asset ratios. These CDFIs comprise 41 percent of applicants. They are good candidates to take on more debt, in that:
1. High self-sufficiency will help the organization cover the increased interest payments resulting from debt.
2. They have low leverage—the net asset ratio is above the CDFI Fund MPS of 20 percent (and in many cases well above), presumably allowing them to take on a riskier capital structure than they have currently.
In the remainder of the quadrants are CDFIs that do not appear to be good candidates for the conversion of CDFI awards from equity to debt.
• In the lower-right quadrant (2), are low self-sufficiency and low leverage (high net asset ratio) CDFIs. These CDFIs have balance sheets that would appear to allow for more debt. However, if the Fund were to convert an equity award to debt for these CDFIs, holding all else equal, the increased expense would weaken the income statement and cash flow of the CDFI and further decrease self-sufficiency. The CDFIs in this quadrant represent 40 percent of the applicants.
• In the upper-left quadrant (3) are CDFIs that, while more self-sufficient, have a highly leveraged capital structure, creating balance sheet concerns if FA awards were converted to debt. Additional debt would push them well beyond the bounds of the CDFI Fund MPS. The CDFIs in this quadrant represent 11 percent of the sample.
• In the lower-left quadrant (4), are CDFIs that have low self-sufficiency and high leverage. These CDFIs might struggle with additional debt due to impacts on both the balance sheet and the income statement. The CDFIs in this quadrant represent 9 percent of the sample.
The CDFIs in Quadrant 1 are the ones that could possibly take on a CDFI award in the form of debt. Quadrant 1 from Figure 13 is presented in Figure 14 and its summary 2010 information is in Table 16.
Table 16. High self-sufficiency, high net asset ratio CDFI applicants in 2011: Summary information
Quadrant 1 Medians (Sample Size=44)
Net asset ratio 0.397 Median self-sufficiency 0.683
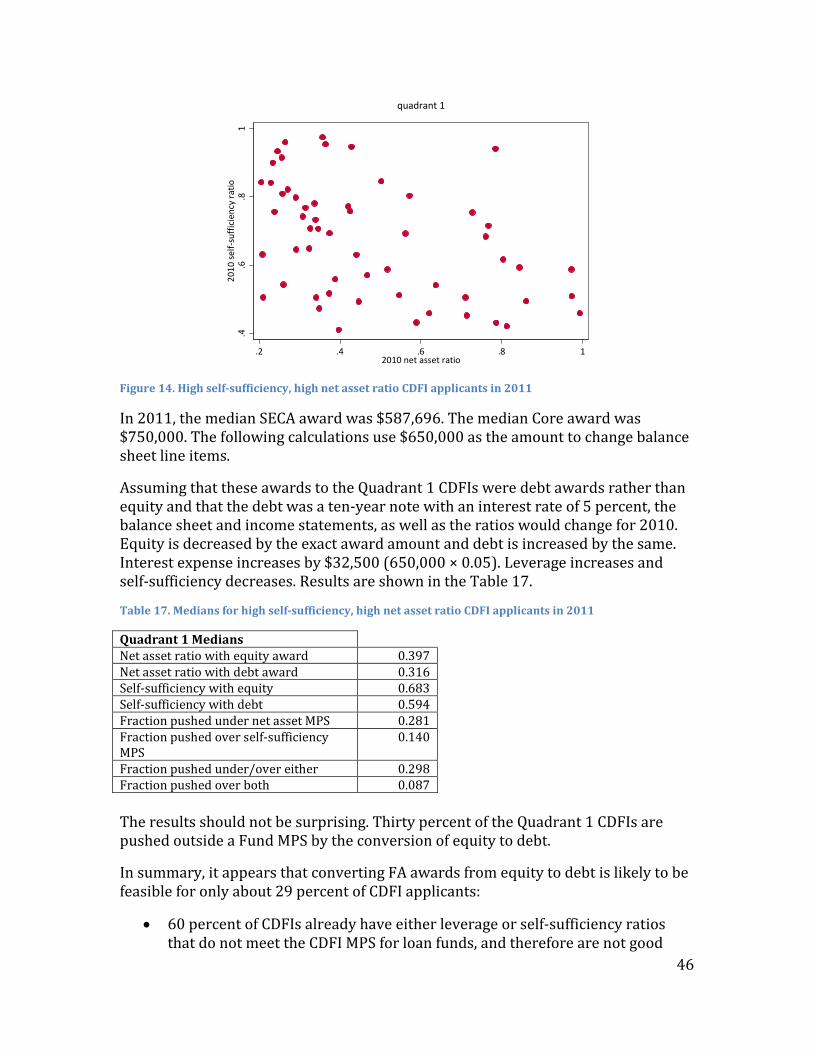
46
Figure 14. High self-sufficiency, high net asset ratio CDFI applicants in 2011
In 2011, the median SECA award was $587,696. The median Core award was $750,000. The following calculations use $650,000 as the amount to change balance sheet line items.
Assuming that these awards to the Quadrant 1 CDFIs were debt awards rather than equity and that the debt was a ten-year note with an interest rate of 5 percent, the balance sheet and income statements, as well as the ratios would change for 2010. Equity is decreased by the exact award amount and debt is increased by the same. Interest expense increases by $32,500 (650,000 × 0.05). Leverage increases and self-sufficiency decreases. Results are shown in the Table 17.
Table 17. Medians for high self-sufficiency, high net asset ratio CDFI applicants in 2011
Quadrant 1 Medians Net asset ratio with equity award 0.397 Net asset ratio with debt award 0.316 Self-sufficiency with equity 0.683 Self-sufficiency with debt 0.594 Fraction pushed under net asset MPS 0.281 Fraction pushed over self-sufficiency MPS
0.140
Fraction pushed under/over either 0.298 Fraction pushed over both 0.087 The results should not be surprising. Thirty percent of the Quadrant 1 CDFIs are pushed outside a Fund MPS by the conversion of equity to debt.
In summary, it appears that converting FA awards from equity to debt is likely to be feasible for only about 29 percent of CDFI applicants:
• 60 percent of CDFIs already have either leverage or self-sufficiency ratios that do not meet the CDFI MPS for loan funds, and therefore are not good
.4.6
.81
2010
self-
suffi
cien
cy ra
tio
.2 .4 .6 .8 12010 net asset ratio
quadrant 1
47
candidates for the conversion of equity awards to debt (with the possible exception of some bank or credit union applicants who are subject to different financial standards)
• 40 percent of CDFIs have leverage and self-sufficiency ratios in compliance with the CDFI Fund and presumably could take on more debt, but:
o 28 percent of these CDFIs would fail the leverage (net asset) MPS if the median CDFI award were debt rather than equity
o 14 percent of these CDFIs would fail the self-sufficiency MPS if the median CDFI award were debt rather than equity
o 30 percent of these CDFIs would fail one or the other (leverage or self-sufficiency) MPS if the median CDFI award were debt rather than equity. If these CDFIs are subtracted from the pool, there are about 29 percent of CDFI applicants left who could have an equity award converted to debt and still meet the Fund MPS for both leverage and self-sufficiency. Even for these CDFIs, additional equity from the CDFI Fund would enable them to further leverage private sector investment.
Key Themes and Findings from Interviews and Focus Groups
The research team conducted interviews with staff leadership at 22 CDFIs and reviewed information they supplied concerning impact evaluation activities. These CDFIs were selected because one or more industry leaders known to the Carsey Institute had suggested their impact evaluation work. Interviewers asked respondents to:
• Describe their mission and how their investment philosophy tied back to the organization’s mission
• Describe how they measured social impacts including the indicators their CDFI tracked over time
• Discuss barriers to impact measurement • Discuss any rigorous, formal impact evaluation activity they had conducted
or contracted
Key themes emerging from the interviews include the following:
• CDFIs are using a broad range of metrics to track success. Some measure success principally through readily “countable” measures. Others measure these outputs too, but have also sought to undertake much more rigorous analysis of how their CDFI’s work has benefitted people and communities. That said, the use of sophisticated impact evaluation methods appears rare, even in the sample of interviewees that was selected for their strong
48
reputation in the field. A few organizations have done sophisticated evaluation work and have been able to demonstrate compelling impacts from their investments.
• CDFIs are disparate in their philosophies around how they balance “mission” and “business” return. Credit unions and especially banks are more likely to pursue a market-rate return than loan funds, although all interviewees demonstrated that they care about, and believe that their CDFI is creating, positive community impact.
• CDFIs differ as to whether internal or external forces drive them to measure impacts, but virtually all of them acknowledge the strong role that funders have played in driving impact measurement.
• CDFIs are measuring a very broad range of outcomes, making it difficult to standardize outcomes measurement. Moreover, CDFIs strongly believe that the uniqueness of their individual organization’s work makes it difficult, if not impossible, to apply standard impact measures across the field.
• Cost is the number one barrier to impact measurement, although data systems limitations and concerns over client confidentiality and relationships also come into play.
• Most of the performance measurement and outcome measurement systems described by the CDFIs do not track long-term outcomes, control for external influences, or use randomized control trials to prove that the outcomes are attributable to a particular CDFI’s efforts.
• CDFIs were critical of the CDFI Fund’s approach to impact tracking, but as a group appear far from a consensus on exactly what about it needs to be changed.
All of the organizations spoken to conducted some activities to measure at least the outputs of their work, such as the number of loans they had made to certain types of borrowers or in certain types of neighborhoods. Many also summarized this information in a dashboard or short report that they could share with board members and funders.
There was much more disparity among CDFIs as to whether they worked to capture outcomes or impacts beyond simple output measures. Some CDFIs are satisfied that the outputs they are producing are inherently meaningful enough (such as making a loan that helps affordable housing to be built) that they do not need to measure anything beyond simple output counts (such as loans made, units created in the case of an affordable housing lender). Others have made very substantial investments in sophisticated data gathering and analysis to document impacts for people or
49
communities, using rigorous methodologies to undergird their arguments that these impacts would not have occurred but for the work of the CDFI.
Even in these cases, it was rare for evaluators to employ experimental or quasi-experimental approaches establishing control groups to help document impacts. Some exceptions include certain evaluation work done by The Reinvestment Fund (TRF), Self Help with the University of North Carolina, and by the University of Virginia in its evaluation of Latino Community Credit Union (LCCU), discussed below.
It is also important to note—as discussed in our section on The Financial Innovations Roundtable Discussion on Impact Measurement—that many CDFIs use academic literature to understand relationships between outputs and impacts and guide their work, even though they may not be able to conduct formal evaluation studies themselves. For example, representatives from the Low Income Investment Fund discussed research work that they have used from researchers at the Brookings Institution, the Harvard Joint Center for Housing, and the University of Chicago to help document and monetize impacts of its work.
Quotes from groups that rely only or principally on output measures “Our philosophy on impact is that [it happens] because of who we are, what we do, and where we are located—almost 100 percent of our deals are within are CRA assessment area—we are making loans in our neighborhoods.” – A bank serving low- and moderate-income neighborhoods, which are often also minority neighborhoods
“Even without us, most deals would happen—there is no ‘but for’ criterion.”
“Generally, given the nature of the community we serve, we know we are making a difference, so we do our business and keep an eye on the financial returns. Management does think about impact, but only in 5 or 10 percent of the cases, the rest of it is just business that comes through the door, which is meaningful but we’re not thinking about impact the way other CDFIs do.”
Examples of the most sophisticated studies carried out by organizations interviewed
The breadth of topic areas covered by formal evaluation work provides some sense of the diversity of social impact goals CDFIs are pursuing.
• TRF has an entire research division on its staff and conducts a very broad array of highly sophisticated research activities. For example, TRF has used Local Employment Dynamics and National Employment Time Series data in longitudinal studies assessing changes in industry concentrations, employment trends, and labor and commute sheds for two neighborhoods in northern Philadelphia where it has made concentrated investments. They have complemented this analysis with a parcel-level property survey of these neighborhoods for the past 5 years, on a quarterly to semi-annual basis, looking at building condition, vacancy, and business turnover. To
50
provide one more example out of many possible additional examples, TRF developed a Limited Supermarket Access (LSA) analysis that scores communities based on unmet demand for healthy-food retail options, and is using a longitudinal analysis of LSA scores in targeted communities to evaluate impacts of its Fresh Food Financing Initiative.
• The University of Virginia did a formal study looking at the decline in robberies where LCCU had opened branches, as well as assessing property value impacts associated with this drop in robberies. The study found statistically significant and impressive results.
• Self Help has conducted a number of studies with researchers at the University of North Carolina. One notable study is its Community Advantage Panel Survey, a longitudinal study designed to assess the economic and social impacts of homeownership on low- to moderate-income homeowners and renters.
• HomeSight is conducting scientific surveys of residents in a targeted neighborhood through the NeighborWorks America Community Impact Measurement System, looking at changes in perceived quality of life and satisfaction with the community.
• Alternatives Federal Credit Union worked with a Psychology professor at Ithaca College to conduct a program evaluation of its MoneyWise program, a financial education course, using pre- and post-surveys of participants. Among other findings, the study found statistically significant changes in participants’ financial knowledge, perceived confidence and self-control, and financial behaviors after attending MoneyWise.
• A number of organizations, including TRF, Minnesota Housing Fund, and Boston Community Capital, have prepared case studies blending a mix of qualitative information with relatively simple baseline and post-intervention data (for example, survey data from borrowers or from people using or living in a funded project) to document benefits of their work for people and communities.
The Financial Innovations Roundtable Discussion on Impact Measurement In April 2013, the Carsey Institute held a Financial Innovations Roundtable event focused on impact evaluation in the CDFI field. The event explored the following questions:
• Are there standard approaches for measuring social benefit, while accounting for the differences in CDFI type and customer base?
51
• How can CDFIs balance the need for measures that are meaningful to both lenders and investors with the need that they are simple to collect?
• What can the field learn from international examples of social metrics?
• Is it possible to develop a social impact index for community development lenders in the United States?
• What are the pros and cons of developing an index or series of indices?
Major points raised in the discussion included:
• CDFIs are still at a point in which each institution has different motivations for and approaches to impact evaluation, which are not standardized in any significant way. There is also limited willingness to share data across investors.
• Participants had different perspectives on the desirability of standardizing impact measures. Some practitioners do not believe that a common set of indicators makes sense given that different CDFIs have different activities and goals. Others argued that multiple standardized measures could be developed, and are necessary given the size of the industry and the need to attract investment.
• Many participants expressed interest in the use of simple proxy measures (often an output measure) that could reduce the need for continual, formal evaluation efforts, once the initial research has been conducted establishing the relationship between the proxy measure and the outcome.
• More generally, many participants noted the costs and burdens of data collection, and expressed a desire for more support (financially and otherwise) for impact measurement.
• Despite concerns over whether a standardized approach is workable, participants also saw the need for common definitions (for example for what a “job” or a “unit of housing” is) that may help the field to tell a stronger story. Also, to the extent that common broad goals can be identified, there could be the potential to develop indices around those goals (with one example being the Progress Out of Poverty index developed by the Grameen Foundation).
• Funders indicated a strong interest in understanding the impacts of work they fund and the use of impact information to make funding decisions.
52
Recommendations for Future Evaluation Efforts
Focus Additional Research on the Most Effective Strategies to Support Growth of the CDFI Industry
There is strong evidence that CDFIs provide both a counter-cyclical effect in the economy, increasing lending during recessionary times, and that CDFIs devote the majority of their lending to historically underserved borrowers such as low-income and minority groups, as well as to distressed neighborhoods. CDFIs may thus present an attractive tool for policymakers seeking to increase capital flows at times and to places where mainstream lenders are less active. However, we also find that the CDFI industry is tiny relative to the mainstream financial sector, elevating the importance of research to better understand how CDFIs grow and what can be done to support their growth. Ratliff and Moy used a case study approach of ten organizations (some of which were private sector corporations not in the finance industry) to present a conceptual framework for pathways to scale in community development finance.54 With much richer datasets now available and a greater number of larger CDFIs now having histories to mine, a renewed exploration of these themes using an expanded range of empirical methods is appropriate.
There are key research questions that relate to this overall policy question:
• Looking across the histories of different individual CDFIs, what management and financial indicators are predictive of subsequent growth of the CDFI? For example, are there certain asset sizes at which growth begins to accelerate? Is growth always accompanied by an increase in leverage? Does outsourcing certain functions (say, loan servicing or loan review) pave the way for more rapid growth or hinder it?
• What key events or investments do CDFIs that have achieved larger scale attribute to their growth? In this report, we have presented preliminary analyses of how CDFI Fund awards may contribute to subsequent growth, but we may be able to find more robust results by examining more details of organizations’ growth trajectories. For example, whether key management hires, technology investments, or shifts in the design or types of loan products offered led to loan portfolio growth.
• Is growth associated with subsequent improvements in financial performance and operating efficiency of a CDFI? The Carsey Institute’s 2012 CDFI industry analysis used a cross-sectional approach to find that larger loan funds generally have higher levels of leverage and self-sufficiency than smaller funds, but a longitudinal approach would yield insight into whether these relationships exist for individual CDFIs.
54 Ratliff, Gregory, and Kirsten Moy. New Pathways to Scale for Community Development Finance. Aspen Institute Research Review, 2004.
53
A mixed-methods study would be well suited to exploring these questions. A cohort study of CDFI loan funds could be the focus of quantitative methods. CDFI FA applications could be used to construct an initial time series of data on organizations that could be augmented through use of CIIS Institution-Level Report (ILR) data and by requesting and analyzing historical audited financial statements.
The existing datasets used for this study provide a start, although adding additional years of CDFI FA application data could yield a strong dataset—especially because the most recent round of applications asked for an additional level of detail in the financial information requested, and asked short, focused questions that may lend themselves to the creation of additional variables using text analysis. A dataset of 200 or more loan funds could be created using these methods.
These quantitative methods could be supplemented by structured interviews with stakeholders from a more limited number of CDFIs that emerge as having achieved transformational growth and strong financial performance from the data analysis. These interviews, as well as follow-on research such as examination of past business and strategic plans, would yield a greater degree of qualitative insight into drivers of growth and performance at scale.
Standardize Definitions
The CDFI industry lacks a set of common definitions around key impact measurements. For example, there is no standard definition as to what constitutes a job, given differences such as full time versus part-time, minimum wage versus living wage and benefits versus no benefits. At a meeting of the Financial Innovations Roundtable in 2013, there was both broad consensus among the participants that standardized definitions are essential before a system of comparison or scoring could begin, as well as lingering concerns from some about the value and feasibility of basic scoring methodologies, proxies, indices, scales, and other “higher-order” standardization. Thus, definitions-setting would be distinct from and predate the development of these other methodologies.
A definitions working group could draw from a range of organizations to develop standard definitions (which would probably overlap with those already used by these leading organizations) and to understand where the collection, aggregation, and reporting of related measures is and is not effective. These organizations include IRIS, Aeris (formerly the CDFI Assessment and Ratings System); CDFIs such as the Low Income Investment Fund, Pacific Coast Ventures, the Illinois Facilities Fund; and trade associations such as the Opportunity Finance Network, the National Federation of Community Development Credit Unions, the Association for Economic Opportunity, the Community Development Venture Capital Alliance, the Community Development Bankers Association, and the National Community Investment Fund.
Financial measures for unregulated CDFIs present another area where standardization could yield benefits for future evaluation efforts. While organizational financial measures are obviously not a direct measure of community
54
impact, standardized loan portfolio performance information could help to ascertain whether CDFIs are successfully serving borrowers regarded to be higher risk—one of the central tenets of the field. Additionally, efforts to measure whether (and what kinds of) support from the CDFI Fund boosts the financial sustainability of CDFIs would benefit from more standardized information. These benefits are in addition to the possibility for greater access to capital that could result.
Develop Shared Measurement Systems, Including Encouraging Fuller Use of the Fund’s Impact Reporting System
The research team heard a number of criticisms from industry stakeholders about the Community Investment Impact System (CIIS) that the CDFI Fund uses to track awardee activities and impacts. These criticisms included concerns from some that the system lacks flexibility to track the indicators that matter most to particular CDFIs. Conversely, others expressed concerns that the system is not flexible enough, that reporting is cumbersome and time consuming, and that the system makes artificial distinctions between targeting people or place.
At the same time, this data clearly has utility in demonstrating that CDFIs are delivering investments to the borrowers and communities that need it, as reviewed earlier in this report. While continued work to make the system more usable and its measures more understandable for CDFIs is doubtless needed, it is hard to imagine what kind of program evaluation could have been prepared in the absence of the CIIS data.
In fact, from a researcher’s perspective, one of the greatest concerns about using CIIS data is that not enough CDFIs are providing data for all the fields that are relevant to a given loan type, more so than any concerns about the system tracking the wrong data. For example, in the case of consumer lending, there are higher-order questions about the impact of CDFI consumer lending that CIIS does not help to track—for example, whether borrowers are able to improve their credit rating and whether they are subsequently more successful at obtaining financing from mainstream sources. However, the Fund does ask whether CDFIs are delivering loans to traditionally underserved populations such as unbanked borrowers, female-headed households, and minorities. Presumably, such a question is of central importance to an evaluation of the Fund, as providing credit to underserved populations was one of the principal motivations for creating the industry.
The only thing standing in the way of creating more compelling evidence about whether or not CDFIs are directing their resources to these populations is more complete reporting from CDFIs on whether or not each borrower they serve fits or does not fit each of the targeted characteristics, and especially reporting from a larger number of CDFIs—ideally the entire industry—along such metrics. CIIS data has improved substantially in this regard, with fewer issues with missing values in more recent years, but only a fraction of the industry is reporting to CIIS at all.
55
In short, while CIIS has shortcomings that must be addressed, the answer is to improve and expand its use rather than to abandon it. The CDFI Fund and other industry stakeholders should work together to see how the existing system could be transformed into a widely-used and meaningful Shared Measurement Platform.
A report by FSG Social Impact Advisors notes that a handful of innovative organizations have developed related web-based systems for reporting the performance, measuring the outcomes, and coordinating the efforts of hundreds or even thousands of social enterprises within a field.55 FSG identified three different breakthroughs in shared measurement:
• Shared Measurement Platforms allow organizations to choose from a set of measures within their fields, using web-based tools to inexpensively collect, analyze, and report on their performance or outcomes. Benefits include lower costs and greater efficiency in annual data collection, expert guidance for less sophisticated organizations, and improved credibility and consistency in reporting.
• Comparative Performance Systems require all participants within a field to report on the same measures, using identical definitions and methodologies. As a result, users can compare the performance of different organizations and collect reliable field-wide data. Organizations can learn from each other’s performance, funders can make more informed choices, and the field as a whole can more accurately document its scale and influence.
• Adaptive Learning Systems engage a large number of organizations working on different aspects of a single complex issue in an ongoing, facilitated process that establishes comparative performance metrics, coordinates their efforts, and enables them to learn from each other. Benefits include improved alignment of goals among the different organizations, more collaborative problem solving, and the formation of an ongoing learning community that gradually increases all participants’ effectiveness.
There are several existing data systems that could help inform the creation of shared data systems including the IRIS taxonomy, Moody’s Social Performance Assessment tool and Aspen’s microTracker. Convening these groups with representatives from the CDFI industry could help initiate a process for developing a set of shared measurement systems for different CDFI lending products. For example, IRIS is the catalog of generally-accepted performance metrics that leading impact investors use to measure the social, environmental, and financial performance of their investments. IRIS metrics align with a number of third-party
55 Kramer, Mark, Marcie Parkhurst, and Lalitha Vaidyanathan. Breakthroughs in Shared Measurement and Social Impact. FSG Social Impact Advisors, 2009. See www.fsg.org/Portals/0/Uploads/Documents/PDF/Breakthroughs_in_Measurement_Exec_Summary.pdf.
56
standards, and proprietary metric sets. These metric sets represent a range of industries and are endorsed by leaders in each respective field.56
Develop Proxy Measures
It might be helpful for the CDFI Fund to begin to develop a set of proxy measures and tools to help CDFIs help standardize methods of collecting impact data for certain types of lending. This has been done on the international level and there have been some initial steps towards this approach in the CDFI field. Examples include the Progress out of Poverty Index (PPI), created by the Grameen Foundation, which measures how likely respondents are to live below the poverty threshold and helps organizations with a mission to serve the poor by measuring their success in getting clients out of poverty. The PPI has a standard ten-question format tailored to each country. Penetration is 2 to 3 percent of organizations internationally.
In the U.S., the Low Income Investment Fund has begun to develop proxy measures for some of its lending activities. It measures outputs (such as the number of child-care centers and child slots) and then uses existing research as proxy to understand the social value of these outputs. For example, in the case of child care, they use research on the social benefits created by expanding access to quality child care to extrapolate the impact of their creating additional slots.57 Another example of a proxy indicator is measuring affordable housing rent versus market rent in the same area. Studies by the Harvard Joint Center for Housing show that once people spend less on housing, they spend more on food and health care.58
Carry Out Regular External Evaluations
These shared measurement systems cannot replace the roles of academic researchers and third-party evaluators, whose rigorous studies remain necessary to understanding why the reported CDFI results are being achieved and to what they may be attributable. Instead, shared measurement and proxy systems offer an important complement to more rigorous evaluation studies by promoting ongoing learning in timely and cost-effective ways.
Below we suggest a few ideas for more rigorous external evaluations that individual CDFIs or groups of CDFIs could sponsor, as appropriate to their varied interests and missions:
• For organizations doing business lending, longitudinal data could be tracked over time on the businesses’ sales, employment levels, and credit scores. A matched comparison group could be generated by using Dun and Bradstreet or similar data to identify businesses in the same NAICS (North American
56 See http://iris.thegiin.org/metrics. 57 For example, see Heckman, James and Dimitriy V. Masterov. The Productivity Argument for Investing in Young Children. University of Chicago, 2007. See http://jenni.uchicago.edu/human-inequality/papers/Heckman_final_all_wp_2007-03-22c_jsb.pdf. 58 See www.jchs.harvard.edu/sites/jchs.harvard.edu/files/ahr2011-5-affordability.pdf.
57
Industry Classification System) code and county with similar employment size and credit characteristics at the time of the loan.
• For organizations making mortgage loans to homebuyers and/or consumers, borrower credit and debt information could be tracked for a sample of borrowers. Ideally, comparison data could be obtained for a matched set of households from credit agencies.
• Organizations making concentrated investments in a specific neighborhood or group of neighborhoods could use propensity scoring methods (similar to those used here) or Adjusted Interrupted Time Series approaches to study improvements in key indicators of neighborhood quality of life.59
• Researchers seeking to study further the question of whether CDFIs focus the deployment of capital on communities that are underserved by mainstream lenders could acquire data on the number of business establishments and employees by census tract to calculate small-business lending rates using CRA data, similar to how we calculated residential mortgage lending rates using HMDA data. Generally, however, most of the analyses attempted here could mainly be improved by improving the participation of CDFIs in CIIS and the quality and completeness of the data it tracks.
Obviously, this list is only a partial one, and CDFIs may find many other evaluation designs appropriate to describing their mission impacts.
Final Recommendation—A CDFI “Infrastructure and Innovation” Fund According to our recent CDFI industry analysis, when it comes to making a difference, larger CDFIs seem to have many advantages.60
Firstly, they often have critical capacities—access to capital, market research, the ability to develop and test new products and services, and the infrastructure to deliver products and services efficiently and with consistent quality—that smaller organizations do not. These capacities make larger organizations more effective at meeting their mission. Perhaps most important, once at scale, CDFIs can afford to attract and retain a higher quality of staff, including experienced specialists.
Secondly, our research shows that larger organizations are better able to leverage both the public and private sectors. It is clear that, in order to serve its customer base effectively and efficiently, CDFIs need to adapt and develop new business models, using new technologies, operating platforms and networked approaches to raising funds, and originating and servicing loans.
59 For a discussion of the use of Adjusted Interrupted Time Series approaches to measuring neighborhood change, see Galster et al. "Measuring the Impacts of Community Development Initiatives." Evaluation Review, 2004: 502-538. 60 See http://carseyinstitute.unh.edu/sites/carseyinstitute.unh.edu/files/Report-Swack-CDFI-Industry-Analysis-final.pdf.
58
One of the major impediments to the development of new technologies is the initial cost of developing those technologies. The CDFI Fund is in a unique position to fund “infrastructure” development in the field and to promote CDFI business models that introduce efficiencies that will result in more people and communities getting the products and services offered by CDFIs. We recommend the CDFI Fund create an “infrastructure innovation” fund that can fund initiatives by CDFIs and groups of CDFIs to develop these new structures and technologies that have the ability to help significantly grow the field.