CD-7/CD-7L COLOR DASH DISPLAY CAN LOGGER … Introducing AEM DashDesign The AEM Color Dash Display...
61
30-5500 30-5501 30-5502 30-5503 AEM Performance Electronics 2205 126th Street Unit A, Hawthorne, CA 90250 Phone: (310) 484-2322 Fax: (310) 484-0152 http://www.aemelectronics.com Instruction Part Number: 10-5500 Document Build 7/24/2017 CD-7/CD-7L COLOR DASH DISPLAY CAN LOGGER SYSTEM OBDII COMPATIBLE
Transcript of CD-7/CD-7L COLOR DASH DISPLAY CAN LOGGER … Introducing AEM DashDesign The AEM Color Dash Display...

30-550030-550130-550230-5503
AEM Performance Electronics2205 126th Street Unit A, Hawthorne, CA 90250
Phone: (310) 484-2322 Fax: (310) 484-0152http://www.aemelectronics.com
Instruction Part Number: 10-5500Document Build 7/24/2017
CD-7/CD-7LCOLOR DASH DISPLAYCAN LOGGER SYSTEMOBDII COMPATIBLE

2
Introducing AEM DashDesign
The AEM Color Dash Display and CAN Logger includes the AEM CD-7 / CD-7L color display and AEMDashDesign editing software. Screen pages are designed graphically. The screen layout displayed in AEMDashDesign is identical to the layout displayed on the AEM CD-7 / CD-7L.
In addition to the graphical display editor, AEM DashDesign also provides a comprehensive setup editor toprogram the input, output and mathematical functionality of the AEM CD-7 / CD-7L.
Once created, setups are uploaded to the AEM CD-7 / CD-7L via a USB link.
Kit Contents

3
CD-7 Features
· Full color CAN display and logger (CD-7L only)· Completely user definable CAN receive· Dual CAN bus· Full graphics display with up to 6 different pages· Unit ships with 6 display pages for the AEMNet data stream as the default setup· Completely user definable graphical layouts· Stand-alone PC program to create and customize layouts· Water resistant enclosure with rear facing DTM 12 pin connector· 7" (diag) 800x400 super bright color display· Night mode input· 7 shift lights and 2 alarm LEDs· 200mb onboard logging memory (CD-7L only)· Up to 100hz sample rate (CD-7L only)· Log data downloaded and viewed with AEMdata via USB port with sealed bulkhead extension cable (CD-7L
only)· Beacon input

4
CD-7 Mechanical and Mounting

5
Interfaces

6
CD-7 Harness and Basic Wiring

7
Optional OBDII and Power Cable Kits

8
Installing AEM DashDesign
AEM DashDesign is distributed as a single install executable. To install, run AEM DashDesign Setup.exe andfollow the on-screen instructions.
Installing USB Drivers
The installation program will automatically install the USB drivers required by AEM CD-7 / CD-7L. However, onrare occasions, it may be necessary to install the USB drivers manually. To do this:
· Connect the AEM CD-7 / CD-7L to the PC.· When the add new hardware wizard appears, select "Install from a list or specific location" and click Next.· Choose "Search for the best driver in these locations" and check "Include this location in the search"· Click the Browse button and navigate to the Drivers folder sub folder in the AEM DashDesign installation
directory.· Click the Next button and the driver installation will proceed automatically.
VDM to CD-7
The AEM Vehicle Dynamics Module, PN 30-2206 can be used in conjunction with the AEM CD-7L dash for laptiming and track mapping features.
VDM Features:
· GPS latitude & longitude delivers AEMdata track map functionality via AEMnet CANbus · Easily Add GPS, lateral G, altitude, pitch and roll data to engine data logs · Simply install it in the correct position, connect to AEMnet and the data streams through AEMnet CANbus · Continuous time data can be used for Infinity USB log file naming · Accelerometers supply all 3-axis acceleration data for chassis tuning · Ideal for road racers who want to use the gyrometer data for suspension adjustments · Perfect for drag racers who want G-loads and wheel stand data · GPS vehicle speed, heading and altitude logged for data analysis, lap comparisons
9
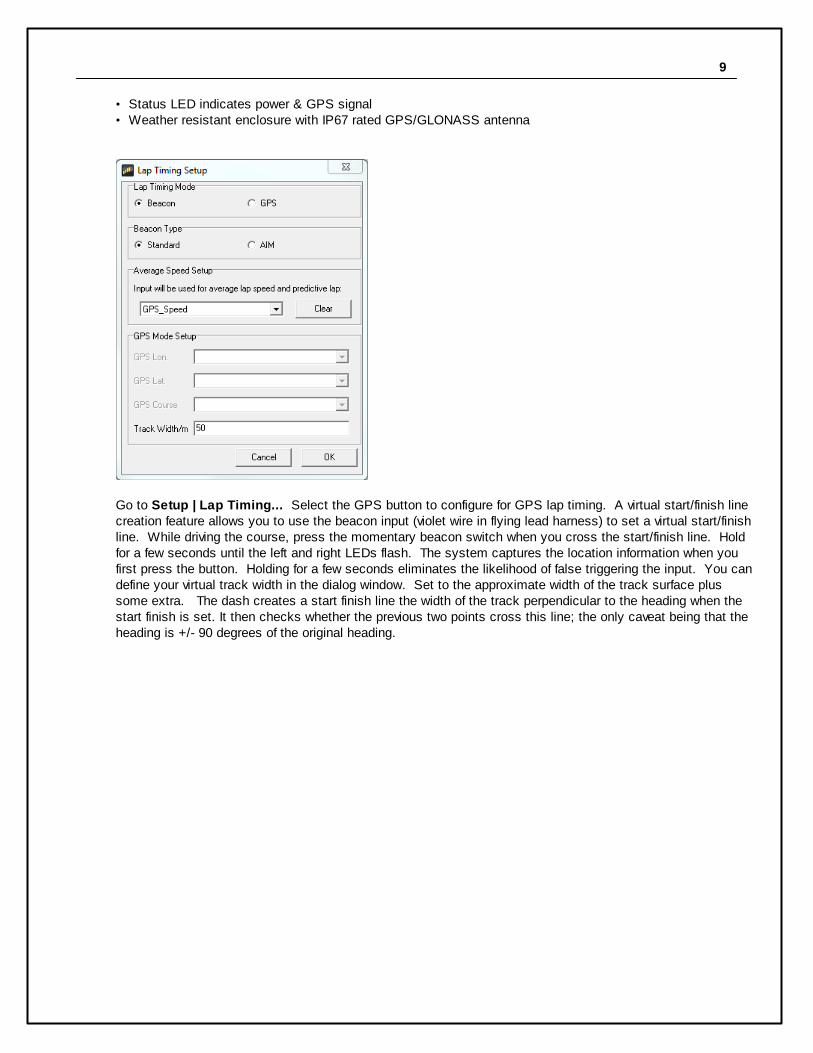
· Status LED indicates power & GPS signal · Weather resistant enclosure with IP67 rated GPS/GLONASS antenna
Go to Setup | Lap Timing... Select the GPS button to configure for GPS lap timing. A virtual start/finish linecreation feature allows you to use the beacon input (violet wire in flying lead harness) to set a virtual start/finishline. While driving the course, press the momentary beacon switch when you cross the start/finish line. Holdfor a few seconds until the left and right LEDs flash. The system captures the location information when youfirst press the button. Holding for a few seconds eliminates the likelihood of false triggering the input. You candefine your virtual track width in the dialog window. Set to the approximate width of the track surface plussome extra. The dash creates a start finish line the width of the track perpendicular to the heading when thestart finish is set. It then checks whether the previous two points cross this line; the only caveat being that theheading is +/- 90 degrees of the original heading.

10
Installation
The VDM is equipped with an AEMnet connector (power, ground, and CAN)so that it is a true plug and play experience when used with other AEMnetproducts such as the Infinity ECU.
Ideally, the VDM module should be installed near the center (both fore/aftand side-to-side) of the vehicle and as low as possible. For example, themodule may be mounted to the floor of the vehicle between the two frontseats. The module should be mounted using the provided "hook-and-loop"material or may be more rigidly mounted using fasteners through themodule's mounting ears. Take care to avoid over-torquing mountingfasteners, if used.
The antenna should be mounted in a location where the top is pointedtowards, and has a clear view of, the sky. The bottom of the antenna ismagnetic or additional hook-and-loop material is provided for mounting; thedashboard or rear package shelf are not acceptable locations. Theantenna should be mounted as high as possible in the center of a metalroof away from other antennas or structures. If the roof of the vehicle isnon-metallic then a flat piece of metal at least five inches in diameter, tofunction as a ground plane, should be fabricated upon which the antennashould be placed.
Status LED
There is a status LED located on the top of the VDM module that gives an indication of its operating status,specifically the quality of the current GPS signal:
LED Description
OFF The device is not powered
11
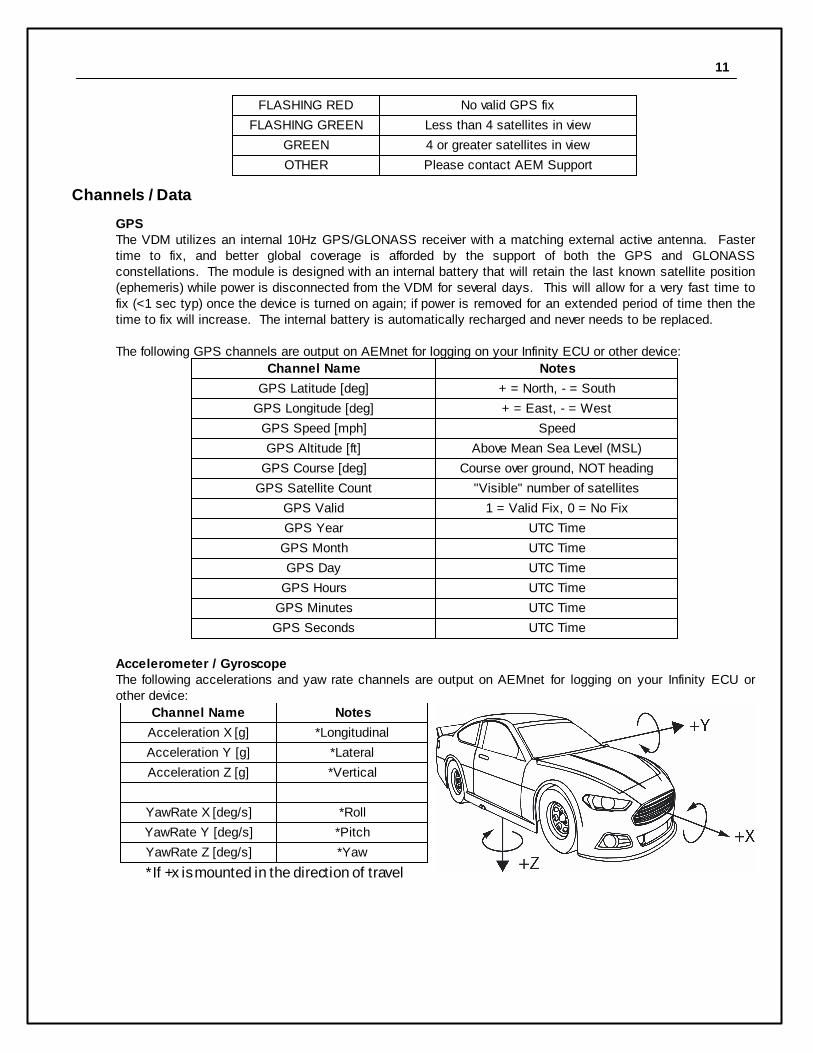
FLASHING RED No valid GPS fix
FLASHING GREEN Less than 4 satellites in view
GREEN 4 or greater satellites in view
OTHER Please contact AEM Support
Channels / Data
GPSThe VDM utilizes an internal 10Hz GPS/GLONASS receiver with a matching external active antenna. Fastertime to fix, and better global coverage is afforded by the support of both the GPS and GLONASSconstellations. The module is designed with an internal battery that will retain the last known satellite position(ephemeris) while power is disconnected from the VDM for several days. This will allow for a very fast time tofix (<1 sec typ) once the device is turned on again; if power is removed for an extended period of time then thetime to fix will increase. The internal battery is automatically recharged and never needs to be replaced.
The following GPS channels are output on AEMnet for logging on your Infinity ECU or other device:
Channel Name Notes
GPS Latitude [deg] + = North, - = South
GPS Longitude [deg] + = East, - = West
GPS Speed [mph] Speed
GPS Altitude [ft] Above Mean Sea Level (MSL)
GPS Course [deg] Course over ground, NOT heading
GPS Satellite Count "Visible" number of satellites
GPS Valid 1 = Valid Fix, 0 = No Fix
GPS Year UTC Time
GPS Month UTC Time
GPS Day UTC Time
GPS Hours UTC Time
GPS Minutes UTC Time
GPS Seconds UTC Time
Accelerometer / GyroscopeThe following accelerations and yaw rate channels are output on AEMnet for logging on your Infinity ECU orother device:
Channel Name Notes
Acceleration X [g] *Longitudinal
Acceleration Y [g] *Lateral
Acceleration Z [g] *Vertical
YawRate X [deg/s] *Roll
YawRate Y [deg/s] *Pitch
YawRate Z [deg/s] *Yaw
*If +x is mounted in the direction of travel

12
Air/Fuel Sensors and Devices to CD-7
The AEMNet CAN message transmission is enabled by default on the following devices. Refer to your harnessdocumentation to identify the CAN terminals.
30-03X0 X-Series UEGO30-4900 Wideband Failsafe30-4911 Flex Fuel Failsafe30-2340 4Ch UEGO
Series 2 EMS and EMS-4 to CD-7
The AEMNet CAN output must be enabled in your ECU before the CD-7 dash can receive messages. Select Wizards | Setup Wizard and choose Telemetry: AEMNet from the Wizard Types column. Left click on theConfiguration Name AEMNet Datastream and click the Apply button to enable.
Infinity to CD-7
The AEMNet CAN message transmission is enabled by default on Infinity ECUs. No additional software setupin your ECU calibration is required. Refer to your harness documentation or Infinity hardware specificationdocument to identify the CAN terminals.
OBDII Setups
AEM’s CD-7(L) with optional OBDII interface cable P/N 30-2217 puts multiple channels of data at yourfingertips by reading the CAN bus stream of your 2008+ model year vehicle’s OBD port and transmitting thosechannels to the CD-7 dash. To configure your dash for OBDII data display, the dash must first scan yourvehicle's OBDII port to identify all ECUs and available PIDs. PID stands for Parameter ID. These are codesused to request specific data from a vehicle. To begin the scan process, Launch AEM Dash Design and go to Tools | Scan Vehicle OBDII...
The OBDII Scan Wizard will launch to guide you through the process.

13
Be sure the dash is powered up and connect the USB cable between the dash and your PC.
Connect the OBDII connector to your vehicle's OBDII port then unplug the USB cable to begin the scan.

14
The dash will scan your vehicle and identify all available PIDs. When the scan is complete the message Reconnect USB cable to complete process will be displayed on the dash. The following window will bedisplayed in the Dash Design software.

15
Connect the USB cable to your PC.
The scan is complete. Click OK. You can now disconnect the USB cable. Your dash will reboot to completethe process.
Open the Setup Editor. OBDII PIDs will be automatically added to your list of available outputs. The circledexamples above represent the same PID from different vehicle ECUs. In these cases, the system will appenda suffix. E1 for ECU1, E2 for ECU2, etc. These outputs are now available for use as inputs to gauges for

16
display on your dash. To see a complete list of PIDs obtained from your vehicle, click on the CAN Receive taband choose to show Port 2. Port 2 is the default for OBDII messages.
This is a complete listing of available PIDs. An AEM supplied setup file for OBDII messages will be located inthe \Documents\AEM\DashDesign\Setups folder. The basic default OBDII file is named Default-Black-OBD2.aemcd7.
Editing Display Setups
The display setup file has the extension .aemcd7 and contains all the information needed to configure a colordisplay including connection definition, sensor calibration and screen layout.
Opening and Saving Setups
To Open an existing color display setup:
· Select File | Open.... The file open dialog is shown.· Select the required display setup file and click Open.
The last five files opened can be accessed by selecting File | Reopen followed by the appropriate file from thesub menu.
To save a setup under a new filename, select File | Save As...., enter a file name in the file save dialog andclick the Save button. To save a setup with the current name, select File | Save.

17
If a setup or AEM DashDesign is closed and the setup has changed since the last save, a prompt will appearasking if the changes to the setup are to be saved. Select Yes to save the changes, No to abandon thechanges or Cancel to return to editing the current setup.
Creating a New Display Setup
To create a new display setup:
· Select File | New · Select Setup | Display | CAN Receive
Default Display Setups
AEM supplied setup files will be located in the \Documents\AEM\DashDesign\Setups folder.
You can copy entire pages from another file. First, make sure the target page is open and selected and thatthe layout is unlocked.
Select: Edit | Paste Screen From Setup File
Select the file that contains the screen you want to copy. A window will open showing the six screens in thetarget file.

18
Select the screen you want to import by clicking on the screen name and Clicking OK.
Basic Editing of Default Setups
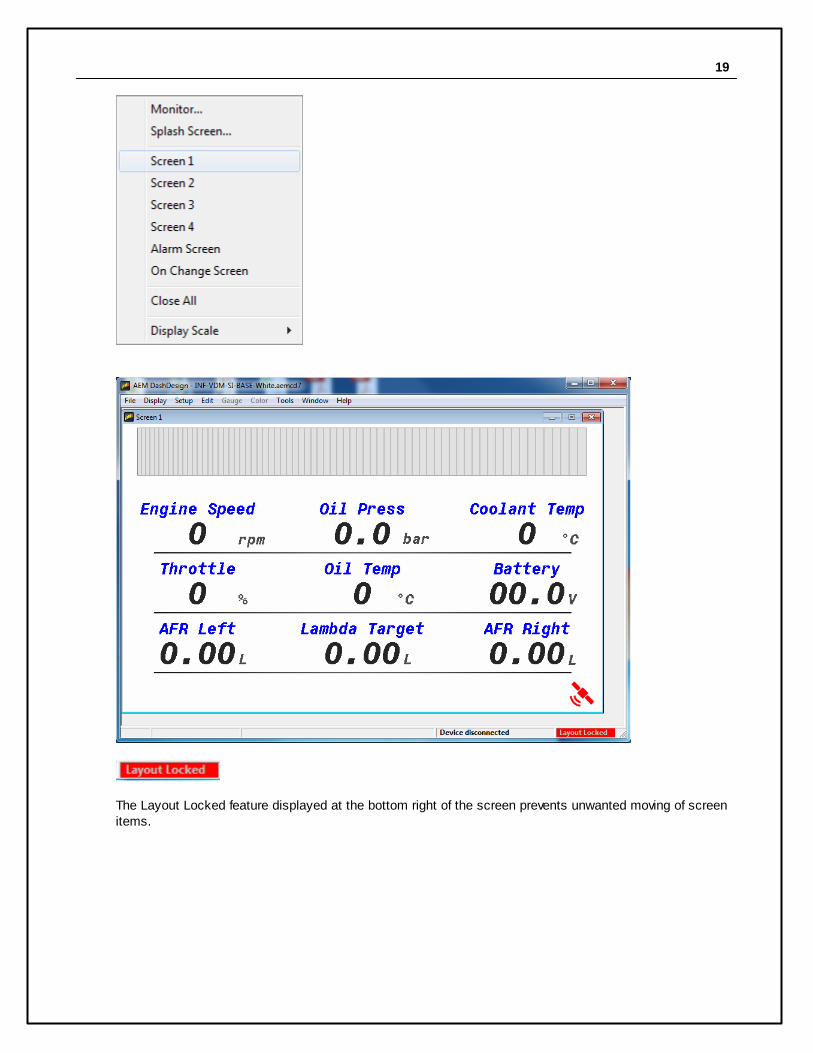
To view screens for editing go to Display | Screen X
19
The Layout Locked feature displayed at the bottom right of the screen prevents unwanted moving of screenitems.

20
The Layout Locked feature can be disabled by going to File | Lock Layout or by clicking the red LayoutLocked area of the screen. Caution as inadvertent clicks and drags can move items unintentionally. Somebasic editing of the default screens is possible even with the Layout Locked feature turned on. It is a good ideato leave the Layout Locked activated until you specifically need to move or delete a gauge. Having it onprevents you from accidentally moving a gauge or deleting one inadvertently. When the layout is locked, theediting icon menu is hidden.
Double clicking on the Engine Speed text label in the example above will display the available editing menu.
The dialog allows editing of all unlocked characteristics if Layout Locked is turned on. Locked characteristicsare typically related to size and position. To change the text displayed in the text label example above, simplyhighlight the text and edit. Double clicking on the "0" in the example above opens the value label editor. Thisis live data displayed on the screen.

21
Here you can change the input displayed at this location. Click on the drop down to view a list of availablechannels.
Uploading a Setup to a Display
Uploading a setup programs the current setup into the color display.
AEM DashDesign communicates with the AEM CD-7 / CD-7L via USB.
To upload a setup:
· Open a display setup.· Connect the AEM CD-7 / CD-7L to the PC using a USB cable. The AEM CD-7 / CD-7L will go into upload
mode and will show "USB cable connected"· Select File | Upload to display... or press Ctrl + U· A dialog box will appear indicating the setup is being sent· On the AEM CD-7 / CD-7L, the upload progress will be shown as a percentage. This progress percentage
IS NOT shown in the AEM DashDesign interface.· Once the setup has been received the flash will be erased; the AEM CD-7 / CD-7L will show "Erasing
flash". This process will take a few seconds.· Once the flash has been erased, it will be programmed; the AEM CD-7 / CD-7L will show the progress of
programming as a percentage. Do not remove the power to the display at this point.
· Once the programming has finished, an message will bedisplayed as shown in the example below. Unplug the USB cable to reboot the dash with the new setup. Do not disconnect the USB cable before this message is displayed.
22
The Display Editor
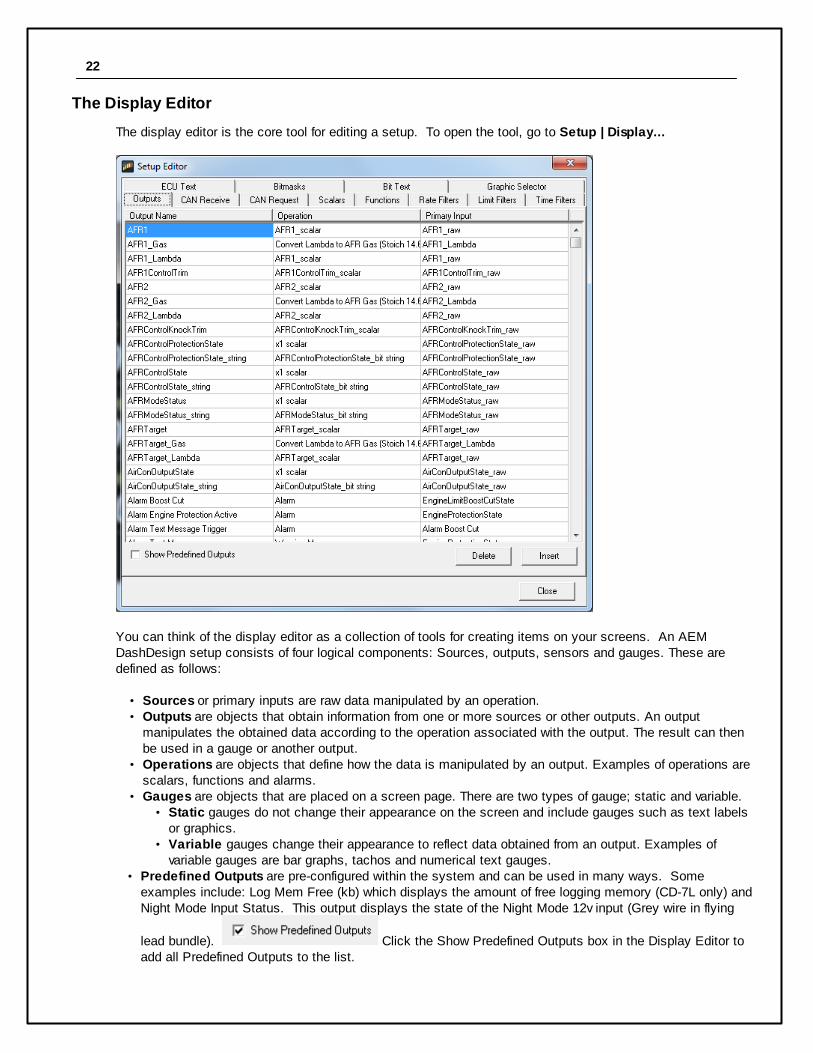
The display editor is the core tool for editing a setup. To open the tool, go to Setup | Display...
You can think of the display editor as a collection of tools for creating items on your screens. An AEMDashDesign setup consists of four logical components: Sources, outputs, sensors and gauges. These aredefined as follows:
· Sources or primary inputs are raw data manipulated by an operation.· Outputs are objects that obtain information from one or more sources or other outputs. An output
manipulates the obtained data according to the operation associated with the output. The result can thenbe used in a gauge or another output.
· Operations are objects that define how the data is manipulated by an output. Examples of operations arescalars, functions and alarms.
· Gauges are objects that are placed on a screen page. There are two types of gauge; static and variable.· Static gauges do not change their appearance on the screen and include gauges such as text labels
or graphics.· Variable gauges change their appearance to reflect data obtained from an output. Examples of
variable gauges are bar graphs, tachos and numerical text gauges.· Predefined Outputs are pre-configured within the system and can be used in many ways. Some
examples include: Log Mem Free (kb) which displays the amount of free logging memory (CD-7L only) andNight Mode Input Status. This output displays the state of the Night Mode 12v input (Grey wire in flying
lead bundle). Click the Show Predefined Outputs box in the Display Editor toadd all Predefined Outputs to the list.
23
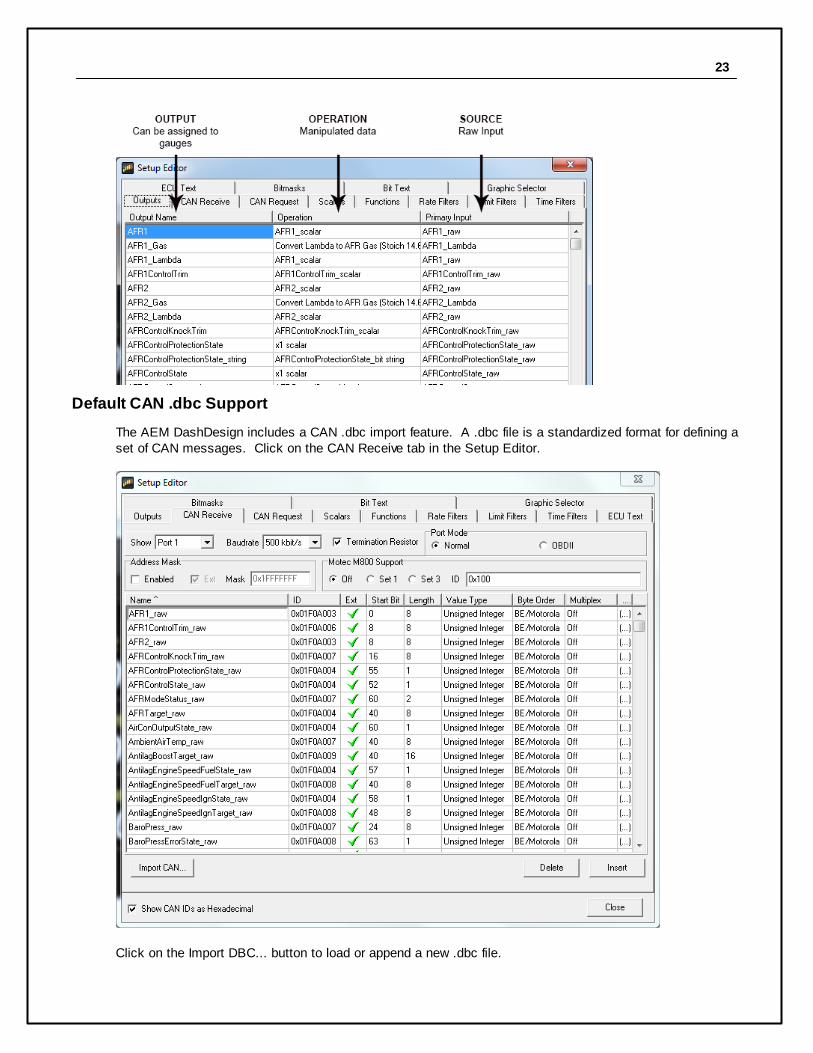
Default CAN .dbc Support
The AEM DashDesign includes a CAN .dbc import feature. A .dbc file is a standardized format for defining aset of CAN messages. Click on the CAN Receive tab in the Setup Editor.
Click on the Import DBC... button to load or append a new .dbc file.

24
Available .dbc files will be located in the \Documents\AEM\DashDesign\DBC folder. Selecting a file will openthe import dialog.
The levels can be expanded by clicking on the plus symbol.

25
Select the channels for import by clicking the boxes. All available channels are selected by default. Click theImport button to import. All CAN message information is automatically imported along with necessary Scalarand Bit text operations. The channels are now available for assignment.
Logging (CD-7L only)
AEM CD-7 / CD-7L has 200Mbytes of internal data logging memory and supports logging rates of up to 100Hz.Data is downloaded and analyzed with AEMData Analysis software.
To configure logging, select Setup | Logging to show the log setup window. Channels available to be loggedare shown on the left hand side. To log a channel, select the desired rate from the Log Rate column. Logging aspecific channel also automatically selects all other children and parent channels for logging at the same rate.
AEM CD-7 / CD-7L inserts markers in the data to indicate various states and these are displayed in AEMData.The following markers may be inserted by AEM CD-7 / CD-7L:
· Lap - This is inserted when the beacon input is triggered and is typically used for lap timing.· Power - This is inserted when the display is configured to start logging immediately on power up.· Log Start - This is inserted when the log start condition is met after power up· Overrun - The display has been unable to write the log data to the memory in the time available. Either
reduce the number of logged channels or reduce the complexity of the display screen.
Log start/stop conditions
The logging can be started or stopped dependent on channel conditions. Every time a new log is started, a newLog Run is created in the logger. Log runs can be downloaded individually with AEMData which reduces thetime taken to download the data.
The log can be started in one of three ways:
· Single input start/stop - When the specified input is non zero, the log will be started. When zero, thelog will be stopped. For example, if the channel EngineSpeed is used as the trigger, the logger will loganytime the engine is running.
· Twin start/stop triggers - When the Start trigger is non zero, the log will be started. When the Stoptrigger is non zero, the log will be stopped.
· Log Always - The logging starts logging immediately on power on and will log until switched off or untilthe log is full.

26
Special Logger Outputs
Enabling logger adds the following special outputs:
· Log Mem Total - The total logging memory in kilobytes· Log Mem Free - The amount of logging memory remaining in kilobytes· Log Mem Percent Free - The percentage of logging memory free.· Log Status - A channel representing the current logging status:
The Log Status text has the following meaning:
· Logging not Supported - This firmware does not support logging.· Logging stopped - The device is not currently logging.· Logging running - The device is currently logging.· Log looped - The log has looped.· Log memory space low - There is less than 5% of the log memory remaining.· Log memory full - The logging memory is full and logging has stopped.· Log initialising - The logger is currently processing the setup.· LOG SETUP ERROR - There is a problem with the logger setup.· LOG OVERRUN - The logger has been unable to write the log data to the memory. Either reduce the
number of logged channels or reduce the complexity of the display screen.· Log memory worn - There are a significant number of bad blocks in the flash memory. Logging will
continue to work but capacity will be reduced.
Downloading Log Files
To download log files from an AEM CD-7L, connect the USB cable between the dash and your PC. LaunchAEMData analysis software and turn on the switched ignition power to the Dash. The message below will bedisplayed when AEMData detects a connection to the dash.

27
Go to Logger | Download Log
If there are logs saved on the dash, a list similar to the one below will be presented. Select the files todownload. Choose whether to erase the files from the dash or not.
Setting the Internal Clock
· Connect the color display to your PC using the USB link..· Select Tools | Set Time and Date in Display. · The system will synchronize the time and date to match the PC.
Updating Color Display Firmware
As part of the continuing development process, from time to time new versions of the AEM CD-7 / CD-7Lfirmware will be released with new DashDesign installers. To upload the new firmware:
· Firmware files are installed to the \Documents\AEM\DashDesign\Firmware folder.· Connect the color display to your PC using the USB link..· Select Tools | Upload Firmware. Select the firmware (.bin) file from the location above. · The upload process starts. Do not switch the display off during the upload process as this may corrupt the
firmware.· Once the upload process has finished, unplug the USB cable to reboot the display.
28
The Setup Editor
The AEM DashDesign Setup Editor is used to configure the non-visual objects of a setup i.e. Outputs andOperations. Some outputs use more than one input depending on the operation used. The setup editor isaccessed by selecting Setup | Display....
Each page of the editor has Insert and Delete buttons which are used to insert or delete an item in that tab.The following sections describe the various operation types available and how they are used to make an output.
Outputs
Outputs are values, texts or graphics that are used by gauges or other outputs. The output that it passes isdetermined by the operation that it uses.
To set up a new output:
· Click the Insert button in the Outputs tab.· Enter the name of the new output. This should describe what the output actually generates.· Select the operation to be used by the output from the drop-down list.· Select the input from the drop down list.
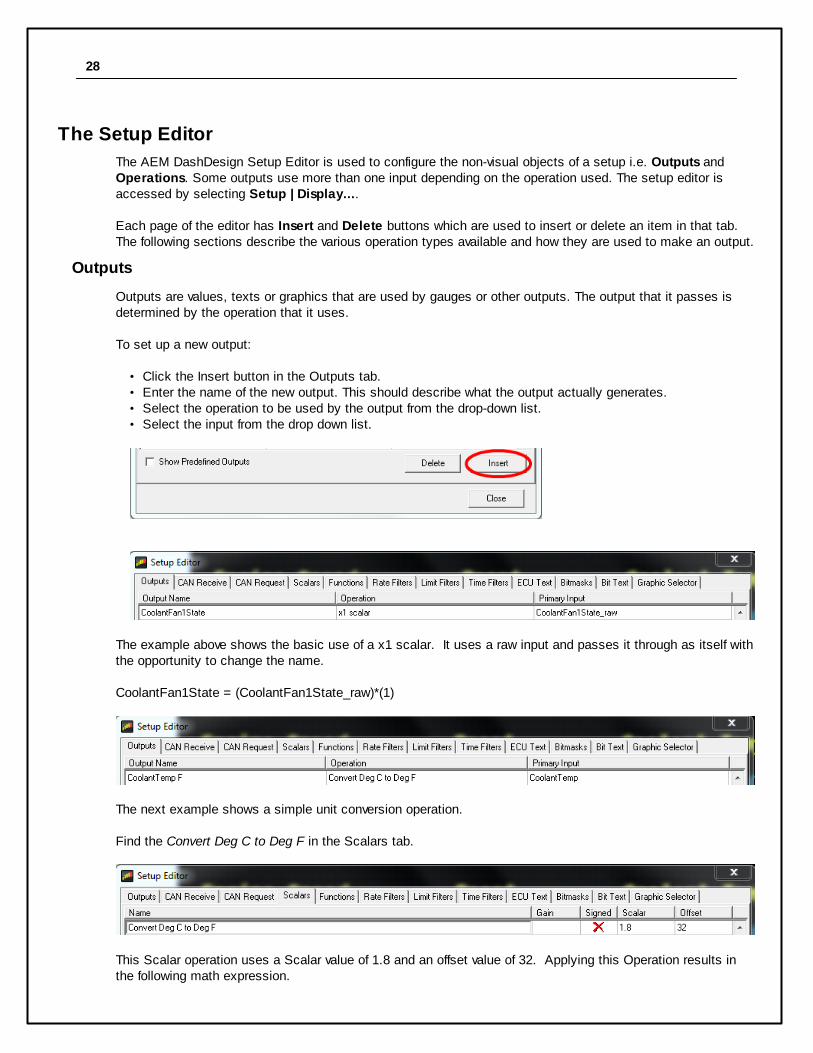
The example above shows the basic use of a x1 scalar. It uses a raw input and passes it through as itself withthe opportunity to change the name.
CoolantFan1State = (CoolantFan1State_raw)*(1)
The next example shows a simple unit conversion operation.
Find the Convert Deg C to Deg F in the Scalars tab.
This Scalar operation uses a Scalar value of 1.8 and an offset value of 32. Applying this Operation results inthe following math expression.
29
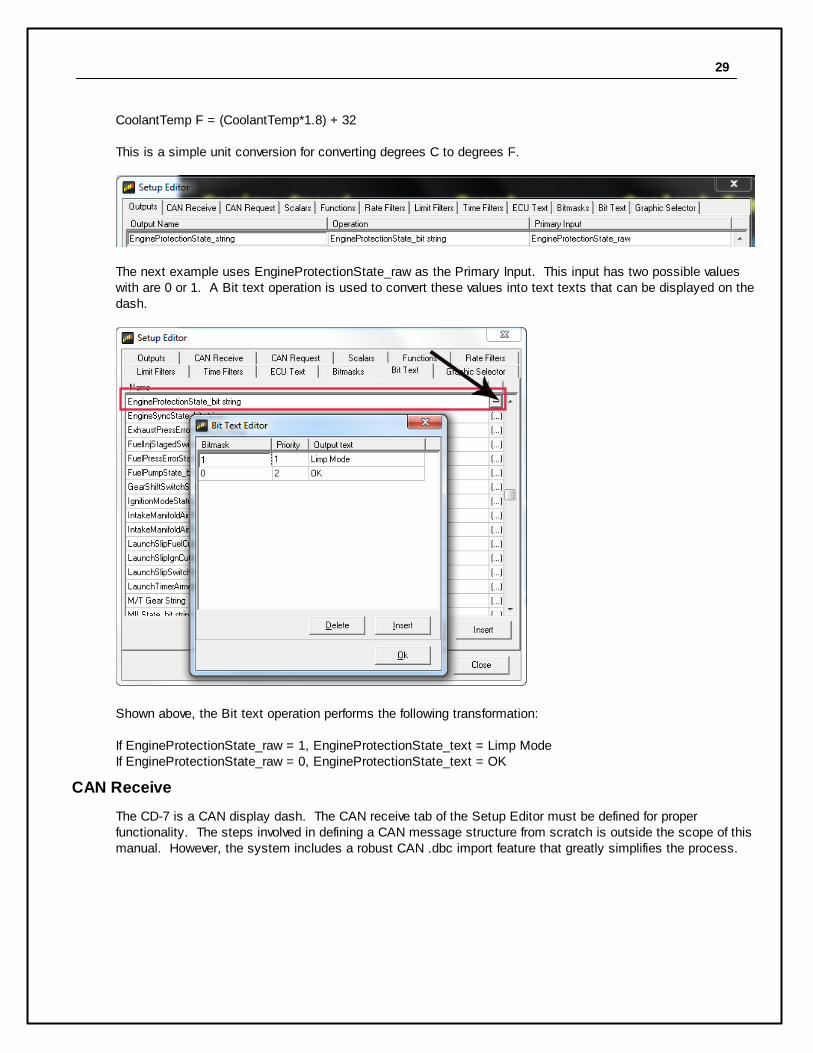
CoolantTemp F = (CoolantTemp*1.8) + 32
This is a simple unit conversion for converting degrees C to degrees F.
The next example uses EngineProtectionState_raw as the Primary Input. This input has two possible valueswith are 0 or 1. A Bit text operation is used to convert these values into text texts that can be displayed on thedash.
Shown above, the Bit text operation performs the following transformation:
If EngineProtectionState_raw = 1, EngineProtectionState_text = Limp ModeIf EngineProtectionState_raw = 0, EngineProtectionState_text = OK
CAN Receive
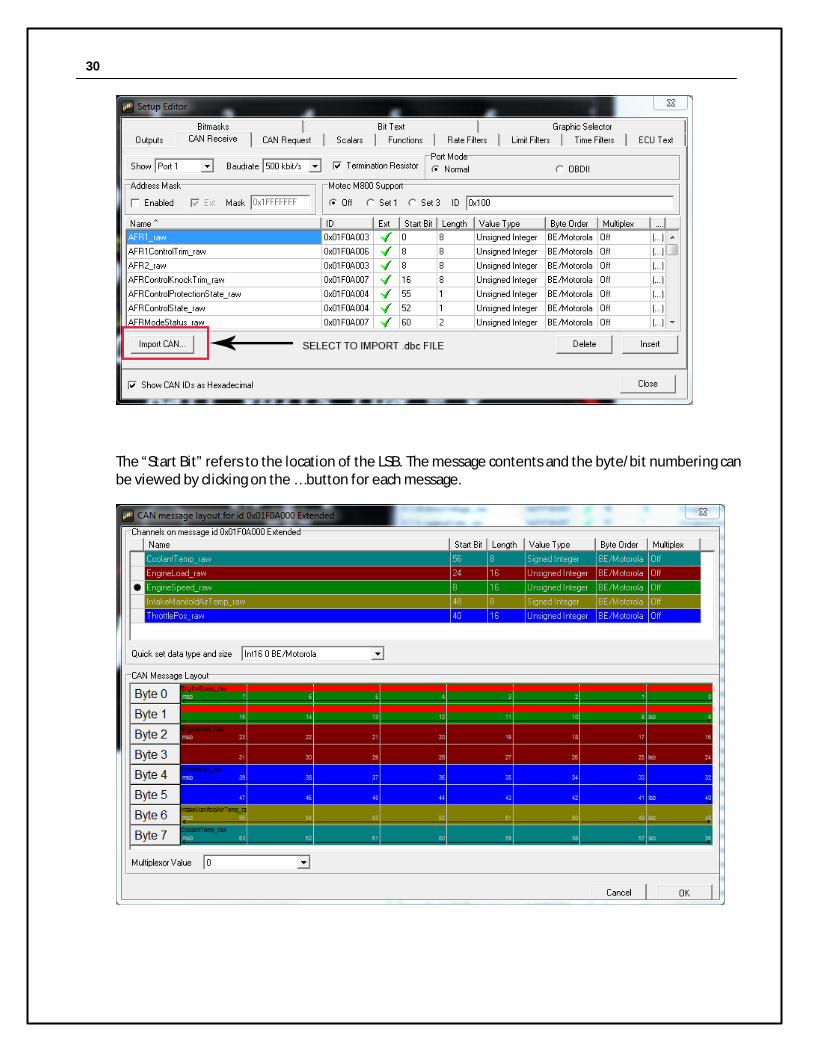
The CD-7 is a CAN display dash. The CAN receive tab of the Setup Editor must be defined for properfunctionality. The steps involved in defining a CAN message structure from scratch is outside the scope of thismanual. However, the system includes a robust CAN .dbc import feature that greatly simplifies the process.
30
The “Start Bit” refers to the location of the LSB. The message contents and the byte/bit numbering canbe viewed by clicking on the … button for each message.
31
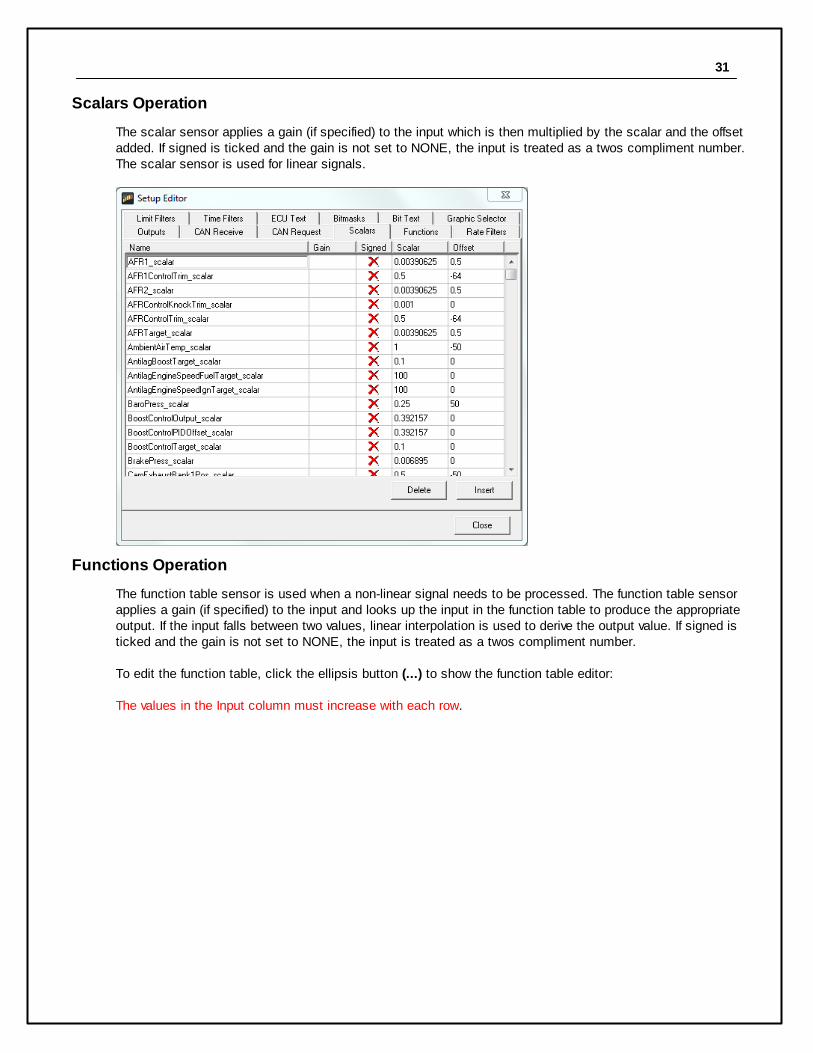
Scalars Operation
The scalar sensor applies a gain (if specified) to the input which is then multiplied by the scalar and the offsetadded. If signed is ticked and the gain is not set to NONE, the input is treated as a twos compliment number.The scalar sensor is used for linear signals.
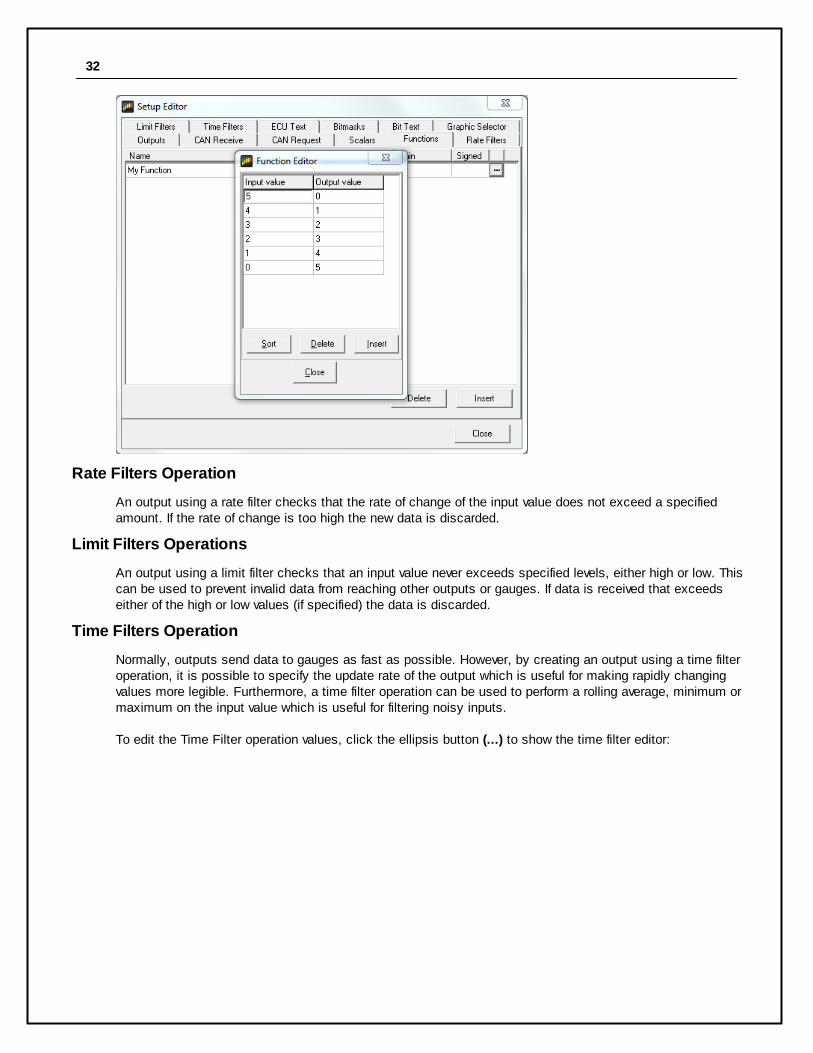
Functions Operation
The function table sensor is used when a non-linear signal needs to be processed. The function table sensorapplies a gain (if specified) to the input and looks up the input in the function table to produce the appropriateoutput. If the input falls between two values, linear interpolation is used to derive the output value. If signed isticked and the gain is not set to NONE, the input is treated as a twos compliment number.
To edit the function table, click the ellipsis button (...) to show the function table editor:
The values in the Input column must increase with each row.
32
Rate Filters Operation
An output using a rate filter checks that the rate of change of the input value does not exceed a specifiedamount. If the rate of change is too high the new data is discarded.
Limit Filters Operations
An output using a limit filter checks that an input value never exceeds specified levels, either high or low. Thiscan be used to prevent invalid data from reaching other outputs or gauges. If data is received that exceedseither of the high or low values (if specified) the data is discarded.
Time Filters Operation
Normally, outputs send data to gauges as fast as possible. However, by creating an output using a time filteroperation, it is possible to specify the update rate of the output which is useful for making rapidly changingvalues more legible. Furthermore, a time filter operation can be used to perform a rolling average, minimum ormaximum on the input value which is useful for filtering noisy inputs.
To edit the Time Filter operation values, click the ellipsis button (...) to show the time filter editor:

33
The Time Filter parameters have the following meanings:
· Update period: Specifies the rate at which values are sent to outputs and gauges used by this output.For example, if the Update Period is set at 1000, a gauge displaying the value from this output will updateonce per second. If 0 is specified, the output will update as fast as possible.
· Rolling period: Specifies the time period over which the rolling function is calculated. If zero is specified,the rolling period is set to the update period.
· Rolling function: Specifies how the value produced from the output is calculated:· Maximum: The output is the maximum value occurring during the last (rolling period) milliseconds.· Minimum: The output is the minimum value occurring during the last (rolling period) milliseconds.· Average: The output is the average of all values occurring during the last (rolling period) milliseconds.· Current: The output is the last received value. This effectively disables the rolling period function.
ECU Text Operation
An output using an ECU Text operation is used to obtain text (such as a calibration name) from the connectedECU. The length of the text to obtain is specified in the length column.
Bitmasks Operation
The bitmask operation is used to mask off bits from a raw (32 bit) input. This is useful when data is receivedfrom the ECU that contains information for two different outputs. For example, the lower 4 bits of a value maybe used to determine gear position while the upper 4 bits determine diff mode. The bitmask is specified as thesum of all the bits being masked.
Bit Text Operation
When an input has bits that are set dependant upon a mode in the ECU, it can be useful to convert this into atext text output. The bit text operation takes the input and compares it with defined bitmasks. The bitmasksare compared in order of priority until the masked input is set or no more bitmasks are defined. If a maskedinput is set, the corresponding output text is passed out of the sensor. If no bitmask matches the input anempty output text is passed.

34
To create a bit text operation, add a name for the operation in the Bit text tab and click on the (...) button toshow the bit text editor:
The priority determines the order in which the bitmasks are evaluated with low numbers being a higher priority.This ensures that if two bitmasks match, only the highest priority output text is returned from the sensor.
Graphic Selector Operation
The graphic selector operation is used to show different graphics depending on the value of an input. To createa graphic selector operation, add a name for the sensor in the graphic Sel tab and click on the (...) button toshow the graphic selector editor:

35
The graphic selection count is the number of graphics used in the sensor and is at least two. The first graphicis shown by default. Subsequent graphics are shown according to the settings in the graphic Selections box.
· Index - The number of the selection graphic for which the following settings are made. For example, if theselection count is set to 3, 1 will specify the first selectable graphic and 2 will specify the secondselectable graphic.
· Value - When the input (specified in the output) is equal to this value, this graphic is shown instead of thedefault graphic.
· Enable Blink - If checked, this graphic will blink according to the On Time and Off Time in seconds. Thegraphic swaps between the indexed graphic and the default graphic.
· Enable Max Duration - If checked, the graphic is only be shown for the specified duration no matter howlong the input is equal to the value.
Alarm Operation
To create a new Alarm output, push the Insert button in the Outputs tab of the Setup Editor.
Assign the output a new name and choose Alarm from the dropdown list of available Operations. Push the button under the Primary Input column for the new Alarm Output. This will open the Alarm Output Setupwindow. The new name will automatically be added to the Alarm Output Name box.
36
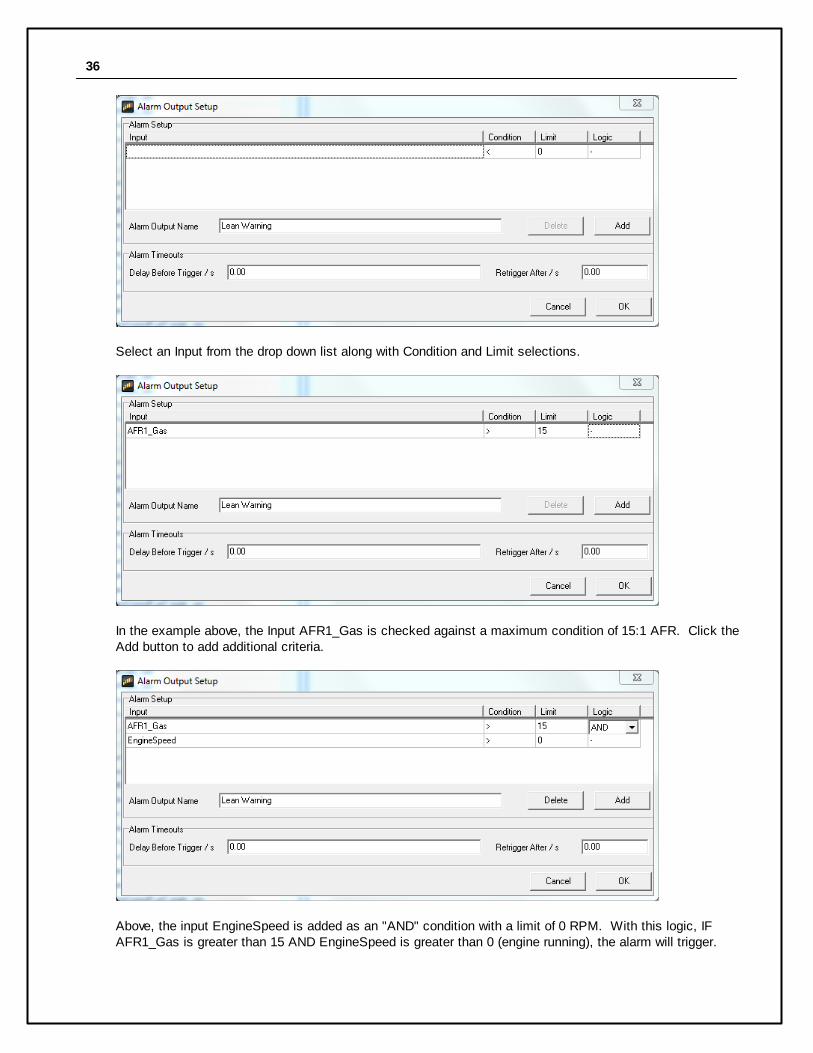
Select an Input from the drop down list along with Condition and Limit selections.
In the example above, the Input AFR1_Gas is checked against a maximum condition of 15:1 AFR. Click theAdd button to add additional criteria.
Above, the input EngineSpeed is added as an "AND" condition with a limit of 0 RPM. With this logic, IFAFR1_Gas is greater than 15 AND EngineSpeed is greater than 0 (engine running), the alarm will trigger.

37
The Retrigger value specifies a timeout in seconds after which the alarm (if still triggered) will toggle tountriggered and back to triggered. This is useful for when an alarm has been used to trigger a page change,usually showing a warning to the driver, for example, low oil pressure. The driver can select the standard pageagain to cancel the alarm. If the oil pressure is still low after the specified period, then the warning page will beshown again.
If the retrigger value is set to zero, then the alarm will only retrigger if the input conditions change to false andback to true again.
The logical expressions are evaluated from top to bottom and the running result of the logical test is used asthe input for the next logical evaluation.
Warning Message Operation
An output using a warning message operation is used to output warning messages when inputs are outside ofthe normal operating range.
· The warning input typically uses an output defined with an alarm operation. If the value of the output is non-zero, the associated warning message will be displayed.
· The label input is optional and is used to provide a value to be shown in the warning message.
The example above shows two existing Warning Inputs. These were both previously defined as Alarm outputsbefore setting up this window.
The Warning Editor message is entered in the Warning Label column. When an '@' symbol is inserted into thewarning label a formatted input value from the label input replaces it in the display. The Label Input defines thedata that replaces the '@' symbol. The input label format column allows the format of the value from the labelinput to be defined. For full details on value formatting, see Value Formatting in the gauge reference section.
If all the warning inputs are zero, the output text is empty. If only one warning input is non-zero, the appropriatewarning is displayed. If multiple warning inputs are non-zero, the appropriate warning labels are displayed inturn, with each one being displayed for around a second.

38
The On Time, Off Time and Min On Time can be used to affect how the warning is displayed when only onewarning is active and are scaled in milliseconds. For example, to have a single message flash at 2Hz, set theOn Time to 1000 and the Off Time to 1000. Setting the Off Time to 0 disables flashing.
The Min On Time can be used to ensure a warning is visible even if it is only briefly triggered. For example, alow oil pressure alarm triggered during cornering may only occur for a fraction of a second but by setting theMin On Time to 2000 ensures that the message is displayed for 2 seconds and so is more likely to be seen.
Odometer and Turn Blinkers
AEM CD-7 / CD-7L has a built in odometer function. This is an internal counter backed up to non-volatilememory that cannot be reset (it is set to zero when the unit is built).
To set up the odometer, choose Setup | Odometer. Select an output that is road speed km per second. AEMDashDesign will automatically create an output called ODOMETER which is scaled in km and can bedisplayed on the screen.
All AEM base setups include an odometer scaled in both miles and kilometers.
An optional turn blinkers feature is available on some AEM supplied setups. Pins 11 and 12 can be used forLEFT TURN and RIGHT TURN blinkers respectively. When these inputs are grounded, the turn blinkers willactivate.

39
Lap Timing and Track Mapping
The following channels are used for lap timing and track mapping.
Most AEM default setups include a lap timing screen. The VDM for GPS speed and lap timing sectiondescribes the basic setup and configuration of a GPS input for speed and position. Once configured, thescreen will update with current data as the laps progress.
Lap Timing channels available include:
· Fastest lap number· Fastest lap time
40
· Fastest lap average speed· Fastest lap time delta (your current lap compared to the fastest lap)· Last lap number· Last lap time· Last lap average speed· Last lap time delta (your current lap compared to the last lap)· Current lap number· Current lap time
Go to Setup | Lap Timing... Select the GPS button to configure for GPS lap timing. A virtual start/finish linecreation feature allows you to use the beacon input (violet wire in flying lead harness) to set a virtual start/finishline. While driving the course, press the momentary beacon switch when you cross the start/finish line. Holdfor a few seconds until the left and right LEDs flash. The system captures the location information when youfirst press the button. Holding for a few seconds eliminates the likelihood of false triggering the input. You candefine your virtual track width in the dialog window. Set to the approximate width of the track surface plussome extra. The dash creates a start finish line the width of the Track Width/m setting perpendicular to theheading when the start finish is set. It then checks whether the previous two points cross this line; the onlycaveat being that the heading is +/- 90 degrees of the original heading. The GPS start/finish reference and fastest lap data is saved to non volatile memory in case the vehicle power isinterrupted during operation.
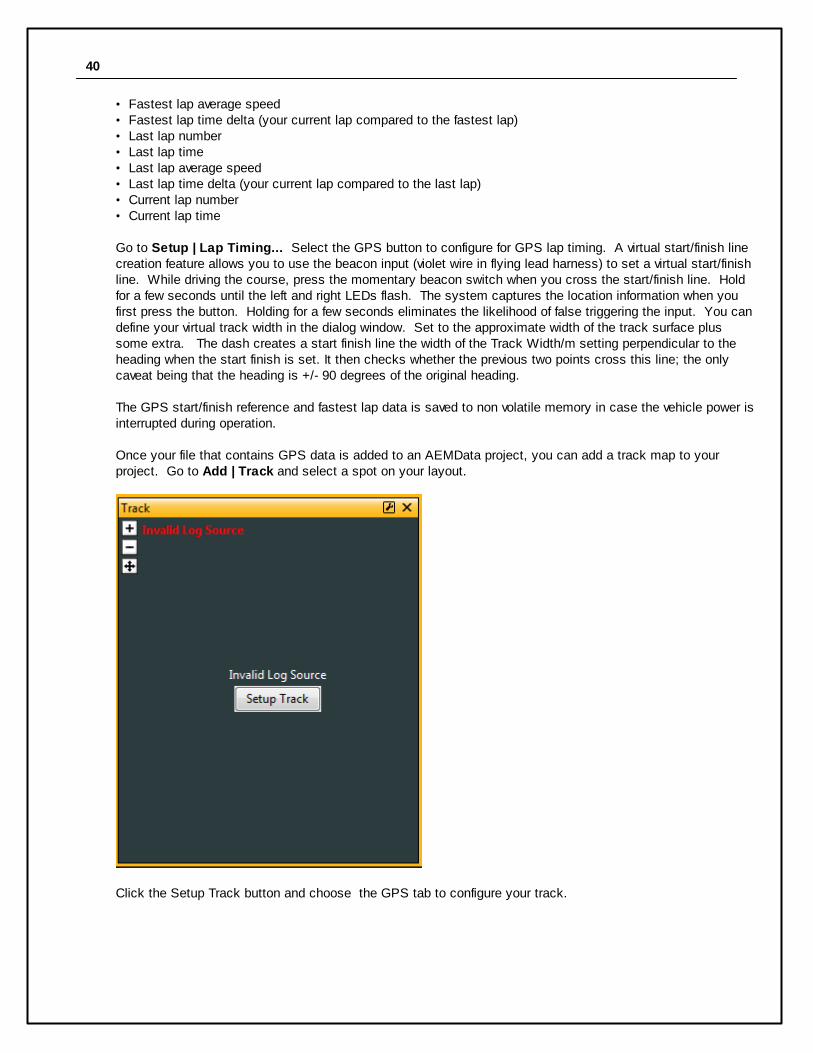
Once your file that contains GPS data is added to an AEMData project, you can add a track map to yourproject. Go to Add | Track and select a spot on your layout.
Click the Setup Track button and choose the GPS tab to configure your track.

41
More details on Track Editing can be found in the AEMData documentation.
CD-7 & CD-7L Settings

42
The Settings dialog will be populated correctly with all AEM supplied setup files. The options can be changedfor custom setups. Night mode dialog box should be empty unless you want to control the mode via CAN. Default is empty and controlled by the flying lead harness input.
Shift Lights & LEDs
The LED and shift light setup will be pre-configured with AEM supplied setup files. The Alarm outputs used totrigger the LEDs can be adjusted in the Setup Editor as shown in the example below.

43
Alarm Page
AEM setups will come pre-configured with many optional Alarm outputs. Choose the ones you want to triggerthe Alarm Page.
On Change Page
The On Change Page allows you to setup a custom page that will be displayed when any changes aredetected on selected channels. The list of available channels will be displayed at the left. Double click orpress the space bar to move them to the right Selected Channels list.

44
The example below shows one version of an AEM supplied On Change Page. Different operating modes and/ormulti-map selections can be displayed using this page. Other useful items are boost target and tractioncontrols set points.
Brightness
The Brightness setup dialog allows you to choose two different brightness settings for both the screen andLEDs. See CD-7 Harness and Wiring section for Night Mode input wiring. 100% should only be used in directsunlight. 70% gives almost as much brightness without overdriving the backlight. 5%-10% is appropriate fornight mode.
Display Screens
The AEM CD-7 / CD-7L supports 6 screen pages. The display also has a monitor list which enables permanentmonitoring of data and a splash screen that appears when the display starts.
Display Scaling
By default, AEM DashDesign displays the screens at actual screen size (100%). For example, if the screensize of the hardware is 800x480 pixels, then the screen editor windows will also be 800x480. Editing in thismode provides a true what you see is what you get editing experience.

45
However, it is possible to show the editor windows at different scalings by selecting and appropriate value fromthe Display | Display Scale menu. Supported scales are 75%, 100% (default), 125%, 150%, 175% and 200%.
The Monitor Screen
Normally a given output is only monitored if used by a gauge on the currently displayed screen. In certaincircumstances however, it is necessary to monitor some outputs irrespective of whether or not they are usedby the currently displayed screen page. For example, if the maximum coolant temperature is required as anoutput for some screens, switching screens deletes the output as the screen changes and recreates it ifnecessary. The maximum output is then be reset and its' information is lost. By adding this output to themonitor page it is created when the color display is switched on. Changing screens has no effect on the outputand the data is not reset unless a reset signal is received.
Furthermore, outputs added to the monitor screen are automatically stored in non-volatile memory. Thus, thevalue of a min, max or average output added to the monitor screen is preserved even when the screen ispowered off.
Select Display | Monitor to view the monitor screen setup. Add the outputs to be continuously monitored tothe list.
The Splash Screen
The splash screen is a special screen that is shown for a set period when the display starts; for showing ateam logo for example.
To design the splash screen, go to Display | Splash Screen and design the screen layout as normal. Typically,this will just be a logo but other static values (such as the serial number or version details) will work as well.
Setting Screen and Default Colors
The color menu allows the default colors to be specified. These are used whenever a new gauge is added to ascreen. The default colors can be overridden in the individual gauge properties.
· Screen – Sets the background color of the current screen.· Warning – Default color of a warning bar when it is triggered.

46
· Gauge Background – Default background color of a gauge.· Gauge Line – Default line color of a gauge used in drawing the outline.· Gauge Fill – Default fill color of a gauge used in bars.· Gauge Text – Default text color of a gauge.
Adding a Gauge
Once a screen page is open, it is possible to add gauges to the screen. To add a gauge:
· Select the gauge required from the Gauge menu or the tool bar.· Click on the area of the screen the gauge is to be added to and whilst holding the mouse button down drag
a box to the size required for the gauge.· On releasing the mouse button, the gauge will be added to the screen.
Most gauges can be added from the tool bar:
Selecting a Gauge
A gauge is selected using either the mouse or keyboard. To select a gauge using the mouse, move the cursorover the gauge. If gauges are overlapping the topmost gauge is selected. Try moving the mouse to an areawhere the gauge to select is not covered by another gauge. Alternatively, use the keyboard. To select a gaugeusing the keyboard press the tab key repeatedly until the appropriate gauge is selected. When a gauge isselected a border appears around it.
Moving a Gauge
A gauge can be moved using either the mouse or the edit window. To move a gauge using the mouse:
· Select the gauge with the mouse.
· When the cursor appears as a pointing hand click and drag the gauge to the required position.
To move a gauge using the edit window:
· Show the Gauge Property window by right clicking on the selected gauge or by selecting it from the Editmenu.
· Change the values of the x position and y position properties to appropriate values.
This is particularly useful in aligning different gauges.
Resizing a Gauge
A gauge can be resized using either the mouse or the edit window. To resize a gauge using the mouse:
· Select the gauge with the mouse.

47
· Move the cursor to the border of the gauge which requires resizing. The pointing hand cursor changes to asizing cursor depending on the position:· If the cursor is at the top left or bottom right corner of the gauge the cursor changes to a NW-SE cursor
and is resized by dragging that corner.· If the cursor is at the top right or bottom left corner of the gauge the cursor changes to a NE-SW cursor
and is resized by dragging that corner.
· If the cursor is at the top or bottom edge of the gauge the cursor changes to a N-S cursor and isresized by dragging that side.
· If the cursor is at the left or right edge of the gauge the cursor changes to an E-W cursor and isresized by dragging that side
To resize a gauge using the edit window:
· Show the Gauge Property window by right clicking on the selected gauge or by selecting it from the Editmenu.
· Change the values of the x size and y size properties to appropriate values.
This is useful in making different gauges the same size.
Deleting a Gauge
To delete a gauge:
· Select the gauge.· Press the Delete key.
Editing Gauge Properties
The gauge property editor is used to change the settings of an individual gauge. The gauge property editor isshown using either the mouse or Edit menu. Using the mouse:
· Select the gauge.· Click the right mouse button.
To edit a gauge using the menu:
· From the Edit menu, select the name of the gauge to edit.
The gauge property editor is specific to the type of gauge being edited. See the Gauge Reference section forfull details.
Using Copy and Paste
The copy and paste feature is used to copy gauges or entire screens between screen pages or setup files.
· Edit | Copy | Gauge copies the currently selected gauge into the paste buffer.· Edit | Copy | Screen copies the current screen into the paste buffer.· Edit | Paste | Gauge pastes the last gauge copied into the paste buffer into the current screen.· Edit | Paste | Screen pastes the last screen copied into the paste buffer into the current screen. Any
gauges already present on the current screen will be removed.
To paste a gauge or screen into a different setup file, copy it, close the file, open the appropriate setup file andscreen and paste.

48
Setting the Gauge Z Order
When a page is rendered in the display, the gauges are drawn in the order in which they were added to thescreen in the editor.
When gauges are placed on top of other gauges, it can be useful to change the order in which the gauges aredrawn (the Z order). For example, if an alarm bar is added over a value gauge, only the alarm bar will be visible.By changing the Z order so that the value gauge is drawn after the alarm bar, the value gauge will appear drawnon the alarm bar.
To change the Z order on a page, select Edit | Z Order... or press Ctrl Z. The Z order editor will be shown. Tochange the order of a gauge, select it from the list (it will be simultaneously highlighted in the screen editor)and use the up and down cursor keys or the up down buttons to move the gauge within the list. gaugestowards the top of the list are drawn first (behind other gauges). Gauges towards the bottom of the list aredrawn last (in front of other gauges).
Click OK to commit the changes or cancel to quit the Z Order editor.
Gauge Reference
Gauges are the visual elements of a AEM DashDesign screen page. The various different gauge types availablein AEM DashDesign are described in this section.
Standard Gauge Properties
Most gauges share a standard set of gauge properties described below. In addition to these standardproperties, many gauges have additional properties that are described in their relevant section.
The standard gauge properties are as follows:
· Name - The name is used to identify the gauge in the Edit menu. AEM DashDesign assigns a name to anew gauge automatically although it is useful to give gauges more meaningful names as it makes themeasier to identify in the Edit menu.
· Input - The output used by the gauge.· Minimum - The value at which a gauge starts, for example the start value of a bar gauge.· Maximum - The value at which a gauge finishes, for example the end value of a bar gauge.· Graticule Size - Graticules or divisions are drawn at this frequency.· Label Frequency - Labels are drawn at every Label Frequency number of graticules.· Label Font - The font used by the gauge.· Label Font Size - The font size used by the gauge.· Label Format - Determines how numbers are formatted in the gauge. See the Value Formatting section
for more information.· X Position - The left most position of the gauge.· Y Position - The top most position of the gauge.· X Size - The width of the gauge.· Y Size - The height of the gauge.· Background color - color of the gauge background.· Line color - color of the graticules and outline of the gauge.· Fill color - color in which to draw a filled part of the gauge, for example the part of a bar graph that has
data.· Text color - color of all text in the gauge.
Value Formatting
Many gauges can use a Label Format property in order to control how values are displayed. The followingtable shows the standard formatting characters that can be used.

49
Character Description NotesX or x Display in hexadecimal Must be first character in formatB or b Display in binary Must be first character in format
- Force leading sign character e.g. +5.3 is displayed instead of 5.3# Indicates an optional digit e.g. ### gives 939 Indicates a required digit e.g. 999 gives 0935 Indicates rounding to the nearest 5 e.g. ##5# gives 2450 instead of 24480 Indicates rounding to the nearest 10 e.g. ##0# gives 2400 instead of 2448. Indicates position of decimal place
Gauges using time outputs use a different set of format texts:
· H - Displays the hours in 24 hour format.· h - Displays the hours in 12 hour format.· m - Displays the minutes.· s - Displays the seconds.· f - Displays tenths of seconds.· ff - Displays hundredths of seconds.· fff - Displays thousandths of seconds (only works for lap time via CAN).· y - Displays the date in dd-mm-yy format· z - Displays the date with text for the month, eg 01 Jan 09
Thus, the following formats would display the time in the following manner:
· Hms - 24:00:00· hmsf - 12:00:00.0· hmsff - 12:00:00.00· y - 01-01-09· hmsz - 12:00:00 01 Jan 09
System information can be shown by adding a value gauge to the screen and setting the Label Formatproperty as follows:
· vV - Shows the version of the color display firmware.· vs - Shows the serial number of the display.· vu - Shows the usage (on time) of the display in hours.· vr - Shows the reset counter - the number of power on events since the last setup upload.· vc - Shows the filename of the setup file used to program the display (up to 24 characters).
Bar Gauges
There are four types of bar gauge - rectangle and triangle shaped bars in either horizontal or vertical orientation.A bar contains a number of graticules that divide the bar up between the minimum and maximum limits asshown in the diagram below:
50
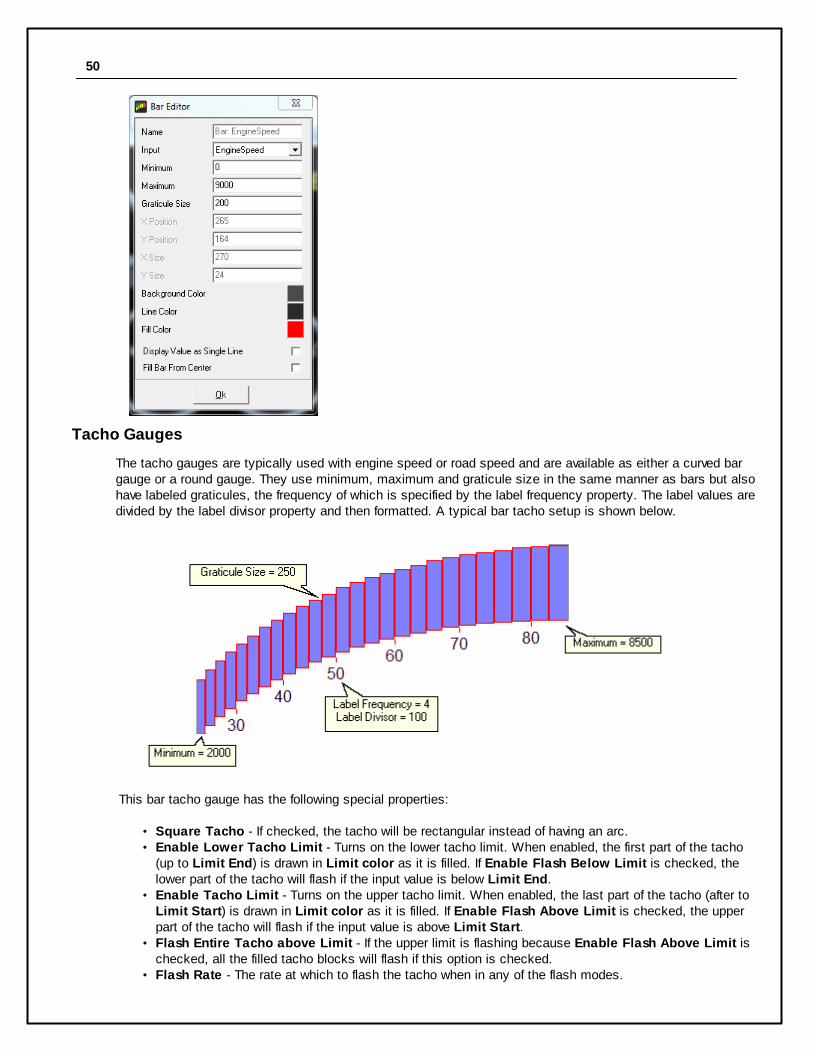
Tacho Gauges
The tacho gauges are typically used with engine speed or road speed and are available as either a curved bargauge or a round gauge. They use minimum, maximum and graticule size in the same manner as bars but alsohave labeled graticules, the frequency of which is specified by the label frequency property. The label values aredivided by the label divisor property and then formatted. A typical bar tacho setup is shown below.
This bar tacho gauge has the following special properties:
· Square Tacho - If checked, the tacho will be rectangular instead of having an arc.· Enable Lower Tacho Limit - Turns on the lower tacho limit. When enabled, the first part of the tacho
(up to Limit End) is drawn in Limit color as it is filled. If Enable Flash Below Limit is checked, thelower part of the tacho will flash if the input value is below Limit End.
· Enable Tacho Limit - Turns on the upper tacho limit. When enabled, the last part of the tacho (after toLimit Start) is drawn in Limit color as it is filled. If Enable Flash Above Limit is checked, the upperpart of the tacho will flash if the input value is above Limit Start.
· Flash Entire Tacho above Limit - If the upper limit is flashing because Enable Flash Above Limit ischecked, all the filled tacho blocks will flash if this option is checked.
· Flash Rate - The rate at which to flash the tacho when in any of the flash modes.

51
It can be seen that with these options, the tacho can effectively be divided into three separate different coloredregions.
Text Label Gauge
The Text Label gauge is a static gauge (it has no input) that is used to label other gauges and provide staticinformation to the user. The text displayed in the gauge is set in the Text property. The Direction property isused to specify the direction in which the text is drawn in. Right specifies left to right. Down specifies top tobottom.

52
Variable String Gauge
The variable text gauge is used to display text from a text output such as a bit text output. The Justificationproperty specifies whether the text is aligned to the left, right or centre of the bounding rectangle.
Note: It is important to select the background color of the value gauge to be the same as the color ofthe background the gauge is over. Failure to do so will result in corruption of the value displayed.
53
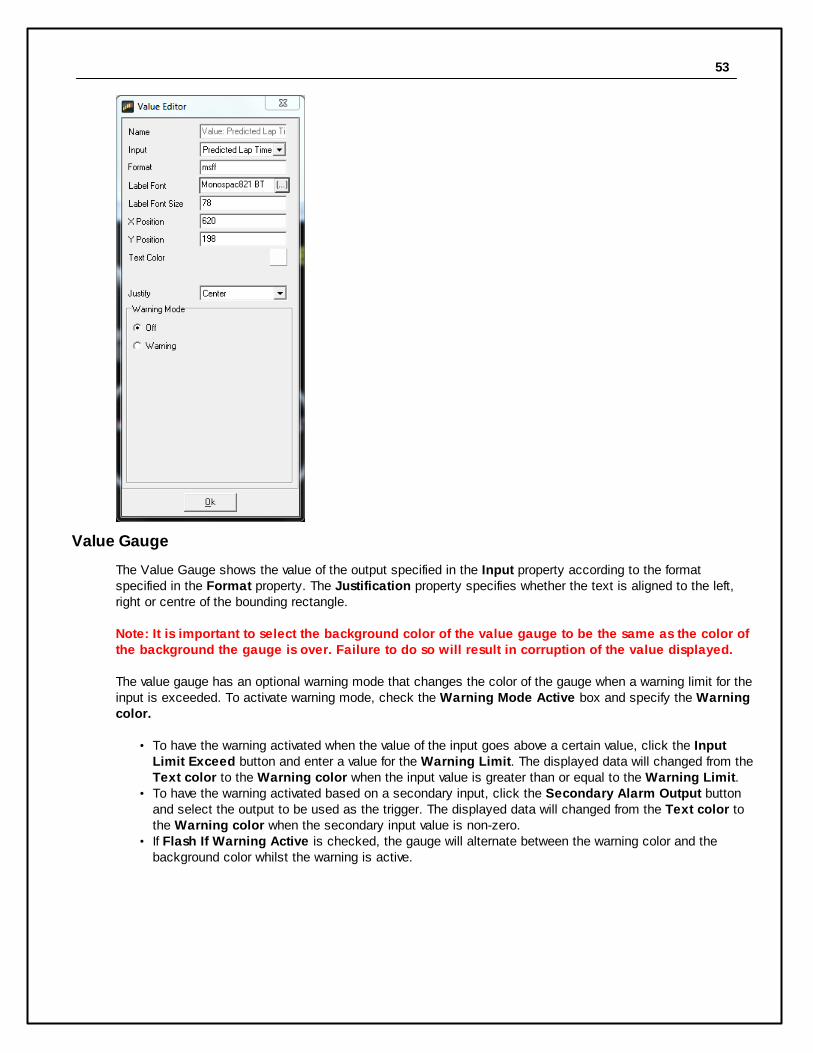
Value Gauge
The Value Gauge shows the value of the output specified in the Input property according to the formatspecified in the Format property. The Justification property specifies whether the text is aligned to the left,right or centre of the bounding rectangle.
Note: It is important to select the background color of the value gauge to be the same as the color ofthe background the gauge is over. Failure to do so will result in corruption of the value displayed.
The value gauge has an optional warning mode that changes the color of the gauge when a warning limit for theinput is exceeded. To activate warning mode, check the Warning Mode Active box and specify the Warningcolor.
· To have the warning activated when the value of the input goes above a certain value, click the InputLimit Exceed button and enter a value for the Warning Limit. The displayed data will changed from theText color to the Warning color when the input value is greater than or equal to the Warning Limit.
· To have the warning activated based on a secondary input, click the Secondary Alarm Output buttonand select the output to be used as the trigger. The displayed data will changed from the Text color tothe Warning color when the secondary input value is non-zero.
· If Flash If Warning Active is checked, the gauge will alternate between the warning color and thebackground color whilst the warning is active.

54
Progressive Limit Gauge
The Progressive Limit gauge is typically used to signal an approaching rev limit by means of several boxes thatchange color as the rev limit approaches. This gauge has the following special properties:
· Box Count is the number of boxes in the gauge.· Box Size is the width and height of the box in pixels.· Limiter Start is the value at which the first box will change color from Background color to Fill color. · Limiter Offset is the value added to the Limiter Start to determine when the next box changes color.· Draw Circular Limit Lights - if checked, round LED style boxes will be drawn instead of boxes.
For example, if Box Count is 3, Limiter Start is 8000 and Limiter Offset is 200, the first box will changecolor at 8000, the second at 8200 and the third at 8400.
55
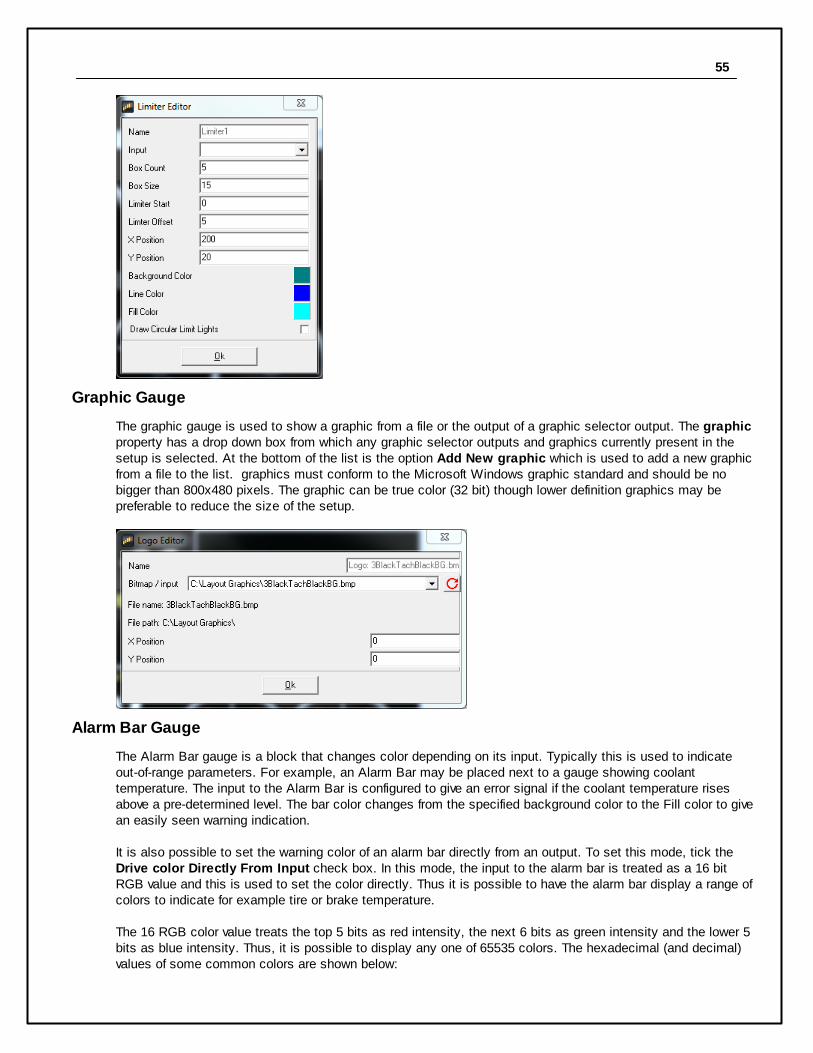
Graphic Gauge
The graphic gauge is used to show a graphic from a file or the output of a graphic selector output. The graphicproperty has a drop down box from which any graphic selector outputs and graphics currently present in thesetup is selected. At the bottom of the list is the option Add New graphic which is used to add a new graphicfrom a file to the list. graphics must conform to the Microsoft Windows graphic standard and should be nobigger than 800x480 pixels. The graphic can be true color (32 bit) though lower definition graphics may bepreferable to reduce the size of the setup.
Alarm Bar Gauge
The Alarm Bar gauge is a block that changes color depending on its input. Typically this is used to indicateout-of-range parameters. For example, an Alarm Bar may be placed next to a gauge showing coolanttemperature. The input to the Alarm Bar is configured to give an error signal if the coolant temperature risesabove a pre-determined level. The bar color changes from the specified background color to the Fill color to givean easily seen warning indication.
It is also possible to set the warning color of an alarm bar directly from an output. To set this mode, tick the Drive color Directly From Input check box. In this mode, the input to the alarm bar is treated as a 16 bitRGB value and this is used to set the color directly. Thus it is possible to have the alarm bar display a range ofcolors to indicate for example tire or brake temperature.
The 16 RGB color value treats the top 5 bits as red intensity, the next 6 bits as green intensity and the lower 5bits as blue intensity. Thus, it is possible to display any one of 65535 colors. The hexadecimal (and decimal)values of some common colors are shown below:
56
· Black 0x0000 (0)· White 0xFFFF (65535)· Red 0xF800 (63488)· Green 0x07E0 (2016)· Blue 0x001F (31)· Cyan 0x07FF (2047)· Yellow 0xFFE0 (65504)
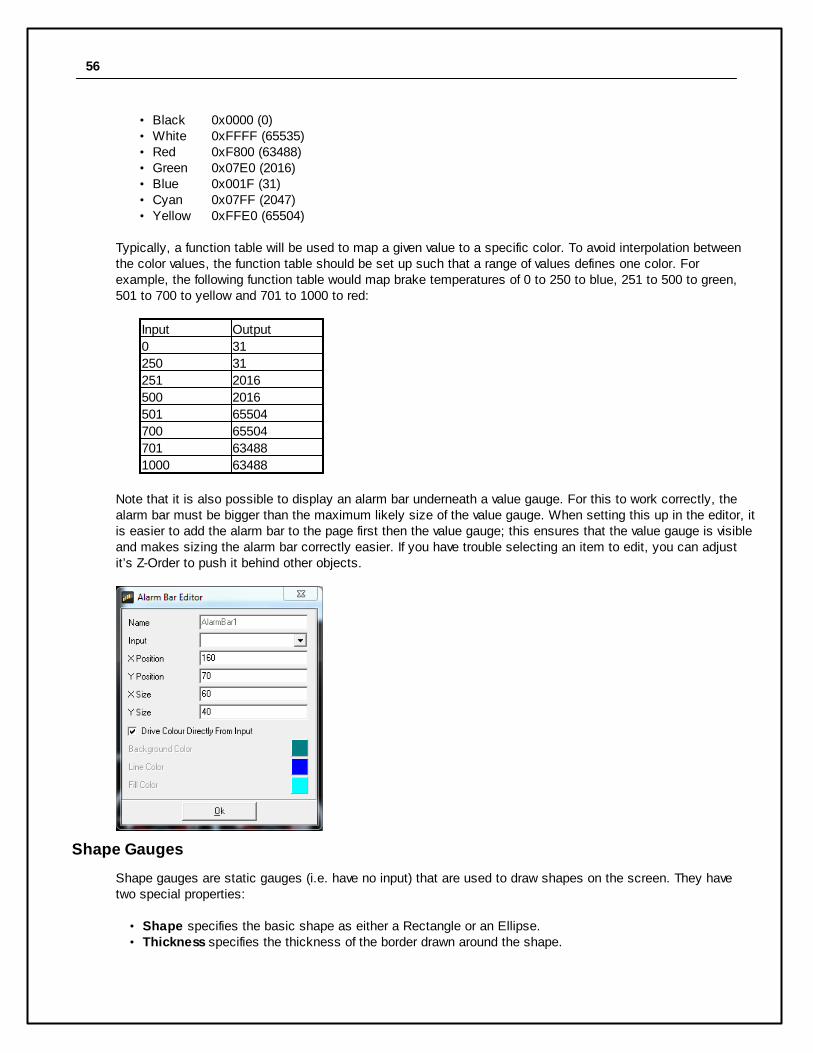
Typically, a function table will be used to map a given value to a specific color. To avoid interpolation betweenthe color values, the function table should be set up such that a range of values defines one color. Forexample, the following function table would map brake temperatures of 0 to 250 to blue, 251 to 500 to green,501 to 700 to yellow and 701 to 1000 to red:
Input Output
0 31
250 31
251 2016
500 2016
501 65504
700 65504
701 63488
1000 63488
Note that it is also possible to display an alarm bar underneath a value gauge. For this to work correctly, thealarm bar must be bigger than the maximum likely size of the value gauge. When setting this up in the editor, itis easier to add the alarm bar to the page first then the value gauge; this ensures that the value gauge is visibleand makes sizing the alarm bar correctly easier. If you have trouble selecting an item to edit, you can adjustit’s Z-Order to push it behind other objects.
Shape Gauges
Shape gauges are static gauges (i.e. have no input) that are used to draw shapes on the screen. They havetwo special properties:
· Shape specifies the basic shape as either a Rectangle or an Ellipse.· Thickness specifies the thickness of the border drawn around the shape.

57
Cross Hair Gauge
The Cross Hair gauge uses two inputs to move a cross hair around a box. The cross hair gauge has thefollowing special properties:
· XInput, YInput specify the inputs for the X and Y axes of the gauge.· X Minimum, Y Minimum specify the starting values for the X and Y axes.· X Maximum, Y Maximum specify the end values for the X and Y axes.· Cursor Size is the size of the cross hair cursor.· Background graphic can be used to specify a graphic that will be shown behind the cross hairs, This
can be used to clarify the meaning of a particular position for the cross hair.
Historical Graph
The Historical Graph gauge is used to show the trend of one or more outputs in the form of a y-t graph. TheHistorical Graph gauge has the following special properties:
· Time Base - This is the width of the x axis in seconds. When a page with a historical graph gauge is firstselected, the data is drawn from the left hand side of the graph (t=0). As the time progresses, the linesprogress towards the right hand side of the graph. Once t = time base, the graph scrolls to the left tomake more space available for drawing the lines.
· Input Count - The number of lines (outputs) drawn in this graph.· The Inputs box allows the details of each line to be specified:
· Input Index - Selects which line the following settings apply to.
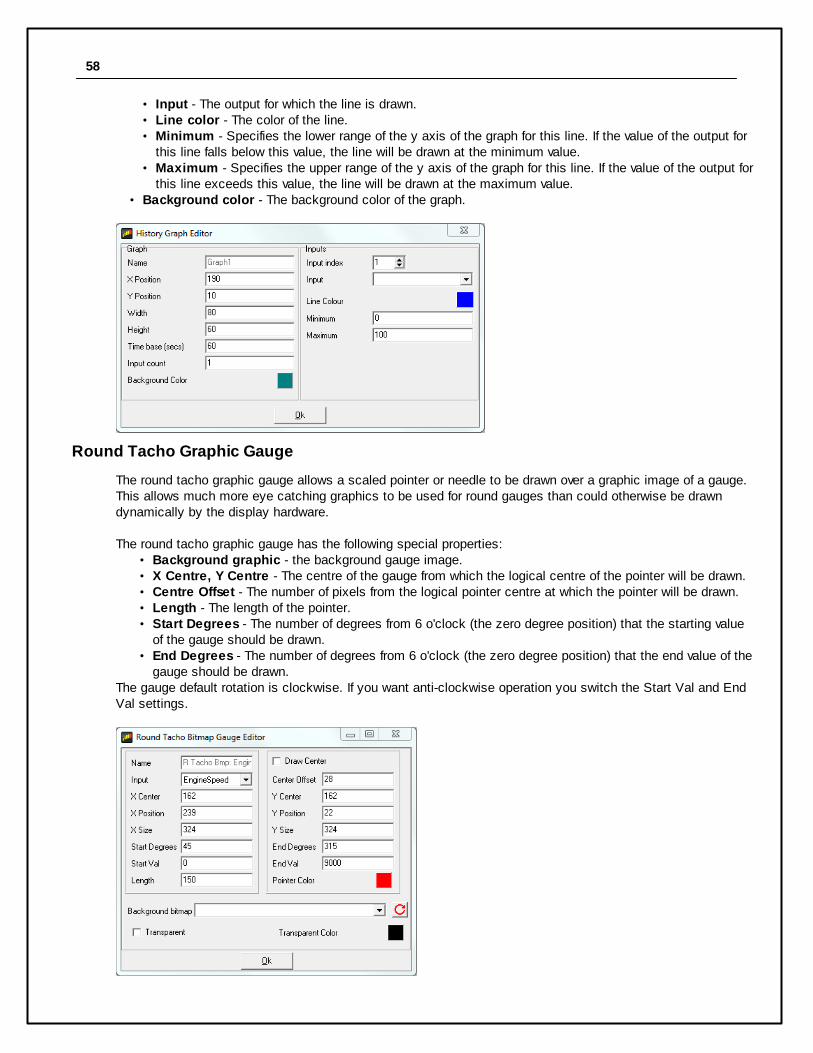
58
· Input - The output for which the line is drawn.· Line color - The color of the line.· Minimum - Specifies the lower range of the y axis of the graph for this line. If the value of the output for
this line falls below this value, the line will be drawn at the minimum value.· Maximum - Specifies the upper range of the y axis of the graph for this line. If the value of the output for
this line exceeds this value, the line will be drawn at the maximum value.· Background color - The background color of the graph.
Round Tacho Graphic Gauge
The round tacho graphic gauge allows a scaled pointer or needle to be drawn over a graphic image of a gauge.This allows much more eye catching graphics to be used for round gauges than could otherwise be drawndynamically by the display hardware.
The round tacho graphic gauge has the following special properties:· Background graphic - the background gauge image.· X Centre, Y Centre - The centre of the gauge from which the logical centre of the pointer will be drawn.· Centre Offset - The number of pixels from the logical pointer centre at which the pointer will be drawn.· Length - The length of the pointer.· Start Degrees - The number of degrees from 6 o'clock (the zero degree position) that the starting value
of the gauge should be drawn.· End Degrees - The number of degrees from 6 o'clock (the zero degree position) that the end value of the
gauge should be drawn.The gauge default rotation is clockwise. If you want anti-clockwise operation you switch the Start Val and EndVal settings.

59
12 Month Limited Warranty
Advanced Engine Management Inc. w arrants to the consumer that all AEM High Performance products w ill be free from defects in
material and w orkmanship for a period of tw elve (12) months from date of the original purchase. Products that fail w ithin this 12-
month w arranty period w ill be repaired or replaced at AEM’s option, w hen determined by AEM that the product failed due to defects
in material or w orkmanship. This w arranty is limited to the repair or replacement of the AEM part. In no event shall this w arranty
exceed the original purchase price of the AEM part nor shall AEM be responsible for special, incidental or consequential damages or
cost incurred due to the failure of this product. Warranty claims to AEM must be transportation prepaid and accompanied w ith dated
proof of purchase. This w arranty applies only to the original purchaser of product and is non-transferable. All implied w arranties
shall be limited in duration to the said 12-month w arranty period. Improper use or installation, accident, abuse, unauthorized repairs or
alterations voids this w arranty. AEM disclaims any liability for consequential damages due to breach of any w ritten or implied
w arranty on all products manufactured by AEM. Warranty returns w ill only be accepted by AEM w hen accompanied by a valid
Return Merchandise Authorization (RMA) number. Product must be received by AEM w ithin 30 days of the date the RMA is issued.
UEGO oxygen sensors are considered w ear items and are not covered under w arranty.
Please note that before AEM can issue an RMA for any electronic product, it is f irst necessary for the installer or end user to contact
the EMS tech line at 1-800-423-0046 to discuss the problem. Most issues can be resolved over the phone. Under no circumstances
should a system be returned or a RMA requested before the above process transpires.
AEM w ill not be responsible for electronic products that are installed incorrectly, installed in a non-approved application, misused, or
tampered w ith.
Any AEM electronics product can be returned for repair if it is out of the w arranty period. There is a minimum charge of $50.00 for
inspection and diagnosis of AEM electronic parts. Parts used in the repair of AEM electronic components w ill be extra. AEM w ill
provide an estimate of repairs and receive w ritten or electronic authorization before repairs are made to the product.

AEM DashDesign60
Index- A -Adding gauges 46
Alarm 35
Alarm bar gauge 55
Alarm page 43
- B -Bar gauges 49
Basic setup editing 18
Bit string 33
Bitmap 34
Bitmap gauge 55
Bitmask 33
Brightness 44
- C -CAN 29
CAN .dbc 23
Colors 45
Copy and Paste 47
Creating setups 17
Cross hair gauge 57
- D -Default colors 45
Default setups 17
Deleting gauges 47
Display editor 22
Display screens 44
- E -ECU string 33
Editing gauge properties 47
- F -Features 3
Firmware updating 27
Format 48
Function table 31
- G -Gauge 48, 50
adding 46
alarm bar 55
bar 49
bar tacho 50
bitmap 55
copy and paste 47
cross hair 57
deleting 47
editing properties 47
historical graph 57
moving 46
progressive limit 54
resizing 46
round tacho 50
round tacho bitmap 58
selecting 46
shape 56
standard properties 48
text label 51
value 53
value formatting 48
variable string 52
Gauge properties
editing 47
standard 48
GPS 8
- H -Historical graph gauge 57
- I -Installation 8
Installing AEM DashDesign 8
Installing USB Drivers 8
Introduction 2

Index 61
- L -Lap timing 8, 39
LEDs 42
Limit filter 32
Logging 25
- M -Monitor screen 45
Mounting 4
Moving gauges 46
- O -Odometer 38
On change page 43
Opening setups 16
Outputs 28
- P -Programming the display 21
Progressive limit gauge 54
- R -Rate filter 32
Resizing gauges 46
Round tacho bitmap gauge 58
- S -Saving setups 16
Scalar sensor 31
Screen
adding gauges 46
copy and paste 47
deleting gauges 47
editing gauge properties 47
monitor 45
moving gauges 46
resizing gauges 46
selecting gauges 46
Selecting gauges 46
Sensor
scalar 31
Settings 41
Setup
editor 28
Setup editor 28
Setups 16
creating 17
opening 16
saving 16
uploading 21
Shape gauge 56
Shift lights 42
Spash screen 45
Standard gauge properties 48
- T -Tacho gauges 50
Text label gauge 51
time filter 32
Track mapping 39
Turn Blinkers 38
- U -Updating firmware 27
Uploading setups 21
USB drivers
Installing 8
- V -Value formatting 48
Value gauge 53
Variable string gauge 52
- W -Warning message 37
Wiring 6
- Z -Z order 48