CCS APPS CODE COVERAGE. CCS APPS Code Coverage Definition: –The amount of code within a program...
23
C C S A P P S CODE COVERAGE
-
Upload
sydney-berry -
Category
Documents
-
view
237 -
download
2
Transcript of CCS APPS CODE COVERAGE. CCS APPS Code Coverage Definition: –The amount of code within a program...

CC
S A
PP
S
CODE COVERAGE
CC
S A
PP
S
Code Coverage
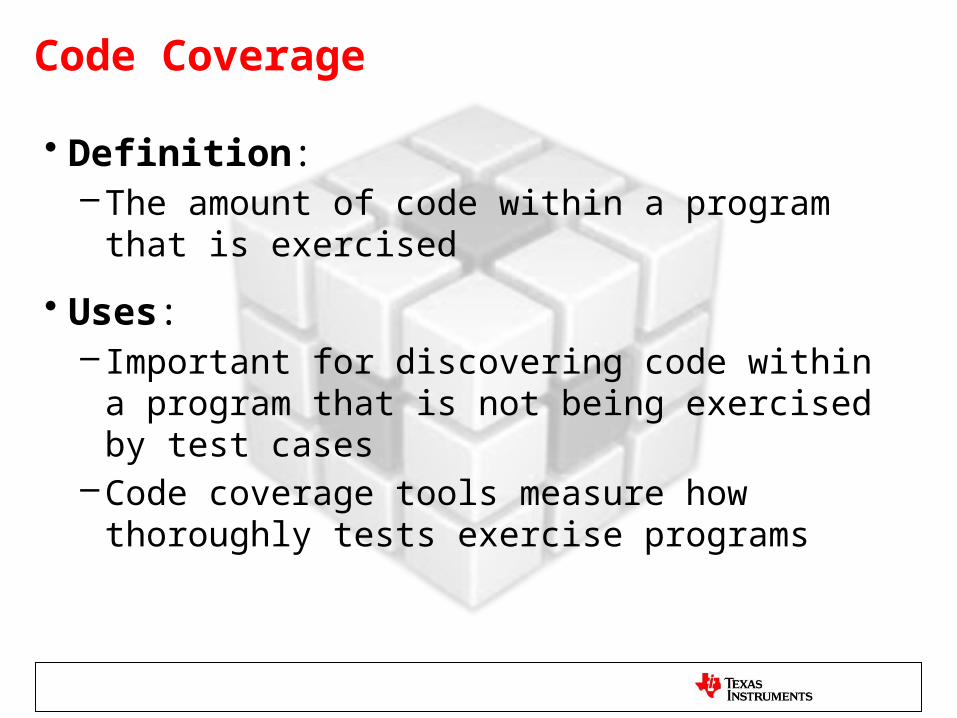
• Definition: –The amount of code within a program that is
exercised
• Uses:– Important for discovering code within a program that
is not being exercised by test cases–Code coverage tools measure how thoroughly tests
exercise programs
John E Stevenson
Maybe break this up intoDefintion:the amount of code...Uses:Important for...Code coverage ...
CC
S A
PP
S
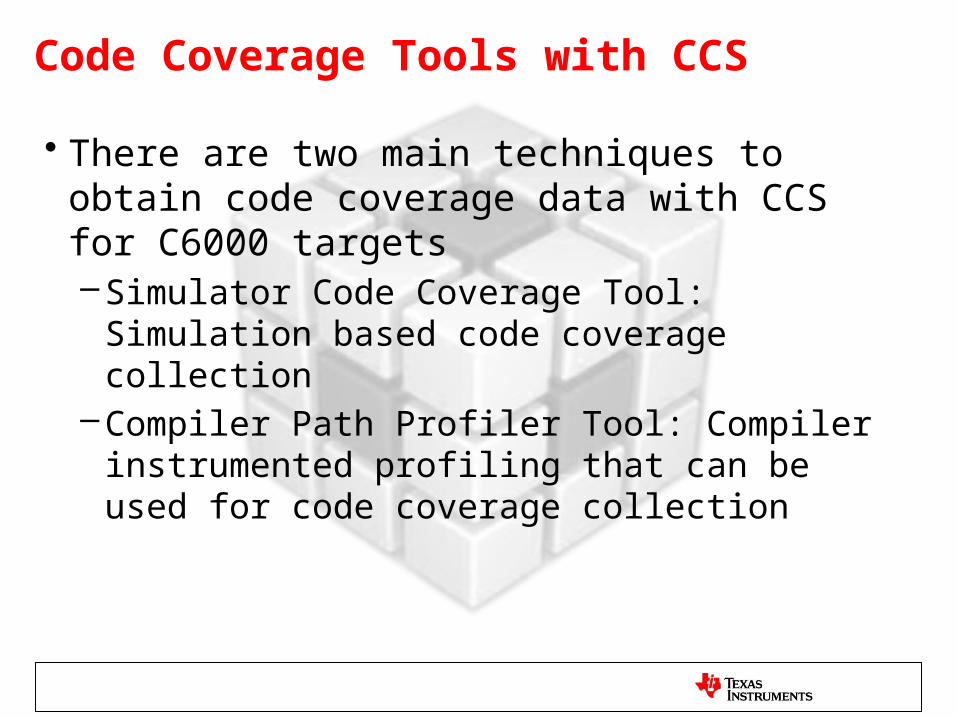
Code Coverage Tools with CCS
• There are two main techniques to obtain code coverage data with CCS for C6000 targets–Simulator Code Coverage Tool: Simulation based
code coverage collection–Compiler Path Profiler Tool: Compiler instrumented
profiling that can be used for code coverage collection
John E Stevenson
SHould really be 3 but we need to find out how to use trace data to do it :)

CC
S A
PP
S
Simulation Code Coverage Tool
• Generates code coverage data for application– Instrumentation and collection handled by the simulator non-
intrusively
• View function and line coverage data
• Enable editor highlighting of line coverage data

CC
S A
PP
S
Limitations
• Only supported on C6000 simulators
• No support on hardware targets (tool is a simulator feature)
John E Stevenson
Font size is off in the title, maybe that was so it would fit.

CC
S A
PP
S
Compiler Code Coverage Tool
• Generate code coverage data for application– Data is collected using the compiler Path Profiling capability– Path profiler will add additional instrumentation code to the
application
• View function and line coverage data
• Enable editor highlighting of line coverage data (TBD)
John E Stevenson
Did you file a CQ for the editor highlighting?

CC
S A
PP
S
Path Profiling
• Code is instrumented to count number of times each section is entered– Not all sections are instrumented– Post processing computes counts for sections not instrumented
• Run-time-support function writes the collected information into a profile data file called a PDAT file– This file is written to the host using C I/O– The write occurs when the run-time-support exit() function is called
• Can execute on any HW or simulation platform
• Collected profile data can be used for generating code coverage reports
• Learn more about Path Profiling in the C6000 Compiler User’s Guide– http://www.ti.com/lit/ug/spru187u/spru187u.pdf (Section 3.8)
a0389327
Should this slide be earlier? ALso it talks about how the info can be used for coverage which is obvious given the presentation we are in. I think it should go before the diagram.Don't worry about the 6.1 comment. Just cut that it is really old.

CC
S A
PP
S
Path Profiling – Generate Code Coverage
cl6x --gen_profile_info
app.out
Execute
pprofout.pdat
pdd6x
test.prf
cl6x -use_profile_info=test.prf --onlycodecov
• Build and link to create instrumented executable
• RTS function writes pprofout.pdat via C I/O
• Profile data decoder• Saves overhead on target
• Generates code coverage data

CC
S A
PP
S
Path Profiling – Generate Code Coverage
cl6x --gen_profile_info
app.out
Execute
pprofout.pdat
pdd6x
test.prf
cl6x -use_profile_info=test.prf --onlycodecov
• Build and link to create instrumented executable
• RTS function writes pprofout.pdat via C I/O
• Profile data decoder• Saves overhead on target
• Generates code coverage dataHandled by CCS CodeGen
Code Coverage processer

CC
S A
PP
S
Profiling Overhead• Compile Time Overhead
– Additional compiler passes pprof6x.exe and pdd6x.exe– Activated under --[gen|use]_profile_info– Runs between parser and optimizer– Handles adding profile code, or using profile info– Slows build time
• Memory Footprint Overhead– Additional instructions for collecting profile information– .ppdata section contains memory for the profile information
• Runtime Overhead– Additional instructions for collecting profile information
John E Stevenson
For the runtime overhead the bullet is backwards really. THere is runtime overhead, that is lessened a bit by the fact that not all blocks have counters but we should be saying that due to the insertion of the counters there is overhead while we are counting.

CC
S A
PP
S
Profiling Limitations• PDAT file is written to the host when the run-time-support exit() function
is called– Application must terminate to reach the exit() function– Run-time-support library must be used
• Following applications will need additional tweaking to support writing of path profiling data– Non-terminating– No main()– Custom boot/initialization routine– No run-time initialization model selected in the linker options
• JTAG connection required for C I/O call to write the PDAT file to the host (CCS uses JTAG to communicate to the target)
• Check the C6000 Compiler User’s Guide for more details on how to workaround these limitations:– http://www.ti.com/lit/ug/spru187u/spru187u.pdf (Section 3.8)

CC
S A
PP
S
LABS

CC
S A
PP
S
LAB conventions
Before starting, it is important to review some lab conventions that will ease your work…
• Lab steps are in black and numbered for easier reference1. …
2. …
• Explanations, notes, warnings are written in blue
– Warnings are shown with
– Information is marked with
– Tips and answers are marked with
– Questions are marked with
CC
S A
PP
S
Simulation Code Coverage: Exercise Summary
• Key Objectives– Import/Build/Load MainSort.c example– Enable CCS Code Coverage tool– Run the program and view Code Coverage data
• Tools and Concepts Covered– Importing an existing CCS Eclipse project– CCS Code Coverage tool

CC
S A
PP
S
Import/Build/Load ‘MainSort’ Project
1. Import the MainSort project into CCS (Project -> Import Existing CCS Eclipse Project)1. Enable the option to Copy projects into
workspace
2. In the Project Explorer view, select the MainSort project (it should appear [Active – Debug]) to make it active1. Check to make sure that the
c674x_cpu_sim_le.ccxml file is [Active]. If it is not [Active], right-click on the file and select Set as Active Target Configuration in the context menu
3. Click on the Debug icon in the toolbar. This will build the project, start the debugger, load the program and run to main

CC
S A
PP
S
Enable Code Coverage Collection
1. Open the Profile Setup view (Tools-> Profile -> Setup Profile Data Collection)
2. In the Profile Setup view:1. Press the Activate button to enable profiling/coverage collection
2. Enable the Collect Code Coverage and Exclusive Profile Data option
3. Press the Save button
3. Code Coverage collection has been enabled

CC
S A
PP
S
Collect Coverage Data and View Results1. Press the Resume button to run the program
1. The program should terminate on its own
2. View the collected coverage data in the Coverage views (Tools-> Profile -> Setup Profile Data Collection)
3. Two views will be opened:1. Function Coverage view: Displays function coverage data
2. Line Coverage view: Displays line coverage data
4. In the Line Coverage view, select the Highlight coverage info in editor button. This will highlight line coverage data in the editor – green for lines that were executed and red for lines not executed

CC
S A
PP
S
View Function and Line Coverage Results

CC
S A
PP
S
CGT Path Profiling Tool: Exercise Summary• Key Objectives
– Enable compiler path profiling collection– Run the program and view compiler Code Coverage data
• Tools and Concepts Covered– Compiler path profiling option– View path profiling based code coverage data in CCS

CC
S A
PP
S
Enable Compiler Path Profiling Collection
1. In the Project Explorer view, right-click on the MainSort project and select Properties in the context menu to open the MainSort project properties dialog
2. Navigate to the Feedback Options (Build -> C6000 Compiler -> Advanced Options -> Feedback Options) and enable the option for Generate profile feedback data
3. Hit OK to apply the changes
CC
S A
PP
S
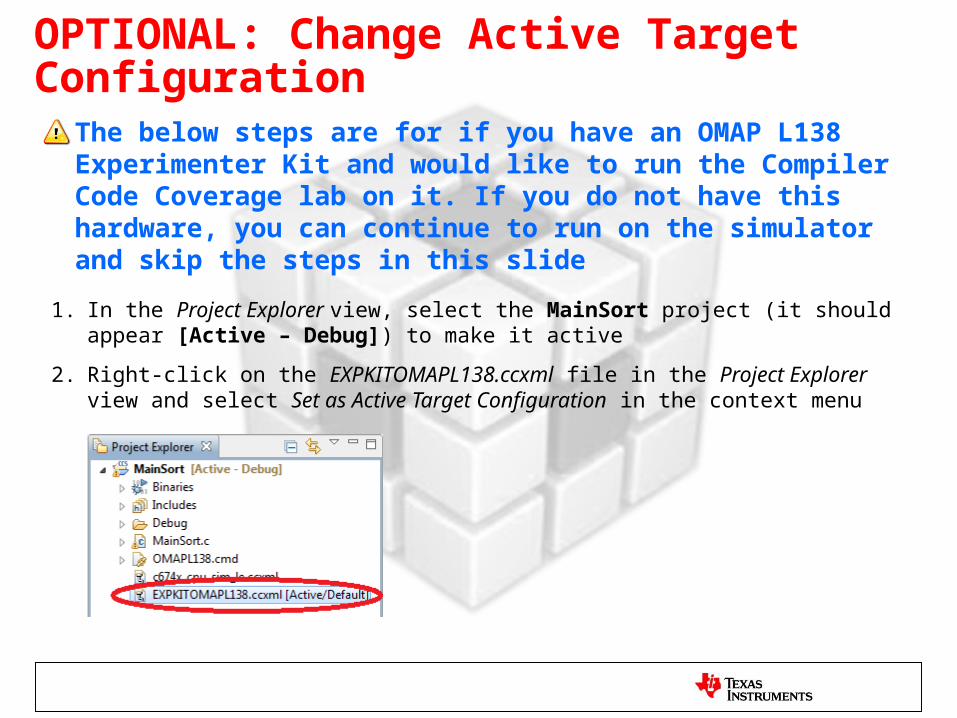
OPTIONAL: Change Active Target Configuration
1. In the Project Explorer view, select the MainSort project (it should appear [Active – Debug]) to make it active
2. Right-click on the EXPKITOMAPL138.ccxml file in the Project Explorer view and select Set as Active Target Configuration in the context menu
• The below steps are for if you have an OMAP L138 Experimenter Kit and would like to run the Compiler Code Coverage lab on it. If you do not have this hardware, you can continue to run on the simulator and skip the steps in this slide

CC
S A
PP
S
Collect Path Profile Data and View Code Coverage Results
1. Click on the Debug icon in the toolbar to rebuild, load and run to main
2. Navigate to Tools -> Profile and enable the option for Generate profile feedback data
3. Press the Resume button to run the program1. The program should terminate on its own
4. View the collected coverage data in the Coverage views (Tools-> Profile -> Process CodeGen Code Coverage)
5. Two views will be opened:1. CodeGen Function Coverage view: Displays function
coverage data
2. CodeGen Line Coverage view: Displays line coverage data
6. Hit OK to apply the changes

CC
S A
PP
S
CodeGen Line Code Coverage Results