
CCQM K99 final report - BIPM - BIPM 3 - Purpose of the comparison This key comparison has been...
23
CCQM WG on Electrochemical Analysis Final report on CCQM – K99 Key comparison on pH of an unknown phosphate buffer March 2015 F. Bastkowski , P. Spitzer, B. Sander, M. Máriássy, L. Dimitrova, A. Reyes, A. Rodríguez, V. Lara Manzano, A. Vospelova, P. T. Jakobsen, M. Pawlina, M. Korol, W. Kozlowski, M. Delgado, G. Ticona Canaza, J. C. Dias, F. B. Gonzaga, Z. Nagyné Szilágyi, Beáta Jakusovszky, Leoš Vyskočil, T. Nongluck, J. Waters, K. W. Pratt, T. Asakai, I. Maksimov, Z. Hankova, E. Uysal, V. Gavrilkin, S. V. Prokunin, E. Ferreira, S. Fajardo Abstract Results of CCQM-K99 key comparison on unknown phosphate buffer pH ~ 7.5 at 5 °C, 15 °C, 25 °C, 37 °C and 50 °C are reported. Good agreement is found between the majority of participants. Subject field Amount of substance Subject Determination of the acidity functions at zero chloride molality of an unknown phosphate buffer, pH ~7.5 by Harned cell measurements at 5 °C, 15 °C, 25 °C, 37 °C and 50 °C.
Transcript of CCQM K99 final report - BIPM - BIPM 3 - Purpose of the comparison This key comparison has been...

CCQM WG on Electrochemical Analysis
Final report on CCQM – K99
Key comparison on pH of an unknown phosphate buffer
March 2015
F. Bastkowski, P. Spitzer, B. Sander, M. Máriássy, L. Dimitrova, A. Reyes, A. Rodríguez, V. Lara Manzano,
A. Vospelova, P. T. Jakobsen, M. Pawlina, M. Korol, W. Kozlowski, M. Delgado, G. Ticona Canaza, J. C. Dias, F. B.
Gonzaga, Z. Nagyné Szilágyi, Beáta Jakusovszky, Leoš Vyskočil, T. Nongluck, J. Waters, K. W. Pratt, T. Asakai, I.
Maksimov, Z. Hankova, E. Uysal, V. Gavrilkin, S. V. Prokunin, E. Ferreira, S. Fajardo
Abstract
Results of CCQM-K99 key comparison on unknown phosphate buffer pH ~ 7.5 at 5 °C, 15 °C, 25 °C,
37 °C and 50 °C are reported. Good agreement is found between the majority of participants.
Subject field
Amount of substance
Subject
Determination of the acidity functions at zero chloride molality of an unknown phosphate buffer,
pH ~7.5 by Harned cell measurements at 5 °C, 15 °C, 25 °C, 37 °C and 50 °C.

- 2 - Table of Contents
Abstract ................................................................................................................................ - 1 -
Subject field .......................................................................................................................... - 1 -
Subject ................................................................................................................................. - 1 -
Table of Contents ................................................................................................................. - 2 -
Purpose of the comparison .................................................................................................. - 3 -
Time schedule ...................................................................................................................... - 3 -
Coordinating laboratory ........................................................................................................ - 3 -
Participants .......................................................................................................................... - 4 -
Sample preparation and distribution ..................................................................................... - 5 -
Sample homogeneity and stability ........................................................................................ - 5 -
Timetable of measurements and Comments ........................................................................ - 8 -
Problems reported to the coordinator ................................................................................... - 9 -
Measurement Technique ...................................................................................................... - 9 -
Results and discussion ....................................................................................................... - 10 -
Calculation of the KCRV and its uncertainty ....................................................................... - 14 -
Conclusions ........................................................................................................................ - 17 -
How far the light shines ...................................................................................................... - 17 -
Figures ............................................................................................................................... - 17 -

- 3 - Purpose of the comparison
This key comparison has been performed to evaluate the degree of equivalence of national standard
measurement procedures for the determination of the pH of phosphate buffer solutions.
The comparison was restricted to the use of either the primary Harned cell1 or the secondary differential
potentiometric cell2 method for pH. It was only allowed to participate by using a secondary instead of a primary
method if this is the highest metrological standard in the NMI and designated institute respectively and if the
CMCs are based on this method. Only the results obtained by the primary method were used to calculate the
KCRV.
Phosphate buffer is widely used to calibrate pH electrodes. A buffer solution of 0.008695 mol/kg KH2PO4 and 0.03043 mol/kg Na2HPO4 is one of the primary pH reference buffer solutions recommended by IUPAC. Certified
reference materials are issued by several NMIs based on primary measurement.
In this comparison measurements of pH has been performed at 15 °C, 25 °C, 37 °C and additionally at 5 °C, and
50 °C.
Time schedule Dispatch of the samples: 11 February 2014
Deadline for receipt of the report: 23 May 2014
Results distributed 13 June 2014
Draft A report distributed 06 February 2015
Discussion of results and Draft A report via e-mail, February/March 2015
Draft B report distributed 13 March 2015
EAWG approval of Draft B report EAWG meeting, 16-17 April 2015
Final report 23 December 2015
Coordinating laboratory PTB (Physikalisch-Technische Bundesanstalt)
Bundesallee 100
38116 Braunschweig
Germany
Petra Spitzer
Tel: +49 531 592 3130 Fax: +49 531 592 3015
Email: [email protected] Frank Bastkowski
Tel: +49 531 592 3323
Fax: +49 531 592 3015
Email: [email protected]
Beatrice Sander
Tel: +49 531 592 3132
Fax: +49 531 592 3015 Email: [email protected]
1 Buck RP et al. 2002 Pure Appl. Chem. 74(11), 2169–2200
2 Baucke FGK (1994) J Electroanal Chem 368, 67–75

- 4 - Participants
No Country Institute Acronym Contact 1 Bulgaria Bulgarian Institute of Metrology BIM, NCM Lyudmila Dimitrova 2 Mexico Centro Nacional de Metrologia CENAM Adrian Reyes/Aaron
Rodríguez 3 Czech
Republic Czech Metrology Institute CMI Alena Vospelova
4 Denmark Danish Fundamental Metrology A/S DFM Pia Tønnes Jakobsen 5 Poland Central Office of Measures GUM Wladyslaw Koslowski 6 Bolivia Instituto Boliviano de Metrología IBMETRO Mabel Delgado 7 Peru Instituto Nacional de Defensa de la
Competencia y de la Protección de la
Propiedad Intelectual
INDECOPI Galia Ticona Canaza
8 Brazil National Institute of Metrology, Quality
and Technology INMETRO Fabiano Barbieri
Gonzaga 9 Israel The National Physical Laboratory of
Israel INPL Elena Kardash
10 Uruguay Laboratorio Tecnológico del Uruguay LATU Elizabeth Ferreira
Simone Fajardo 11 Hungary Hungarian Trade Licensing Office MKEH Zsófia Nagyné
Szilágyi, Beáta
Jakusovszky 12 Thailand National Institute of Metrology
(Thailand) NIMT Ms. Nongluck
Tangpaisarnkul 13 USA National Institute of Standards and
Technology NIST Jason Waters
Kenneth W. Pratt 14 Japan National Metrology Institute of Japan NMIJ Toshiaki Asakai,
Igor Maksimov 15 Germany Physikalisch-Technische Bundesanstalt PTB Frank Bastkowski,
Beatrice Sander, Petra
Spitzer 16 Slovakia Slovak Institute of Metrology SMU Zuzana Hankova
17 Ukraine State Enterprise All-Ukrainian State
Research and production Center of
Standardization Metrology, Certification and Consumers’ Rights Protection
(Ukrmetrteststandart)
UMTS Vladimir Gavrilkin
18 Turkey TÜBİTAK UME UME Emrah Uysal 19 Russia National Scientific and Research
Institute for Physical-technical and Radio-technical Measurements
VNIIFTRI Sergey V. Prokunin
Tab. 1: List of participants in key comparison CCQM-K99
Sample preparation and distribution
The phosphate buffer solution was prepared from deionized water, potassium hydrogen phosphate and sodium
hydrogen phosphate both from Merck (CertiPUR®)
Germany by colleagues from PTB. ZMK is a calibration laboratory accreted by the German accreditation body
DAkkS for the quantity pH. The bottles and the buffer starting material were provided by PTB. The samples were bottled during one day. Sealing and weighing was done at PTB.
2013 by dissolving 118.41 g of KH2PO
fraction of water in the solution was
shipment and the stability of the sample solution was checked by Harned cell measurements. Each participant
received three 1 L HDPE numbered bottles filled with the comparison solution and sealed in aluminized plastic
bags. Shipment to all participants was perfo
deadline was shifted twice.
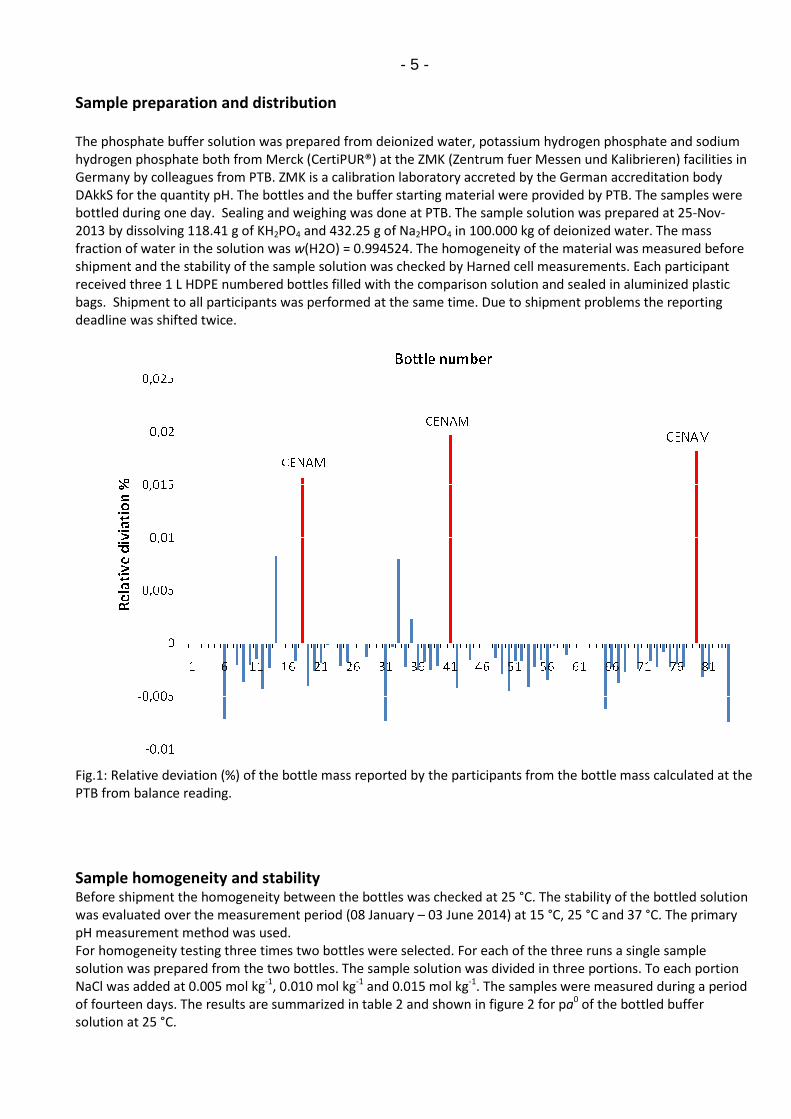
Fig.1: Relative deviation (%) of the bottle mass reported by the participants from the bottle mass calculated at the
PTB from balance reading.
Sample homogeneity and stabilityBefore shipment the homogeneity between the bottles was checked at 25 °C. The stability of the bottled solution
was evaluated over the measurement period (08 January
pH measurement method was used.
For homogeneity testing three times two bottles were selected. For each of the three runs a single sample
solution was prepared from the two bottles. The sample solution was divided in three portions. To each portion
NaCl was added at 0.005 mol kg-1, 0.010 m
of fourteen days. The results are summarized in table 2 and shown in figure 2 for psolution at 25 °C.
- 5 -
Sample preparation and distribution
The phosphate buffer solution was prepared from deionized water, potassium hydrogen phosphate and sodium
hydrogen phosphate both from Merck (CertiPUR®) at the ZMK (Zentrum fuer Messen und Kalibrieren) facilities in
ZMK is a calibration laboratory accreted by the German accreditation body
DAkkS for the quantity pH. The bottles and the buffer starting material were provided by PTB. The samples were bottled during one day. Sealing and weighing was done at PTB. The sample solution was prepared at 25
PO4 and 432.25 g of Na2HPO4 in 100.000 kg of deionized water. The mass
fraction of water in the solution was w(H2O) = 0.994524. The homogeneity of the material was measured before
t and the stability of the sample solution was checked by Harned cell measurements. Each participant
L HDPE numbered bottles filled with the comparison solution and sealed in aluminized plastic
bags. Shipment to all participants was performed at the same time. Due to shipment problems the reporting
Fig.1: Relative deviation (%) of the bottle mass reported by the participants from the bottle mass calculated at the
and stability Before shipment the homogeneity between the bottles was checked at 25 °C. The stability of the bottled solution
was evaluated over the measurement period (08 January – 03 June 2014) at 15 °C, 25 °C and 37 °C. The primary
pH measurement method was used.
r homogeneity testing three times two bottles were selected. For each of the three runs a single sample
solution was prepared from the two bottles. The sample solution was divided in three portions. To each portion
, 0.010 mol kg-1 and 0.015 mol kg-1. The samples were measured during a period
of fourteen days. The results are summarized in table 2 and shown in figure 2 for pa
The phosphate buffer solution was prepared from deionized water, potassium hydrogen phosphate and sodium
at the ZMK (Zentrum fuer Messen und Kalibrieren) facilities in
ZMK is a calibration laboratory accreted by the German accreditation body
DAkkS for the quantity pH. The bottles and the buffer starting material were provided by PTB. The samples were le solution was prepared at 25-Nov-
in 100.000 kg of deionized water. The mass
(H2O) = 0.994524. The homogeneity of the material was measured before
t and the stability of the sample solution was checked by Harned cell measurements. Each participant
L HDPE numbered bottles filled with the comparison solution and sealed in aluminized plastic
rmed at the same time. Due to shipment problems the reporting
Fig.1: Relative deviation (%) of the bottle mass reported by the participants from the bottle mass calculated at the
Before shipment the homogeneity between the bottles was checked at 25 °C. The stability of the bottled solution
03 June 2014) at 15 °C, 25 °C and 37 °C. The primary
r homogeneity testing three times two bottles were selected. For each of the three runs a single sample
solution was prepared from the two bottles. The sample solution was divided in three portions. To each portion
. The samples were measured during a period
a0 of the bottled buffer

- 6 -
Sample Date Method Acidity function at zero - 6 -hloride molality at 25 °C
26 8 Jan 2014 Harned cell 7.5237 (u = 0.001) 85 14 Jan 2014 Harned cell 7.5237 (u = 0.001) 2 21 Jan 2014 Harned cell 7.5237 (u = 0.001)
Tab 2: Homogeneity check at 25 °C at coordinating laboratory before shipment
Fig.2: Sample homogeneity at 25 °C. The standard uncertainty (k=1) is given.
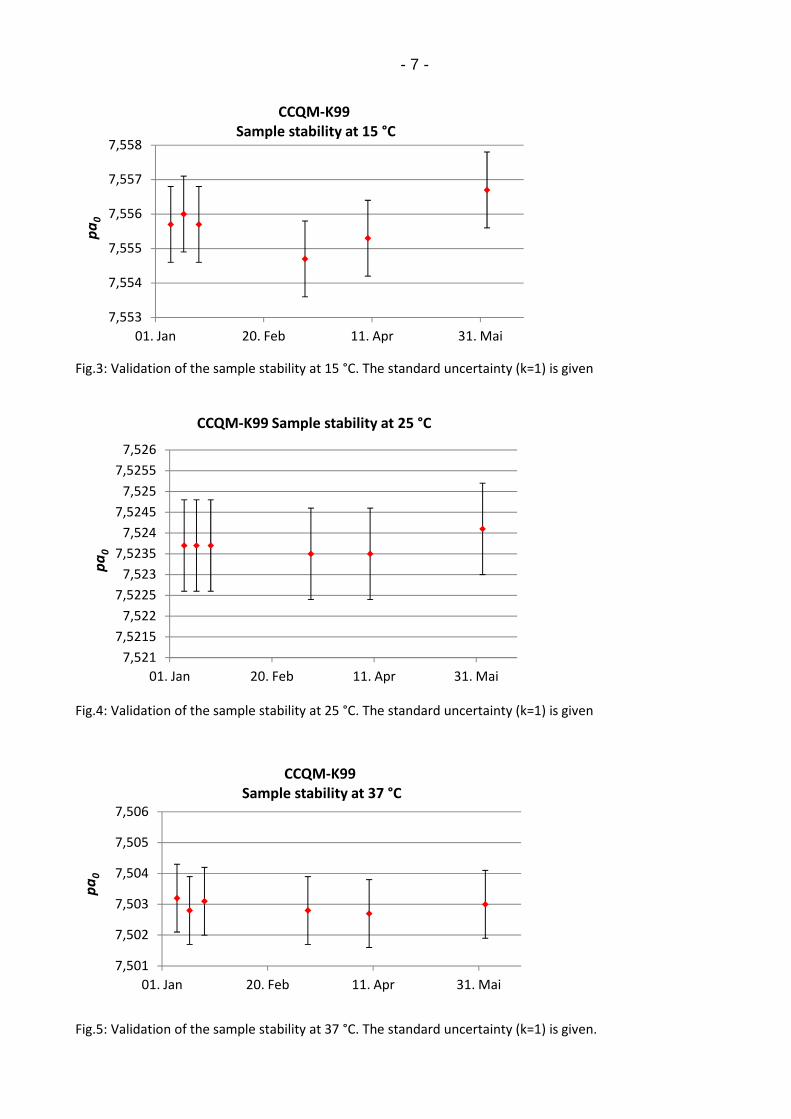
To evaluate the stability of the sample solution results of homogeneity testing and of three additional
measurement runs were used. To validate the stability of the samples the pa0 of the bottled buffer solution was
measured at all measurement temperatures. The results are given in table 3. The sample solution remained stable
over the measurement period as demonstrated by the results and shown in figure 4 to 6 for 15 °C, 25 °C and 37 °C.
Acidity function at temperature Date of measurement 15 °C 25 °C 37 °C Uncertainty u (k=1)
08. Jan 2014 7.5557 7.5237 7.5032 0.0011 14. Jan 2014 7.5560 7.5237 7.5028 0.0011 21. Jan 2014 7.5557 7.5237 7.5031 0.0011 11. Mar 2014 7.5547 7.5235 7.5028 0.0011 09. Apr 2014 7.5553 7.5235 7.5027 0.0011 03. Jun 2014 7.5567 7.5241 7.5030 0.0011
Tab 3: Sample stability over a five months period. The measurement result of KC CCQM-K99 of the coordinating
laboratory is shown in the second last row.
7,52
7,522
7,524
7,526
7,528
26 85 2
pa
0
Bottle number
CCQM-K99
Sample homogeneity at 25 °C
- 7 -
Fig.3: Validation of the sample stability at 15 °C. The standard uncertainty (k=1) is given
Fig.4: Validation of the sample stability at 25 °C. The standard uncertainty (k=1) is given
Fig.5: Validation of the sample stability at 37 °C. The standard uncertainty (k=1) is given.
7,553
7,554
7,555
7,556
7,557
7,558
01. Jan 20. Feb 11. Apr 31. Mai
pa
0
CCQM-K99
Sample stability at 15 °C
7,521
7,5215
7,522
7,5225
7,523
7,5235
7,524
7,5245
7,525
7,5255
7,526
01. Jan 20. Feb 11. Apr 31. Mai
pa
0
CCQM-K99 Sample stability at 25 °C
7,501
7,502
7,503
7,504
7,505
7,506
01. Jan 20. Feb 11. Apr 31. Mai
pa
0
CCQM-K99
Sample stability at 37 °C

- 8 - Timetable of measurements and Comments
NMI Sample
received
Measurement
Period
Report
Date
Revised
Report
Comments
IBMETRO 03 Mar 22 May 23 May IBMETRO reported a
mistake in the buoyancy
correction and provided
revised bottle masses
INMETRO 11 March 14 – 17 Apr 06 May
BIM/NCM 18 Feb 20 Feb 23 May 04 Dez more detailed description
of the uncertainty budget
in the revised report
CMI 13 Feb 20 May – 02 Jun 05 Jun
DFM 14 Feb 26 – 28 Feb 13 Mar 05 Feb
2015
more detailed description
of the uncertainty budget
in the revised report
PTB 26 Nov
2013
09 Apr 14 May 06 Jun Revision of partial H2
pressure, however no significant effect on the
uncertainty budget
NMIJ 04 Mar 06 – 18 Mar 28 Mar
MKEH 17 Feb 08 May 26 May 10 Dez Erroneous statement of
standard uncertainty (k=1)
for the acidity function,
corrected in the revised
report
INPL - - No results due to staff
shortage.
CENAM 03 Mar 12 – 21 Mar 21 May 18 Jun Erroneous statement of pH
instead of the acidity
function for 25 °C,
corrected in the revised
report
INDECOPI 10 Mar 14 Mar – 15 May 24 May
GUM 14 Feb 14 – 21 Mar 01 Apr
VNIIFTRI 05 Mar 13 Mar 11 May
SMU 21 Feb 13 Mar 23 May 09 Feb
2015,
09:31
Erroneous statement of E1
instead of E0, corrected in
the revised report
NIMT 04 Mar 24 Mar – 08 Apr 23 May 06 Feb
2015
Erroneous statement of
standard uncertainty (k=1)
for the acidity function, corrected in the revised
report
TÜBITAK UME 11 May 15 – 26 May 03 Jun
UMTS 24 Feb 14 – 23 Apr 21 May
LATU 08 Apr 07 – 15 May 23 May
NIST 07 Mar 10 Mar 04 Apr
Tab 4: Dates of sample received, measurement period, and comments

- 9 - Problems reported to the coordinator
- Due to shipment delays, the reporting deadline had to be postponed twice. Shipment to the following
institutes took longest: INMETRO (Br), Tübitak UME (Tr), LATU (Uy), the sample bottles had to be shipped
to Tübitak UME (Tr) twice. First attempt with “POST” failed, second attempt with “DSV global transport
and logistics” was successful
- LATU (Uy) reported that one of the aluminized bag has been opened by the Uruguayan customs, however this hasn´t any effect on the mass integrity
- LATU (Uy) reported that measurement could only be performed at 25 °C and 37 °C, as the provided
sample volume was not sufficient
- VNIIFTRI (Ru) reported that measurements could not be performed at 5 °C and 50 °C due to staff shortage
- SMU (Sk) reported that measurements could not be performed at 50 °C due to staff shortage
Measurement Technique
The primary measurement method for pH (Harned cell) has been described among others in the report of KC CCQM-K17 on the pH of phthalate buffer3. The primary method for pH is based on the measurement of the
potential difference of cell I without liquid junction
Pt H2 (g, p°)| buffer, Cl- AgCl Ag Cell I
Chloride ions are added to the chloride free buffer at several chloride molalities in order to stabilize the potential
of the silver-silver chloride electrode. The potential difference E of cell I depends on the hydrogen ion activity,aH ,
according to Equation 1:
)/)(/(log 0ClCl
0H
01 mmmakEE γ−= (1)
In Eq. 1, E0 is the standard potential of the Ag/AgCl reference electrode, m0 = 1 mol kg-1, mCl and γCl the molality and activity coefficient of the chloride ion. k equals RT ln10/F, where R, T, and F are the gas constant, the
thermodynamic temperature, and the Faraday constant, respectively.
The standard potential of the Ag/AgCl electrodes is simultaneously determined in cell II.
Pt|H2 (g, p°) |HCl|AgCl|Ag, Cell II
The standard potential E0 of the Ag/AgCl electrodes are calculated from the measured E2 values according to Eq.
2. The nominal molality of the HCl is m HCl = 0.01 mol kg-1. The mean activity coefficient of the HCl at the
measurement temperature for this nominal molality is taken from literature4 .
)/(log2 0HClHCl2
0 mmkEE ±−= γ (2)
The acidity function pa is calculated for each measured cell potential E1 using Eq. 3.
)/(log/)(p 0Cl
01 mmkEEa +−= (3)
In the primary procedure for pH, pa is measured as a function of mCl. The reported result for the key comparison,
the acidity function at zero chloride molality pa0 is obtained from linear extrapolation of the set of values for the
acidity function pa to mCl = 0. The reported result for the key comparison CCQM-K99 is pa0 at each measurement
temperature.
3 http://kcdb.bipm.org/AppendixB/appbresults/ccqm-k17/ccqm-k17_final_report.pdf
4 Bates R G and Robinson R A (1980) Solution Chemistry 9 455-456
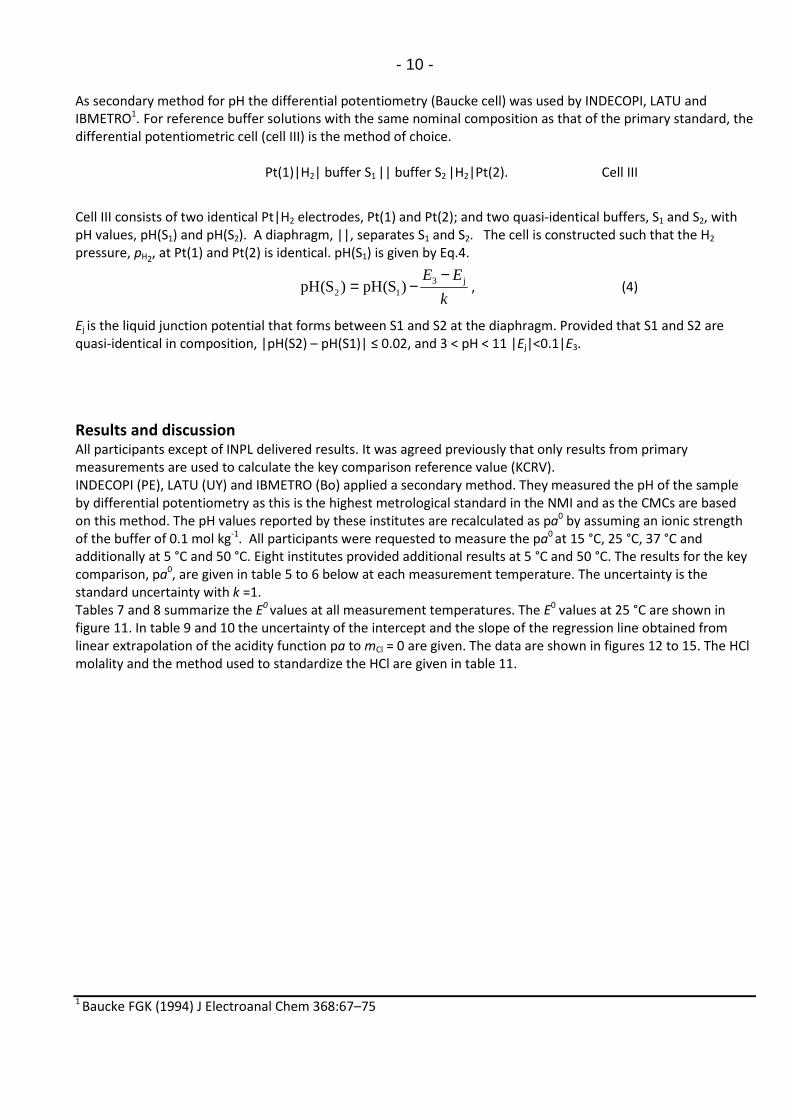
- 10 - As secondary method for pH the differential potentiometry (Baucke cell) was used by INDECOPI, LATU and IBMETRO1. For reference buffer solutions with the same nominal composition as that of the primary standard, the
differential potentiometric cell (cell III) is the method of choice.
Pt(1)|H2| buffer S1 || buffer S2 |H2|Pt(2). Cell III
Cell III consists of two identical Pt|H2 electrodes, Pt(1) and Pt(2); and two quasi-identical buffers, S1 and S2, with
pH values, pH(S1) and pH(S2). A diaphragm, ||, separates S1 and S2. The cell is constructed such that the H2
pressure, pH2, at Pt(1) and Pt(2) is identical. pH(S1) is given by Eq.4.
k
EE j312 )S(pH)S(pH
−−= , (4)
Ej is the liquid junction potential that forms between S1 and S2 at the diaphragm. Provided that S1 and S2 are
quasi-identical in composition, |pH(S2) – pH(S1)| ≤ 0.02, and 3 < pH < 11 |Ej|<0.1|E3.
Results and discussion All participants except of INPL delivered results. It was agreed previously that only results from primary
measurements are used to calculate the key comparison reference value (KCRV).
INDECOPI (PE), LATU (UY) and IBMETRO (Bo) applied a secondary method. They measured the pH of the sample
by differential potentiometry as this is the highest metrological standard in the NMI and as the CMCs are based
on this method. The pH values reported by these institutes are recalculated as pa0 by assuming an ionic strength
of the buffer of 0.1 mol kg-1. All participants were requested to measure the pa0 at 15 °C, 25 °C, 37 °C and
additionally at 5 °C and 50 °C. Eight institutes provided additional results at 5 °C and 50 °C. The results for the key
comparison, pa0, are given in table 5 to 6 below at each measurement temperature. The uncertainty is the
standard uncertainty with k =1.
Tables 7 and 8 summarize the E0 values at all measurement temperatures. The E0 values at 25 °C are shown in
figure 11. In table 9 and 10 the uncertainty of the intercept and the slope of the regression line obtained from
linear extrapolation of the acidity function pa to mCl = 0 are given. The data are shown in figures 12 to 15. The HCl
molality and the method used to standardize the HCl are given in table 11.
1 Baucke FGK (1994) J Electroanal Chem 368:67–75

- 11 -
Institute Country Acidity
function
at 15°C u (k=1)
Acidity
function at
25°C u (k=1)
Acidity
function at
37°C u (k=1)
BIM/ NCM BG 7.5553 0.0020 7.5228 0.0020 7.4951 0.0020
IBMETRO BO 7.5276 0.0050
INMETRO BR 7.5582 0.0013 7.5255 0.0013 7.5006 0.0022
CMI CZ 7.5585 0.0013 7.5287 0.0013 7.4954 0.0020
DFM DK 7.5563 0.0008 7.5232 0.0008 7.5021 0.0008
PTB DE 7.5553 0.0011 7.5235 0.0011 7.5027 0.0011
MKEH HU 7.5558 0.0030 7.5226 0.0033 7.4973 0.0034
NMIJ JP 7.5561 0.0010 7.5236 0.0010 7.5025 0.0010
CENAM MX 7.5561 0.0016 7.5239 0.0027 7.4973 0.0024
INDECOPI PE 7.5542 0.0020 7.5209 0.0020 7.5013 0.0020
GUM PL 7.5474 0.0013 7.5178 0.0014 7.4917 0.0016
VNIIFTRI RU 7.5520 0.0020 7.5190 0.0021 7.4970 0.0023
SMU SK 7.5554 0.0016 7.5220 0.0015 7.5005 0.0019
NIMT TH 7.5006 0.0197 7.4679 0.0143 7.4482 0.0110
UME TR 7.5337 0.0010 7.5291 0.0010 7.4812 0.0010
UMTS UA 7.5683 0.0028 7.5295 0.0021 7.5055 0.0021
LATU UY 7.5206 0.0050 7.5028 0.0050
NIST US 7.5578 0.0008 7.5255 0.0008 7.5036 0.0008
Tab 5: Results at 15 °C, 25 °C and 37 °C. The uncertainty is stated as standard measurement uncertainty (k = 1)
Institute Country Acidity
function
at 5°C u (k=1)
Acidity
function at
50°C u (k=1)
BIM/ NCM BG 7.4839 0.0022
PTB DE 7.6062 0.0012 7.4981 0.0011
NMIJ JP 7.6038 0.0011 7.4983 0.0011
GUM PL 7.5983 0.0014 7.4756 0.0022
NIMT TH 7.5724 0.0085 7.4345 0.0043
UME TR 7.6019 0.0010 7.4551 0.0009
UMTS UA 7.6108 0.0026 7.4947 0.0034
NIST US 7.6082 0.0010 7.4990 0.0010
Tab 6: Results at 5 °C and 50 °C. The uncertainty is stated as standard measurement uncertainty (k = 1)

- 12 -
Institute Country E
0/V
at 15 °C u(E
0) (k=1)
E0/V
at 25 °C u(E
0) (k=1)
E0/V
at 37 °C u(E
0) (k=1)
BIM/ NCM BG 0.228565 0.0001 0.222338 0.0001 0.214234 0.0001
INMETRO BR 0.228604 0.000065 0.222457 0.000066 0.214230 0.000066
CMI CZ 0.228616 0.00039 0.222463 0.00039 0.214488 0.00058
DFM DK 0.22871 0.000058 0.22249 0.000059 0.21430 0.000062
PTB DE 0.228673 0.000056 0.222459 0.000058 0.214235 0.000060
MKEH HU 0.22769 0.00017 0.22130 0.00017 0.21239 0.0002
NMIJ JP 0.228618 0.000039 0.222445 0.000043 0.214285 0.000045
CENAM MX 0.228464 0.000046 0.222209 0.000041 0.214054 0.000055
GUM PL 0.228530 0.000031 0.222375 0.000024 0.214215 0.000026
VNIIFTRI RU 0.228728 0.000072 0.222501 0.000074 0.214227 0.000077
SMU SK 0.228675 0.000045 0.222490 0.000046 0.214217 0.000047
NIMT TH 0.234846 0.000027 0.229284 0.000027 0.223195 0.000027
UME TR 0.2287168 0.0000393 0.2225763 0.0000403 0.2145406 0.0000415
UMTS UA 0.22787 0.00010 0.22189 0.00009 0.21374 0.00009
NIST US 0.228523 0.000007 0.222339 0.000021 0.214239 0.000020
Tab 7: Standard potential of the Ag/AgCl electrodes at 15 °C, 25 °C and 37 °C as reported by the participants
Institute Country E
0/V
at 5 °C u(E
0) (k=1)
E0/V
at 50 °C u(E
0) (k=1)
BIM/ NCM BG 0.20454 0.0002
PTB DE 0.234111 0.000054 0.204456 0.000062
NMIJ JP 0.234082 0.000042 0.204494 0.000052
GUM PL 0.234082 0.000041 0.204525 0.000026
NIMT TH 0.214921 0.000026 0.203801 0.000028
UME TR 0.2344227 0.0000383 0.2045240 0.0000429
UMTS UA 0.23369 0.00010 0.20404 0.00010
NIST USA 0.234029 0.000012 0.204440 0.000036
Tab 8: Standard potential of the Ag/AgCl electrodes at 5 °C and 50 °C as reported by the participants

- 13 -
Institute Country u(intercept) Slope (extrapolation)
15 °C 25 °C 37 °C 15 °C 25 °C 37 °C
BIM/ NCM BG 0.001 0.0008 0.0005 -1.488 -1.073 -1.14
INMETRO BR 0.0010 0.0011 0.0021 -0.8740 -0.9446 -0.7864
CMI CZ 0.001 0.0011 0.0019 -1.0662 -1.1805 -1.1874
DFM DK 0.00078 0.0007605 0.0007653 -1.129 -1.052 -1.052
PTB DE 0.00050 0.00045 0.00039 -0.99 -1.00 -1.00
MKEH HU 0.00046 0.00152 0.001648 -0.4131 -0.4681 -0.527
NMIJ JP 0.00033 0.00021 0.00022 -1.1324 -1.1226 -1.1307
CENAM MX 0.0014 0.0020 0.0021 -1.135512 -1.1028012 -1.386604
GUM PL 0.000586 0.0007922 0.0011771 -0.5554503 -0.6981866 -0.5829760
VNIIFTRI RU 0.0006 0.0008 0.001 -0.975 -0.894 -0.765
SMU SK 0.001 0.001077 0.0015869 -0.6879 -0.6894 -0.8875
NIMT TH 0.017 0.009922 0.0024868 -1.1174 -0.5221 -0.5283
UME TR 0.00043 0.00038 0.00049 -1.4668 -1.5334 -0.8702
UMTS UA 0.0020 0.0013 0.0012 -1.56 -1.15 -1.38
NIST US 0.00068 0.00058 0.00052 -1.123492 -1.122049 -1.105089
Tab 9: Uncertainty of the intercept and slope of the regression line obtained from linear extrapolation
of the acidity function pa to mCl = 0 at 15 °C, 25 °C and 37 °C
Institute Country u(intercept) Slope (extrapolation)
5 °C 50 °C 5 °C 50 °C
BIM/ NCM BG 0.0008 -0.780
PTB DE 0.00055259 0.00040 -0.99 -1.02
NMIJ JP 0.00033 0.00031 -1.1343 -1.1404
GUM PL 0.00042 0.00196 -0.929167719 -0.531116
NIMT TH 0.008 0.0041 -0.3781 -0.7199
UME TR 0.00042 0.00014 -1.6169 -0.5352
UMTS UA 0.0016 0.0029 -1.23 -1.07
NIST USA 0.0008 0.00072 -1.163131 -1.060613
Tab 10: Uncertainty of the intercept and slope of the regression line obtained from linear extrapolation
of the acidity function pa to mCl = 0 at 5 °C and 50 °C

- 14 -
Tab.11: HCl molality and method of standardization
Calculation of the KCRV and its uncertainty
Three possibilities for determination of the KCRV are listed in Table 12 and 13. For all estimators the institutes
using a secondary setup INDECOPI, LATU, IBMETRO were omitted from the calculation of the KCRV. A common consistency check was performed based on a CCQM guide (CCQM Guidance note: Estimation of a consensus KCRV
and associated Degrees of Equivalence). However based on the procedure shown in this document a consistent
subset among the institutes could not be determined. Therefore, results, which differed considerably from the
bulk of the results – as can be seen from the figures 6-10 – were considered to be outliers. NIMT results were
considered to be outlier at all temperatures and therefore also have been omitted for the calculation of the KCRV.
UME results were considered to be outlier at 15 °C, 37 °C and 50 °C and were therefore omitted for the
calculation of the KCRV at these temperatures. NIMT and UME agreed on this decision. The standard deviation for
the estimators at all temperatures after rejection of the outliers is considerably smaller as for the estimators
containing all results.
15 °C 25 °C 37 °C
Estimator Value u (k = 1) Value u (k = 1) Value u (k = 1)
Mean 7.5563 0.0013 7.5241 0.0007 7.4993 0.0011
Median 7.5561 0.0003 7.5235 0.0008 7.5005 0.0018 uncertainty
weighted
mean 7.5561 0.0003 7.5246 0.0003 7.5013 0.0004
Birge ratio 2.54 2.51 2.57
Tab.12: Values of candidate estimator for the KCRV at 15 °C, 25 °C and 37 °C for CQQM-K99
NMI HCl molality mCl (mol kg
-1)
Standardization technique for HCl
BIM/ NCM 0.0100 potentiometric titration CENAM 0.0101 coulometry CMI 0.0100 coulometry DFM 0.0099996 Coulometry + gravimetric dilution GUM 0.0100 coulometry INMETRO 0.0099968 coulometry MKEH 0.010005 coulometry NIMT 0.0101 potentiometric titration NIST 0.0100 coulometry NMIJ 0.010000 coulometry PTB 0.0100 coulometry SMU 0.0100 coulometry UMTS 0.01000 coulometry UME 0.01000 coulometry VNIIFTRI 0.0100 coulometry

- 15 - 5 °C 50 °C
Estimator Value u (k = 1) Value u (k = 1)
Mean 7.6049 0.0018 7.4916 0.0039
Median 7.6050 0.0029 7.4964 0.0076 uncertainty
weighted
mean 7.6043 0.0005 7.4960 0.0006
Birge ratio 3.16 5.10
Tab.13: Values of candidate estimator for the KCRV for CQQM-K99 at 5 °C and 50 °C
The uncertainty weighted mean pa0
R was agreed on at the EAWG meeting in the frame of the CCQM meeting in
Paris (16./17.04.2015). For CCQM-K99 it was calculated using Eq4. Where N is the number of participants, wi is the
normalized weight for participant i, and pa0
i is the result for participant i.
∑=
=N
iiiR awa
1
00 pp (4)
The weight wi is given by Eq 5 and 6, where u(xi) is the standard uncertainty for participant i:
2)( ii xu
Cw = (5)
∑=
=N
i ixu
C
12)(
11
(6)
The values of u(xi) are the individual uncertainties and C is the variance. The uncertainty of the weighted mean
was determined by the external consistency method (uncertainty –weighted mean). uR(pa0
R) is given by Eq 7.
( )∑⋅−
∑ −=
=
=N
ii
N
iRii
wN
aawau
R
1
1
200
0R
)1(
pp)p( (7)
As for CCQM-K17 the Birge approach is used again to test if there is the possibility that some or all of the
individual uncertainties have been underestimated. When applying this test, the uncertainty of the KCRV as
determined from the individual uncertainties stated by the participants (the internal consistency of the data, equation (8)) are compared to the external consistency taking into account how much each result deviates from
the KCRV in relation to its uncertainty.
( ) CauRm =0p
(8)
The Birge ratio R = uR/um calculated for the CCQM-K99 is always larger than one as given in tables 12 and 13, indicating that the external consistency method yields a better estimate of the uncertainty of the results than
does the internal consistency method. Therefore the calculated values of uR(pa0
R) were taken as the standard
uncertainty of the KCRV, u(KCRV). The final value of the KCRV and its standard uncertainty (k =1) is listed for each
temperature in table 14.

- 16 -
15 °C 25 °C 37 °C 5 °C 50 °C KCRV u(k = 1) KCRV u(k = 1) KCRV u(k = 1) KCRV u(k = 1) KCRV u(k = 1)
7.5561 0.0009 7.5246 0.0008 7.5013 0.0009 7.6043 0.0015 7.4960 0.0029
Tab. 14: KCRV and its standard uncertainty, U(k=1), for CCQM-K99
Calculation of the degrees of equivalence
The degree of equivalence for each participant, Di, and its standard uncertainty, u (Di), are given by Eq 9 and Eq
10.
( )KCRVp 0 −= ii aD (9)
( ) ( )022 21)KCRV()( iicorricorr pauwuDu ⋅⋅−+= (10)
Values for Di and u(Di) are given in Table 15 and 16
Institute Country Di
at 15 °C U (k=2)
Di
at 25 °C U (k=2)
Di
at 37 °C U (k=2)
BIM/ NCM BG -0.0008 0.0043 -0.0018 0.0042 -0.0062 0.0043
IBMETRO BO 0.0030
INMETRO BR 0.0021 0.0030 0.0009 0.0029 -0.0007 0.0047
CMI CZ 0.0024 0.0030 0.0041 0.0028 -0.0059 0.0043
DFM DK 0.0002 0.0022 -0.0014 0.0020 0.0008 0.0022
PTB DE -0.0008 0.0027 -0.0011 0.0026 0.0014 0.0027
MKEH HU -0.0003 0.0062 -0.0020 0.0067 -0.0040 0.0070
NMIJ JP -0.0000 0.0025 -0.0010 0.0024 0.0012 0.0026
CENAM MX -0.0001 0.0035 -0.0007 0.0056 -0.0040 0.0051
INDECOPI PE -0.0019 0.0043 -0.0037 0.0042 0.0001 0.0043
GUM PL -0.0087 0.0030 -0.0068 0.0031 -0.0096 0.0036
VNIIFTRI RU -0.0041 0.0043 -0.0056 0.0044 -0.0043 0.0049
SMU SK -0.0007 0.0035 -0.0026 0.0033 -0.0008 0.0041
NIMT TH -0.0555 0.0394 -0.0567 0.0286 -0.0531 0.0221
UME TR -0.0224 0.0025 0.0045 0.0023 -0.0201 0.0026
UMTS UA 0.0122 0.0058 0.0049 0.0044 0.0042 0.0045
LATU UY -0.0040 0.0101 0.0016 0.0101
NIST US 0.0017 0.0022 0.0010 0.0021 0.0023 0.0022
Tab.15: Degrees of equivalence and its uncertainty at 15 °C, 25 °C and 37 °C

- 17 -
Institute Country Di
at 5 °C U (k=2)
Di
at 50 °C U (k=2)
BIM/ NCM BG -0.0121 0.0071
PTB DE 0.0019 0.0036 0.0021 0.0060
NMIJ JP -0.0006 0.0036 0.0023 0.0059
GUM PL -0.0060 0.0039 -0.0204 0.0071
NIMT TH -0.0319 0.0172 -0.0615 0.0102
UME TR -0.0024 0.0034 -0.0409 0.0058
UMTS UA 0.0065 0.0059 -0.0013 0.0088
NIST US 0.0039 0.0034 0.0030 0.0059
Tab.16: Degrees of equivalence and its uncertainty at 5 °C and 50 °C
Conclusions More work is required to be done for temperatures far deviating from 25°C to reduce the spread of results. Some
of the participants obviously underestimated their uncertainties especially at measurement temperatures of 5 °C
and 50 °C.
How far the light shines Phosphate reference buffer solutions are widely used as pH standards in the neutral range. In this comparison the
participants have demonstrated their capability to measure the pH value of a phosphate buffer in the range
between pH (25 °C) = 6.8 to 7.5. This statement is valid for the temperature range from 5°C to 50°C, however,
regarding the assessment of CMCs it must be emphasized that the corresponding measurement uncertainties
increase at 5°C and 50°C. Consequently, CMC uncertainties must consider the temperature dependence in case.
Figures
Fig 6: CCQM-K99 pa0 at 15 °C. The standard uncertainty (k=1) is given.
Red line: KCRV and dotted lines: uncertainty of the KCRV (k = 1).
7,500
7,510
7,520
7,530
7,540
7,550
7,560
7,570
7,580
pa
0
CCQM-K99 Acidity function at 15 °C

- 18 -
Fig. 7: CCQM-K99 pa0 at 25 °C. The standard uncertainty (k=1) is given.
Red line: KCRV and dotted lines: uncertainty of the KCRV (k = 1).
Fig. 8: CCQM-K91 pa0 at 37 °C. The standard uncertainty (k=1) is given.
Red line: KCRV and dotted lines: uncertainty of the KCRV (k = 1).
Fig. 9: CCQM-K99 pa0 at 5 °C. The standard uncertainty (k=1) is given.
Red line: KCRV and dotted lines: uncertainty of the KCRV (k =1).
7,460
7,470
7,480
7,490
7,500
7,510
7,520
7,530
7,540
pa
0
CCQM-K99 Acidity function at 25 °C
7,420
7,440
7,460
7,480
7,500
7,520
pa
0
CCQM-K99 Acidity function at 37 °C
7,550
7,560
7,570
7,580
7,590
7,600
7,610
7,620
pa
0
CCQM-K99 Acidity function at 5 °C

- 19 -
Fig. 10: CCQM-K99 pa0 at 50 °C. The standard uncertainty (k=1) is given.
Red line: KCRV and dotted lines: uncertainty of the KCRV (k = 1).
Fig. 11: Standard potential of the Ag/AgCl electrodes at 25 °C. The result of NIMT is out of range.
7,410
7,430
7,450
7,470
7,490
7,510
pa
0
CCQM-K99 Acidity function at 50 °C
0,221
0,2215
0,222
0,2225
0,223
E0/V
CCQM-K99 E0/V at 25 °C

- 20 -
Fig. 12: Standard uncertainty (k = 1) of the regression line at 15 °C, 25 °C and 37 °C
Fig. 13: Standard uncertainty (k = 1) of the regression line at 5 °C and 50 °C
0
0,005
0,01
0,015
0,02
u(l
ine
ar
ex
tra
po
lati
on
)CCQM-K99 uncertainty of linear extrapolation
at 15 °C, 25 °C and 37 °C
15 °C
25 °C
37 °C
0
0,001
0,002
0,003
0,004
0,005
0,006
0,007
0,008
0,009
u(l
ine
ar
ex
tra
po
lati
on
)
CCQM-K99 uncertainty of linear extrapolation
at 5 °C and 50 °C
5 °C
50 °C

- 21 -
Fig. 14: Slope of the regression line at 15°C, 25 °C and 37 °C
Fig. 15: Slope of the regression line at 5°C and 50 °C
-1,800
-1,600
-1,400
-1,200
-1,000
-0,800
-0,600
-0,400
-0,200
0,000
slo
pe
(e
xtr
ap
ola
tio
n)
CCQM-K99 slope of linear extrapolation
at 15 °C, 25 °C and 37 °C
15 °C
25 °C
37 °C
-2
-1,8
-1,6
-1,4
-1,2
-1
-0,8
-0,6
-0,4
-0,2
0
slo
pe
(e
xtr
ap
ola
tio
n)
CCQM-K99 slope of linear extrapolation
at 5 °C and 50 °C
5 °C
50 °C

- 22 -
Fig. 16: Degree of Equivalence and its uncertainty (k = 2) at 15 °C.
Fig. 17: Degree of Equivalence and its uncertainty (k = 2) at 25 °C.
Fig. 18: Degree of Equivalence and its uncertainty (k = 2) at 37 °C.
-0,100-0,080-0,060-0,040-0,0200,0000,0200,040
Di
Degree of equivalence at 15 °C
-0,100
-0,080
-0,060
-0,040
-0,020
0,000
0,020
0,040
Di
Degree of equivalence at 25 °C
-0,100
-0,080
-0,060
-0,040
-0,020
0,000
0,020
0,040
Di
Degree of equivalence at 37 °C

- 23 -
Fig. 19: Degree of Equivalence and its uncertainty (k = 2) at 5 °C.
Fig. 20: Degree of Equivalence and its uncertainty (k = 2) at 50 °C.
-0,050
-0,030
-0,010
0,010
0,030
0,050D
iDegree of equivalence at 5 °C
-0,100
-0,080
-0,060
-0,040
-0,020
0,000
0,020
0,040
Di
Degree of equivalence at 50 °C


![40th meeting of the JCRB - BIPM - BIPM · [The corresponding BIPM presentation is available on the restricted-access JCRB working documents webpage as JCRB-40/03.1.] 3.2. BIPM QMS](https://static.fdocuments.net/doc/165x107/6047869895787e1e9f1920f7/40th-meeting-of-the-jcrb-bipm-bipm-the-corresponding-bipm-presentation-is-available.jpg)


