CCM 03.13.17 Item #7 1st Qtrly Report 17
13
Presented By: Robert Galindo, Finance Director Item # 7 City Council Meeting March 13, 2017 QUARTERLY FINANCIAL REPORT AS OF DECEMBER 30, 2016
-
Upload
marian-vargas-mendoza -
Category
Government & Nonprofit
-
view
18 -
download
2
Transcript of CCM 03.13.17 Item #7 1st Qtrly Report 17
Presented By: Robert Galindo, Finance DirectorItem # 7
City Council MeetingMarch 13, 2017
QUARTERLY FINANCIAL REPORT AS OF DECEMBER 30, 2016
1st Quarter Financial Report 2
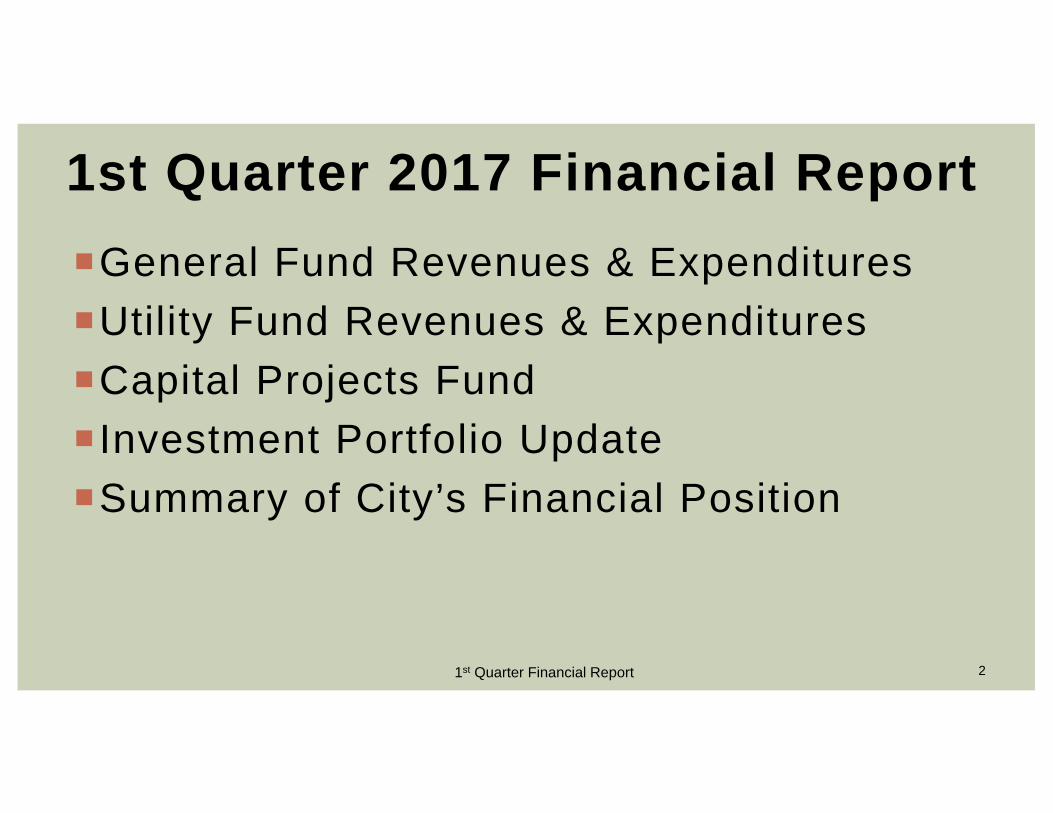
General Fund Revenues & ExpendituresUtility Fund Revenues & ExpendituresCapital Projects Fund Investment Portfolio UpdateSummary of City’s Financial Position
1st Quarter 2017 Financial Report

1st Quarter Financial Report 3
General Fund Revenues FY 2016-17FY 2016-17 FY 2016-17 FY 2016-17 FY 2015-16
BUDGET 3 MONTHS % BUDGET 3 MONTHS
PROPERTY TAXES $ 5,278,902 $ 3,061,615 1 58% $ 3,041,605 SALES TAX 981,000 235,843 24% 219,695 OTHER TAXES 891,700 232,199 26% 228,483 TOTAL TAXES $ 7,151,602 $ 3,529,657 49% $ 3,489,783PERMITS & FEES 477,200 210,089 44% 154,934INTERGOVERNMENTAL 473,223 122,723 26% 117,947CHARGES FOR SERVICES 1,232,000 249,796 20% 244,058FINES AND FORFEITURES 337,726 61,548 18% 64,259INVESTMENTS 29,000 8,253 28% 3,973MISCELLANEOUS 88,510 21,524 24% 20,398OTHER FINANCING SOURCES 71,471 25 0% 0
TOTAL REVENUES $ 9,860,732 $ 4,203,615 43% $ 4,095,351
1. This is the General Fund portion. The Debt Service fund received $524,218 in property tax revenue.

1st Quarter Financial Report 4Property tax collections from FY15 to FY12 are for the whole fiscal year.
Budget to Actual 1st Quarter FY 2016-17

1st Quarter Financial Report 5
Includes both General Fund and Street Maintenance tax collections by month

1st Quarter Financial Report 6
General Fund ExpendituresFY 2016-17 FY 2016-17 FY 2016-17 FY 2015-16BUDGET 3 MONTHS % BUDGET 3 MONTHS
ADMINISTRATION & FINANCE $ 1,926,189 $ 344,777 18% $ 310,683COMMUNITY DEVELOPMENT 439,987 77,931 18% 83,810FIRE/EMS 2,762,839 591,443 21% 654,059POLICE / DISPATCH 2,973,584 729,121 25% 681,135PUBLIC WORKS 1,677,983 384,276 23% 375,339
TOTAL EXPENDITURES $ 9,780,582 $ 2,127,547 22% $ 2,105,026
OPERATING OVER/UNDER $ 80,150 $ 2,076,068 $ 1,990,325
City of Alamo Heights
Expenditures for the General Fund were within budget.

1st Quarter Financial Report 7

1st Quarter Financial Report 8
Utility Fund Revenues & Expendituresas of December 31, 2016
FY 2016-17 FY 2016-17 FY 2016-17 FY 2015-16BUDGET 3 MONTHS % BUDGET 3 MONTHS
WATER $ 1,884,900 $ 470,428 25% $ 482,614SEWER 1,670,088 374,378 22% 354,184
TOTAL REVENUES $ 3,554,988 $ 844,806 24% $ 836,798
WATER $ 1,727,215 $ 331,141 19% $ 321,593 SEWER 1,234,000 222,593 18% 205,561 CAPITAL EXPENDITURES 427,000 30,404 7% 20,104TRANSFERS 70,471 0 0% 0
TOTAL EXPENDITURES $ 3,458,686 $ 584,138 17% $ 547,257
OPERATING OVER/UNDER $ 96,302 $ 260,668 $ 289,541

1st Quarter Financial Report 9
Capital Projects Fund as of December 31, 2016
FY 2016-17 FY 2016-17YTD TOTAL BUDGET
BEGINNING BALANCE $ 961,694 $ 957,406
REVENUES TRANSFERS FROM GF 0 0
TOTAL REVENUES $ 0 $ 0
EXPENSES
CITY PROJECTS* 100,000 100,000
TOTAL EXPENDITURES $ 100,000 $ 100,000
FUND BALANCE $ 861,694 $ 857,406
Note: * City Projects are for City Branding and Trolley Stop

10
Investment Portfolio Update
CERTIFICATES OF DEPOSIT GENERATIONS FCU 1.15% 01/06/17 232,439 2%SAVINGS ACCOUNTS JEFFERSON BANK* 0.25% 3,190,959 34%POOLS LONE STAR 1,933,584 LOGIC 1,611,430 TEX STAR 30,485 TEXPOOL INVESTMENT 2,259 SUBTOTAL 3,577,757 38%OPERATING ACCOUNT FROST BANK* non-interest bearing 2,504,467 SUBTOTAL 2,504,467 27%TOTAL INVESTMENT PORTFOLIO AS OF SEPTEMBER 30, 2016 9,505,623 100% (Cash Balance)
* Frost Bank and Jefferson Bank pledge securities in the name of the City of Alamo Heights sufficient to cover balances which are not covered by FDIC
1st Quarter Financial Report

Beginning Value as of October 1, 2016 7,029,715$ .
Changes Market Value Fluctuations 0Net Increase (Decrease) to Pool Accounts 705,627 Net Increase (Decrease) to CD's 665Net Increase (Decrease) to Savings Account 1,961Net Increase (Decrease) to Operating Account 1,767,655Net Amortization of Premium and Discounts - Maturities - Purchases -
Ending Value as of December 31, 2016 9,505,623$
Investment Portfolio Update (Cont.)
1st Quarter Financial Report 11

90 Day Treasury .50% Average Yield 0.43%Savings Account 0.25%CD 1.15%Investment Pools 65.48%Operating Account 0.00%
Weighted Average Maturity Maximum 365 days 24
DiversificationCertificates of Deposit Maximum 100% 2%Savings Account Maximum 100% 34%U.S. Agencies Maximum 100% 0%Operating Account Maximum 100% 27%Investment Pools Maximum 100% 38%
Maximum Days to Maturity (as of purchase date) U. S. Agencies Maximum 1,095 days 0
Certificates of Deposit Maximum 360 days 6
This report is in full compliance with the investment strategies as established by the City of Alamo HeightsInvestment Policy and the Public Funds Investment Act (Chapter 2256).
Investment Portfolio Update (Cont.)
1st Quarter Financial Report 12

1st Quarter Financial Report 13
Summary of City’s Financial PositionPERFORMANCE SUMMARY FOR THE 1st QUARTER OR 25% OF BUDGET
% Current Quarter YTD QuarterGENERAL FUNDTotal Revenues as % of Budget 43% Positive PositiveTotal Expenditures as % of Budget 22% Positive PositiveTotal Property Tax Collections 58% Positive PositiveSales Tax Revenues Analysis 24% Positive Positive
ENTERPRISE FUNDUtility Fund Revenues as % of Budget 24% Positive PositiveUtility Fund Expenditures as % of Budget 17% Positive Positive