CCIF MPA Financial Mgmt Tool Manual - Conservation and …cciforum.org/pdfs/CCIF MPA Financial Mgmt...
46
CCIF MPA Financial Management Tool Manual Version 1.0 October 2008
Transcript of CCIF MPA Financial Mgmt Tool Manual - Conservation and …cciforum.org/pdfs/CCIF MPA Financial Mgmt...
CCIF MPA Financial
Management Tool
Manual
Version 1.0
October 2008
2
CCIF MPA Financial Management Tool Manual October 2008, © CCIF The CCIF MPA Financial Management Tool Manual was developed to guide users of the MPA Financial Management Tool (Excel version). The manual and tool was developed with funding and support from The David and Lucile Packard Foundation, Duke University’s MEBM Tool Innovation Fund, and the EBM Tools Network. This document is freely available for use by practitioners and other interested parties. Reference or use of this manual or work in written form or otherwise should be properly cited. This document should be cited as: Conservation and Community Investment Forum (CCIF). 2008. CCIF MPA Financial Management Tool Manual. California. For more information, contact: Sarah R. Conway or John D. Claussen, CCIF
Phone: +62-361-285-298 [email protected] [email protected]
3
Table of Contents Background 4-5 Introduction 6-13 Inputs 14-27 Inputs Overview 14 MPA Characteristics 15 Functional Assessment 16 General Assumptions 17 Objectives 18 Personnel 19 Contractors 20 Occupancy 21 Capital Assets 22 Fuel Assumptions 23 Activity Assumptions 24 Activity Inputs 25 Miscellaneous 26 Cash Sources 27 Check Point 28-31 Functional Summary 28-30 Objectives Summary 30-31 Outputs 32-42 Outputs Overview 32 Master Summary 33 MPA Summary 34 Graphs 35 Cost by Function and Budget Category 36 Financial Statements 37 Activity Summary 38 Fuel Summary 39 Endowment 40 Scenario Comparison 41 Model Comparison 42 Glossary 43-46
4
Background B
AC
KG
RO
UN
D
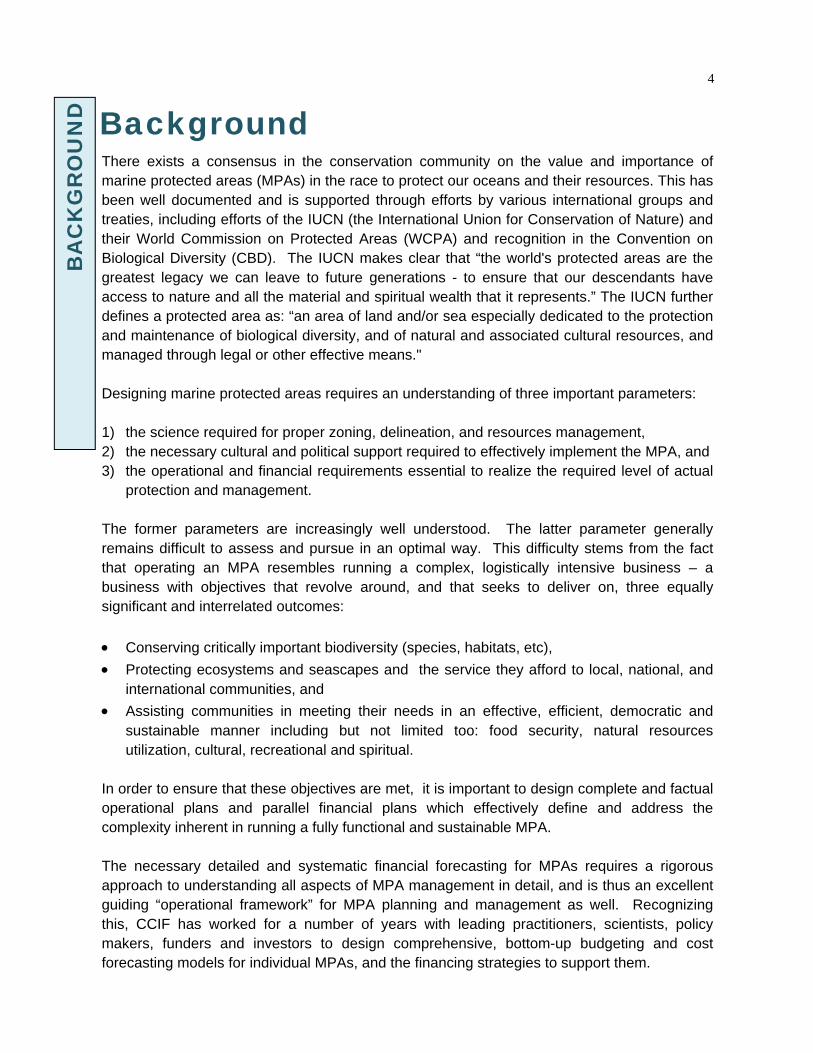
There exists a consensus in the conservation community on the value and importance of marine protected areas (MPAs) in the race to protect our oceans and their resources. This has been well documented and is supported through efforts by various international groups and treaties, including efforts of the IUCN (the International Union for Conservation of Nature) and their World Commission on Protected Areas (WCPA) and recognition in the Convention on Biological Diversity (CBD). The IUCN makes clear that “the world's protected areas are the greatest legacy we can leave to future generations - to ensure that our descendants have access to nature and all the material and spiritual wealth that it represents.” The IUCN further defines a protected area as: “an area of land and/or sea especially dedicated to the protection and maintenance of biological diversity, and of natural and associated cultural resources, and managed through legal or other effective means." Designing marine protected areas requires an understanding of three important parameters: 1) the science required for proper zoning, delineation, and resources management, 2) the necessary cultural and political support required to effectively implement the MPA, and 3) the operational and financial requirements essential to realize the required level of actual
protection and management. The former parameters are increasingly well understood. The latter parameter generally remains difficult to assess and pursue in an optimal way. This difficulty stems from the fact that operating an MPA resembles running a complex, logistically intensive business – a business with objectives that revolve around, and that seeks to deliver on, three equally significant and interrelated outcomes: • Conserving critically important biodiversity (species, habitats, etc), • Protecting ecosystems and seascapes and the service they afford to local, national, and
international communities, and
• Assisting communities in meeting their needs in an effective, efficient, democratic and sustainable manner including but not limited too: food security, natural resources utilization, cultural, recreational and spiritual.
In order to ensure that these objectives are met, it is important to design complete and factual operational plans and parallel financial plans which effectively define and address the complexity inherent in running a fully functional and sustainable MPA. The necessary detailed and systematic financial forecasting for MPAs requires a rigorous approach to understanding all aspects of MPA management in detail, and is thus an excellent guiding “operational framework” for MPA planning and management as well. Recognizing this, CCIF has worked for a number of years with leading practitioners, scientists, policy makers, funders and investors to design comprehensive, bottom-up budgeting and cost forecasting models for individual MPAs, and the financing strategies to support them.

5 B
AC
KG
RO
UN
D
CCIF has recently worked with The David & Lucille Packard Foundation and Duke University applying the rigor and insights of detailed financial analysis and operational design to develop the CCIF MPA Financial Management Tool (“Model”). This Model is designed to maximize both simplicity and ease of use while also documenting all MPA activities in a comprehensive manner. The Model provides a framework that captures both the costs of providing ongoing conservation programs as well as the current and potential revenue and funding sources to cover these costs. It starts by analyzing the current status of functional components, mapping the objectives of the MPA, and focuses the users efforts on identifying the essential functions (science, community, etc) and activities necessary to address these unique characteristics and objectives. Ultimately the Model provides clear analysis and guidance for both practitioners and funders to assist in the development and implementation of successful MPAs over the long run. The Model is useful not only for forecasting the financial requirements and sources for specific MPAs, but also in guiding managers and practitioners on finer points of management and operational plan design and modifications to increase their effectiveness and efficiencies. MPAs only function as conservation tools if they are operated ably and financed in perpetuity. This model should guide management and use of limited financial resources – accelerating the success and performance of MPAs. This Manual provides an introduction and an instructional guide for use of the Model. Sections of this Manual: • Introduction • Inputs • Check-Point • Outputs • Glossary
6
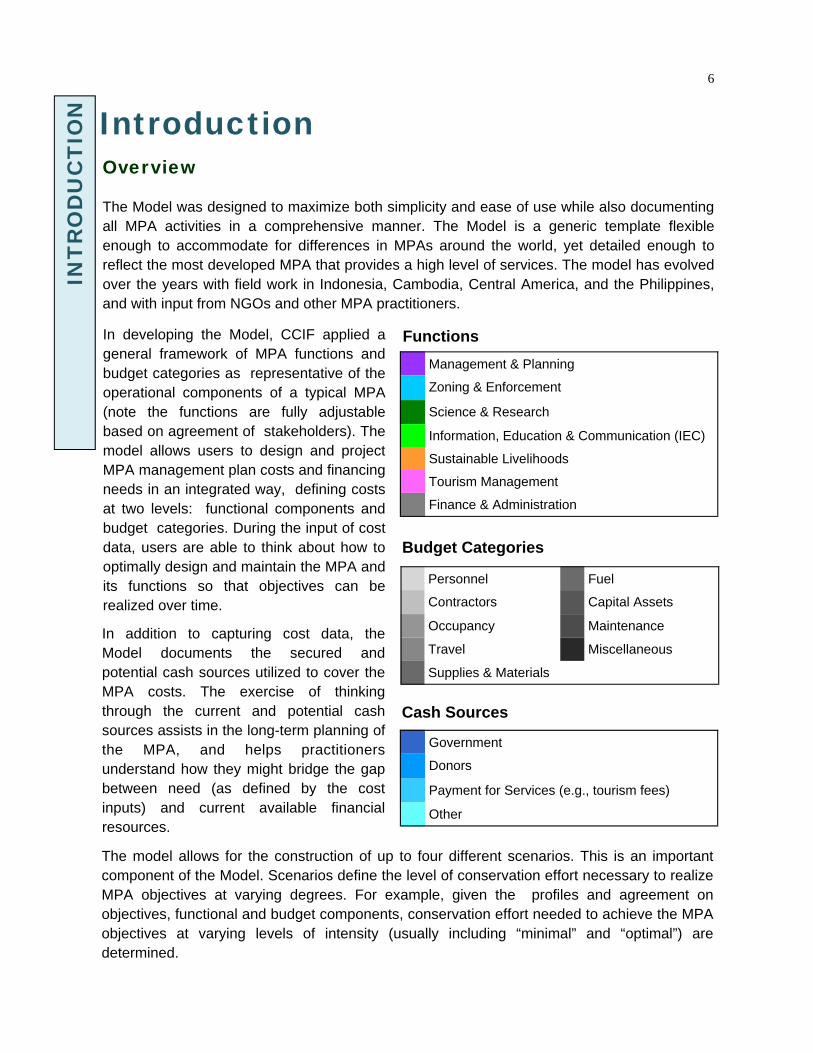
In addition to capturing cost data, the Model documents the secured and potential cash sources utilized to cover the MPA costs. The exercise of thinking through the current and potential cash sources assists in the long-term planning of the MPA, and helps practitioners understand how they might bridge the gap between need (as defined by the cost inputs) and current available financial resources.
The model allows for the construction of up to four different scenarios. This is an important component of the Model. Scenarios define the level of conservation effort necessary to realize MPA objectives at varying degrees. For example, given the profiles and agreement on objectives, functional and budget components, conservation effort needed to achieve the MPA objectives at varying levels of intensity (usually including “minimal” and “optimal”) are determined.
Introduction Overview The Model was designed to maximize both simplicity and ease of use while also documenting all MPA activities in a comprehensive manner. The Model is a generic template flexible enough to accommodate for differences in MPAs around the world, yet detailed enough to reflect the most developed MPA that provides a high level of services. The model has evolved over the years with field work in Indonesia, Cambodia, Central America, and the Philippines, and with input from NGOs and other MPA practitioners.
In developing the Model, CCIF applied a general framework of MPA functions and budget categories as representative of the operational components of a typical MPA (note the functions are fully adjustable based on agreement of stakeholders). The model allows users to design and project MPA management plan costs and financing needs in an integrated way, defining costs at two levels: functional components and budget categories. During the input of cost data, users are able to think about how to optimally design and maintain the MPA and its functions so that objectives can be realized over time.
Management & Planning
Zoning & Enforcement
Science & Research
Information, Education & Communication (IEC)
Sustainable Livelihoods
Tourism Management
Finance & Administration
Functions
Budget Categories
Personnel Fuel
Contractors Capital Assets
Occupancy Maintenance
Travel Miscellaneous
Supplies & Materials
INT
RO
DU
CT
ION
Government
Donors
Payment for Services (e.g., tourism fees)
Other
Cash Sources

7
Model Structure
INPUTS
MPA Characteristics
Functional Assessment
General
Objectives
OUTPUTS
Master Summary
MPA Summary
Graphs
Cost by Function & Budget
Financial Statements
Activity Summary
Fuel Summary
Endowment Calculation
Scenario Comparison
Model Comparison
CHECK POINT
Functional Summary
Objectives Summary
The Model is broken down into three primary components: inputs, check point, and outputs. During the input section, users must provide inputs for a variety of topics and in a variety of formats. During the check point, users are given the opportunity to review key areas of their MPA to determine if optimization opportunities exist. Users can then revise their inputs or proceed to the outputs. The outputs section provides users with information in a variety of formats, including charts and graphs. An overview of the process is provided below.
Inputs The input tabs require a variety of information related to the current and planned MPA activities and programs. The first three input tabs capture the current functional situation, unique circumstances, and objectives. The process of thinking through and entering the functional information, MPA characteristics, and objectives gives practitioners a clear understanding and framework to utilize while completing the other inputs. In other words, this information defines the operational and programmatic needs of the MPA, and helps define scenarios from which to build upon. The rest of the input tabs capture the cost and cash source data necessary to ensure that the objectives are met and that all of the unique circumstances are accounted for in the design and management of the MPA. The information necessary to complete the model should be accessible from various MPA stakeholders and practitioners. For example, the cost information should be accessible from the finance team, while the ecological data necessary to complete the MPA characteristics tab should be accessible by the science & research team.
INT
RO
DU
CT
ION
Personnel
Contractors
Occupancy
Capital Assets
Fuel Cost Assumptions
Activity Assumptions
Activity Inputs
Miscellaneous
Cash Sources

8
Check Point The check-point provides two analysis tools that aim to help practitioners better understand how to optimize their use of financial and physical resources. Once users have reviewed these tabs they are encouraged to revise their input tabs before proceeding to the other outputs. The analysis tools and a brief description of each is provided below:
Outputs
The projections and outputs are provided in a variety of formats (e.g., charts, graphs, financial statements) and in a variety of ways (e.g., costs broken down by functional components or budget categories, costs in dollar values or percentages of total cost). The outputs are organized in a framework that helps to focus the design and management of MPAs. While there is a great deal of flexibility in how the outputs are presented, the majority of them are broken down by MPA function or MPA budget category. This provides a clear and transparent overview of the functional efforts and primary cost drivers of a given MPA. These outputs can be used for a variety of purposes, including: • Creation or revision of a Management Plan • Creation or revision of a Financing Plan • Creation or revision of an Endowment Fund (Conservation Trust Fund) Business Plan • Management effectiveness review • Donor proposals • Donor reports • Yearly program reports Additional Definitions Additional definitions and overviews of the functions, objectives, and scenarios are provided next, followed by tables detailing out the inputs and outputs.
COMPONENT DESCRIPTION
Functional Analysis
The Functional Analysis generates outputs from the Functional input page as well as from other input sheets. This provides users with an overview of their current functional status as well as the current financial implication of each function. This feedback is useful in deciding how to better allocate additional financial resources or how to revise the current allocation.
Objectives Review
The Objectives Summary translates the objectives into the functional activities required to achieve the objectives. Below this are two pie charts, the first representing the total MPA cost broken down by function, and the second representing the activity costs broken down by function, both during the first year. This feedback is useful for understanding how the objectives match up with spending habits; recognizing that realizing certain objectives may or may not be linked with financial resources, this aims to highlight any potentially large discrepancies between financial resource allocation and objectives.
INT
RO
DU
CT
ION
9
Function Descriptions
INT
RO
DU
CT
ION
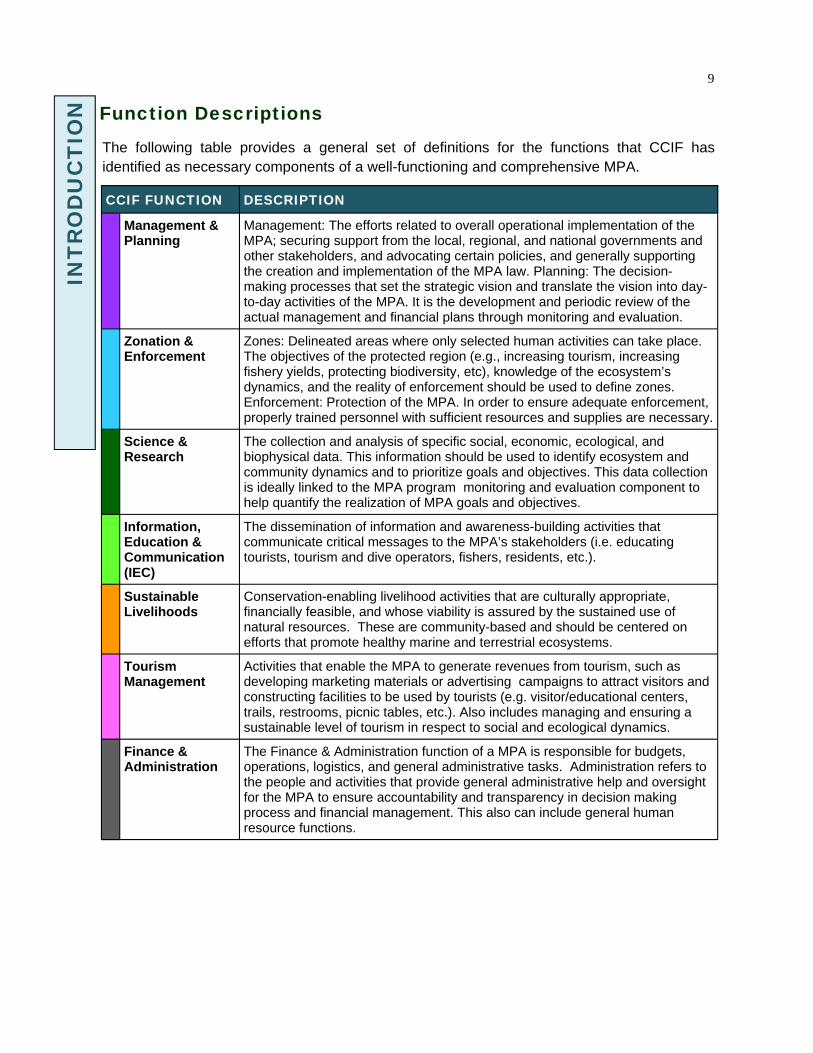
The following table provides a general set of definitions for the functions that CCIF has identified as necessary components of a well-functioning and comprehensive MPA.
DESCRIPTION
Management & Planning
Management: The efforts related to overall operational implementation of the MPA; securing support from the local, regional, and national governments and other stakeholders, and advocating certain policies, and generally supporting the creation and implementation of the MPA law. Planning: The decision-making processes that set the strategic vision and translate the vision into day-to-day activities of the MPA. It is the development and periodic review of the actual management and financial plans through monitoring and evaluation.
Zonation & Enforcement
Zones: Delineated areas where only selected human activities can take place. The objectives of the protected region (e.g., increasing tourism, increasing fishery yields, protecting biodiversity, etc), knowledge of the ecosystem’s dynamics, and the reality of enforcement should be used to define zones. Enforcement: Protection of the MPA. In order to ensure adequate enforcement, properly trained personnel with sufficient resources and supplies are necessary.
Science & Research
The collection and analysis of specific social, economic, ecological, and biophysical data. This information should be used to identify ecosystem and community dynamics and to prioritize goals and objectives. This data collection is ideally linked to the MPA program monitoring and evaluation component to help quantify the realization of MPA goals and objectives.
Information, Education & Communication (IEC)
The dissemination of information and awareness-building activities that communicate critical messages to the MPA’s stakeholders (i.e. educating tourists, tourism and dive operators, fishers, residents, etc.).
Sustainable Livelihoods
Conservation-enabling livelihood activities that are culturally appropriate, financially feasible, and whose viability is assured by the sustained use of natural resources. These are community-based and should be centered on efforts that promote healthy marine and terrestrial ecosystems.
Tourism Management
Activities that enable the MPA to generate revenues from tourism, such as developing marketing materials or advertising campaigns to attract visitors and constructing facilities to be used by tourists (e.g. visitor/educational centers, trails, restrooms, picnic tables, etc.). Also includes managing and ensuring a sustainable level of tourism in respect to social and ecological dynamics.
Finance & Administration
The Finance & Administration function of a MPA is responsible for budgets, operations, logistics, and general administrative tasks. Administration refers to the people and activities that provide general administrative help and oversight for the MPA to ensure accountability and transparency in decision making process and financial management. This also can include general human resource functions.
CCIF FUNCTION
10 IN
TR
OD
UC
TIO
N
Scenario Description
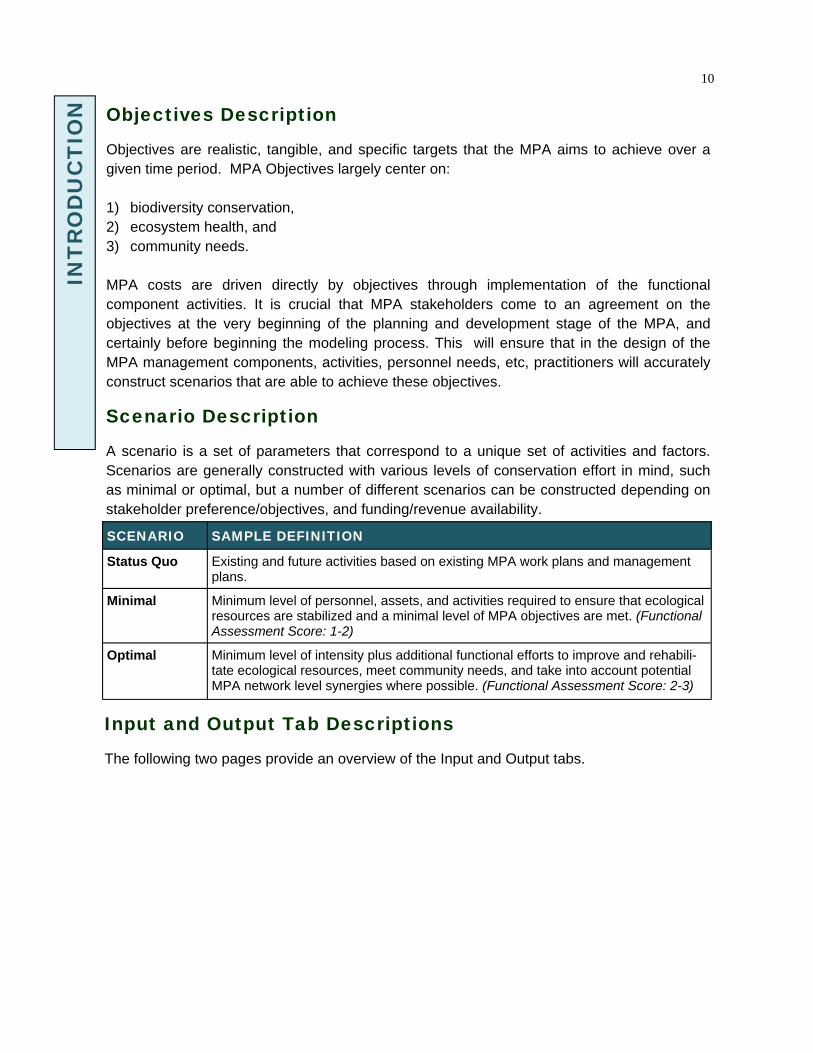
A scenario is a set of parameters that correspond to a unique set of activities and factors. Scenarios are generally constructed with various levels of conservation effort in mind, such as minimal or optimal, but a number of different scenarios can be constructed depending on stakeholder preference/objectives, and funding/revenue availability.
SCENARIO SAMPLE DEFINITION
Status Quo Existing and future activities based on existing MPA work plans and management plans.
Minimal Minimum level of personnel, assets, and activities required to ensure that ecological resources are stabilized and a minimal level of MPA objectives are met. (Functional Assessment Score: 1-2)
Optimal Minimum level of intensity plus additional functional efforts to improve and rehabili-tate ecological resources, meet community needs, and take into account potential MPA network level synergies where possible. (Functional Assessment Score: 2-3)
Objectives Description
Objectives are realistic, tangible, and specific targets that the MPA aims to achieve over a given time period. MPA Objectives largely center on: 1) biodiversity conservation, 2) ecosystem health, and 3) community needs. MPA costs are driven directly by objectives through implementation of the functional component activities. It is crucial that MPA stakeholders come to an agreement on the objectives at the very beginning of the planning and development stage of the MPA, and certainly before beginning the modeling process. This will ensure that in the design of the MPA management components, activities, personnel needs, etc, practitioners will accurately construct scenarios that are able to achieve these objectives.
Input and Output Tab Descriptions
The following two pages provide an overview of the Input and Output tabs.
11
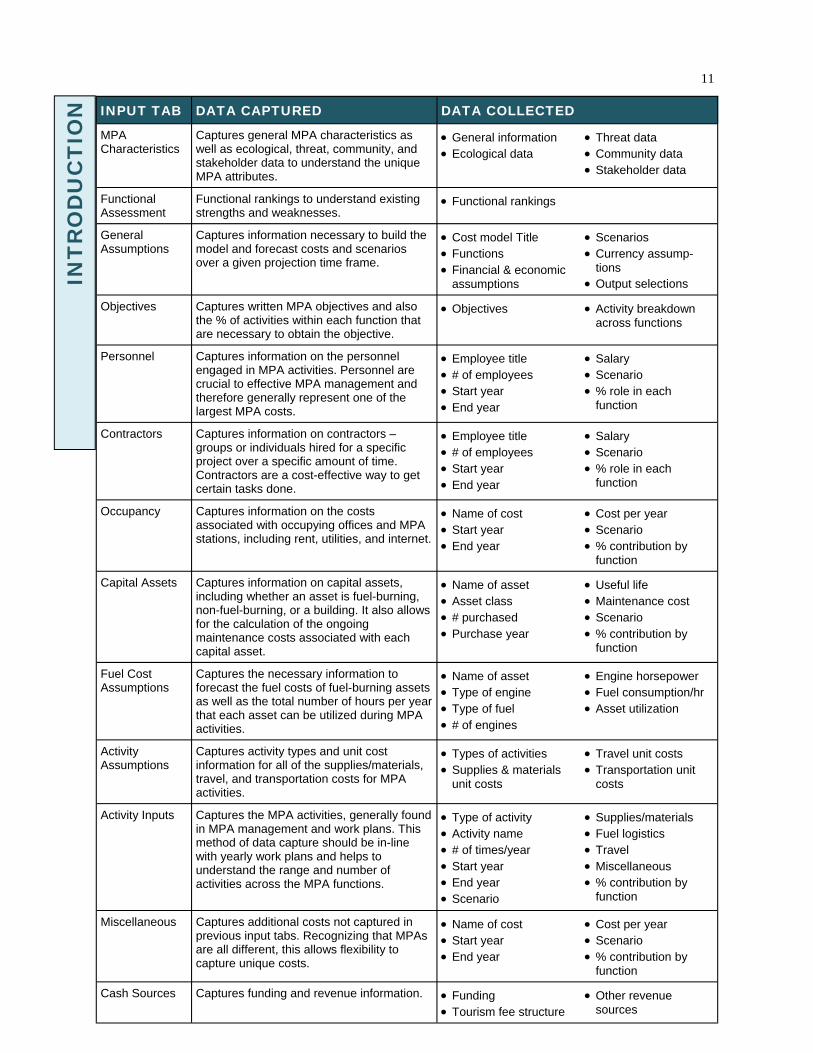
INPUT TAB DATA CAPTURED DATA COLLECTED
MPA Characteristics
Captures general MPA characteristics as well as ecological, threat, community, and stakeholder data to understand the unique MPA attributes.
• General information • Ecological data
• Threat data • Community data • Stakeholder data
Functional Assessment
Functional rankings to understand existing strengths and weaknesses.
• Functional rankings
General Assumptions
Captures information necessary to build the model and forecast costs and scenarios over a given projection time frame.
• Cost model Title • Functions • Financial & economic
assumptions
• Scenarios • Currency assump-
tions • Output selections
Objectives Captures written MPA objectives and also the % of activities within each function that are necessary to obtain the objective.
• Objectives • Activity breakdown across functions
Personnel Captures information on the personnel engaged in MPA activities. Personnel are crucial to effective MPA management and therefore generally represent one of the largest MPA costs.
• Employee title • # of employees • Start year • End year
• Salary • Scenario • % role in each
function
Contractors Captures information on contractors – groups or individuals hired for a specific project over a specific amount of time. Contractors are a cost-effective way to get certain tasks done.
• Employee title • # of employees • Start year • End year
• Salary • Scenario • % role in each
function
Occupancy Captures information on the costs associated with occupying offices and MPA stations, including rent, utilities, and internet.
• Name of cost • Start year • End year
• Cost per year • Scenario • % contribution by
function
Capital Assets Captures information on capital assets, including whether an asset is fuel-burning, non-fuel-burning, or a building. It also allows for the calculation of the ongoing maintenance costs associated with each capital asset.
• Name of asset • Asset class • # purchased • Purchase year
• Useful life • Maintenance cost • Scenario • % contribution by
function
Fuel Cost Assumptions
Captures the necessary information to forecast the fuel costs of fuel-burning assets as well as the total number of hours per year that each asset can be utilized during MPA activities.
• Name of asset • Type of engine • Type of fuel • # of engines
• Engine horsepower • Fuel consumption/hr • Asset utilization
Activity Assumptions
Captures activity types and unit cost information for all of the supplies/materials, travel, and transportation costs for MPA activities.
• Types of activities • Supplies & materials
unit costs
• Travel unit costs • Transportation unit
costs
Activity Inputs Captures the MPA activities, generally found in MPA management and work plans. This method of data capture should be in-line with yearly work plans and helps to understand the range and number of activities across the MPA functions.
• Type of activity • Activity name • # of times/year • Start year • End year • Scenario
• Supplies/materials • Fuel logistics • Travel • Miscellaneous • % contribution by
function
Miscellaneous Captures additional costs not captured in previous input tabs. Recognizing that MPAs are all different, this allows flexibility to capture unique costs.
• Name of cost • Start year • End year
• Cost per year • Scenario • % contribution by
function
Cash Sources Captures funding and revenue information. • Funding • Tourism fee structure
• Other revenue sources
INT
RO
DU
CT
ION
12
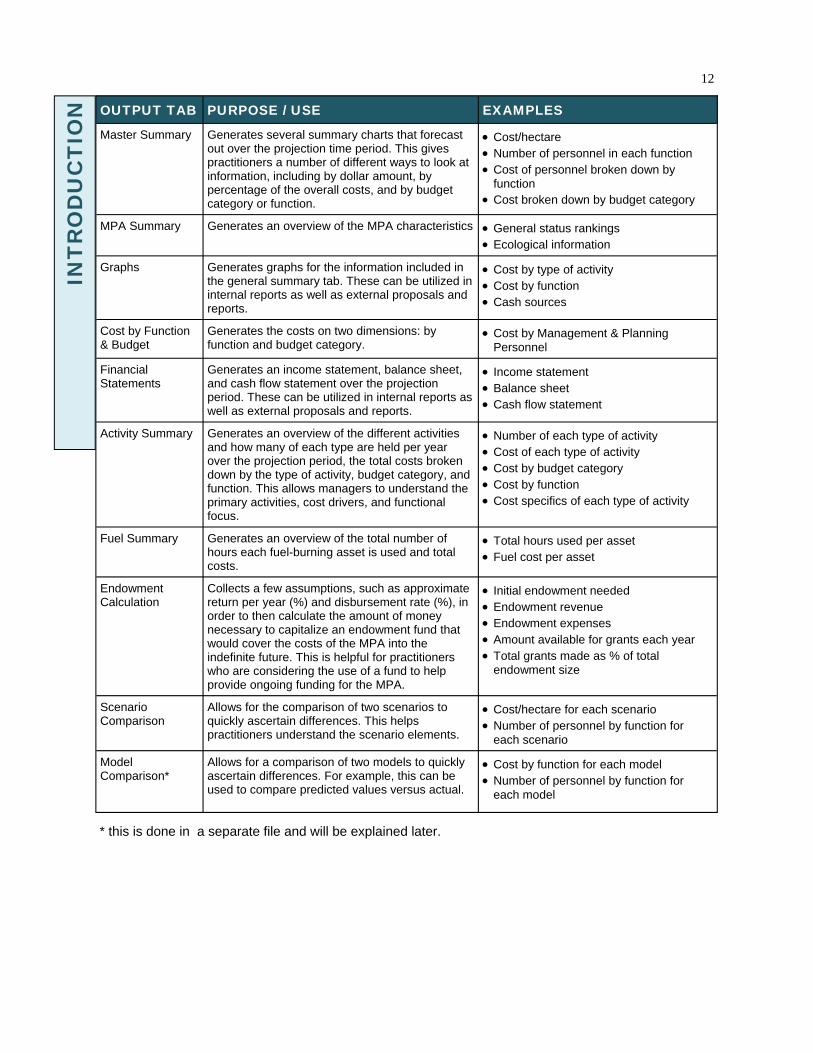
OUTPUT TAB PURPOSE / USE EXAMPLES
Master Summary Generates several summary charts that forecast out over the projection time period. This gives practitioners a number of different ways to look at information, including by dollar amount, by percentage of the overall costs, and by budget category or function.
• Cost/hectare • Number of personnel in each function • Cost of personnel broken down by
function • Cost broken down by budget category
MPA Summary Generates an overview of the MPA characteristics • General status rankings • Ecological information
Graphs Generates graphs for the information included in the general summary tab. These can be utilized in internal reports as well as external proposals and reports.
• Cost by type of activity • Cost by function • Cash sources
Cost by Function & Budget
Generates the costs on two dimensions: by function and budget category.
• Cost by Management & Planning Personnel
Financial Statements
Generates an income statement, balance sheet, and cash flow statement over the projection period. These can be utilized in internal reports as well as external proposals and reports.
• Income statement • Balance sheet • Cash flow statement
Activity Summary Generates an overview of the different activities and how many of each type are held per year over the projection period, the total costs broken down by the type of activity, budget category, and function. This allows managers to understand the primary activities, cost drivers, and functional focus.
• Number of each type of activity • Cost of each type of activity • Cost by budget category • Cost by function • Cost specifics of each type of activity
Fuel Summary Generates an overview of the total number of hours each fuel-burning asset is used and total costs.
• Total hours used per asset • Fuel cost per asset
Endowment Calculation
Collects a few assumptions, such as approximate return per year (%) and disbursement rate (%), in order to then calculate the amount of money necessary to capitalize an endowment fund that would cover the costs of the MPA into the indefinite future. This is helpful for practitioners who are considering the use of a fund to help provide ongoing funding for the MPA.
• Initial endowment needed • Endowment revenue • Endowment expenses • Amount available for grants each year • Total grants made as % of total
endowment size
Scenario Comparison
Allows for the comparison of two scenarios to quickly ascertain differences. This helps practitioners understand the scenario elements.
• Cost/hectare for each scenario • Number of personnel by function for
each scenario
Model Comparison*
Allows for a comparison of two models to quickly ascertain differences. For example, this can be used to compare predicted values versus actual.
• Cost by function for each model • Number of personnel by function for
each model
* this is done in a separate file and will be explained later.
INT
RO
DU
CT
ION
13
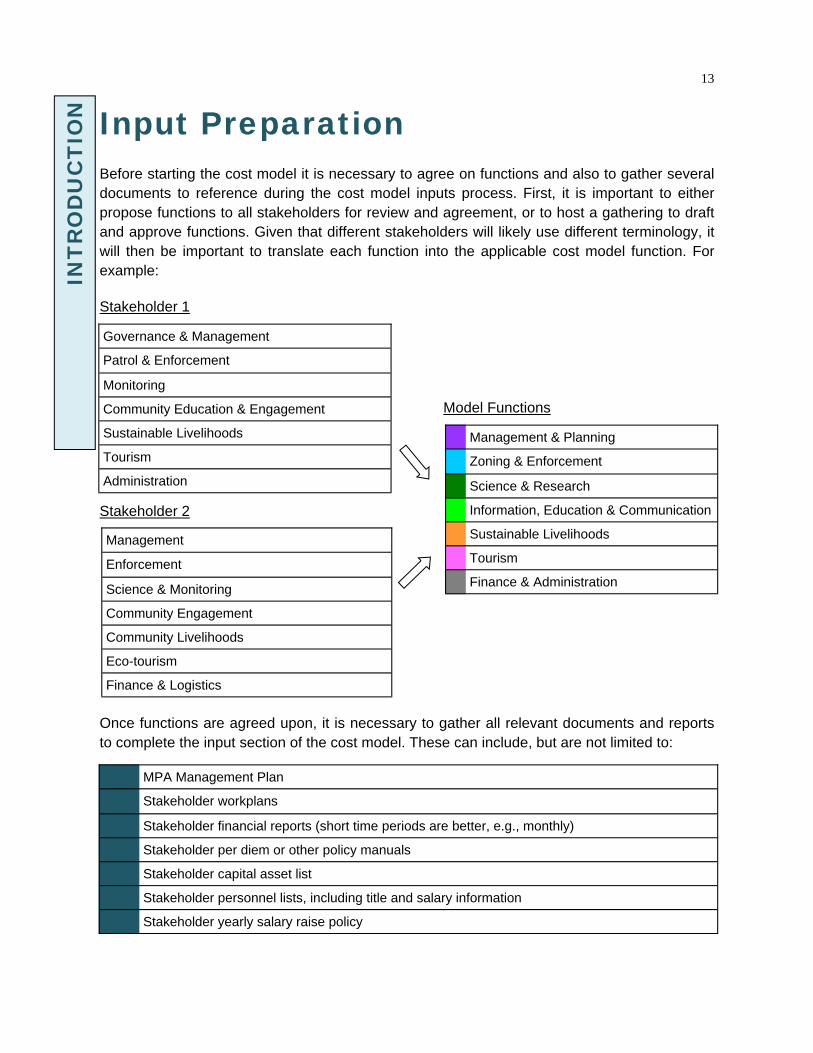
Input Preparation Before starting the cost model it is necessary to agree on functions and also to gather several documents to reference during the cost model inputs process. First, it is important to either propose functions to all stakeholders for review and agreement, or to host a gathering to draft and approve functions. Given that different stakeholders will likely use different terminology, it will then be important to translate each function into the applicable cost model function. For example: Stakeholder 1
Model Functions
Stakeholder 2
Once functions are agreed upon, it is necessary to gather all relevant documents and reports to complete the input section of the cost model. These can include, but are not limited to:
Management & Planning
Zoning & Enforcement
Science & Research
Information, Education & Communication
Sustainable Livelihoods
Tourism
Finance & Administration
Management
Enforcement
Science & Monitoring
Community Engagement
Community Livelihoods
Eco-tourism
Finance & Logistics
Governance & Management
Patrol & Enforcement
Monitoring
Community Education & Engagement
Sustainable Livelihoods
Tourism
Administration
MPA Management Plan
Stakeholder workplans
Stakeholder financial reports (short time periods are better, e.g., monthly)
Stakeholder per diem or other policy manuals
Stakeholder capital asset list
Stakeholder personnel lists, including title and salary information
Stakeholder yearly salary raise policy
INT
RO
DU
CT
ION
14
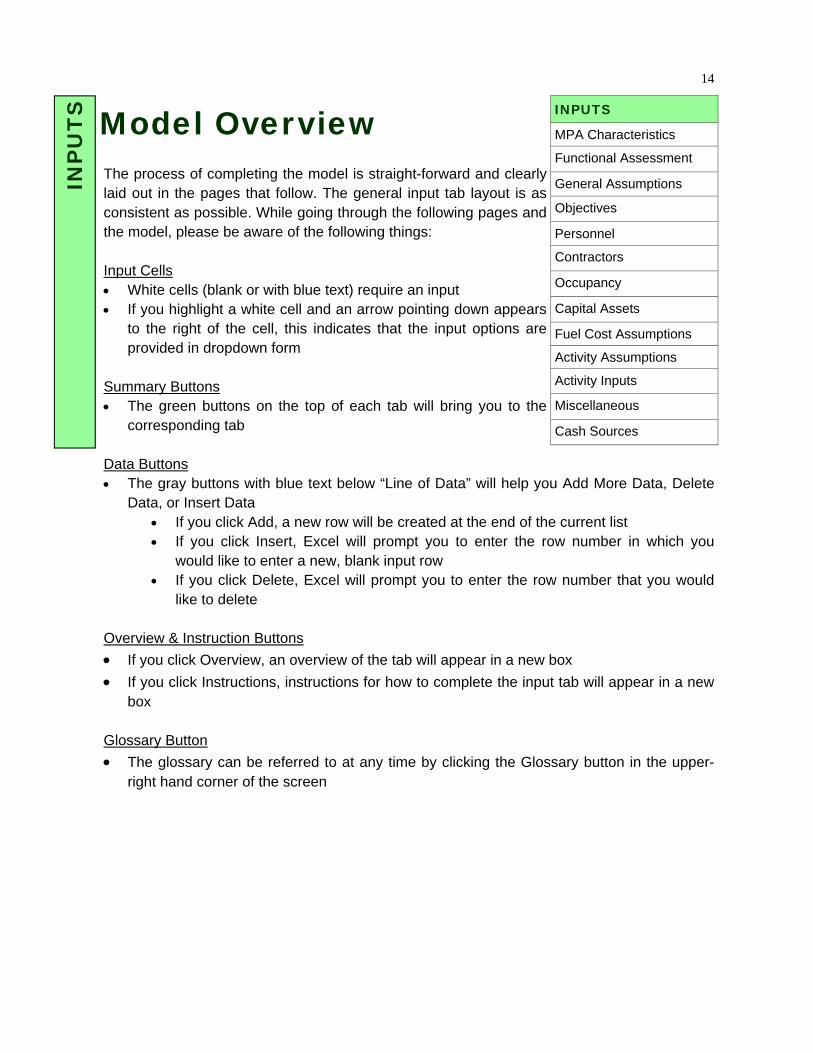
Model Overview The process of completing the model is straight-forward and clearly laid out in the pages that follow. The general input tab layout is as consistent as possible. While going through the following pages and the model, please be aware of the following things: Input Cells • White cells (blank or with blue text) require an input • If you highlight a white cell and an arrow pointing down appears
to the right of the cell, this indicates that the input options are provided in dropdown form
Summary Buttons • The green buttons on the top of each tab will bring you to the
corresponding tab Data Buttons • The gray buttons with blue text below “Line of Data” will help you Add More Data, Delete
Data, or Insert Data • If you click Add, a new row will be created at the end of the current list • If you click Insert, Excel will prompt you to enter the row number in which you
would like to enter a new, blank input row • If you click Delete, Excel will prompt you to enter the row number that you would
like to delete Overview & Instruction Buttons • If you click Overview, an overview of the tab will appear in a new box • If you click Instructions, instructions for how to complete the input tab will appear in a new
box Glossary Button • The glossary can be referred to at any time by clicking the Glossary button in the upper-
right hand corner of the screen
INP
UT
S
INPUTS
MPA Characteristics
Functional Assessment
General Assumptions
Objectives
Personnel
Contractors
Occupancy
Capital Assets
Fuel Cost Assumptions
Activity Assumptions
Activity Inputs
Miscellaneous
Cash Sources

15
MPA Characteristics
• Gather basic, ecological, threat, community, and stakeholder information from team members.
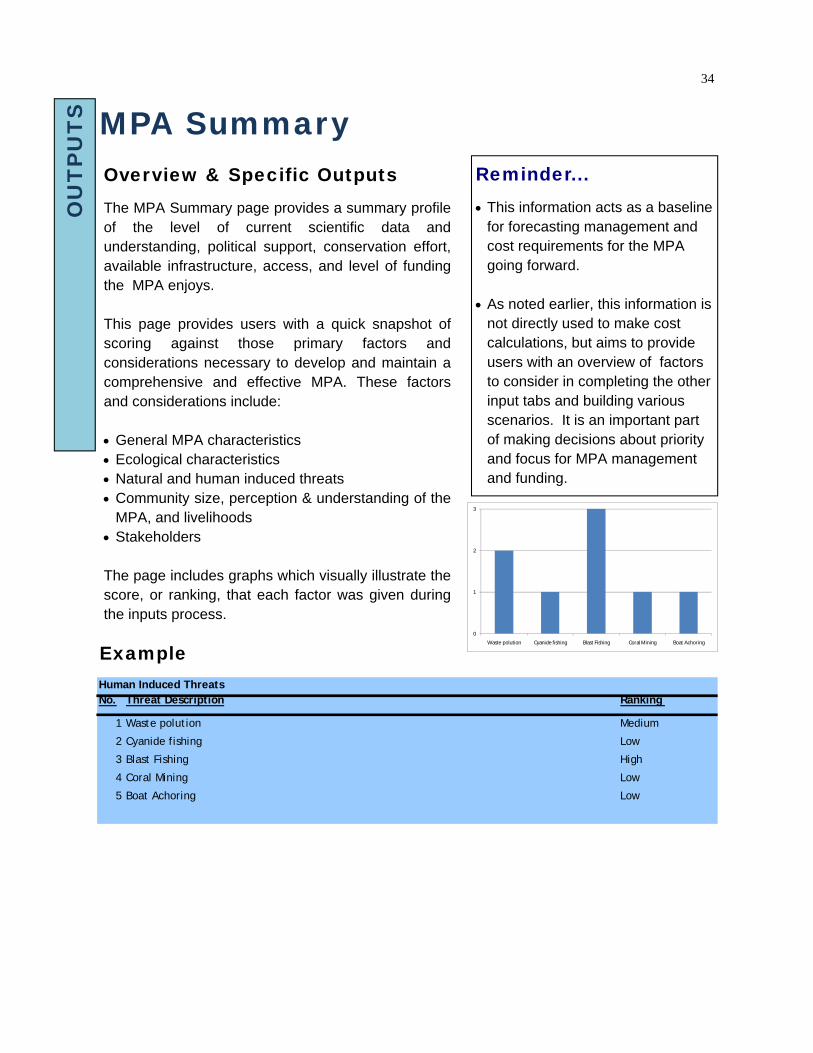
Overview The MPA characteristics tab, coupled with the functional assessment, provide users with a quick snapshot of the primary factors and considerations necessary to develop and maintain a comprehensive and effective MPA. The information captured includes: • General MPA status • Ecological characteristics • Natural threats • Human-induced threats • Community size, perception & understanding of the
MPA, and livelihoods • Stakeholders
Instructions 1. Complete the first four MPA characteristics questions: name of MPA, location, legal status,
and size. For help converting to hectares, go to www.metric-conversions.org. 2. Complete the general status rankings. 3. Complete the ecological section by entering the name of the species, the number of
animals/plants/etc of this species, the number of the species that are critically endangered, endangered, vulnerable, and endemic.
4. Complete the natural threats section by entering a description and ranking for each threat. 5. Complete the human induced threats section by entering a description and ranking for
each threat. 6. Complete the communities section by entering the number of people that reside in the
MPA. Provide a ranking of the community perception and understanding of the MPA, and complete the livelihood sub-section by listing the name of each livelihood as well as the number of people involved and environmental impact of each.
7. Complete the stakeholders section by entering each stakeholder name followed by a ranking of each stakeholders involvement in MPA management and influence in MPA decision making.
So you know... • The information gathered on this
tab is not directly used to make any cost calculations, but aims to provide users an overview of factors to consider in completing the other input tabs and building various scenarios.
Example—Human Induced Threats
INP
UT
S
Before beginning...
Human Induced Threats
No. Threat Description Ranking
1 Medium
2 Low
3 High
4 Low
5 Low
Cyanide fishing
Boat Achoring
Coral Mining
Waste polution
Blast Fishing
16
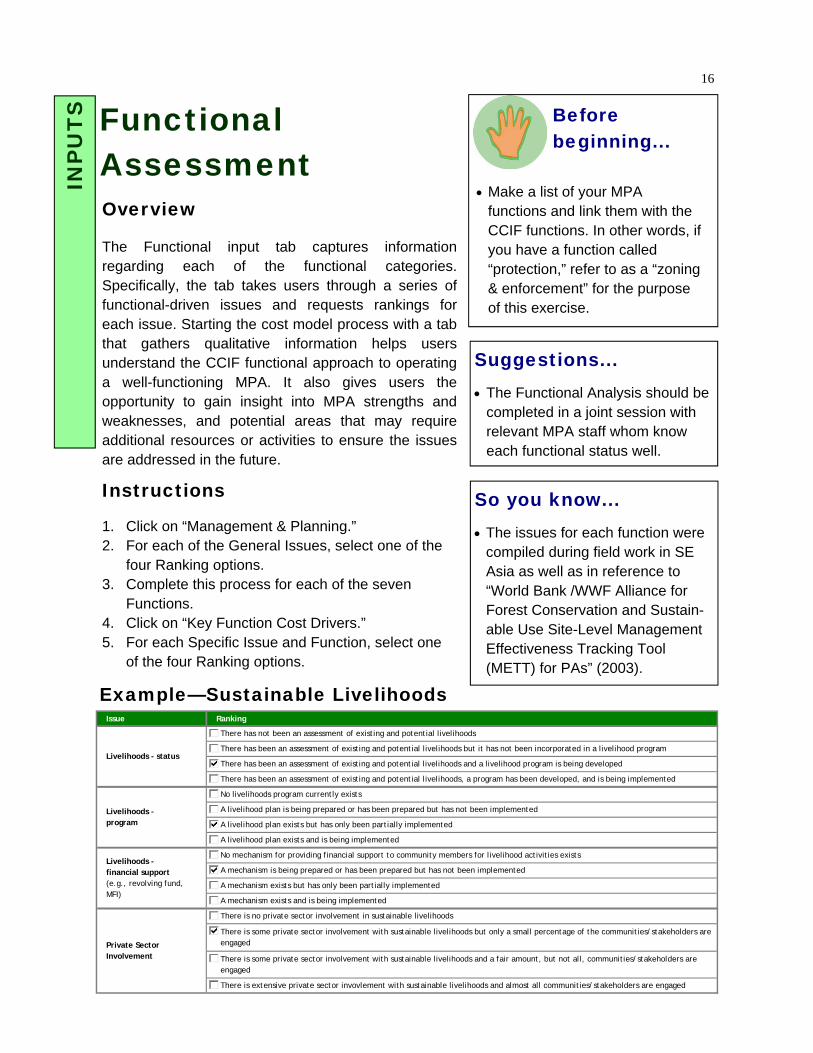
Functional Assessment
• Make a list of your MPA functions and link them with the CCIF functions. In other words, if you have a function called “protection,” refer to as a “zoning & enforcement” for the purpose of this exercise.
Overview The Functional input tab captures information regarding each of the functional categories. Specifically, the tab takes users through a series of functional-driven issues and requests rankings for each issue. Starting the cost model process with a tab that gathers qualitative information helps users understand the CCIF functional approach to operating a well-functioning MPA. It also gives users the opportunity to gain insight into MPA strengths and weaknesses, and potential areas that may require additional resources or activities to ensure the issues are addressed in the future.
Instructions 1. Click on “Management & Planning.” 2. For each of the General Issues, select one of the
four Ranking options. 3. Complete this process for each of the seven
Functions. 4. Click on “Key Function Cost Drivers.” 5. For each Specific Issue and Function, select one
of the four Ranking options.
Suggestions... • The Functional Analysis should be
completed in a joint session with relevant MPA staff whom know each functional status well.
So you know... • The issues for each function were
compiled during field work in SE Asia as well as in reference to “World Bank /WWF Alliance for Forest Conservation and Sustain-able Use Site-Level Management Effectiveness Tracking Tool (METT) for PAs” (2003).
Example—Sustainable Livelihoods
INP
UT
S
Before beginning...
Issue Ranking
##
##
##
##
##
##
##
##
##
##
##
##
##
##
##
##
Livelihoods - financial support (e.g., revolving fund, MFI)
No mechanism for providing financial support to community members for livelihood activities exists
There has been an assessment of existing and potential livelihoods but it has not been incorporated in a livelihood program
A livelihood plan is being prepared or has been prepared but has not been implemented
There has been an assessment of existing and potential livelihoods, a program has been developed, and is being implemented
There is some private sector involvement with sustainable livelihoods but only a small percentage of the communities/stakeholders are engaged
There has not been an assessment of existing and potential livelihoods
Livelihoods - status
There is some private sector involvement with sustainable livelihoods and a fair amount, but not all, communities/stakeholders are engaged
There has been an assessment of existing and potential livelihoods and a livelihood program is being developed
A mechanism is being prepared or has been prepared but has not been implemented
A mechanism exists but has only been partially implemented
A mechanism exists and is being implemented
Private Sector Involvement
Livelihoods - program A livelihood plan exists but has only been partially implemented
No livelihoods program currently exists
There is no private sector involvement in sustainable livelihoods
There is extensive private sector invovlement with sustainable livelihoods and almost all communities/stakeholders are engaged
A livelihood plan exists and is being implemented
17
General Assumptions
• Reach an agreement and commitment to the names of the MPA functions with team.
• Gather stakeholder yearly salary raise information and take an average to use in the model (in the event that one stakeholder has the most involvement, weight their yearly salary raise information more than other stakeholders while calculating the average).
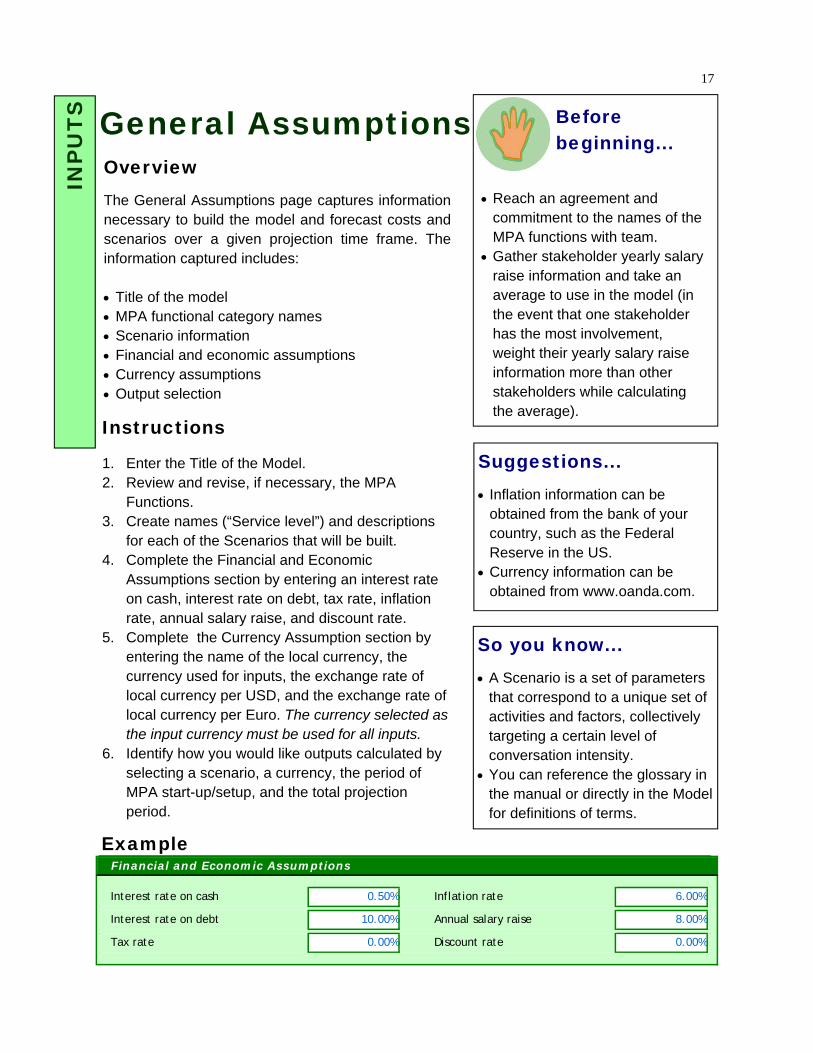
Overview The General Assumptions page captures information necessary to build the model and forecast costs and scenarios over a given projection time frame. The information captured includes: • Title of the model • MPA functional category names • Scenario information • Financial and economic assumptions • Currency assumptions • Output selection
Suggestions... • Inflation information can be
obtained from the bank of your country, such as the Federal Reserve in the US.
• Currency information can be obtained from www.oanda.com.
Example
Instructions 1. Enter the Title of the Model. 2. Review and revise, if necessary, the MPA
Functions. 3. Create names (“Service level”) and descriptions
for each of the Scenarios that will be built. 4. Complete the Financial and Economic
Assumptions section by entering an interest rate on cash, interest rate on debt, tax rate, inflation rate, annual salary raise, and discount rate.
5. Complete the Currency Assumption section by entering the name of the local currency, the currency used for inputs, the exchange rate of local currency per USD, and the exchange rate of local currency per Euro. The currency selected as the input currency must be used for all inputs.
6. Identify how you would like outputs calculated by selecting a scenario, a currency, the period of MPA start-up/setup, and the total projection period.
So you know... • A Scenario is a set of parameters
that correspond to a unique set of activities and factors, collectively targeting a certain level of conversation intensity.
• You can reference the glossary in the manual or directly in the Model for definitions of terms.
INP
UT
S
Before beginning...
Interest rate on cash 0.50% Inflation rate 6.00%
Interest rate on debt 10.00% Annual salary raise 8.00%
Tax rate 0.00% Discount rate 0.00%
Financial and Economic Assumptions

18
Objectives Overview The Objectives tab captures written MPA objectives and also the functional breakdown, in percentage form, of the activities and resources required to obtain the objective over time. Objectives are realistic, tangible, and specific targets that the MPA hopes to achieve over a given time period. MPA Objectives largely center on:
1) biodiversity conservation, 2) ecosystem health, and 3) community needs. MPA costs are driven directly by objectives through implementation of the functional component activities. It is crucial that MPA stakeholders come to an agreement on the objectives at the very beginning of the planning and development stage of the MPA, and certainly before beginning the modeling process. This will ensure that in the design of the MPA management components, activities, personnel needs, etc, practitioners will accurately construct scenarios that are able to achieve these objectives.
• Reference the MPA management plan and/or discuss with team members to define the MPA objectives.
• Think about what functional activities and resources are required to obtain the objectives.
Example
Instructions 1. Enter the first written MPA objective. 2. Thinking about the specific activities and resources necessary to obtain the objective,
allocate 100% across the MPA functions to reflect the functional breakdown of the necessary efforts.
3. Complete the first two steps for each of the MPA objectives.
So you know... • This section will be reviewed
during the Check Point Phase.
INP
UT
S
Before beginning...
No Objectives 1 2 3 4 5 6 7 8
1 Biodiversity protection 15% 25% 50% 5% 5% Ok
2 Natural resource protection 10% 75% 10% 5% Ok
3 Community welfare 20% 25% 25% 25% 5% Ok
4
5
Activities necessary to obtain the objective
19
• For each stakeholder, make sure you have a list of all employee titles, the year they joined, the year their leaving (if known), their salary and benefits, and their job roles.
• Think about the scenarios and what personnel changes will need to be made to realize the different scenarios.
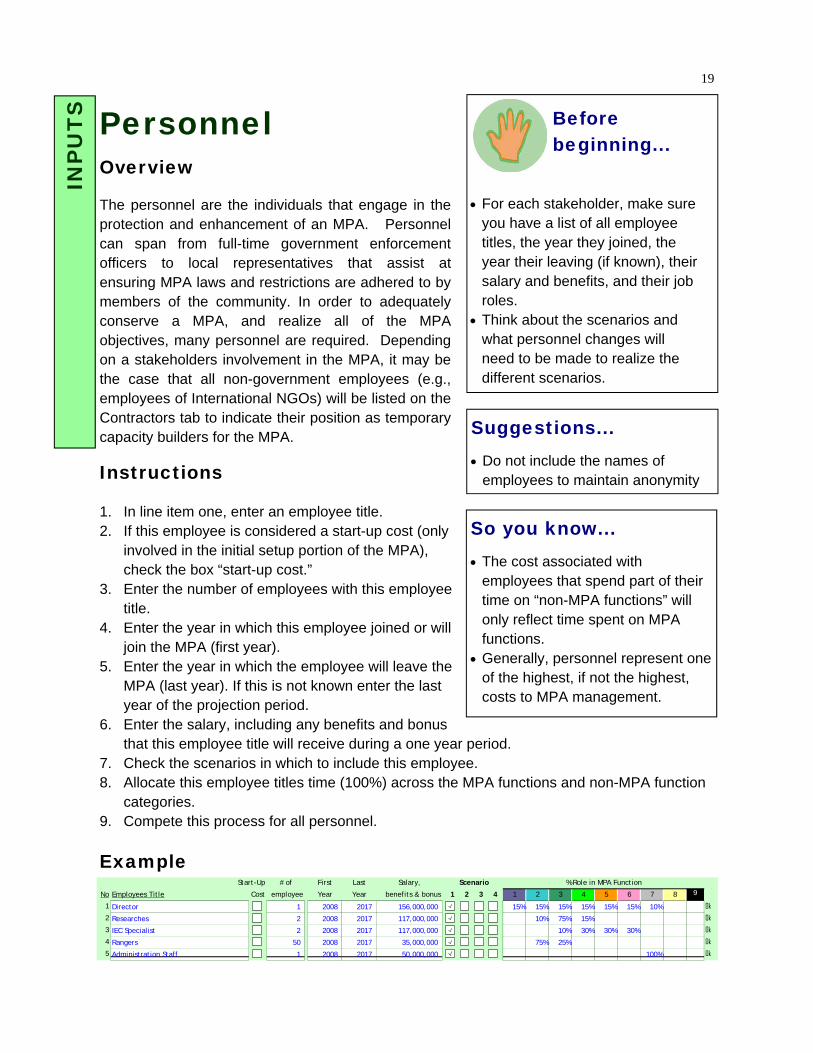
Personnel Overview The personnel are the individuals that engage in the protection and enhancement of an MPA. Personnel can span from full-time government enforcement officers to local representatives that assist at ensuring MPA laws and restrictions are adhered to by members of the community. In order to adequately conserve a MPA, and realize all of the MPA objectives, many personnel are required. Depending on a stakeholders involvement in the MPA, it may be the case that all non-government employees (e.g., employees of International NGOs) will be listed on the Contractors tab to indicate their position as temporary capacity builders for the MPA.
Instructions 1. In line item one, enter an employee title. 2. If this employee is considered a start-up cost (only
involved in the initial setup portion of the MPA), check the box “start-up cost.”
3. Enter the number of employees with this employee title.
4. Enter the year in which this employee joined or will join the MPA (first year).
5. Enter the year in which the employee will leave the MPA (last year). If this is not known enter the last year of the projection period.
6. Enter the salary, including any benefits and bonus that this employee title will receive during a one year period.
7. Check the scenarios in which to include this employee. 8. Allocate this employee titles time (100%) across the MPA functions and non-MPA function
categories. 9. Compete this process for all personnel.
Suggestions... • Do not include the names of
employees to maintain anonymity
So you know... • The cost associated with
employees that spend part of their time on “non-MPA functions” will only reflect time spent on MPA functions.
• Generally, personnel represent one of the highest, if not the highest, costs to MPA management.
Example
INP
UT
S
Before beginning...
Start-Up # of First Last Salary,
No Employees Title Cost employee Year Year benefits & bonus 1 2 3 4 1 2 3 4 5 6 7 8 9
1 Director ### 1 2008 2017 156,000,000 ### ### ### ### 15% 15% 15% 15% 15% 15% 10% Ok
2 Researches ### 2 2008 2017 117,000,000 ### ### ### 10% 75% 15% Ok
3 IEC Specialist 2 2008 2017 117,000,000 ### ### ### 10% 30% 30% 30% Ok
4 Rangers 50 2008 2017 35,000,000 ### ### ### 75% 25% Ok
5 Administration Staff 1 2008 2017 50,000,000 ### ### ### 100% Ok
Scenario % Role in MPA Function
20
Contractors
• Think about the scenarios and what contractor changes will need to be made to realize the different scenarios
• Ask stakeholders for a list of current and future contractors that they are or will be utilizing
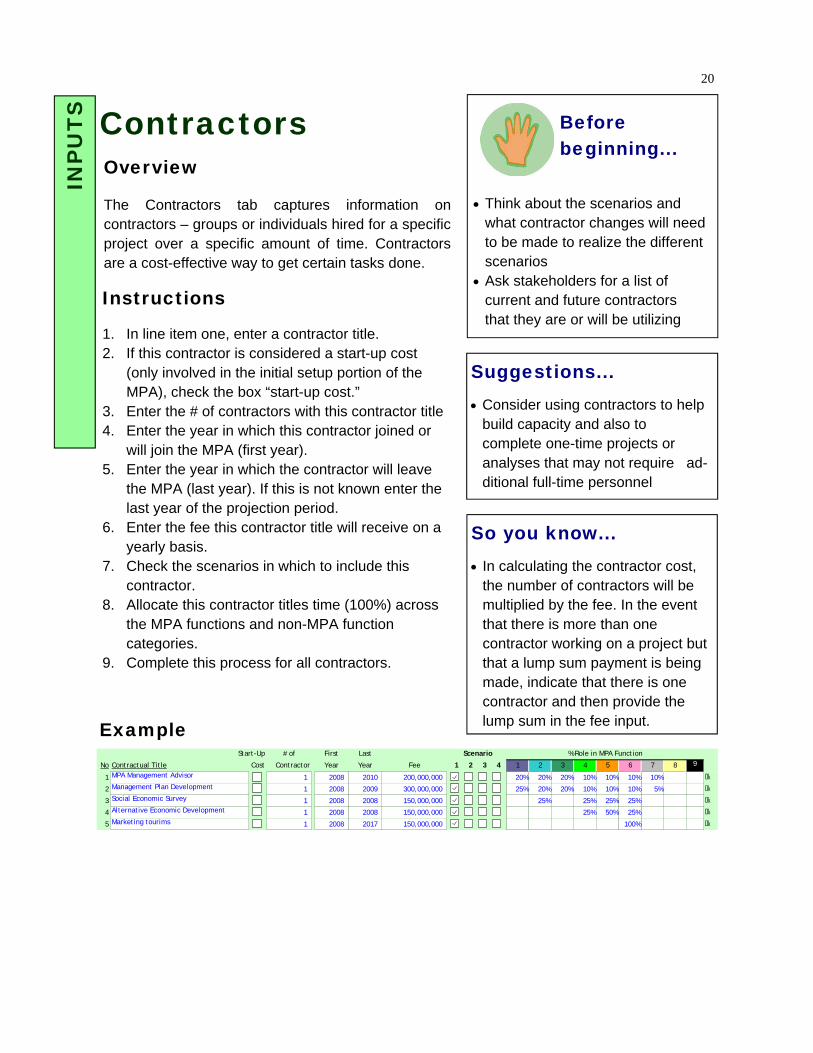
Overview The Contractors tab captures information on contractors – groups or individuals hired for a specific project over a specific amount of time. Contractors are a cost-effective way to get certain tasks done.
Suggestions... • Consider using contractors to help
build capacity and also to complete one-time projects or analyses that may not require ad-ditional full-time personnel
Example
Instructions 1. In line item one, enter a contractor title. 2. If this contractor is considered a start-up cost
(only involved in the initial setup portion of the MPA), check the box “start-up cost.”
3. Enter the # of contractors with this contractor title 4. Enter the year in which this contractor joined or
will join the MPA (first year). 5. Enter the year in which the contractor will leave
the MPA (last year). If this is not known enter the last year of the projection period.
6. Enter the fee this contractor title will receive on a yearly basis.
7. Check the scenarios in which to include this contractor.
8. Allocate this contractor titles time (100%) across the MPA functions and non-MPA function categories.
9. Complete this process for all contractors.
INP
UT
S
Before beginning...
So you know... • In calculating the contractor cost,
the number of contractors will be multiplied by the fee. In the event that there is more than one contractor working on a project but that a lump sum payment is being made, indicate that there is one contractor and then provide the lump sum in the fee input.
Start-Up # of First Last
No Contractual Title Cost Contractor Year Year Fee 1 2 3 4 1 2 3 4 5 6 7 8 9
1 MPA Management Advisor ### 1 2008 2010 200,000,000 ### ### ### ### 20% 20% 20% 10% 10% 10% 10% Ok
2 Management Plan Development 1 2008 2009 300,000,000 ### ### ### 25% 20% 20% 10% 10% 10% 5% Ok
3 Social Economic Survey 1 2008 2008 150,000,000 ### ### ### 25% 25% 25% 25% Ok
4 Alternative Economic Development 1 2008 2008 150,000,000 ### ### ### 25% 50% 25% Ok
5 Marketing tourims 1 2008 2017 150,000,000 ### ### ### 100% Ok
Scenario % Role in MPA Function

21
Occupancy
• Gather all occupancy related cost information from the finance team. This includes rent, utility bills, internet expenses, tele-phone bills, and any other cost associated with occupying MPA- related buildings.
Overview The Occupancy tab captures information on the costs associated with occupying MPA offices and other buildings, including rent, utilities, and internet.
Suggestions... • If there are multiple stakeholders
involved in management of the MPA, consider building a scenario which includes consolidating stakeholders to one main office.
Example
Instructions 1. In line item one, enter the name of the first
occupancy cost. 2. If this cost is considered a start-up cost (only
involved in the initial setup portion of the MPA), check the box “start-up cost.”
3. Enter the beginning year of this cost (first year). 4. Enter the ending year of this cost if it is known,
otherwise enter the final year of the projection period (last year).
5. Enter the cost per year. 6. Select which scenarios to include this cost. 7. Allocate this cost (100%) across the MPA
functions and non-MPA function categories. 8. Complete this process for all occupancy costs.
INP
UT
S
Before beginning...
Start-Up First Last
No Occupancy Cost Cost Year Year Cost per year 1 2 3 4 1 2 3 4 5 6 7 8 9
1 Office Rent ### 2008 2009 75,000,000 ### ### ### ### 20% 10% 10% 15% 15% 15% 15% Ok
2 Water 2008 2017 5,000,000 ### ### ### 20% 10% 10% 15% 15% 15% 15% Ok
3 Electricity 2008 2017 10,000,000 ### ### ### 15% 10% 15% 15% 15% 15% 15% Ok
4 Telephone 2008 2017 15,000,000 ### ### ### 15% 10% 15% 15% 15% 15% 15% Ok
5 VISAT Internet 2008 2017 30,000,000 ### ### ### 15% 10% 15% 15% 15% 15% 15% Ok
Scenario % Role in MPA Function

22
Capital Assets
• Obtain a list of all current and proposed assets for the MPA.
• Discuss the yearly maintenance cost and useful life of certain assets with team members that are engaged in maintaining them or responsible for keeping records of asset maintenance.
Overview The Capital Assets tab captures information on capital assets, defined as assets with a useful life longer than one year. This tab is important for: • Identifying which assets are fuel burning so that
additional information can be gathered from them on the Fuel Cost Assumption tab,
• Capturing the yearly maintenance cost information, • Capturing the useful life to calculate depreciation.
Example
Instructions 1. In line item one, enter the name of the first asset. 2. If this asset is considered a start-up cost (only
involved in the initial setup portion of the MPA), check the box “start-up cost.”
3. Using the drop-down menu, select the asset class: building or facility, fuel burning asset, or other (non fuel burning asset).
4. Enter the number of this type of asset that were or will be purchased.
5. Enter the purchase year. 6. Enter the cost. 7. Enter the useful life. 8. Complete the maintenance cost section by either
entering a percentage of the initial cost that is required to maintain the asset each year, or, if known, enter the actual yearly maintenance cost.
9. Select which scenarios to include this asset. 10. Allocate this asset (100%) across the MPA
functions and non-MPA function categories, representing which functions will utilize the asset.
11. Complete this process for all capital assets.
So you know... • This section should only capture
the MPA assets with a useful life greater than one year. For assets with a useful life less than one year, such as various supplies & materials required for MPA activities, their information is collected on the Activity Inputs tab.
• The model utilizes straight-line depreciation. Assuming a salvage value of zero, the annual depreciation expense is equal to the cost of the asset divided by the useful life.
• Once an asset reaches the end of its useful life, a new asset will automatically be purchased to replace it. The cost of this replacement asset will equal the inflation-adjusted cost of the original.
INP
UT
S
Before beginning...
Start-Up # of Purchase
No Name of Assets Cost Asset Class Assets Year Cost per unit Useful life % Actual Cost 1 2 3 4 1 2 3 4 5 6 7 8 9
1 Office ### Buildings or facilities 1 2009 500,000,000 15 Years 2% 5,000,000 ### ### ### ### 20% 10% 10% 15% 15% 15% 15% OK
2 Speedboat 1 ### Fuel burning assets 2 2008 400,000,000 5 Years 2% ### ### ### 45% 25% 10% 10% 10% OK
3 Speedboat 2 Fuel burning assets 3 2008 250,000,000 5 Years 2% ### ### ### 45% 25% 10% 10% 10% OK
4 Speedboat 3 Fuel burning assets 2 2008 150,000,000 5 Years 2% ### ### ### 45% 25% 10% 10% 10% OK
5 Computer Other (Non fuel burning assets) 5 2008 10,000,000 5 Years 2% ### ### ### ### 20% 10% 10% 15% 15% 15% 15% OK
ScenarioMaintenance Cost % used for MPA Function

23
Overview The Fuel Assumptions tab captures the necessary information to forecast the fuel costs of fuel-burning assets as well as the total number of hours per year that each asset can be utilized during MPA activities. This information is utilized during the Activities Input tab to calculate how many activities can utilize each asset over the course of the year and also how much money is spent on fuel over the course of the year. If you do not enter actual information regarding the number of liters of fuel and oil consumed per hour, an estimated value will be used. Here are the formulas for the calculations: • Marine Diesel Engine: # of liters of fuel consumer per hour = # of engines x (1/18) x horsepower x 3.7854118 • 2-Stroke Engine: # of liters of fuel consumed per hour = # of engines x (horsepower x 0.7/6) # of liters of oil consumer per hour = (4/128) x (# of liters of fuel consumed per hour) • 4-Stroke Engine # of liters of fuel consumed per hour = # of engines x (horsepower x 0.43/6) x 3.7854118
• Gather information about your fuel-burning assets from the team members responsible for maintaining these assets.
Fuel Assumptions
Suggestions... • When possible, provide actual
information for the number of liters of fuel and oil consumed per hour to more accurately reflect reality.
Example
Instructions 1. In line item one, select the name of the asset from the drop-down menu. 2. Select the type of engine (marine diesel, 2 stroke, 4 stroke, generator, or other) in the drop-
down menu. 3. Select the type of fuel (gasoline or diesel) in the drop-down menu. 4. Select the number of engines that this asset has. 5. Enter the engine horsepower. 6. If known, enter the number of liters of fuel consumed per hour and the number of liters of
oil consumed per hour. 7. Complete the asset utilization section by entering the maximum number of hours, days,
and months the asset can be used over the course of the year. 8. Complete this process for each of the fuel-burning assets.
INP
UT
S
Before beginning...
Specification of Vessels / Vehicles / Equipment with engine
FUEL BURNING ASSETS # of liters of # of liters of # of liters of # of liters of Hours Days Months
Type of # of Engine fuel consumed oil consumed Fuel Cost fuel consumed oil consumed per per per
No Type of engine Fuel Engine Horsepower per hour per hour per hour per hour per hour day Month year
1 4 Stroke speedboat engine Gasoline 2 140 HP 75.96 - 372,206.92 6.0 hours 20.0 days 12.0 Months
2 4 Stroke speedboat engine Gasoline 1 140 HP 37.98 - 186,103.46 6.0 hours 20.0 days 12.0 Months
3 2 Stroke speedboat engine Gasoline 1 40 HP 17.67 0.55 97,600.53 20.00 1.00 6.0 hours 20.0 days 12.0 Months
4 - - -
Estimation
Name of Assets
Asset Utilization
Speedboat 1
Speedboat 2
Speedboat 3
Based on actual/experience
24
Activity Assumptions
• Gather any relevant documents from the finance and administration team regarding organization policies for travel (e.g., per diem).
• Ask various team members what types of activities, supplies & materials, and travel are utilized for MPA related activities.
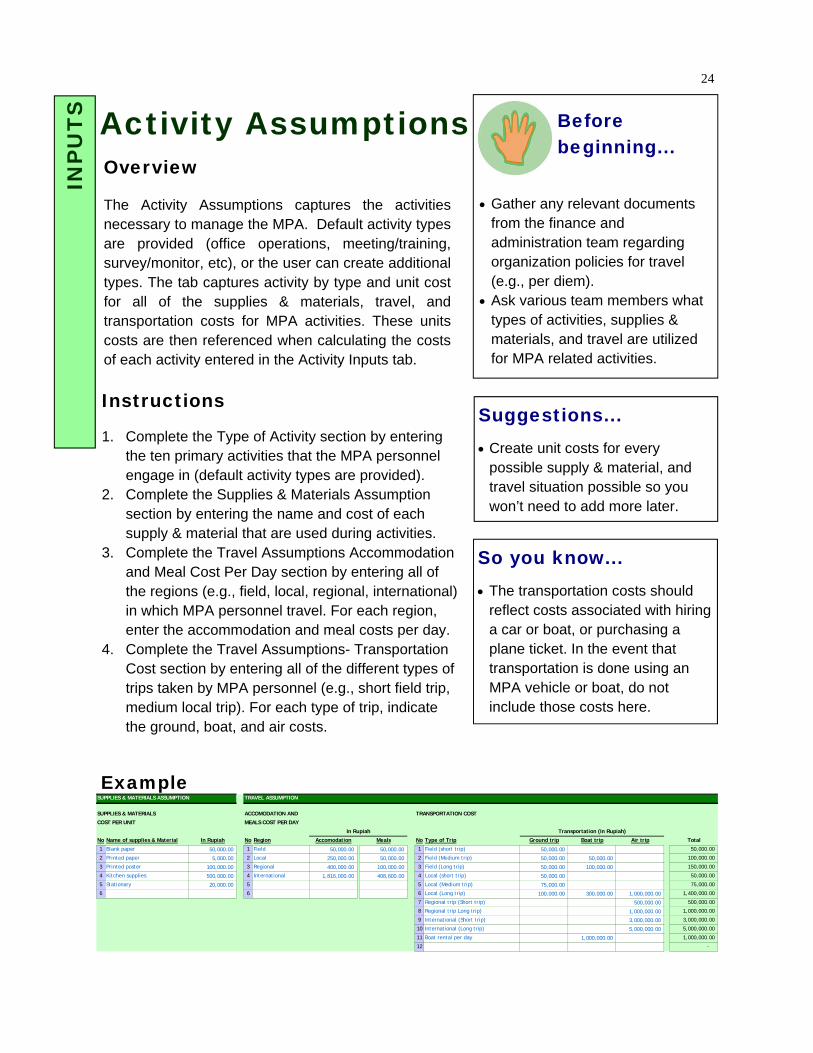
Overview The Activity Assumptions captures the activities necessary to manage the MPA. Default activity types are provided (office operations, meeting/training, survey/monitor, etc), or the user can create additional types. The tab captures activity by type and unit cost for all of the supplies & materials, travel, and transportation costs for MPA activities. These units costs are then referenced when calculating the costs of each activity entered in the Activity Inputs tab.
Suggestions... • Create unit costs for every
possible supply & material, and travel situation possible so you won’t need to add more later.
Example
Instructions 1. Complete the Type of Activity section by entering
the ten primary activities that the MPA personnel engage in (default activity types are provided).
2. Complete the Supplies & Materials Assumption section by entering the name and cost of each supply & material that are used during activities.
3. Complete the Travel Assumptions Accommodation and Meal Cost Per Day section by entering all of the regions (e.g., field, local, regional, international) in which MPA personnel travel. For each region, enter the accommodation and meal costs per day.
4. Complete the Travel Assumptions- Transportation Cost section by entering all of the different types of trips taken by MPA personnel (e.g., short field trip, medium local trip). For each type of trip, indicate the ground, boat, and air costs.
So you know... • The transportation costs should
reflect costs associated with hiring a car or boat, or purchasing a plane ticket. In the event that transportation is done using an MPA vehicle or boat, do not include those costs here.
INP
UT
S
Before beginning...
SUPPLIES & MATERIALS ASSUMPTION TRAVEL ASSUMPTION
SUPPLIES & MATERIALS ACCOMODATION AND TRANSPORTATION COST
COST PER UNIT MEALS COST PER DAY
No Name of supplies & Material In Rupiah No Region Accomodation Meals No Type of Trip Ground trip Boat trip Air trip Total
1 Blank paper 50,000.00 1 Field 50,000.00 50,000.00 1 Field (short trip) 50,000.00 50,000.00
2 Printed paper 5,000.00 2 Local 250,000.00 50,000.00 2 Field (Medium trip) 50,000.00 50,000.00 100,000.00
3 Printed poster 100,000.00 3 Regional 400,000.00 100,000.00 3 Field (Long trip) 50,000.00 100,000.00 150,000.00
4 Kitchen supplies 500,000.00 4 International 1,816,000.00 408,600.00 4 Local (short trip) 50,000.00 50,000.00
5 Stationary 20,000.00 5 5 Local (Medium trip) 75,000.00 75,000.00
6 6 6 Local (Long trip) 100,000.00 300,000.00 1,000,000.00 1,400,000.00
7 Regional trip (Short trip) 500,000.00 500,000.00
8 Regional trip Long trip) 1,000,000.00 1,000,000.00
9 International (Short trip) 3,000,000.00 3,000,000.00
10 International (Long trip) 5,000,000.00 5,000,000.00
11 Boat rental per day 1,000,000.00 1,000,000.00
12 -
In Rupiah Transportation (In Rupiah)
25
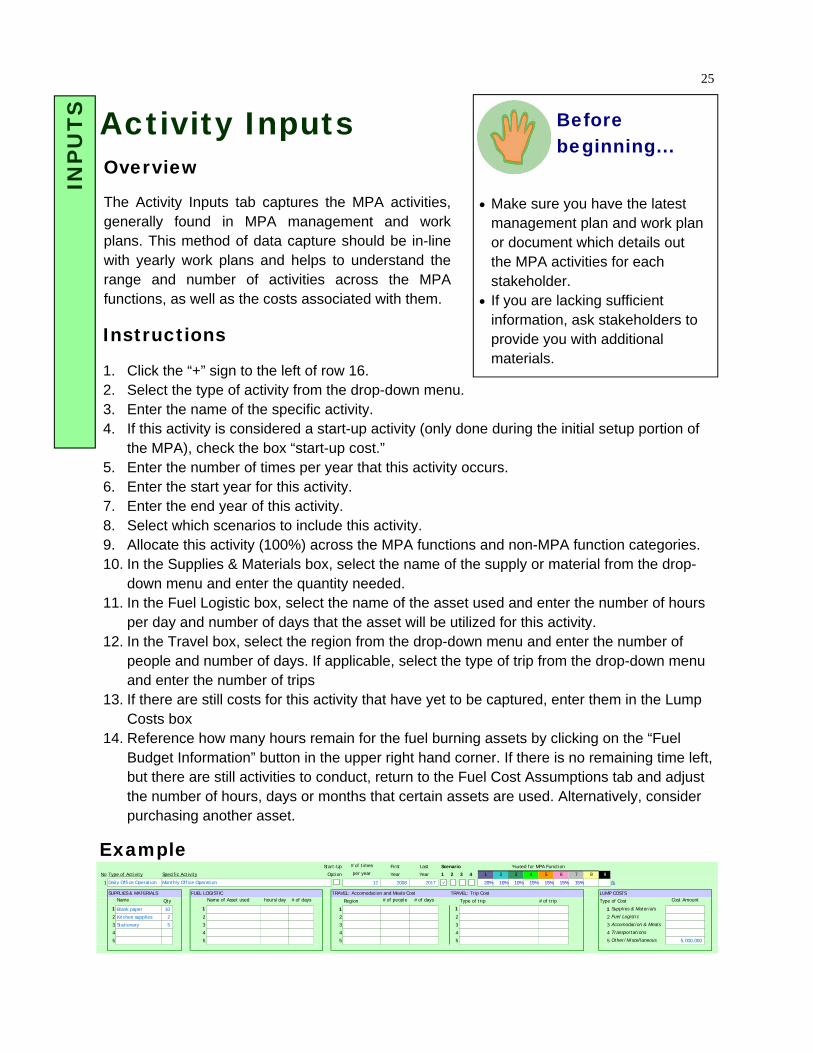
Instructions 1. Click the “+” sign to the left of row 16. 2. Select the type of activity from the drop-down menu. 3. Enter the name of the specific activity. 4. If this activity is considered a start-up activity (only done during the initial setup portion of
the MPA), check the box “start-up cost.” 5. Enter the number of times per year that this activity occurs. 6. Enter the start year for this activity. 7. Enter the end year of this activity. 8. Select which scenarios to include this activity. 9. Allocate this activity (100%) across the MPA functions and non-MPA function categories. 10. In the Supplies & Materials box, select the name of the supply or material from the drop-
down menu and enter the quantity needed. 11. In the Fuel Logistic box, select the name of the asset used and enter the number of hours
per day and number of days that the asset will be utilized for this activity. 12. In the Travel box, select the region from the drop-down menu and enter the number of
people and number of days. If applicable, select the type of trip from the drop-down menu and enter the number of trips
13. If there are still costs for this activity that have yet to be captured, enter them in the Lump Costs box
14. Reference how many hours remain for the fuel burning assets by clicking on the “Fuel Budget Information” button in the upper right hand corner. If there is no remaining time left, but there are still activities to conduct, return to the Fuel Cost Assumptions tab and adjust the number of hours, days or months that certain assets are used. Alternatively, consider purchasing another asset.
Activity Inputs Before beginning...
• Make sure you have the latest management plan and work plan or document which details out the MPA activities for each stakeholder.
• If you are lacking sufficient information, ask stakeholders to provide you with additional materials.
Overview
The Activity Inputs tab captures the MPA activities, generally found in MPA management and work plans. This method of data capture should be in-line with yearly work plans and helps to understand the range and number of activities across the MPA functions, as well as the costs associated with them.
Example
INP
UT
S
Start-Up # of times First Last Scenario
No Type of Activity Specific Activity Option per year Year Year 1 2 3 4 1 2 3 4 5 6 7 8 9
1 ### 12 2008 2017 ## ## ## ## 20% 10% 10% 15% 15% 15% 15% Ok
TRAVEL: Accomodation and Meals Cost TRAVEL: Trip Cost LUMP COSTSName Qty Name of Asset used hours/day # of days Region # of people # of days Type of trip # of trip Type of Cost Cost Amount
1 Blank paper 10 1 1 1 1 Supplies & Materials
2 Kitchen supplies 2 2 2 2 2 Fuel Logistic
3 Stationary 5 3 3 3 3 Accomodation & Meals
4 4 4 4 4 Transportations
5 5 5 5 5 Other/Miscellaneous 5,000,000
Daily Office Operation
SUPPLIES & MATERIALS FUEL LOGISTIC
Monthly Office Operation
% used for MPA Function
26
Miscellaneous
• Referencing all of the cost information you have, make a list of the costs that are not captured on one of the other cost model tabs.
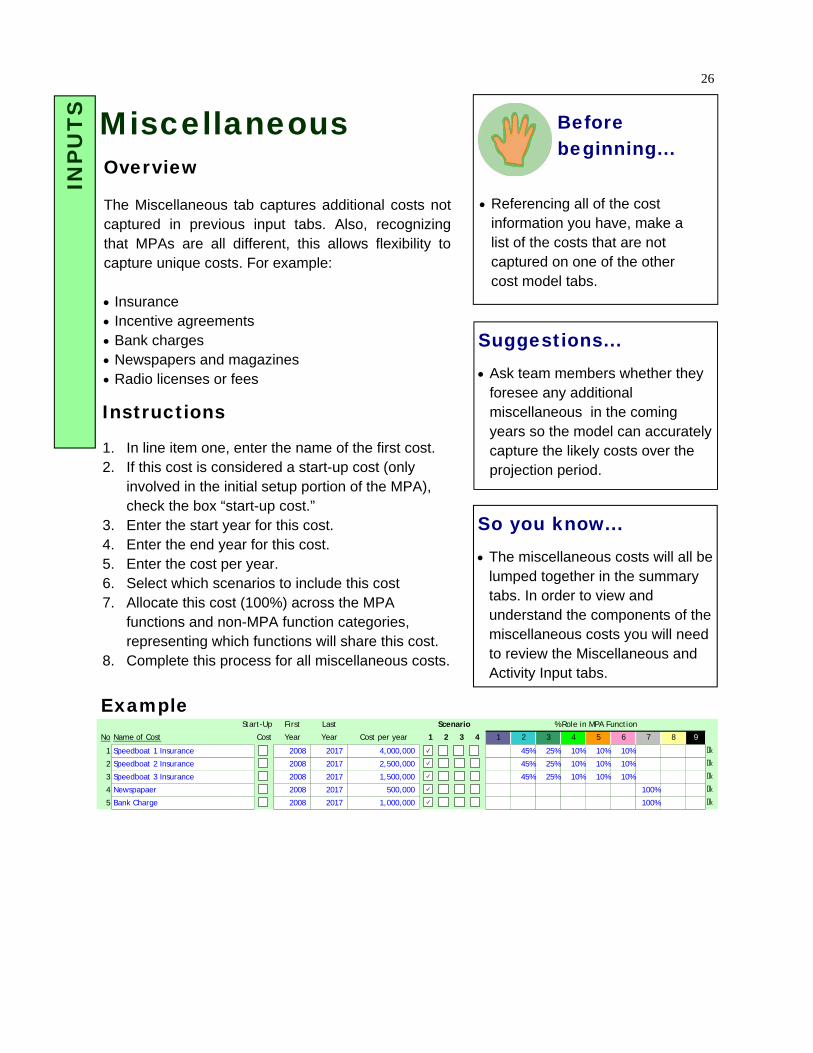
Overview The Miscellaneous tab captures additional costs not captured in previous input tabs. Also, recognizing that MPAs are all different, this allows flexibility to capture unique costs. For example: • Insurance • Incentive agreements • Bank charges • Newspapers and magazines • Radio licenses or fees
Suggestions... • Ask team members whether they
foresee any additional miscellaneous in the coming years so the model can accurately capture the likely costs over the projection period.
Example
Instructions 1. In line item one, enter the name of the first cost. 2. If this cost is considered a start-up cost (only
involved in the initial setup portion of the MPA), check the box “start-up cost.”
3. Enter the start year for this cost. 4. Enter the end year for this cost. 5. Enter the cost per year. 6. Select which scenarios to include this cost 7. Allocate this cost (100%) across the MPA
functions and non-MPA function categories, representing which functions will share this cost.
8. Complete this process for all miscellaneous costs.
So you know... • The miscellaneous costs will all be
lumped together in the summary tabs. In order to view and understand the components of the miscellaneous costs you will need to review the Miscellaneous and Activity Input tabs.
INP
UT
S
Before beginning...
Start-Up First Last
No Name of Cost Cost Year Year Cost per year 1 2 3 4 1 2 3 4 5 6 7 8 9
1 Speedboat 1 Insurance ### 2008 2017 4,000,000 ### ### ### ### 45% 25% 10% 10% 10% Ok
2 Speedboat 2 Insurance 2008 2017 2,500,000 ### ### ### 45% 25% 10% 10% 10% Ok
3 Speedboat 3 Insurance 2008 2017 1,500,000 ### ### ### 45% 25% 10% 10% 10% Ok
4 Newspapaer 2008 2017 500,000 ### ### ### 100% Ok
5 Bank Charge 2008 2017 1,000,000 ### ### ### 100% Ok
Scenario % Role in MPA Function
27
Cash Sources IN
PU
TS
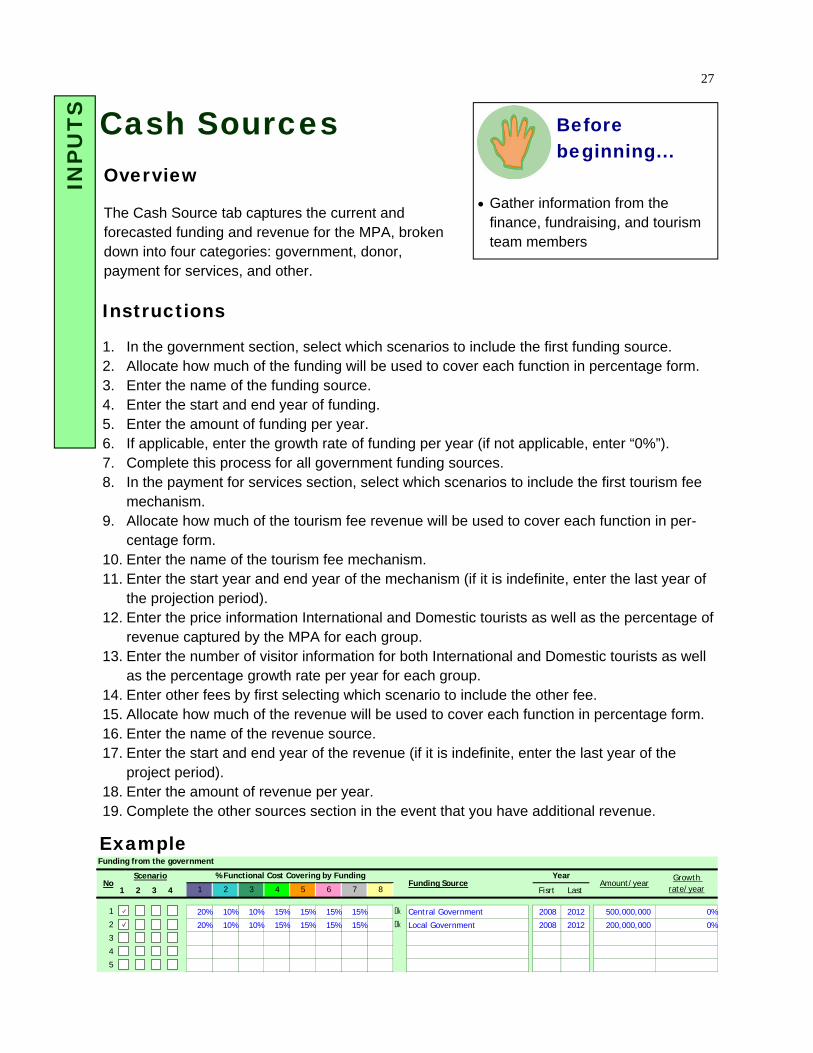
Instructions 1. In the government section, select which scenarios to include the first funding source. 2. Allocate how much of the funding will be used to cover each function in percentage form. 3. Enter the name of the funding source. 4. Enter the start and end year of funding. 5. Enter the amount of funding per year. 6. If applicable, enter the growth rate of funding per year (if not applicable, enter “0%”). 7. Complete this process for all government funding sources. 8. In the payment for services section, select which scenarios to include the first tourism fee
mechanism. 9. Allocate how much of the tourism fee revenue will be used to cover each function in per-
centage form. 10. Enter the name of the tourism fee mechanism. 11. Enter the start year and end year of the mechanism (if it is indefinite, enter the last year of
the projection period). 12. Enter the price information International and Domestic tourists as well as the percentage of
revenue captured by the MPA for each group. 13. Enter the number of visitor information for both International and Domestic tourists as well
as the percentage growth rate per year for each group. 14. Enter other fees by first selecting which scenario to include the other fee. 15. Allocate how much of the revenue will be used to cover each function in percentage form. 16. Enter the name of the revenue source. 17. Enter the start and end year of the revenue (if it is indefinite, enter the last year of the
project period). 18. Enter the amount of revenue per year. 19. Complete the other sources section in the event that you have additional revenue.
• Gather information from the finance, fundraising, and tourism team members
Overview The Cash Source tab captures the current and forecasted funding and revenue for the MPA, broken down into four categories: government, donor, payment for services, and other.
Example
Before beginning...
Funding from the government
1 2 3 4 1 2 3 4 5 6 7 8 Fisrt Last
1 ## ## 20% 10% 10% 15% 15% 15% 15% Ok Central Government 2008 2012 500,000,000 0%
2 ## ## 20% 10% 10% 15% 15% 15% 15% Ok Local Government 2008 2012 200,000,000 0%
3
4
5
Year% Functional Cost Covering by FundingScenarioNo
Growth rate/year
Funding Source Amount/year
28
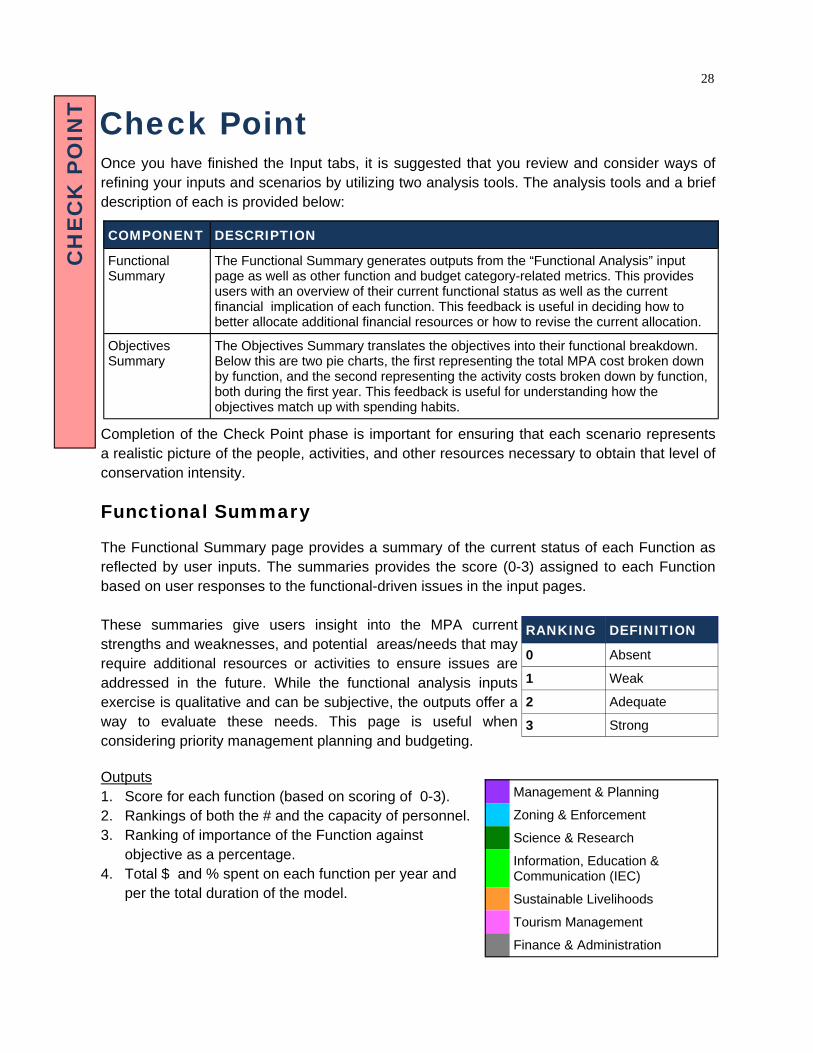
Check Point Once you have finished the Input tabs, it is suggested that you review and consider ways of refining your inputs and scenarios by utilizing two analysis tools. The analysis tools and a brief description of each is provided below:
Completion of the Check Point phase is important for ensuring that each scenario represents a realistic picture of the people, activities, and other resources necessary to obtain that level of conservation intensity.
Functional Summary The Functional Summary page provides a summary of the current status of each Function as reflected by user inputs. The summaries provides the score (0-3) assigned to each Function based on user responses to the functional-driven issues in the input pages. These summaries give users insight into the MPA current strengths and weaknesses, and potential areas/needs that may require additional resources or activities to ensure issues are addressed in the future. While the functional analysis inputs exercise is qualitative and can be subjective, the outputs offer a way to evaluate these needs. This page is useful when considering priority management planning and budgeting. Outputs 1. Score for each function (based on scoring of 0-3). 2. Rankings of both the # and the capacity of personnel. 3. Ranking of importance of the Function against
objective as a percentage. 4. Total $ and % spent on each function per year and
per the total duration of the model.
COMPONENT DESCRIPTION
Functional Summary
The Functional Summary generates outputs from the “Functional Analysis” input page as well as other function and budget category-related metrics. This provides users with an overview of their current functional status as well as the current financial implication of each function. This feedback is useful in deciding how to better allocate additional financial resources or how to revise the current allocation.
Objectives Summary
The Objectives Summary translates the objectives into their functional breakdown. Below this are two pie charts, the first representing the total MPA cost broken down by function, and the second representing the activity costs broken down by function, both during the first year. This feedback is useful for understanding how the objectives match up with spending habits.
CH
EC
K P
OIN
T
RANKING DEFINITION
0 Absent
1 Weak
2 Adequate
3 Strong
Management & Planning
Zoning & Enforcement
Science & Research
Information, Education & Communication (IEC)
Sustainable Livelihoods
Tourism Management
Finance & Administration
29 C
HE
CK
PO
INT
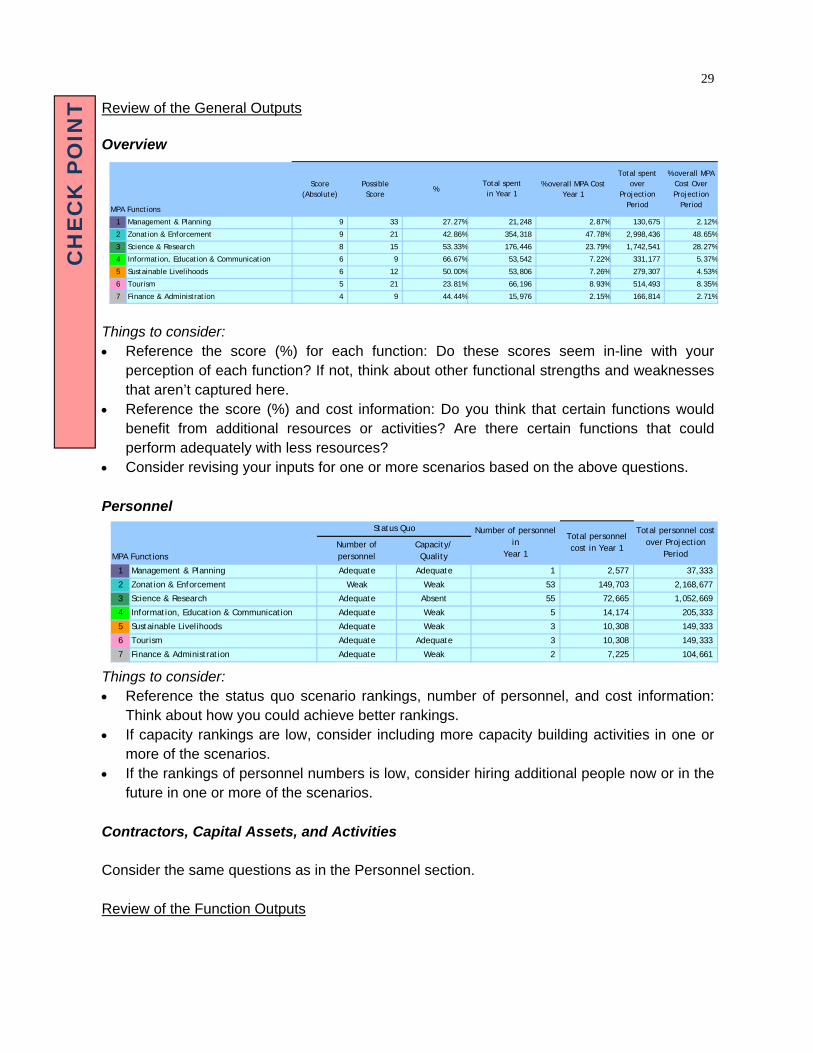
Review of the General Outputs Overview
Things to consider: • Reference the score (%) for each function: Do these scores seem in-line with your
perception of each function? If not, think about other functional strengths and weaknesses that aren’t captured here.
• Reference the score (%) and cost information: Do you think that certain functions would benefit from additional resources or activities? Are there certain functions that could perform adequately with less resources?
• Consider revising your inputs for one or more scenarios based on the above questions. Personnel
Things to consider: • Reference the status quo scenario rankings, number of personnel, and cost information:
Think about how you could achieve better rankings. • If capacity rankings are low, consider including more capacity building activities in one or
more of the scenarios. • If the rankings of personnel numbers is low, consider hiring additional people now or in the
future in one or more of the scenarios. Contractors, Capital Assets, and Activities Consider the same questions as in the Personnel section. Review of the Function Outputs
MPA FunctionsNumber of personnel
Capacity/Quality
1 Management & Planning Adequate Adequate 1 37,333
2 Zonation & Enforcement Weak Weak 53 2,168,677
3 Science & Research Adequate Absent 55 1,052,669
4 Information, Education & Communication Adequate Weak 5 205,333
5 Sustainable Livelihoods Adequate Weak 3 149,333
6 Tourism Adequate Adequate 3 149,333
7 Finance & Administration Adequate Weak 2 104,661
10,308
10,308
Status Quo Number of personnel in
Year 1
2,577
149,703
7,225
72,665
14,174
Total personnel cost over Projection
Period
Total personnel cost in Year 1
MPA Functions
Score (Absolute)
Possible Score
%% overall MPA Cost
Year 1
Total spent over
Projection Period
% overall MPA Cost Over Projection
Period
1 Management & Planning 9 33 27.27% 2.87% 130,675 2.12%
2 Zonation & Enforcement 9 21 42.86% 47.78% 2,998,436 48.65%
3 Science & Research 8 15 53.33% 23.79% 1,742,541 28.27%
4 Information, Education & Communication 6 9 66.67% 7.22% 331,177 5.37%
5 Sustainable Livelihoods 6 12 50.00% 7.26% 279,307 4.53%
6 Tourism 5 21 23.81% 8.93% 514,493 8.35%
7 Finance & Administration 4 9 44.44% 2.15% 166,814 2.71%
Total spent in Year 1
21,248
354,318
176,446
53,542
53,806
66,196
15,976
30
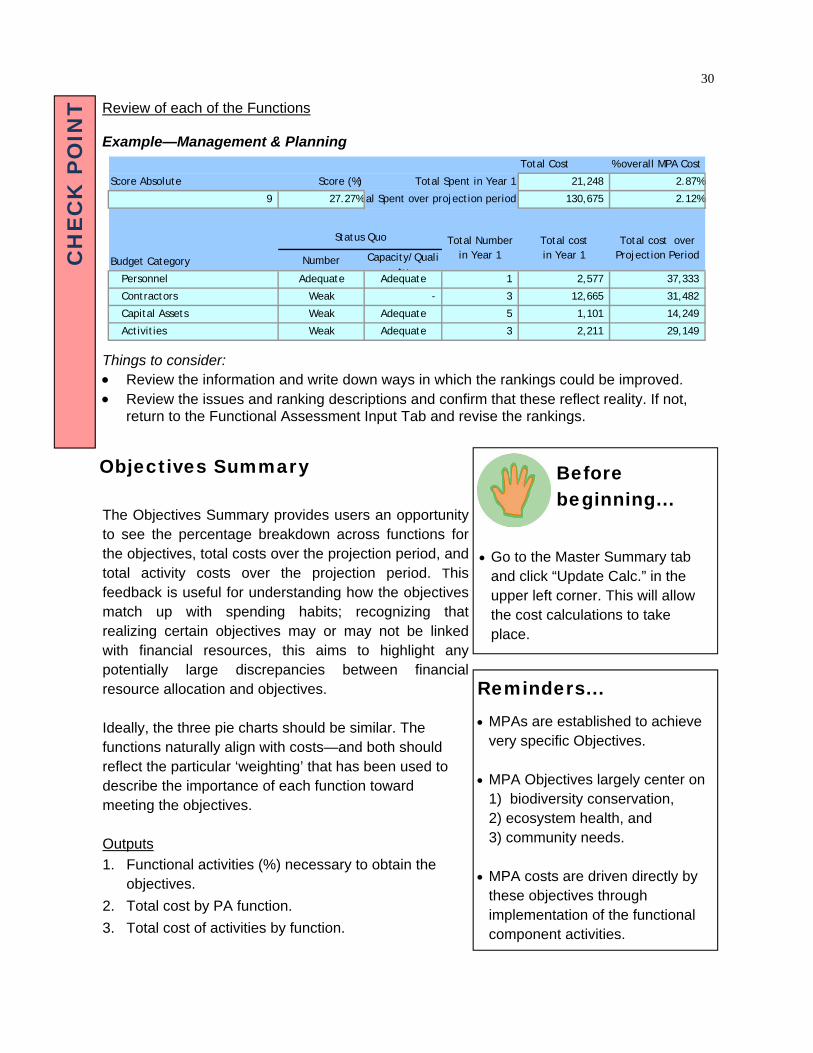
Objectives Summary
The Objectives Summary provides users an opportunity to see the percentage breakdown across functions for the objectives, total costs over the projection period, and total activity costs over the projection period. This feedback is useful for understanding how the objectives match up with spending habits; recognizing that realizing certain objectives may or may not be linked with financial resources, this aims to highlight any potentially large discrepancies between financial resource allocation and objectives. Ideally, the three pie charts should be similar. The functions naturally align with costs—and both should reflect the particular ‘weighting’ that has been used to describe the importance of each function toward meeting the objectives. Outputs 1. Functional activities (%) necessary to obtain the
objectives. 2. Total cost by PA function. 3. Total cost of activities by function.
CH
EC
K P
OIN
T
Reminders... • MPAs are established to achieve
very specific Objectives. • MPA Objectives largely center on
1) biodiversity conservation, 2) ecosystem health, and 3) community needs.
• MPA costs are driven directly by
these objectives through implementation of the functional component activities.
Before beginning...
• Go to the Master Summary tab and click “Update Calc.” in the upper left corner. This will allow the cost calculations to take place.
Review of each of the Functions Example—Management & Planning
Things to consider: • Review the information and write down ways in which the rankings could be improved. • Review the issues and ranking descriptions and confirm that these reflect reality. If not,
return to the Functional Assessment Input Tab and revise the rankings.
Total Cost
Score Absolute Score (%) Total Spent in Year 1 21,248
27.27%tal Spent over projection period 130,675
Budget Category Number Capacity/Quality
Personnel Adequate Adequate 1 2,577
Contractors Weak - 3 12,665
Capital Assets Weak Adequate 5 1,101
Activities Weak Adequate 3 2,211
% overall MPA Cost
14,249
31,482
37,333
2.12%
Total cost over Projection Period
2.87%
29,149
Total Number in Year 1
Status Quo Total cost in Year 1
9

31
Example:
Things to consider: • Does the pie chart representation of the MPA objectives provide an accurate picture of the
functional breakdown of objectives? If not, consider revising the MPA objectives and/or MPA objective functional allocations.
• Reference the objectives functional breakdown and the total cost for the projection period: Does it seem reasonable to assume that the MPA can reach its objectives provided it can find cash sources to cover these costs? Consider revising one or more scenario(s) if needed.
• Reference the objectives functional breakdown and the total cost of activities by function: Does it seem reasonable to assume that the MPA can reach its objectives by spending this much money on activities? Consider adding or deleting activities that may or may not be necessary to achieve the MPA objectives.
CH
EC
K P
OIN
T
Objective
MPA FUNCTION % Amount % Amount %
1 Management & Planning 15.0% 130,675 2.1% 29,149 2.5%
2 Zonation & Enforcement 33.3% 2,998,436 48.6% 535,456 46.3%
3 Science & Research 16.7% 1,742,541 28.3% 504,052 43.6%
4 Information, Education & Communication 13.3% 331,177 5.4% 21,862 1.9%
5 Sustainable Livelihoods 8.3% 279,307 4.5% 21,862 1.9%
6 Tourism Management 8.3% 514,493 8.3% 21,862 1.9%
7 Finance & Administration 5.0% 166,814 2.7% 21,862 1.9%
8 Others 0.0% - 0.0% - 0.0%
Objective Graph Total Cost Graph Activity Cost Graph
Total Cost for 10 Years Total Activity Cost for 10 Years

32
Outputs Overview The Output section of the Model and this manual provide a focused overview of information and projections that the user will find useful for focused assessment, analysis, communication, and decision-making. The outputs are provided in a variety of formats (e.g., charts, graphs, financial statements) and in a variety of ways (e.g., costs broken down by functional components or budget categories, costs in dollar values or percentages of total cost). The outputs are organized in a framework that helps to focus the design and management of MPAs. While there is a great deal of flexibility in how the outputs are presented, the majority of them are broken down by function or budget category. This provides a clear and transparent overview of the functional efforts and primary cost drivers of a given MPA and allows for comparisons of functional and budget category costs.
OUTPUTS
Master Summary
MPA Summary
Graphs
Cost by Function & Budget
Financial Statements
Activity Summary
Fuel Summary
Endowment Calculation
Scenario Comparison
Model Comparison
OU
TP
UT
S
USES DESCRIPTION
Creation or Revision of a Management Plan
The Model should be utilized during the creation of a Management Plan or with reference to the current Management Plan. The outputs can be directly pasted into the Management Plan to provide specific cost information related to the functional components.
Creation of a Financial Plan
The Model identifies the costs over the projection period and the existing funding/revenue to help cover these costs. Regardless of whether there is a gap in available funding/revenue and required cost, it is important to develop a financial plan that identifies potential additional funding and revenue sources.
Creation of an Endowment Fund Business Plan
The Model provides a forecast of the size of the initial endowment necessary to cover the MPA costs over the projection period. This information, coupled with the detailed, transparent information about the MPA objectives, functions, and budget categories allows for the creation of a strong, data-based, realistic business plan to use for raising money to capitalize and focus an endowment fund for the area.
Management effectiveness review
The cost data, MPA objectives and Management Plan, provide insights into how resources are being allocated, how many personnel are dedicated to certain functional components, and how many activities are occurring in each function.
Donor proposals The Model provides a clear review of the cost requirements of developing and managing a MPA given certain levels of conservation effort. The outputs can be directly pasted into donor proposals to provide specific cost information related to the functional components and budget categories. This allows MPA practitioners to be clear on their program requirements and funding needs.
Donor Reports The Model outputs can also be utilized in reports to donors to show the current and projected costs associated with the MPA.
Program Yearly Reports
The Model outputs can also be utilized in general organization or MPA reports to show interested parties and stakeholders the costs associated with the MPA in a clear and transparent format.
Uses
33
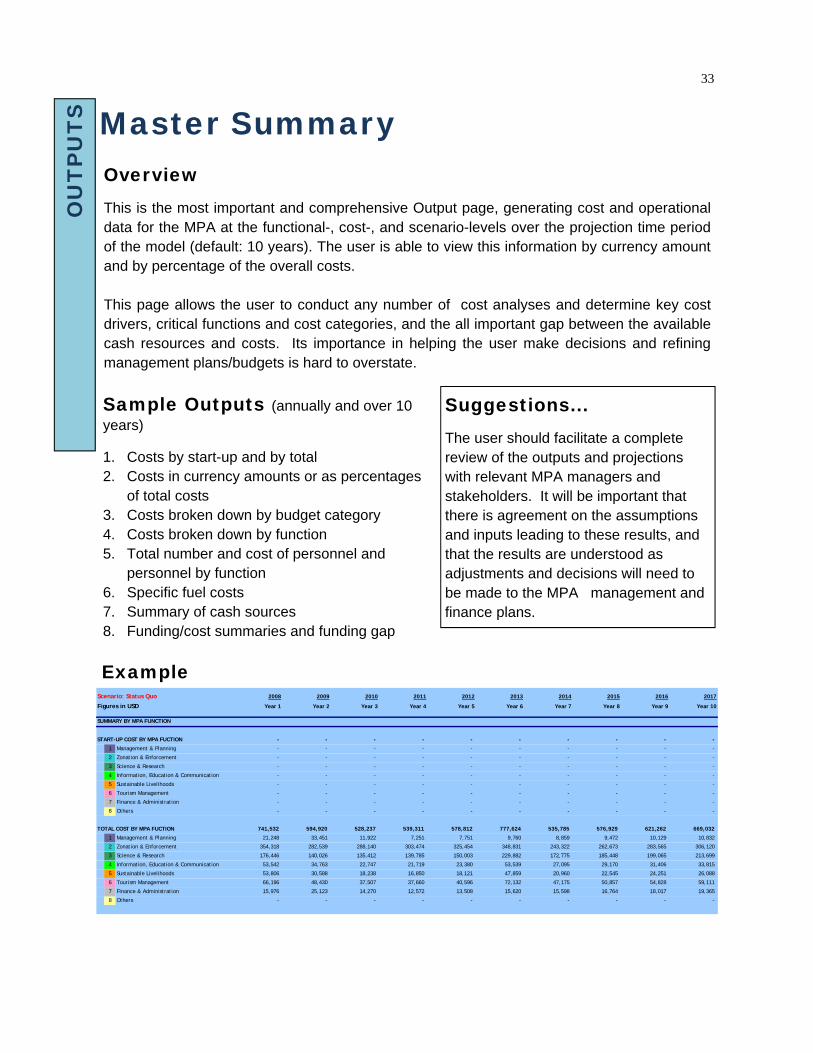
Master Summary
OU
TP
UT
S
Overview This is the most important and comprehensive Output page, generating cost and operational data for the MPA at the functional-, cost-, and scenario-levels over the projection time period of the model (default: 10 years). The user is able to view this information by currency amount and by percentage of the overall costs. This page allows the user to conduct any number of cost analyses and determine key cost drivers, critical functions and cost categories, and the all important gap between the available cash resources and costs. Its importance in helping the user make decisions and refining management plans/budgets is hard to overstate.
Suggestions... The user should facilitate a complete review of the outputs and projections with relevant MPA managers and stakeholders. It will be important that there is agreement on the assumptions and inputs leading to these results, and that the results are understood as adjustments and decisions will need to be made to the MPA management and finance plans.
Sample Outputs (annually and over 10 years) 1. Costs by start-up and by total 2. Costs in currency amounts or as percentages
of total costs 3. Costs broken down by budget category 4. Costs broken down by function 5. Total number and cost of personnel and
personnel by function 6. Specific fuel costs 7. Summary of cash sources 8. Funding/cost summaries and funding gap
Example Scenario: Status Quo 2008 2009 2010 2011 2012 2013 2014 2015 2016 2017
Figures in USD Year 1 Year 2 Year 3 Year 4 Year 5 Year 6 Year 7 Year 8 Year 9 Year 10
SUMMARY BY MPA FUNCTION
START-UP COST BY MPA FUCTION - - - - - - - - - -
1 Management & Planning - - - - - - - - - -
2 Zonation & Enforcement - - - - - - - - - -
3 Science & Research - - - - - - - - - -
4 Information, Education & Communication - - - - - - - - - -
5 Sustainable Livelihoods - - - - - - - - - -
6 Tourism Management - - - - - - - - - -
7 Finance & Administration - - - - - - - - - -
8 Others - - - - - - - - - -
TOTAL COST BY MPA FUCTION 741,532 594,920 528,237 539,311 578,812 777,624 535,785 576,929 621,262 669,032
1 Management & Planning 21,248 33,451 11,922 7,251 7,751 9,760 8,859 9,472 10,129 10,832
2 Zonation & Enforcement 354,318 282,539 288,140 303,474 325,454 348,831 243,322 262,673 283,565 306,120
3 Science & Research 176,446 140,026 135,412 139,785 150,003 229,882 172,775 185,448 199,065 213,699
4 Information, Education & Communication 53,542 34,763 22,747 21,719 23,380 53,539 27,095 29,170 31,406 33,815
5 Sustainable Livelihoods 53,806 30,588 18,238 16,850 18,121 47,859 20,960 22,545 24,251 26,088
6 Tourism Management 66,196 48,430 37,507 37,660 40,596 72,132 47,175 50,857 54,828 59,111
7 Finance & Administration 15,976 25,123 14,270 12,572 13,508 15,620 15,598 16,764 18,017 19,365
8 Others - - - - - - - - - -
34
MPA Summary
Example
Overview & Specific Outputs The MPA Summary page provides a summary profile of the level of current scientific data and understanding, political support, conservation effort, available infrastructure, access, and level of funding the MPA enjoys. This page provides users with a quick snapshot of scoring against those primary factors and considerations necessary to develop and maintain a comprehensive and effective MPA. These factors and considerations include: • General MPA characteristics • Ecological characteristics • Natural and human induced threats • Community size, perception & understanding of the
MPA, and livelihoods • Stakeholders The page includes graphs which visually illustrate the score, or ranking, that each factor was given during the inputs process.
Reminder... • This information acts as a baseline
for forecasting management and cost requirements for the MPA going forward.
• As noted earlier, this information is
not directly used to make cost calculations, but aims to provide users with an overview of factors to consider in completing the other input tabs and building various scenarios. It is an important part of making decisions about priority and focus for MPA management and funding.
OU
TP
UT
S
0
1
2
3
Waste polution Cyanide fishing Blast Fishing Coral Mining Boat Achoring
Human Induced ThreatsNo. Threat Description Ranking
1 Waste polution Medium
2 Cyanide fishing Low
3 Blast Fishing High
4 Coral Mining Low
5 Boat Achoring Low
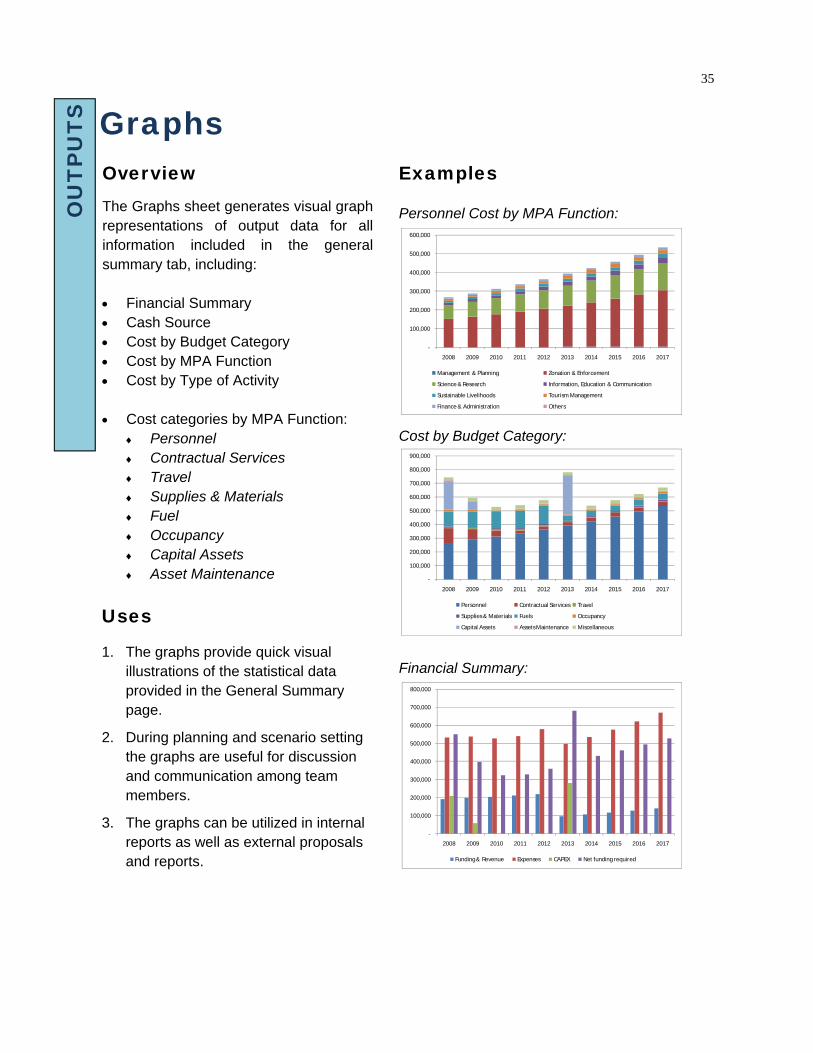
35
Graphs
Uses 1. The graphs provide quick visual
illustrations of the statistical data provided in the General Summary page.
2. During planning and scenario setting the graphs are useful for discussion and communication among team members.
3. The graphs can be utilized in internal reports as well as external proposals and reports.
Overview The Graphs sheet generates visual graph representations of output data for all information included in the general summary tab, including: • Financial Summary • Cash Source • Cost by Budget Category • Cost by MPA Function • Cost by Type of Activity • Cost categories by MPA Function:
♦ Personnel ♦ Contractual Services ♦ Travel ♦ Supplies & Materials ♦ Fuel ♦ Occupancy ♦ Capital Assets ♦ Asset Maintenance
Examples Personnel Cost by MPA Function:
Cost by Budget Category:
Financial Summary:
OU
TP
UT
S
-
100,000
200,000
300,000
400,000
500,000
600,000
2008 2009 2010 2011 2012 2013 2014 2015 2016 2017
Management & Planning Zonation & Enforcement
Science & Research Information, Education & Communication
Sustainable Livelihoods Tourism Management
Finance & Administration Others
-
100,000
200,000
300,000
400,000
500,000
600,000
700,000
800,000
900,000
2008 2009 2010 2011 2012 2013 2014 2015 2016 2017
Personnel Contractual Services Travel
Supplies & Materials Fuels Occupancy
Capital Assets Assets Maintenance Miscellaneous
-
100,000
200,000
300,000
400,000
500,000
600,000
700,000
800,000
2008 2009 2010 2011 2012 2013 2014 2015 2016 2017
Funding & Revenue Expenses CAPEX Net funding required
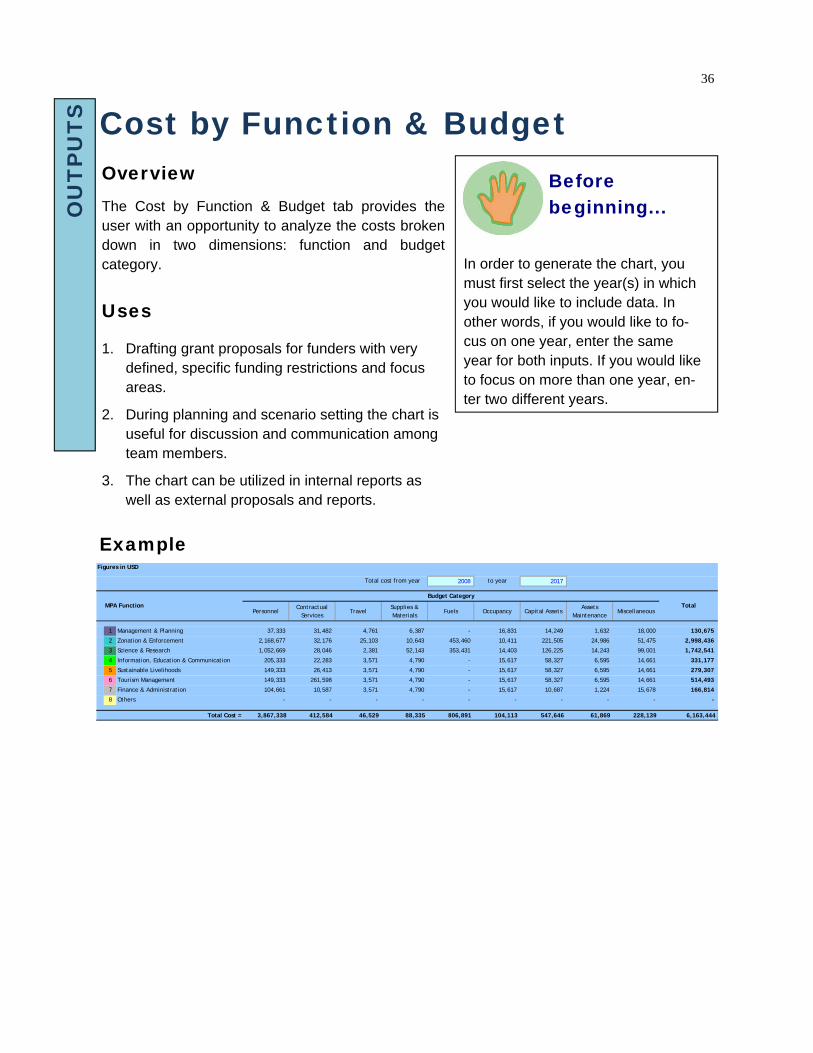
36
Cost by Function & Budget
Uses 1. Drafting grant proposals for funders with very
defined, specific funding restrictions and focus areas.
2. During planning and scenario setting the chart is useful for discussion and communication among team members.
3. The chart can be utilized in internal reports as well as external proposals and reports.
Overview The Cost by Function & Budget tab provides the user with an opportunity to analyze the costs broken down in two dimensions: function and budget category.
OU
TP
UT
S
In order to generate the chart, you must first select the year(s) in which you would like to include data. In other words, if you would like to fo-cus on one year, enter the same year for both inputs. If you would like to focus on more than one year, en-ter two different years.
Before beginning...
Example Figures in USD
Total cost from year 2008 to year 2017
MPA FunctionPersonnel
Contractual Services
TravelSupplies & Materials
Fuels Occupancy Capital AssetsAssets
MaintenanceMiscellaneous
Total
1 Management & Planning 37,333 31,482 4,761 6,387 - 16,831 14,249 1,632 18,000 130,675
2 Zonation & Enforcement 2,168,677 32,176 25,103 10,643 453,460 10,411 221,505 24,986 51,475 2,998,436
3 Science & Research 1,052,669 28,046 2,381 52,143 353,431 14,403 126,225 14,243 99,001 1,742,541
4 Information, Education & Communication 205,333 22,283 3,571 4,790 - 15,617 58,327 6,595 14,661 331,177
5 Sustainable Livelihoods 149,333 26,413 3,571 4,790 - 15,617 58,327 6,595 14,661 279,307
6 Tourism Management 149,333 261,598 3,571 4,790 - 15,617 58,327 6,595 14,661 514,493
7 Finance & Administration 104,661 10,587 3,571 4,790 - 15,617 10,687 1,224 15,678 166,814
8 Others - - - - - - - - - -
Total Cost = 3,867,338 412,584 46,529 88,335 806,891 104,113 547,646 61,869 228,139 6,163,444
Budget Category
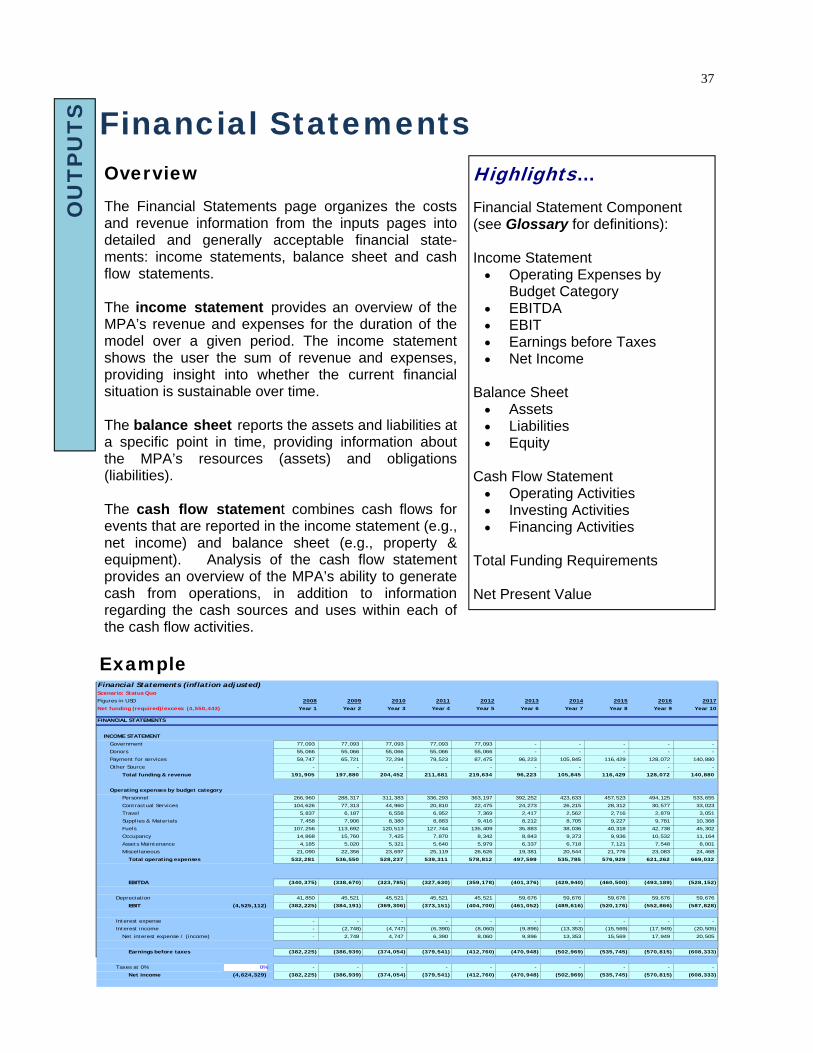
37
Financial Statements Overview The Financial Statements page organizes the costs and revenue information from the inputs pages into detailed and generally acceptable financial state-ments: income statements, balance sheet and cash flow statements. The income statement provides an overview of the MPA’s revenue and expenses for the duration of the model over a given period. The income statement shows the user the sum of revenue and expenses, providing insight into whether the current financial situation is sustainable over time. The balance sheet reports the assets and liabilities at a specific point in time, providing information about the MPA’s resources (assets) and obligations (liabilities). The cash flow statement combines cash flows for events that are reported in the income statement (e.g., net income) and balance sheet (e.g., property & equipment). Analysis of the cash flow statement provides an overview of the MPA’s ability to generate cash from operations, in addition to information regarding the cash sources and uses within each of the cash flow activities.
OU
TP
UT
S
Highlights… Financial Statement Component (see Glossary for definitions): Income Statement
• Operating Expenses by Budget Category
• EBITDA • EBIT • Earnings before Taxes • Net Income
Balance Sheet
• Assets • Liabilities • Equity
Cash Flow Statement
• Operating Activities • Investing Activities • Financing Activities
Total Funding Requirements Net Present Value
Example
Financial Statements (inflation adjusted)Scenario: Status Quo
Figures in USD 2008 2009 2010 2011 2012 2013 2014 2015 2016 2017
Net funding (required)/excess: (4,550,443) Year 1 Year 2 Year 3 Year 4 Year 5 Year 6 Year 7 Year 8 Year 9 Year 10
FINANCIAL STATEMENTS
INCOME STATEMENT
Government 77,093 77,093 77,093 77,093 77,093 - - - - -
Donors 55,066 55,066 55,066 55,066 55,066 - - - - -
Payment for services 59,747 65,721 72,294 79,523 87,475 96,223 105,845 116,429 128,072 140,880
Other Source - - - - - - - - - -
Total funding & revenue 191,905 197,880 204,452 211,681 219,634 96,223 105,845 116,429 128,072 140,880
Operating expenses by budget category
Personnel 266,960 288,317 311,383 336,293 363,197 392,252 423,633 457,523 494,125 533,655
Contractual Services 104,626 77,313 44,960 20,810 22,475 24,273 26,215 28,312 30,577 33,023
Travel 5,837 6,187 6,558 6,952 7,369 2,417 2,562 2,716 2,879 3,051
Supplies & Materials 7,458 7,906 8,380 8,883 9,416 8,212 8,705 9,227 9,781 10,368
Fuels 107,256 113,692 120,513 127,744 135,409 35,883 38,036 40,318 42,738 45,302
Occupancy 14,868 15,760 7,425 7,870 8,342 8,843 9,373 9,936 10,532 11,164
Assets Maintenance 4,185 5,020 5,321 5,640 5,979 6,337 6,718 7,121 7,548 8,001
Miscellaneous 21,090 22,356 23,697 25,119 26,626 19,381 20,544 21,776 23,083 24,468
Total operating expenses 532,281 536,550 528,237 539,311 578,812 497,599 535,785 576,929 621,262 669,032
EBITDA (340,375) (338,670) (323,785) (327,630) (359,178) (401,376) (429,940) (460,500) (493,189) (528,152)
Depreciation 41,850 45,521 45,521 45,521 45,521 59,676 59,676 59,676 59,676 59,676
EBIT (4,525,112) (382,225) (384,191) (369,306) (373,151) (404,700) (461,052) (489,616) (520,176) (552,866) (587,828)
Interest expense - - - - - - - - - -
Interest income - (2,748) (4,747) (6,390) (8,060) (9,896) (13,353) (15,569) (17,949) (20,505)
Net interest expense / (income) - 2,748 4,747 6,390 8,060 9,896 13,353 15,569 17,949 20,505
Earnings before taxes (382,225) (386,939) (374,054) (379,541) (412,760) (470,948) (502,969) (535,745) (570,815) (608,333)
Taxes at 0% 0% - - - - - - - - - -
Net income (4,624,329) (382,225) (386,939) (374,054) (379,541) (412,760) (470,948) (502,969) (535,745) (570,815) (608,333)
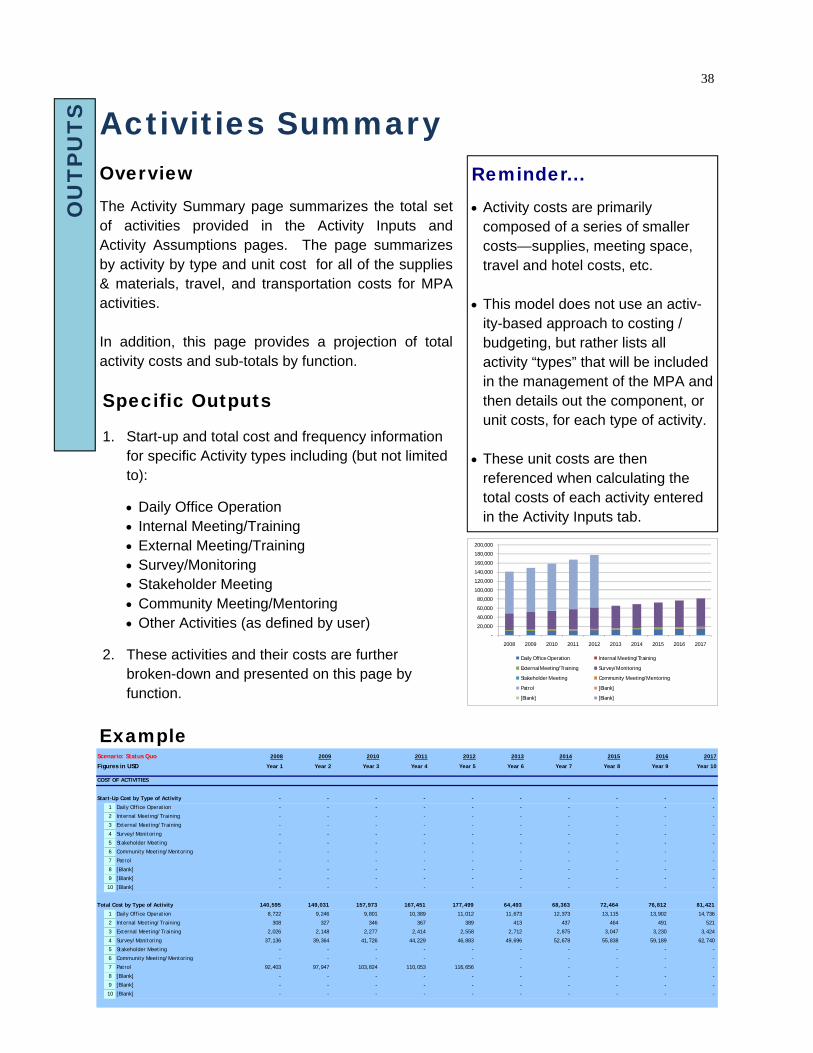
38
Activities Summary
Example
Specific Outputs 1. Start-up and total cost and frequency information
for specific Activity types including (but not limited to):
• Daily Office Operation • Internal Meeting/Training • External Meeting/Training • Survey/Monitoring • Stakeholder Meeting • Community Meeting/Mentoring • Other Activities (as defined by user)
2. These activities and their costs are further broken-down and presented on this page by function.
Overview The Activity Summary page summarizes the total set of activities provided in the Activity Inputs and Activity Assumptions pages. The page summarizes by activity by type and unit cost for all of the supplies & materials, travel, and transportation costs for MPA activities. In addition, this page provides a projection of total activity costs and sub-totals by function.
Reminder... • Activity costs are primarily
composed of a series of smaller costs—supplies, meeting space, travel and hotel costs, etc.
• This model does not use an activ-
ity-based approach to costing / budgeting, but rather lists all activity “types” that will be included in the management of the MPA and then details out the component, or unit costs, for each type of activity.
• These unit costs are then
referenced when calculating the total costs of each activity entered in the Activity Inputs tab.
OU
TP
UT
S
Scenario: Status Quo 2008 2009 2010 2011 2012 2013 2014 2015 2016 2017
Figures in USD Year 1 Year 2 Year 3 Year 4 Year 5 Year 6 Year 7 Year 8 Year 9 Year 10
COST OF ACTIVITIES
Start-Up Cost by Type of Activity - - - - - - - - - -
1 Daily Office Operation - - - - - - - - - -
2 Internal Meeting/Training - - - - - - - - - -
3 External Meeting/Training - - - - - - - - - -
4 Survey/Monitoring - - - - - - - - - -
5 Stakeholder Meeting - - - - - - - - - -
6 Community Meeting/Mentoring - - - - - - - - - -
7 Patrol - - - - - - - - - -
8 [Blank] - - - - - - - - - -
9 [Blank] - - - - - - - - - -
10 [Blank] - - - - - - - - - -
Total Cost by Type of Activity 140,595 149,031 157,973 167,451 177,499 64,493 68,363 72,464 76,812 81,421
1 Daily Office Operation 8,722 9,246 9,801 10,389 11,012 11,673 12,373 13,115 13,902 14,736
2 Internal Meeting/Training 308 327 346 367 389 413 437 464 491 521
3 External Meeting/Training 2,026 2,148 2,277 2,414 2,558 2,712 2,875 3,047 3,230 3,424
4 Survey/Monitoring 37,136 39,364 41,726 44,229 46,883 49,696 52,678 55,838 59,189 62,740
5 Stakeholder Meeting - - - - - - - - - -
6 Community Meeting/Mentoring - - - - - - - - - -
7 Patrol 92,403 97,947 103,824 110,053 116,656 - - - - -
8 [Blank] - - - - - - - - - -
9 [Blank] - - - - - - - - - -
10 [Blank] - - - - - - - - - -
-
20,000
40,000
60,000
80,000
100,000
120,000
140,000
160,000
180,000
200,000
2008 2009 2010 2011 2012 2013 2014 2015 2016 2017
Daily Office Operation Internal Meeting/Training
External Meeting/Training Survey/Monitoring
Stakeholder Meeting Community Meeting/Mentoring
Patrol [Blank]
[Blank] [Blank]
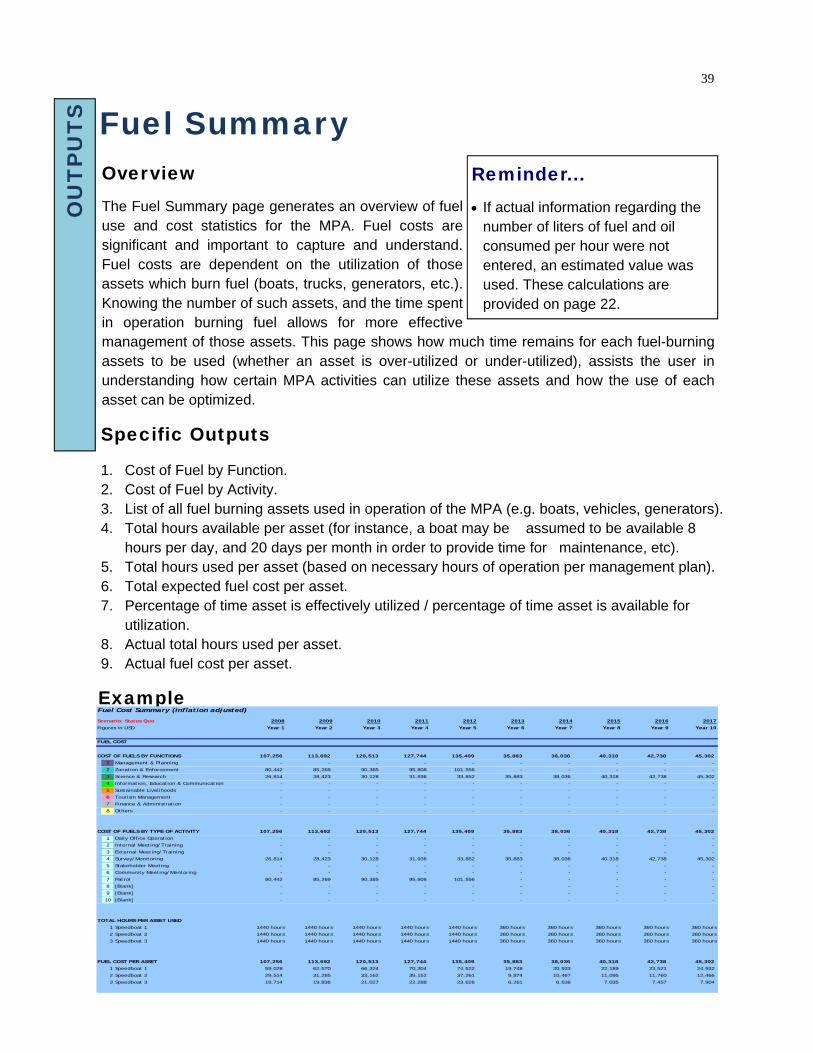
39
Fuel Summary O
UT
PU
TS
Overview The Fuel Summary page generates an overview of fuel use and cost statistics for the MPA. Fuel costs are significant and important to capture and understand. Fuel costs are dependent on the utilization of those assets which burn fuel (boats, trucks, generators, etc.). Knowing the number of such assets, and the time spent in operation burning fuel allows for more effective management of those assets. This page shows how much time remains for each fuel-burning assets to be used (whether an asset is over-utilized or under-utilized), assists the user in understanding how certain MPA activities can utilize these assets and how the use of each asset can be optimized.
Example
Specific Outputs 1. Cost of Fuel by Function. 2. Cost of Fuel by Activity. 3. List of all fuel burning assets used in operation of the MPA (e.g. boats, vehicles, generators). 4. Total hours available per asset (for instance, a boat may be assumed to be available 8
hours per day, and 20 days per month in order to provide time for maintenance, etc). 5. Total hours used per asset (based on necessary hours of operation per management plan). 6. Total expected fuel cost per asset. 7. Percentage of time asset is effectively utilized / percentage of time asset is available for
utilization. 8. Actual total hours used per asset. 9. Actual fuel cost per asset.
Reminder... • If actual information regarding the
number of liters of fuel and oil consumed per hour were not entered, an estimated value was used. These calculations are provided on page 22.
Fuel Cost Summary (inflation adjusted)
Scenario: Status Quo 2008 2009 2010 2011 2012 2013 2014 2015 2016 2017
Figures in USD Year 1 Year 2 Year 3 Year 4 Year 5 Year 6 Year 7 Year 8 Year 9 Year 10
FUEL COST
COST OF FUELS BY FUNCTIONS 107,256 113,692 120,513 127,744 135,409 35,883 38,036 40,318 42,738 45,302
1 Management & Planning - - - - - - - - - -
2 Zonation & Enforcement 80,442 85,269 90,385 95,808 101,556 - - - - -
3 Science & Research 26,814 28,423 30,128 31,936 33,852 35,883 38,036 40,318 42,738 45,302
4 Information, Education & Communication - - - - - - - - - -
5 Sustainable Livelihoods - - - - - - - - - -
6 Tourism Management - - - - - - - - - -
7 Finance & Administration - - - - - - - - - -
8 Others - - - - - - - - - -
COST OF FUELS BY TYPE OF ACTIVITY 107,256 113,692 120,513 127,744 135,409 35,883 38,036 40,318 42,738 45,302
1 Daily Office Operation - - - - - - - - - -
2 Internal Meeting/Training - - - - - - - - - -
3 External Meeting/Training - - - - - - - - - -
4 Survey/Monitoring 26,814 28,423 30,128 31,936 33,852 35,883 38,036 40,318 42,738 45,302
5 Stakeholder Meeting - - - - - - - - - -
6 Community Meeting/Mentoring - - - - - - - - - -
7 Patrol 80,442 85,269 90,385 95,808 101,556 - - - - -
8 [Blank] - - - - - - - - - -
9 [Blank] - - - - - - - - - -
10 [Blank] - - - - - - - - - -
TOTAL HOURS PER ASSET USED
1 Speedboat 1 1440 hours 1440 hours 1440 hours 1440 hours 1440 hours 360 hours 360 hours 360 hours 360 hours 360 hours
2 Speedboat 2 1440 hours 1440 hours 1440 hours 1440 hours 1440 hours 360 hours 360 hours 360 hours 360 hours 360 hours
3 Speedboat 3 1440 hours 1440 hours 1440 hours 1440 hours 1440 hours 360 hours 360 hours 360 hours 360 hours 360 hours
FUEL COST PER ASSET 107,256 113,692 120,513 127,744 135,409 35,883 38,036 40,318 42,738 45,302
1 Speedboat 1 59,028 62,570 66,324 70,304 74,522 19,748 20,933 22,189 23,521 24,932
2 Speedboat 2 29,514 31,285 33,162 35,152 37,261 9,874 10,467 11,095 11,760 12,466
3 Speedboat 3 18,714 19,836 21,027 22,288 23,626 6,261 6,636 7,035 7,457 7,904
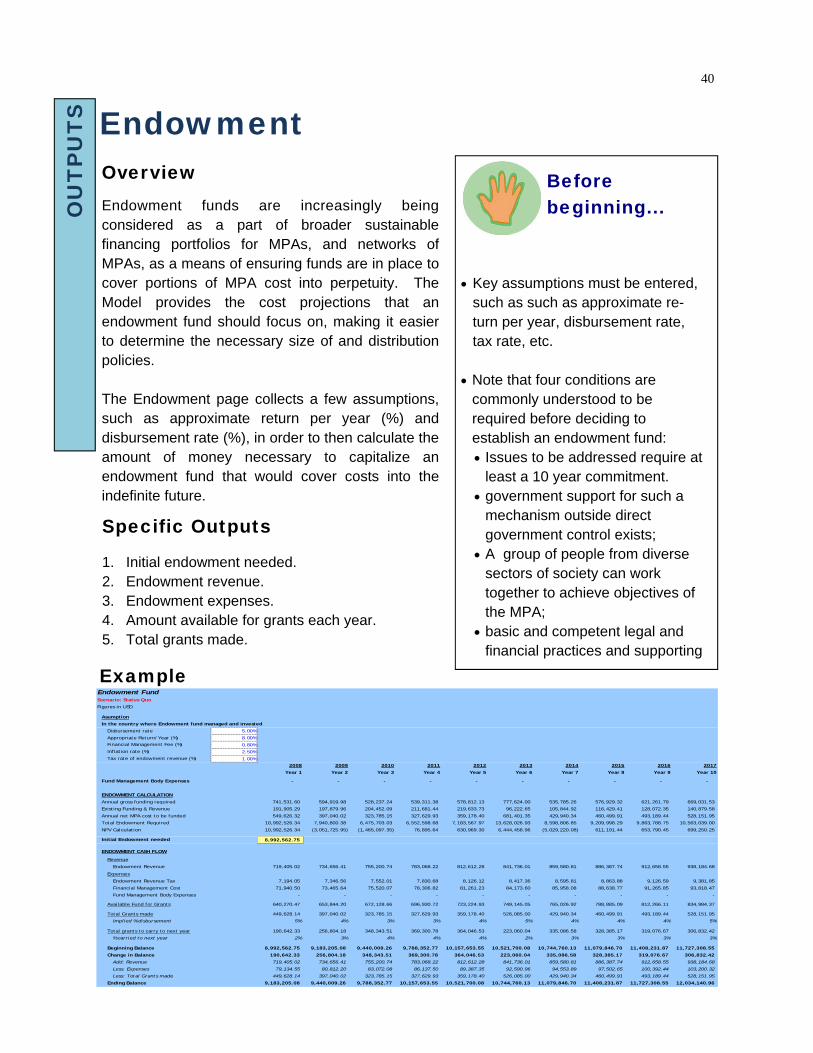
40
Endowment O
UT
PU
TS
Overview Endowment funds are increasingly being considered as a part of broader sustainable financing portfolios for MPAs, and networks of MPAs, as a means of ensuring funds are in place to cover portions of MPA cost into perpetuity. The Model provides the cost projections that an endowment fund should focus on, making it easier to determine the necessary size of and distribution policies. The Endowment page collects a few assumptions, such as approximate return per year (%) and disbursement rate (%), in order to then calculate the amount of money necessary to capitalize an endowment fund that would cover costs into the indefinite future.
• Key assumptions must be entered,
such as such as approximate re-turn per year, disbursement rate, tax rate, etc.
• Note that four conditions are
commonly understood to be required before deciding to establish an endowment fund: • Issues to be addressed require at
least a 10 year commitment. • government support for such a
mechanism outside direct government control exists;
• A group of people from diverse sectors of society can work together to achieve objectives of the MPA;
• basic and competent legal and financial practices and supporting
Specific Outputs 1. Initial endowment needed. 2. Endowment revenue. 3. Endowment expenses. 4. Amount available for grants each year. 5. Total grants made.
Before beginning...
Example Endowment FundScenario: Status Quo
Figures in USD
Asumption
In the country where Endowment fund managed and invested
Disbursement rate 5.00%
Appropriate Return/Year (%) 8.00%
Financial Management Fee (%) 0.80%
Inflation rate (%) 2.50%
Tax rate of endowment revenue (%) 1.00%
2008 2009 2010 2011 2012 2013 2014 2015 2016 2017
Year 1 Year 2 Year 3 Year 4 Year 5 Year 6 Year 7 Year 8 Year 9 Year 10
Fund Management Body Expenses - - - - - - - - - -
ENDOWMENT CALCULATION
Annual gross funding required 741,531.60 594,919.98 528,237.24 539,311.38 578,812.13 777,624.00 535,785.26 576,929.32 621,261.79 669,031.53
Existing Funding & Revenue 191,905.29 197,879.96 204,452.09 211,681.44 219,633.73 96,222.65 105,844.92 116,429.41 128,072.35 140,879.58
Annual net MPA cost to be funded 549,626.32 397,040.02 323,785.15 327,629.93 359,178.40 681,401.35 429,940.34 460,499.91 493,189.44 528,151.95
Total Endowment Required 10,992,526.34 7,940,800.38 6,475,703.03 6,552,598.68 7,183,567.97 13,628,026.93 8,598,806.85 9,209,998.29 9,863,788.75 10,563,039.00
NPV Calculation 10,992,526.34 (3,051,725.95) (1,465,097.35) 76,895.64 630,969.30 6,444,458.96 (5,029,220.08) 611,191.44 653,790.45 699,250.25
Initial Endowment needed 8,992,562.75
ENDOWMENT CASH FLOW
Revenue
Endowment Revenue 719,405.02 734,656.41 755,200.74 783,068.22 812,612.28 841,736.01 859,580.81 886,387.74 912,658.55 938,184.68
Expenses
Endowment Revenue Tax 7,194.05 7,346.56 7,552.01 7,830.68 8,126.12 8,417.36 8,595.81 8,863.88 9,126.59 9,381.85
Financial Management Cost 71,940.50 73,465.64 75,520.07 78,306.82 81,261.23 84,173.60 85,958.08 88,638.77 91,265.85 93,818.47
Fund Management Body Expenses - - - - - - - - - -
Available Fund for Grants 640,270.47 653,844.20 672,128.66 696,930.72 723,224.93 749,145.05 765,026.92 788,885.09 812,266.11 834,984.37
Total Grants made 449,628.14 397,040.02 323,785.15 327,629.93 359,178.40 526,085.00 429,940.34 460,499.91 493,189.44 528,151.95
Implied % disbursement 5% 4% 3% 3% 4% 5% 4% 4% 4% 5%
Total grants to carry to next year 190,642.33 256,804.18 348,343.51 369,300.78 364,046.53 223,060.04 335,086.58 328,385.17 319,076.67 306,832.42
% carried to next year 2% 3% 4% 4% 4% 2% 3% 3% 3% 3%
Beginning Balance 8,992,562.75 9,183,205.08 9,440,009.26 9,788,352.77 10,157,653.55 10,521,700.08 10,744,760.13 11,079,846.70 11,408,231.87 11,727,308.55
Change in Balance 190,642.33 256,804.18 348,343.51 369,300.78 364,046.53 223,060.04 335,086.58 328,385.17 319,076.67 306,832.42
Add: Revenue 719,405.02 734,656.41 755,200.74 783,068.22 812,612.28 841,736.01 859,580.81 886,387.74 912,658.55 938,184.68
Less: Expenses 79,134.55 80,812.20 83,072.08 86,137.50 89,387.35 92,590.96 94,553.89 97,502.65 100,392.44 103,200.32
Less: Total Grants made 449,628.14 397,040.02 323,785.15 327,629.93 359,178.40 526,085.00 429,940.34 460,499.91 493,189.44 528,151.95
Ending Balance 9,183,205.08 9,440,009.26 9,788,352.77 10,157,653.55 10,521,700.08 10,744,760.13 11,079,846.70 11,408,231.87 11,727,308.55 12,034,140.96
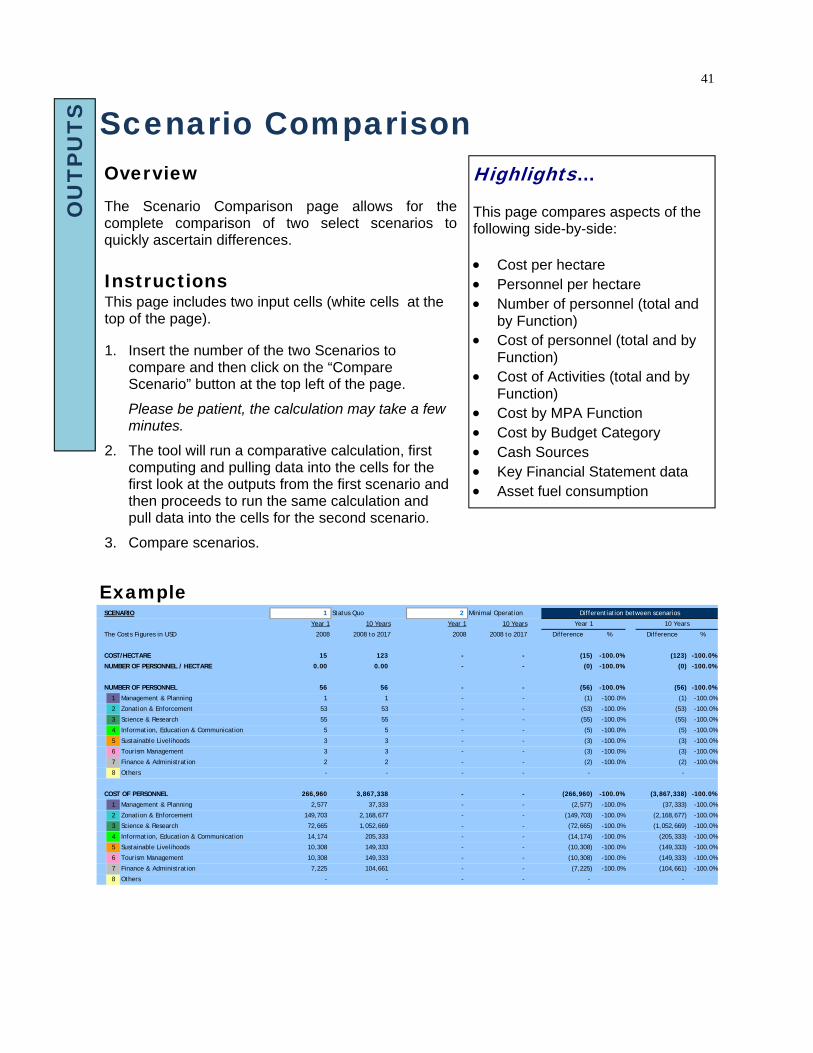
41
Scenario Comparison O
UT
PU
TS
Overview The Scenario Comparison page allows for the complete comparison of two select scenarios to quickly ascertain differences.
Highlights…
This page compares aspects of the following side-by-side: • Cost per hectare • Personnel per hectare • Number of personnel (total and
by Function) • Cost of personnel (total and by
Function) • Cost of Activities (total and by
Function) • Cost by MPA Function • Cost by Budget Category • Cash Sources • Key Financial Statement data • Asset fuel consumption
Example
Instructions This page includes two input cells (white cells at the top of the page). 1. Insert the number of the two Scenarios to
compare and then click on the “Compare Scenario” button at the top left of the page.
Please be patient, the calculation may take a few minutes.
2. The tool will run a comparative calculation, first computing and pulling data into the cells for the first look at the outputs from the first scenario and then proceeds to run the same calculation and pull data into the cells for the second scenario.
3. Compare scenarios.
SCENARIO 1 Status Quo 2 Minimal Operation
Year 1 10 Years Year 1 10 Years
The Costs Figures in USD 2008 2008 to 2017 2008 2008 to 2017 Difference % Difference %
COST/HECTARE 15 123 - - (15) -100.0% (123) -100.0%
NUMBER OF PERSONNEL / HECTARE 0.00 0.00 - - (0) -100.0% (0) -100.0%
NUMBER OF PERSONNEL 56 56 - - (56) -100.0% (56) -100.0%
1 Management & Planning 1 1 - - (1) -100.0% (1) -100.0%
2 Zonation & Enforcement 53 53 - - (53) -100.0% (53) -100.0%
3 Science & Research 55 55 - - (55) -100.0% (55) -100.0%
4 Information, Education & Communication 5 5 - - (5) -100.0% (5) -100.0%
5 Sustainable Livelihoods 3 3 - - (3) -100.0% (3) -100.0%
6 Tourism Management 3 3 - - (3) -100.0% (3) -100.0%
7 Finance & Administration 2 2 - - (2) -100.0% (2) -100.0%
8 Others - - - - - -
COST OF PERSONNEL 266,960 3,867,338 - - (266,960) -100.0% (3,867,338) -100.0%
1 Management & Planning 2,577 37,333 - - (2,577) -100.0% (37,333) -100.0%
2 Zonation & Enforcement 149,703 2,168,677 - - (149,703) -100.0% (2,168,677) -100.0%
3 Science & Research 72,665 1,052,669 - - (72,665) -100.0% (1,052,669) -100.0%
4 Information, Education & Communication 14,174 205,333 - - (14,174) -100.0% (205,333) -100.0%
5 Sustainable Livelihoods 10,308 149,333 - - (10,308) -100.0% (149,333) -100.0%
6 Tourism Management 10,308 149,333 - - (10,308) -100.0% (149,333) -100.0%
7 Finance & Administration 7,225 104,661 - - (7,225) -100.0% (104,661) -100.0%
8 Others - - - - - -
Year 1 10 Years
Differentiation between scenarios
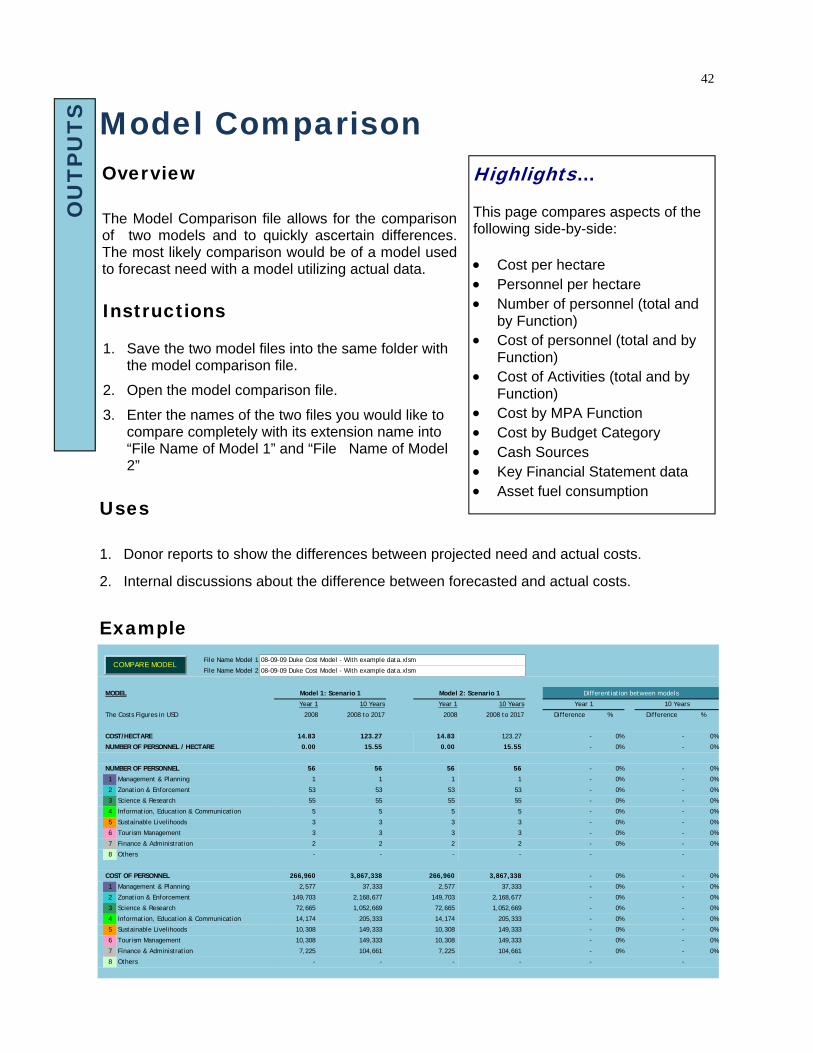
42
Uses
1. Donor reports to show the differences between projected need and actual costs.
2. Internal discussions about the difference between forecasted and actual costs.
Model Comparison O
UT
PU
TS
Overview The Model Comparison file allows for the comparison of two models and to quickly ascertain differences. The most likely comparison would be of a model used to forecast need with a model utilizing actual data.
Highlights…
This page compares aspects of the following side-by-side: • Cost per hectare • Personnel per hectare • Number of personnel (total and
by Function) • Cost of personnel (total and by
Function) • Cost of Activities (total and by
Function) • Cost by MPA Function • Cost by Budget Category • Cash Sources • Key Financial Statement data • Asset fuel consumption
Example
Instructions 1. Save the two model files into the same folder with
the model comparison file.
2. Open the model comparison file.
3. Enter the names of the two files you would like to compare completely with its extension name into “File Name of Model 1” and “File Name of Model 2”
File Name Model 1
File Name Model 2
MODEL
Year 1 10 Years Year 1 10 Years
The Costs Figures in USD 2008 2008 to 2017 2008 2008 to 2017 Difference % Difference %
COST/HECTARE 14.83 123.27 14.83 123.27 - 0% - 0%
NUMBER OF PERSONNEL / HECTARE 0.00 15.55 0.00 15.55 - 0% - 0%
NUMBER OF PERSONNEL 56 56 56 56 - 0% - 0%
1 Management & Planning 1 1 1 1 - 0% - 0%
2 Zonation & Enforcement 53 53 53 53 - 0% - 0%
3 Science & Research 55 55 55 55 - 0% - 0%
4 Information, Education & Communication 5 5 5 5 - 0% - 0%
5 Sustainable Livelihoods 3 3 3 3 - 0% - 0%
6 Tourism Management 3 3 3 3 - 0% - 0%
7 Finance & Administration 2 2 2 2 - 0% - 0%
8 Others - - - - - -
COST OF PERSONNEL 266,960 3,867,338 266,960 3,867,338 - 0% - 0%
1 Management & Planning 2,577 37,333 2,577 37,333 - 0% - 0%
2 Zonation & Enforcement 149,703 2,168,677 149,703 2,168,677 - 0% - 0%
3 Science & Research 72,665 1,052,669 72,665 1,052,669 - 0% - 0%
4 Information, Education & Communication 14,174 205,333 14,174 205,333 - 0% - 0%
5 Sustainable Livelihoods 10,308 149,333 10,308 149,333 - 0% - 0%
6 Tourism Management 10,308 149,333 10,308 149,333 - 0% - 0%
7 Finance & Administration 7,225 104,661 7,225 104,661 - 0% - 0%
8 Others - - - - - -
Year 1 10 Years
Differentiation between models
08-09-09 Duke Cost Model - With example data.xlsm
08-09-09 Duke Cost Model - With example data.xlsm
Model 1: Scenario 1 Model 2: Scenario 1
COMPARE MODEL
43
Glossary G
LOS
SA
RY
Overview The Glossary page provides definitions for key words, terms and concepts utilized in the model from financial terms to MPA-specific concepts.
TERM DEFINITION
Accommodation Housing costs (hotel, hostel) associated with personnel travel for work-related events and trainings longer than one day.
Annual Salary Raise
The annual salary raise is the yearly salary increase for personnel to adjust for both work experience and the increased cost of living due to inflation. The actual amount of the raise will depend on the organization as well as the location of the MPA.
Assumption An assumption is an assertion about some characteristic of the future that underlies the current operations or plans of the MPA. In the case of the model, most assumptions are financial and economic and are required to forecast costs over the projection period.
Balance Sheet The balance sheet reports the assets and liabilities at a specific point in time. It is best to use the last day from the income statement time period. In other words, if your income statement is for the period from January 1st until December 31st, it makes sense to construct your balance sheet for December 31st. The balance sheet provides information about an MPA’s resources (assets) and obligations (liabilities).
Budget Categories The budget categories represent the different MPA costs. There are nine CCIF budget categories that represent the primary MPA costs: personnel, contractors, travel, supplies & materials, fuel, occupancy, capital assets, capital assets maintenance, and miscellaneous.
Capital Assets Capital assets are assets that can be used over a period of time greater than one year.
Cash Flow Statement
The cash flow statement combines cash flows for events that are reported on the income statement (e.g., net income) and balance sheet (e.g., property, plant & equipment). Analysis of the cash flow statements provides an overview of the MPA’s ability to generate cash from operations, in addition to information regarding the cash sources and uses within each of the cash flow activities. The statement can be broken down into three sections: 1) Operating activities, 2) Investing activities, and 3) Financing activities.
Cash Sources Cash sources include the various revenue (e.g., tourism fees) and funding (e.g., donor contributions) that the MPA receives each year.
Contractual Services
Contractual services refer to external contractors and consultants that are hired to fulfill specific functions for a finite amount of time.
Cost of diesel This is the current cost of diesel per liter.
Cost of gasoline This is the current cost of gasoline per liter.
Cost of oil This is the current cost of oil per liter.
44 G
LOS
SA
RY
TERM DEFINITION
Depreciation Depreciation comes into play when the MPA possesses physical assets with a useful life greater than one year. In the case of the CCIF Cost Model, depreciation is calculated using the straight-line method. Straight-line depreciation is calculated by estimating a “salvage value” of the asset after a length of time over which it will be used (its useful life), and will recognize a portion of that original cost in equal increments over that amount of time. In other words, if an MPA purchases a new boat for $200,000, assumes a useful life of five years, and a re-sale value of $0, $40,000 would be depreciated each year for five years.
Discount rate The discount rate takes all the forecasted revenues and costs over a period of time and “discounts” them into present-day dollars; the discount reflects the principle that a dollar in the future is worth less than a dollar today.
Donor A Donor is a person or organization that contributes money to one or more of the stakeholders engaged in elements of the MPA management.
Endowment disbursement rate
A potential mechanism for sustainable financing of an MPA is the creation of an endowment fund which the MPA can draw on over future years. Depending on the legal jurisdiction of the endowment fund, the fund is required to disburse a certain percentage of its value on an annual basis. The size of an endowment fund needed to support the ongoing activities of an MPA can be estimated by its disbursement rate and the annual expenses of the MPA. For example, if in the first year of operations, the MPA’s expenses total $200,000, the size of the en-dowment will need to be $4,000,000 assuming the endowment is legally required to disburse 5% of its total value (i.e. $200,000 divided by 5%, or 5% of $4,000,000).
Enforcement Enforcement refers to the protection of the MPA. In order to ensure adequate enforcement, properly trained personnel with sufficient resources and supplies are necessary.
Exchange rate The exchange rate is the rate at which local currency can be exchanged for US dollars.
Fees These include fees incurred from specific MPA memberships, magazine subscriptions, and other non-occupancy related costs.
Finance & Administration
The Finance & Administration function of a MPA is responsible for budgets, operations, logistics, and general administrative tasks. Administration refers to the people and activities that provide general administrative help and oversight for the MPA to ensure accountability and transparency in decision making process and financial management. This also can include general human resource functions.
Fuel costs The cost of the fuel necessary to run the fuel-burning assets (e.g., boats, vehicles).
Function A function represents a group of people and activities that aim to achieve the MPA objectives. CCIF has identified seven areas as representative of a functioning and comprehensive MPA: Management & Planning, Zonation & Enforcement, Science & Research, Information, Education & Communication (IEC), Sustainable Livelihoods, Tourism Management, Finance & Administration.
45 G
LOS
SA
RY
TERM DEFINITION
Funding Funding refers to money obtained from external sources without delivery of a specific good or service in return. These sources are generally less sustainable than revenue sources because they rely on the continued funding of an outside entity. The risks inherent in this reliance include: potential political changes within the funding entity, sudden shift in funding ability, and change in leadership and donor goals. Examples: government, philanthropic foundation donations, corporate donations, individual donors.
Government Direct Allocations
This refers to financial or in-kind contributions from the government to the MPA.
Income Statement The income statement provides an overview of the revenue and expenses over a given period. The ultimate purpose of the income statement is to show managers and potential donors whether the sum of revenue and expenses resulted in a positive or negative net income. This provides insight into whether the current financial situation is sustainable over time.
Inflation Inflation is the rise in prices over time measured against a standard level of purchasing power.
Information, Education & Communication
Information, Education and Communication (IEC) is the dissemination of information and awareness-building activities that communicate critical messages to the MPA’s stakeholders (i.e. educating tourists, tourism and dive operators, fishers, residents, etc.).
Interest on cash The interest on cash is the percentage yield one would reasonably expect from depositing cash in a normal savings account.
Interest on debt The interest on debt is the percentage the MPA pays to people or institutions from which it has borrowed money. Generally speaking, most MPAs do not have any debt. In this case, simply enter “0” in the General tab when it asks for Interest on Debt.
Management & Planning
Management & Planning is one of the seven CCIF Functions. Management: The efforts related to overall operational implementation of the MPA; securing support from the local, regional, and national governments and other stakeholders, and advocating certain policies, and generally supporting the creation and implemen-tation of the MPA law. Planning: The decision-making processes that set the stra-tegic vision and translate the vision into day-to-day activities of the MPA. It is the development and periodic review of the actual management and financial plans through monitoring and evaluation.
Maintenance Cost Yearly maintenance cost associated with maintaining capital assets over time. The maintenance cost is captured as a percentage of the original value of the asset (e.g., if an asset was purchased for $1,000 and you forecast the yearly maintenance expense to be $50, then the maintenance cost is 5%) or as an ac-tual amount (e.g., if you know exactly how much the yearly maintenance cost is).
Meals This refers to the food costs associated with personnel travel for work-related events and trainings.
Net funding The net funding required, for one year, is equal to the cash sources (funding and revenue) minus the capital expenditures and operating expenses. The net present value of the net funding required/excess is the sum of each year net funding required/excess discounted pack to the present using the discount rate.
46 G
LOS
SA
RY
TERM DEFINITION
Net Present Value Net present value is the total present value of a time series of cash flows. Present value is the value on a given date of a future payment or series of payments, discounted to reflect the time value of money. The discount rate that cash flows are present valued at is captured on the General Tab. The rate used is usually equal to the interest rate on cash.
Objective An objective is a realistic, tangible, and specific outcomes that the MPA hopes to achieve over a given time period.
Occupancy Occupancy costs are the costs associated with occupying certain buildings and spaces. It also includes the costs involved in the activities that go inside of these spaces. For example: rent, utility costs, internet/email costs.
Personnel Personnel are the individuals that are actively involved in one or more functions within the MPA.
Revenue Revenue refers to payment for a good or service or payment due to an obligation. These are generally more sustainable than funding sources because the MPA has (some) control over them. That said, these cash sources also require a great deal more effort to implement and maintain.
Scenario A scenario is a set of parameters that correspond to a unique set of activities and factors. Scenarios are generally constructed with various levels of conservation effort in mind, such as minimal or optimal, but a number of different scenarios can be constructed depending on stakeholder preference/objectives, and funding/revenue availability.
Science & Research
The collection and analysis of specific social, economic, ecological, and biophysical data. This information should be used to identify ecosystem and community dynamics and to prioritize goals and objectives. This data collection is ideally linked to the MPA program monitoring and evaluation component to help quantify the realization of MPA goals and objectives.
Stakeholder A stakeholder is an individual, group, or organization that influences or is otherwise actively involved in particular MPA activities.
Supplies & Materials
Consumable and expendable supplies and materials. Example: pens, batteries, paper, other office supplies.
Sustainable Livelihoods
Conservation-enabling livelihood activities that are culturally appropriate, financially feasible, and whose viability is assured by the sustained use of natural resources. These are community-based and should be centered on efforts that promote healthy marine and terrestrial ecosystems.
Tax rate Rate at which the MPA pays taxes; generally this is 0%.
Tourism Management
Activities that enable the MPA to generate revenues from tourism, such as developing marketing materials or advertising campaigns to attract visitors and constructing facilities to be used by tourists (e.g. visitor/educational centers, trails, restrooms, picnic tables, etc.). Also includes managing and ensuring a sustainable level of tourism in respect to social and ecological dynamics.
Travel This refers to personnel travel for MPA-specific activities.
Zonation Zones: Delineated areas where only selected human activities can take place. The objectives of the protected region (e.g., increasing tourism, increasing fishery yields, protecting biodiversity, etc), knowledge of the ecosystem’s dynamics, and the reality of enforcement should be used to define zones.


![Ventilterminal MPA−L...Pneumatik MPA−L Ventilterminal Typ: MPA−L−MPM−VI MPA−L−FB−VI Beskrivning 556 358 sv 1008NH [722 283] Ventilterminal MPA−L. ... betyder att](https://static.fdocuments.net/doc/165x107/60912199dc0d2a008521a11b/ventilterminal-mpaal-pneumatik-mpaal-ventilterminal-typ-mpaalampmavi.jpg)