CBS 120 - digitalcollection.zhaw.ch k… · CAMAG BIBLIOGRAPHY SERVICE PLANAR CHROMATOGRAPHY CBS...
4
120 CBS MARCH 2018 CAMAG BIBLIOGRAPHY SERVICE WORLD LEADER IN PLANAR CHROMATOGRAPHY CAMAG BIBLIOGRAPHY SERVICE PLANAR CHROMATOGRAPHY CBS 120 MARCH 2018 HPTLC quantification of cocoa ingredients and their changes during different chocolate manufacturing steps Other topics of this issue:
Transcript of CBS 120 - digitalcollection.zhaw.ch k… · CAMAG BIBLIOGRAPHY SERVICE PLANAR CHROMATOGRAPHY CBS...

120CBSMARCH 2018CAMAG BIBLIOGRAPHY SERVICE
WORLD LEADER IN PLANAR CHROMATOGRAPHYCA
MA
G B
IBLI
OG
RA
PHY
SER
VIC
E PL
AN
AR
CH
ROM
ATO
GR
APH
YC
BS 1
20
MA
RCH
201
8
HPTLC quantification of cocoa ingredients and their changes during different chocolate manufacturing steps
Other topics of this issue:
CBS 120 9
HPTLC quantification of cocoa ingredients and their changes during different chocolate manufacturing steps
Carlo Weber, Katrin Jedrys and Dr. Vasilisa Pedan
The Institute of Food and Beverage Innovation of the Zurich University of Applied Sciences in Wädenswil deals with delicious, healthy, safe and sustainable food. Besides the education of food technology engineers, practical work with the food industry is fundamental to its strength in innovation. The research group, Food Chemistry analyzes food ingredients using different analytical techniques like HPLC-MS, FT-IR and HPTLC-MS. One of the research objectives is the determination of secondary plant metabolites like alkaloids and polyphenols in food. Monitoring the changes through the entire value chain is of primary importance. In this study, deter-mination of secondary metabolites was performed on fresh cocoa beans and diverse intermediate pro-ducts of the chocolate production process.
Polyphenols are not only known for their astrin-gency but also for their great antioxidant potential. They are found in large amounts in cocoa and its derived product chocolate. The characterization and determination of high molecular oligomeric proanthocyanidins (PA) are of great interest because of their higher antioxidant activity compared to low molecular monomeric flavan-3-ols [1]. The changes of the PA profile are also essential for the organo-leptic evaluation, which shows that monomeric PAs are more responsible for the bitter taste in contrast to oligomeric PAs, which are responsible for the astringency. Also of great interest are the two alka-loids caffeine and theobromine, not only because of their bitter taste but also for their stimulating and
“prime pumping” effect. Anthocyanins can be used as general indicator for determining the degree of cocoa fermentation.
In the following application, HPTLC was used to determine oligomeric PAs, alkaloids and anthocyanins through the entire value chain – from fresh cocoa beans, through roasted co-coa, cocoa mass and up to molded chocolate bars. The established method has been proven as a suitable tool for comprehensive com-pound analysis in laboratories with high sam-ple throughput. Besides the acquisition of the characteristic HPTLC fingerprint for the specific manufacturing step, the visual information can be used to build up an imaging database.
HPTLC plates silica 60 F254 (Merck), 20 x 10 cm
One single batch of 10 kg fresh cocoa beans was studied across different processing steps [2]. Chan-ges in the PA profile were recorded on a lab-scale model and may not be fully in line with real-life crop or industrial scale processing. Nevertheless, one batch was processed and aliquots of about 50 g were sampled from each processing step. Samples were collected from (1) raw fresh cocoa beans, (2) fermented, dried cocoa beans, (3) roasted cocoa mass, (4) 1 h conched cocoa mass, and (5) molded chocolate bars.
1 g of the fine grinded and defatted cocoa powder was extracted three times with 3 mL acetone – water 1:1. The combined supernatant was diluted 1:10 with acetone – water 1:1.
Anthocyanin standard solution (0.01 mg/mL in me-thanol) with cyanidin-3-O-arabinoside (cn-ara) und cyanidin-3-O-glucoside (cn-glc); alkaloid standard solution (0.2 mg/mL in acetone – water 1:1) with

10 CBS 120
HPTLC chromatogram of different standard mixtures for (A) anthocyanins (a: cn-ara, b: cn-glc) illuminated under white light; (B) alkaloids (c: caffeine and d: theobromine) under UV 254 nm and (C) PAs (e: EC, f: PA B2, g: PA C1 and h: Cinn A2) under white light after derivatization as well as products from different steps of the chocolate manufacturing with 1: raw fresh cocoa beans, 2: fermented, dried cocoa beans, 3: roasted cocoa mass, 4: 1 h conched cocoa mass and 5: molded chocolate bars
1
caffeine and theobromine; PA standard solution (0.1 mg/mL in methanol) with (-)-epicatechin (EC), proanthocyanidins B2 (PA B2) and C1 (PA C1) as well as cinnamtannin A2 (Cinn A2)
Bandwise with Automatic TLC Sampler (ATS 4), 15 tracks, band length 8 mm, distance from left edge 20 mm, distance from the lower edge 8 mm, appli-cation volume between 5 and 10 μL for standard solutions and 2 and 10 μL for the sample solutions
In the Automatic Developing Chamber (ADC 2) with chamber saturation (with filter paper) for 20 min and after conditioning at 33% relative humidity for 10 min using a saturated solution of magnesium chloride, development with ethyl formate – formic acid – water – toluene 30:4:3:1.5 to the migration distance of 70 mm (from the lower edge), drying for 5 min
The plate was heated at 100 °C and immersed with Chromatogram Immersion Device (immersion speed 5 cm/s, immersion time 0 s) in Fast Blue Salt B reagent (140 mg Fast Blue Salt B in 140 mL me-thanol, 10 mL water, and 50 mL dichloromethane), followed by 30 s drying in a cold air stream. Alter-natively, the Derivatizer can be used.
TLC Visualizer under UV 254 nm and white light, also after derivatization
TLC Scanner 4 and visionCATS, absorption mea- surement at 280 nm for alkaloids and 510 nm for anthocyanins and derivatized PA, slit dimen-sion 5.00 x 0.20 mm, scanning speed 50 mm/s, evaluation via peak area, polynomial regression, spectrum recording from 190 to 600 nm
Elution of target zones was done after derivatiza-tion with Fast Blue Salt B with the oval elution head (4 x 2 mm) of the TLC-MS Interface. Hereby, acetone – water 1:1 was used as elution solvent at a flow rate of 0.1 mL/min using a HPLC pump. The recording of mass spectra was performed in the positive ionization mode.
The developed method showed a good separation and a quick quantification of the four oligomeric PAs, the two alkaloids and the two anthocyanins. The present study showed diminishing levels of the alkaloids and especially oligomeric PAs, espe-cially during the fermentation and roasting process. Higher oligomeric PAs are presumed to decrease faster than monomeric PAs. In addition, the alkaloid content decreased throughout the manufacturing, whereas during fermentation, alkaloids may diffuse through the porous surface of the testa cotyledon [3]. During the roasting process, alkaloid content decreased due to diffusion into fat. Anthocyanins are responsible for the reddish coloring of the coty-ledon. In general, the content of anthocyanins de-creased constantly during all stages of fermentation and drops further during drying. Here, the initial
CBS 120 11
Content [mg/g]
Caffeine
1 7.79 ± 0.70 16.38 ± 4.20 7.09 ± 1.09 2.98 ± 1.21 4.40 ± 0.08 5.06 ± 0.82
2 4.48 ± 0.64 11.12 ± 0.86 5.63 ± 0.45 2.04 ± 0.22 2.37 ± 0.22 2.01 ± 0.22
3 2.89 ± 0.39 7.42 ± 1.37 4.33 ± 0.36 1.72 ± 0.19 1.66 ± 0.19 1.10 ± 0.13
4 3.36 ± 0.19 9.00 ± 1.02 5.00 ± 0.15 2.23 ± 0.12 2.44 ± 0.26 1.35 ± 0.16
5 2.75 ± 0.17 7.41 ± 0.76 4.37 ± 0.04 1.81 ± 0.03 1.50 ± 0.20 0.92 ± 0.12
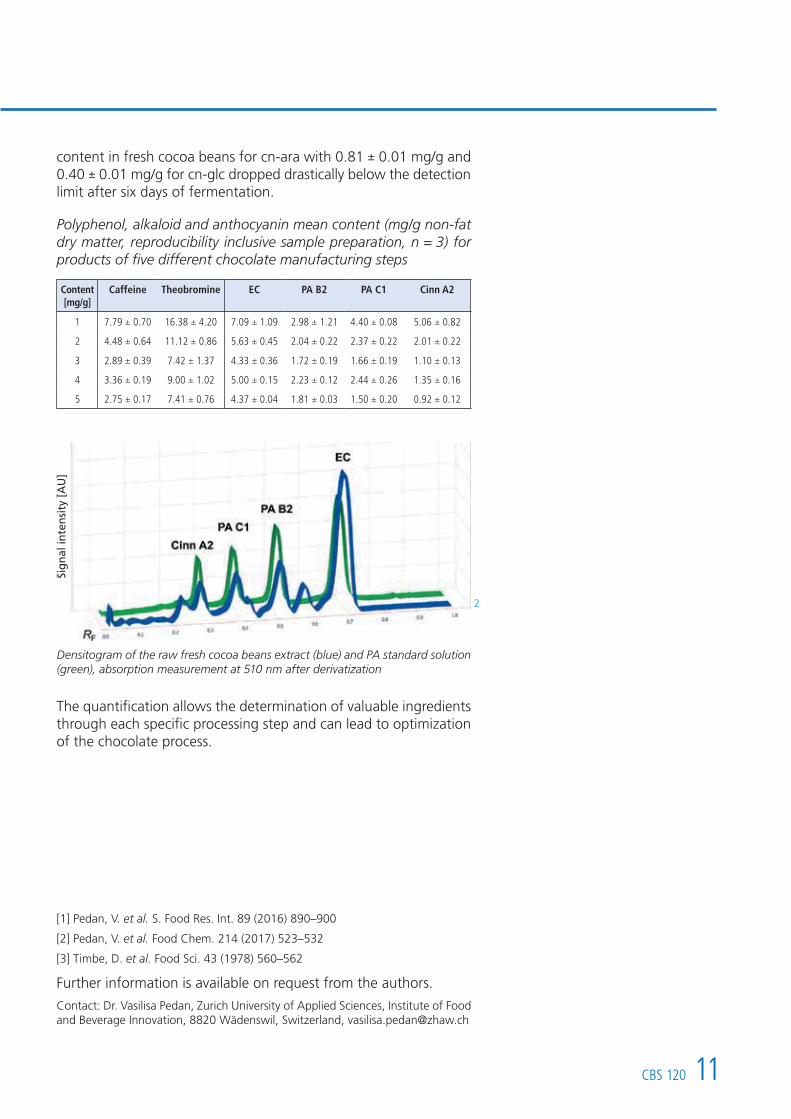
The quantification allows the determination of valuable ingredients through each specific processing step and can lead to optimization of the chocolate process.
[1] Pedan, V. et al. S. Food Res. Int. 89 (2016) 890–900
[2] Pedan, V. et al. Food Chem. 214 (2017) 523–532
[3] Timbe, D. et al. Food Sci. 43 (1978) 560–562
Further information is available on request from the authors.
Contact: Dr. Vasilisa Pedan, Zurich University of Applied Sciences, Institute of Food and Beverage Innovation, 8820 Wädenswil, Switzerland, [email protected]
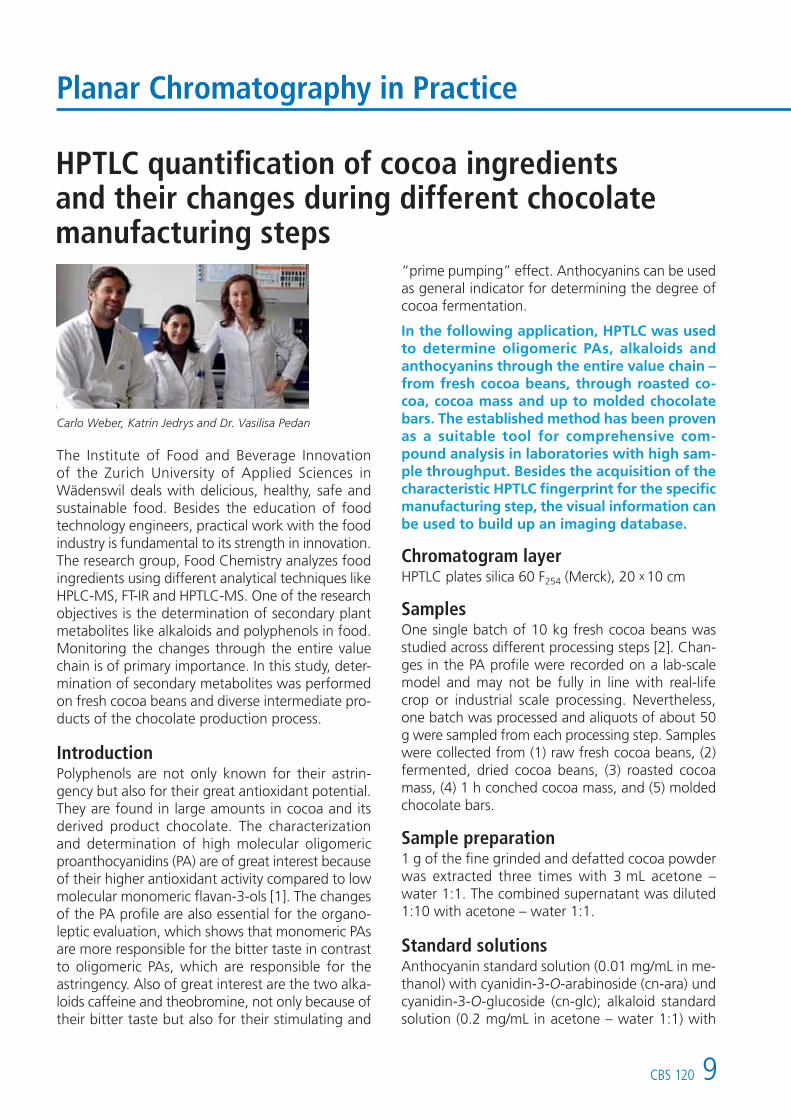
2
Densitogram of the raw fresh cocoa beans extract (blue) and PA standard solution (green), absorption measurement at 510 nm after derivatization
content in fresh cocoa beans for cn-ara with 0.81 ± 0.01 mg/g and 0.40 ± 0.01 mg/g for cn-glc dropped drastically below the detection limit after six days of fermentation.
Polyphenol, alkaloid and anthocyanin mean content (mg/g non-fat dry matter, reproducibility inclusive sample preparation, n = 3) for products of five different chocolate manufacturing steps
Sig
nal
inte
nsi
ty [A
U]