
CBM drilling technical parameter optimization CBM Running ...

CBM Geology
& Well Design
0
& Well Design5 T H A N N U A L C B M & U N C O N V E N T I O N A L G A S
W E D N E S D A Y 2 7 J U N E 2 0 1 2
G E O F F B A R K E R , P A R T N E R

CBM Geology and Well Design
1. Determining Sweet Spots
• Coal as a Gas Reservoir
• Gas Adsorption and Desorption principles
• Characteristics of Commercial CBM Projects
2. Data Gathering and Types
1
4. The Role of Geomechanics
5. Effective Well Design Options
6. Well Costs
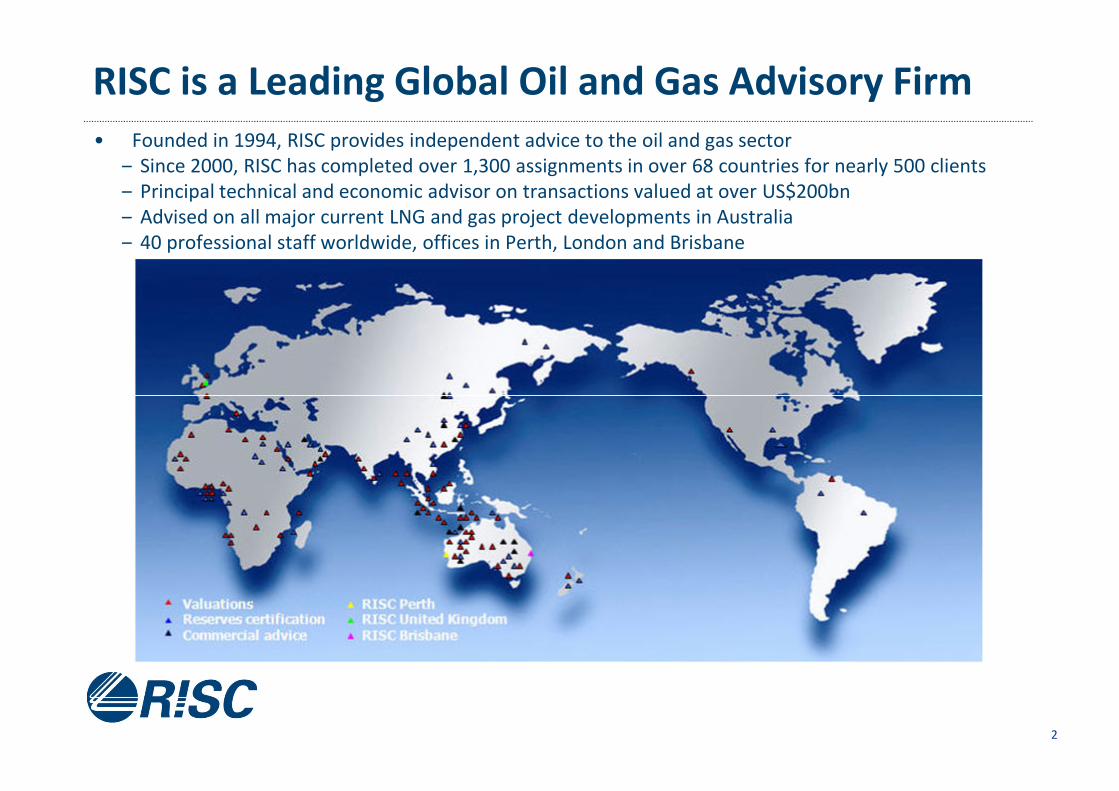
• Founded in 1994, RISC provides independent advice to the oil and gas sector
‒ Since 2000, RISC has completed over 1,300 assignments in over 68 countries for nearly 500 clients
‒ Principal technical and economic advisor on transactions valued at over US$200bn
‒ Advised on all major current LNG and gas project developments in Australia
‒ 40 professional staff worldwide, offices in Perth, London and Brisbane
RISC is a Leading Global Oil and Gas Advisory Firm
2
Coal as Gas Reservoir
3
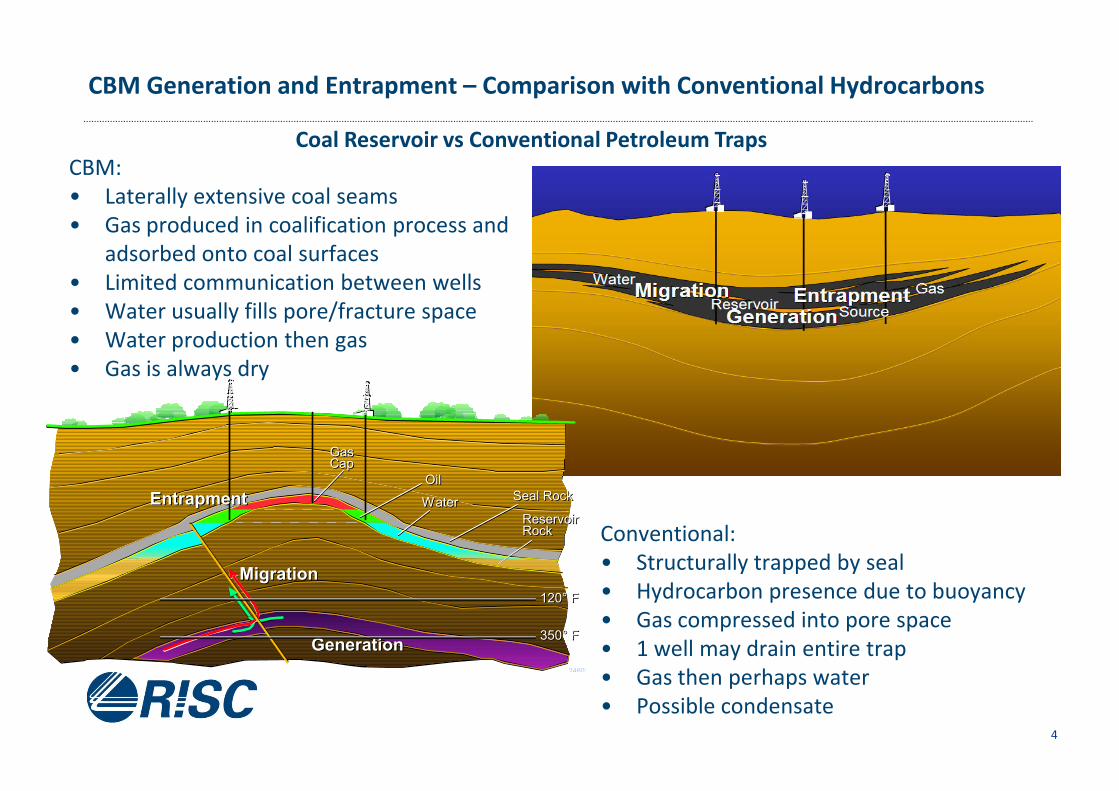
Coal Reservoir vs Conventional Petroleum Traps
CBM:
• Laterally extensive coal seams
• Gas produced in coalification process and
adsorbed onto coal surfaces
• Limited communication between wells
• Water usually fills pore/fracture space
• Water production then gas
• Gas is always dry
CBM Generation and Entrapment – Comparison with Conventional Hydrocarbons
4
24803
120° F120° F
350° F350° FGenerationGeneration
MigrationMigration
Seal RockSeal Rock
ReservoirRockReservoirRock
OilOil
WaterWater
Gas CapGas Cap
EntrapmentEntrapment
Conventional:
• Structurally trapped by seal
• Hydrocarbon presence due to buoyancy
• Gas compressed into pore space
• 1 well may drain entire trap
• Gas then perhaps water
• Possible condensate
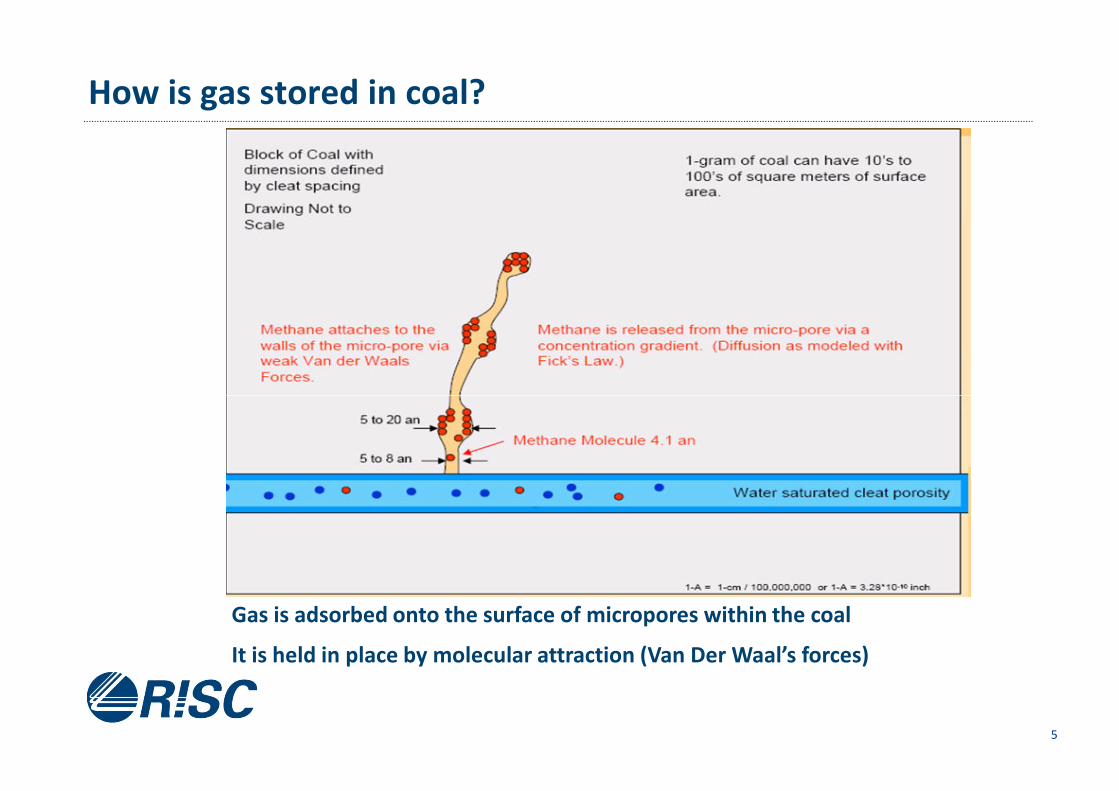
How is gas stored in coal?
5
Gas is adsorbed onto the surface of micropores within the coal
It is held in place by molecular attraction (Van Der Waal’s forces)

How is gas produced from coal?
6
Depressuring the coal by producing water is required to desorb gas from the coal matrix. Gas
then flows into the cleat system where it can be produced by wells

What parameters are required for a commercial CBM project?
7
Source: Coalbed and Shale-Gas Reservoirs, Creties D. Jenkins and Charles M. Boyer II, SPE 103524 February 2008

1. Coal Thickness
• Number, thickness and extent of coal seams
• Typically need > 3m in aggregate
2. Gas Content and Gas saturation
• Biogenic and thermogenic sourcing: understanding needed for gas content distribution
• Coal Rank and Type: bituminous/sub-bituminous ideal , high inertinite or liptinite correlates with lower gas
content
• Gas content and composition: > 2 m3/t, 92+% CH4
Characteristics Defining Commercial Potential of Coal as a Gas Reservoir
8
• Sorption properties of coal: >60% saturation
• Hydrodynamic effects can strongly influence gas content and saturation
3. Permeability
• Governed by presence of cleats and natural fractures
• Coal Rank: 0.4 < Rvmax > 1.6 to promote cleating
• High vitrinite/inertinite (GI) ratios: promote fracturing
• Geologic Structure: Curvature to assist cleat/fracture opening
• Stress Setting: tension to promote cleat/fracture opening
4. Dewatering capability
• Isolation from pervasive aquifers
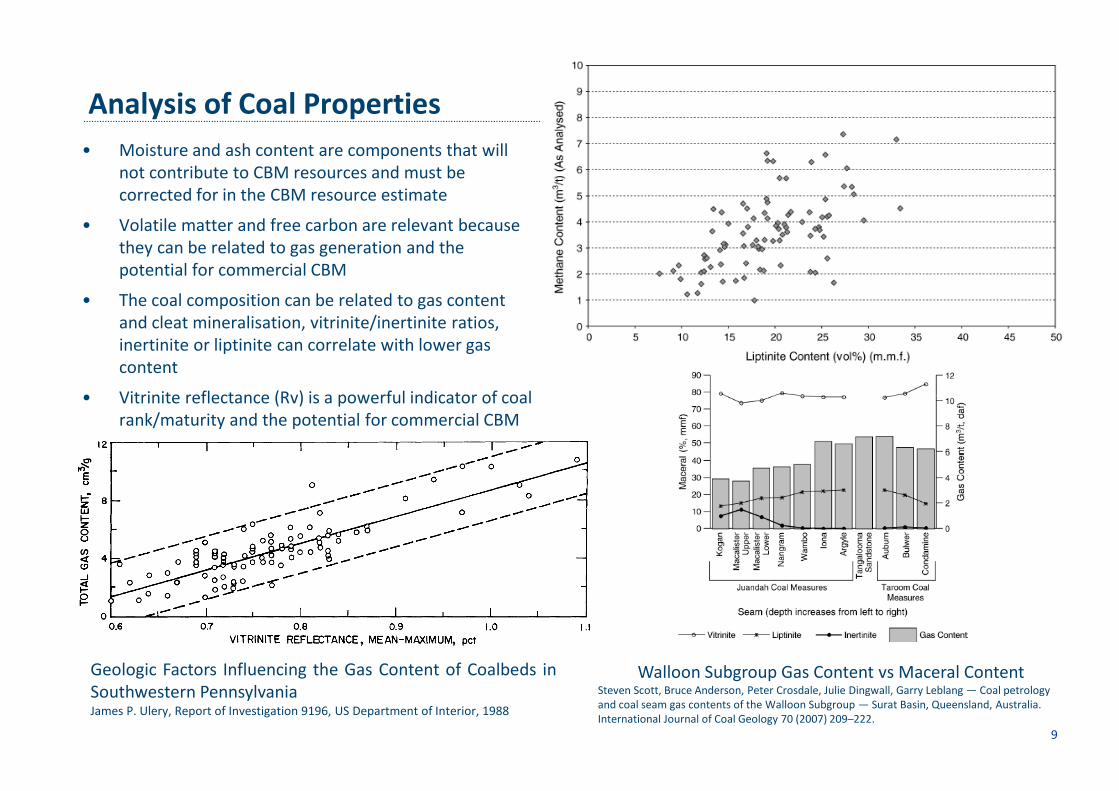
Analysis of Coal Properties
• Moisture and ash content are components that will
not contribute to CBM resources and must be
corrected for in the CBM resource estimate
• Volatile matter and free carbon are relevant because
they can be related to gas generation and the
potential for commercial CBM
• The coal composition can be related to gas content
and cleat mineralisation, vitrinite/inertinite ratios,
inertinite or liptinite can correlate with lower gas
content
• Vitrinite reflectance (Rv) is a powerful indicator of coal
9
• Vitrinite reflectance (Rv) is a powerful indicator of coal
rank/maturity and the potential for commercial CBM
Walloon Subgroup Gas Content vs Maceral ContentSteven Scott, Bruce Anderson, Peter Crosdale, Julie Dingwall, Garry Leblang — Coal petrology
and coal seam gas contents of the Walloon Subgroup — Surat Basin, Queensland, Australia.
International Journal of Coal Geology 70 (2007) 209–222.
Geologic Factors Influencing the Gas Content of Coalbeds in
Southwestern PennsylvaniaJames P. Ulery, Report of Investigation 9196, US Department of Interior, 1988
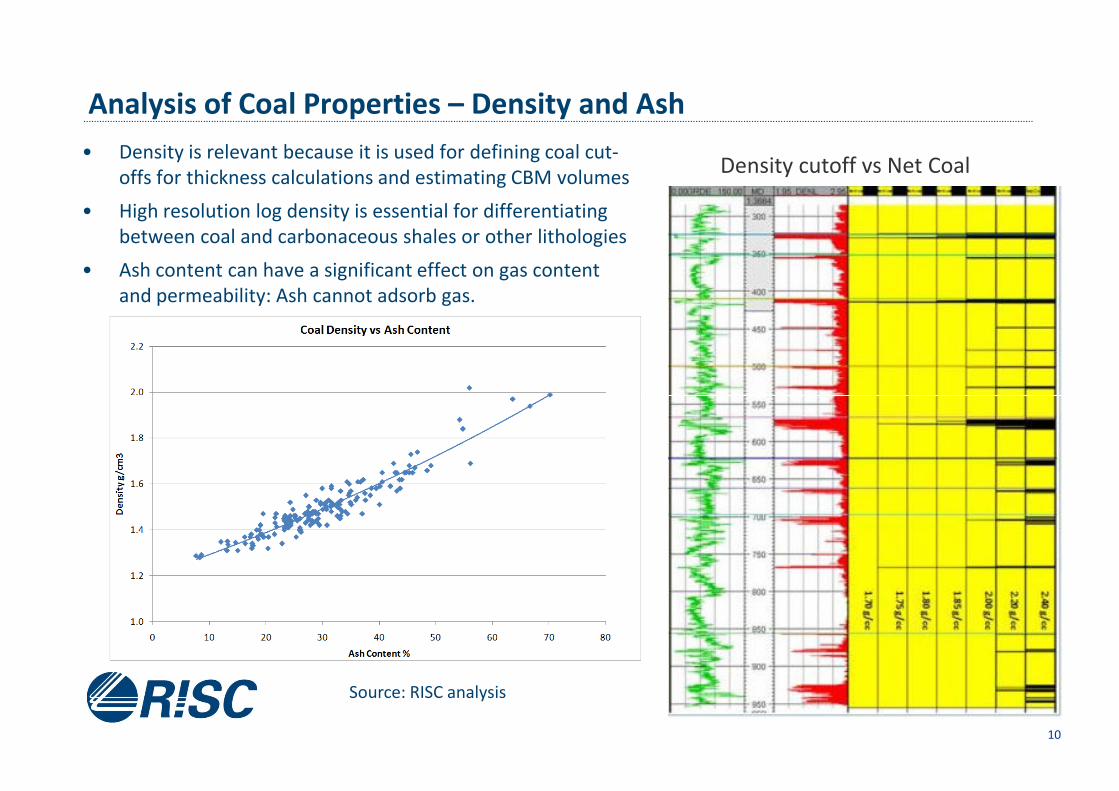
Analysis of Coal Properties – Density and Ash
• Density is relevant because it is used for defining coal cut-
offs for thickness calculations and estimating CBM volumes
• High resolution log density is essential for differentiating
between coal and carbonaceous shales or other lithologies
• Ash content can have a significant effect on gas content
and permeability: Ash cannot adsorb gas.
Density cutoff vs Net Coal
10
Source: RISC analysis
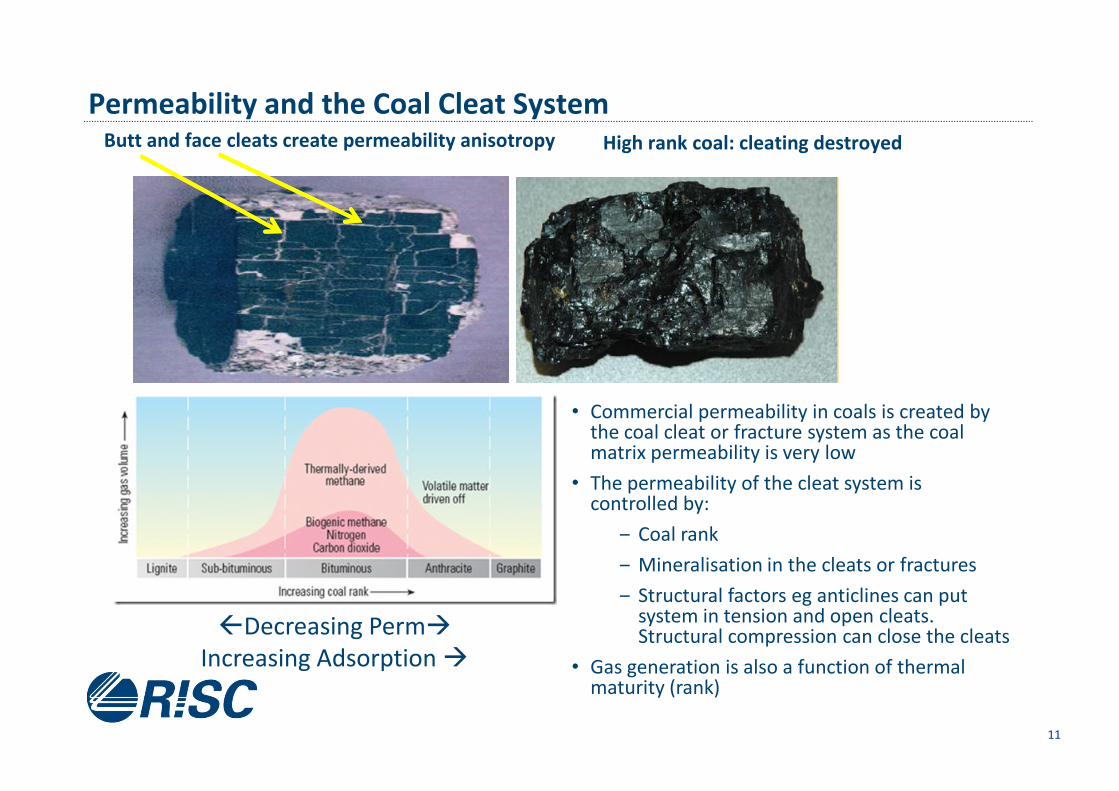
Permeability and the Coal Cleat SystemButt and face cleats create permeability anisotropy High rank coal: cleating destroyed
11
• Commercial permeability in coals is created by the coal cleat or fracture system as the coal matrix permeability is very low
• The permeability of the cleat system is controlled by:
‒ Coal rank
‒ Mineralisation in the cleats or fractures
‒ Structural factors eg anticlines can put system in tension and open cleats. Structural compression can close the cleats
• Gas generation is also a function of thermal maturity (rank)
�Decreasing Perm�
Increasing Adsorption �

Approx. Base
Walloon Subcrop
Approx. Base
Walloon Subcrop
10m Net Coal 5 mD cutoff
Sweetspot
12
10m Net Coal
Isopach
Source: D.J. Ryan, A. Hall, L. Erriah and P.B. Wilson, 2012— The
Walloon Coal Seam Gas Play, Surat Basin, Queensland. The
APPEA Journal 2012, 273–89 and RISC analysis
Adsorption & Desorption Analysis
13

Initial Sorbed Gas Content (Desorption Analysis)
• Measured in the laboratory by measuring the amount of gas that actually is stored in a
coal sample using a desorption process, includes:
• Lost Gas + Gas Released + Crushed Sample Gas
• Include Lost Gas Analysis (often the largest source of error in desorption tests)
1. USBM direct method (most common method; extrapolation)
2. Smith & Williams (suited to well cuttings)
14
2. Smith & Williams (suited to well cuttings)
3. Amoco Method (numerical fitting curve)
4. CBM Solutions
• Gas content can be expressed on an “in-situ” basis or after normalisation for ash and
moisture content (DAF)
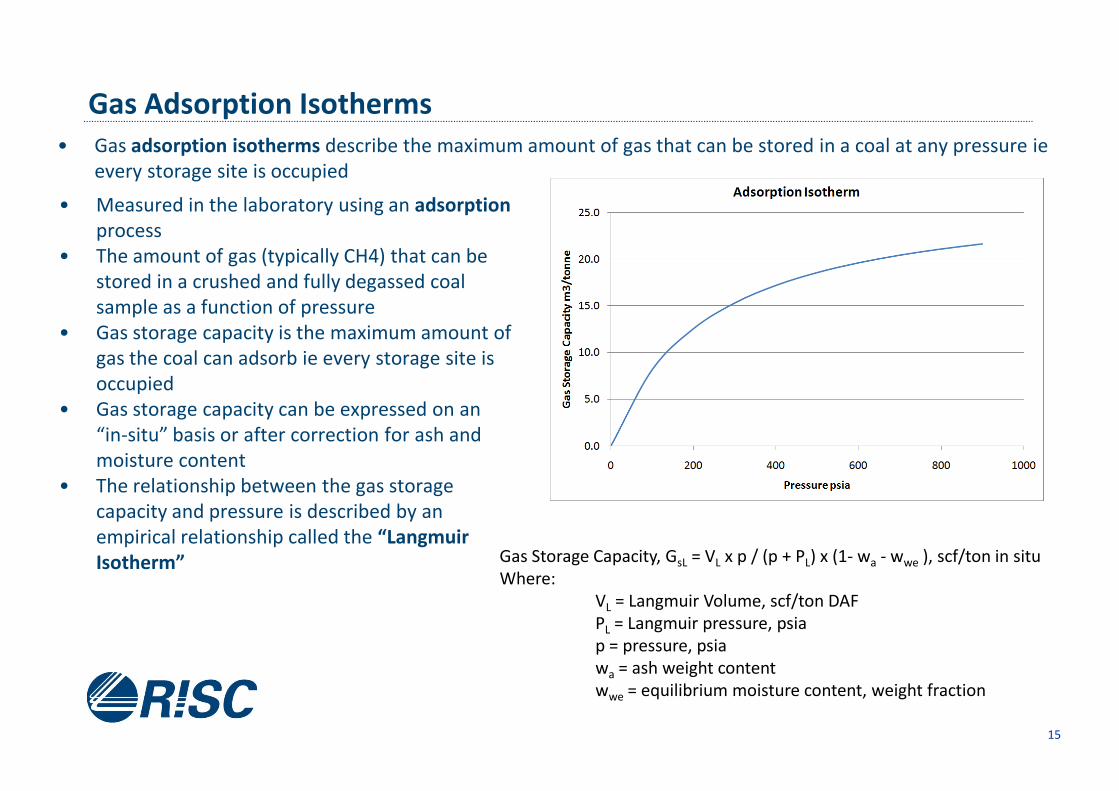
Gas Adsorption Isotherms
• Gas adsorption isotherms describe the maximum amount of gas that can be stored in a coal at any pressure ie
every storage site is occupied
• Measured in the laboratory using an adsorption
process
• The amount of gas (typically CH4) that can be
stored in a crushed and fully degassed coal
sample as a function of pressure
• Gas storage capacity is the maximum amount of
gas the coal can adsorb ie every storage site is
occupied
• Gas storage capacity can be expressed on an
15
occupied
• Gas storage capacity can be expressed on an
“in-situ” basis or after correction for ash and
moisture content
• The relationship between the gas storage
capacity and pressure is described by an
empirical relationship called the “Langmuir
Isotherm” Gas Storage Capacity, GsL = VL x p / (p + PL) x (1- wa - wwe ), scf/ton in situ
Where:
VL = Langmuir Volume, scf/ton DAF
PL = Langmuir pressure, psia
p = pressure, psia
wa = ash weight content
wwe = equilibrium moisture content, weight fraction

Gas Saturation
• The ratio between the theoretical storage capacity and the actual gas content is termed
the gas saturation
• A coal is said to be
undersaturated when the gas
content is lower than the
theoretical storage capacity
• Under-saturated coal may
require significant
Example Adsorption IsothermTheoretical Gas Storage Capacity
16
require significant
depressurisation before gas is
produced
Actual Gas Content
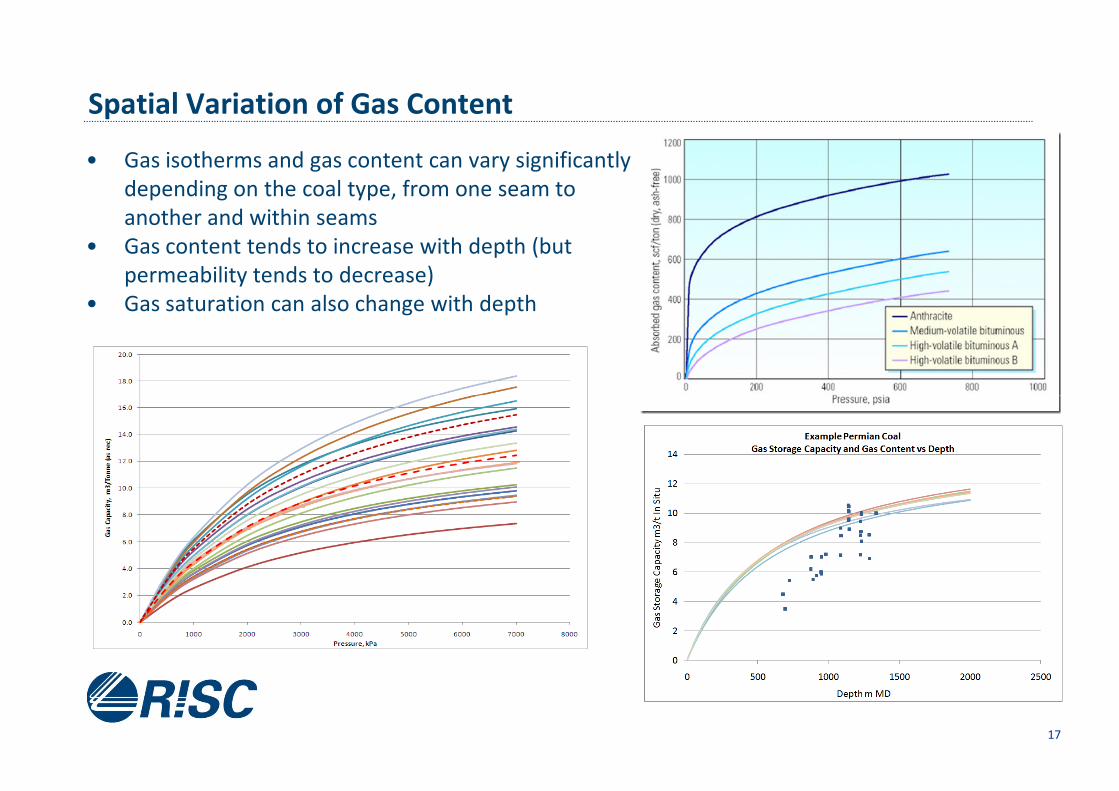
• Gas isotherms and gas content can vary significantly
depending on the coal type, from one seam to
another and within seams
• Gas content tends to increase with depth (but
permeability tends to decrease)
• Gas saturation can also change with depth
Characteristics of Coal Seam GasSpatial Variation of Gas Content
17
Gas composition effects
18

Gas Composition Effects
• CBM is (generally) predominantly methane.
• Other gases frequently encountered are
‒ Carbon dioxide;
‒ Nitrogen; and
‒ Ethane and other h/c.
• Coal has a different affinity for different gases
‒ Affinity for: CO2 > CH4 > N2
• The impact of the inert gases (CO2 and N2) is:
19
• The impact of the inert gases (CO2 and N2) is:
−Static– Reduction in the heating value of the gas (dilution)
−Dynamic– Mixture isotherms – Saturations– Composition of the produced gas– Recovery factors
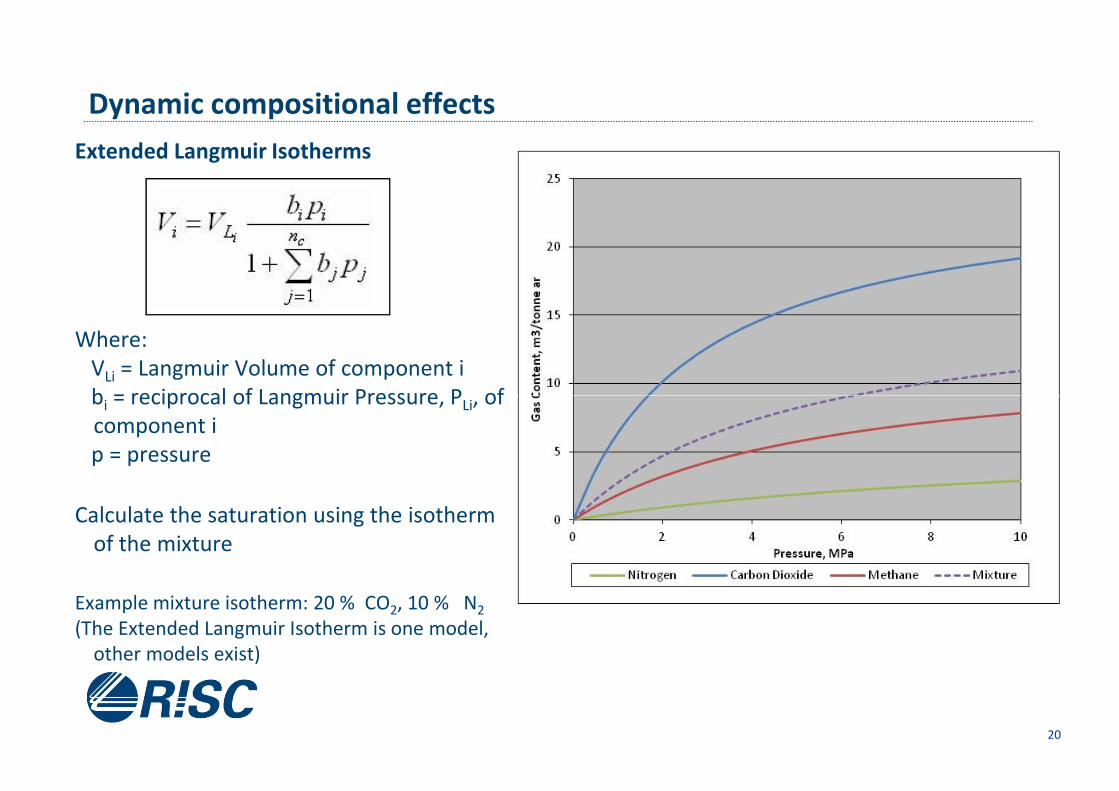
Dynamic compositional effects
Extended Langmuir Isotherms
Where:
VLi = Langmuir Volume of component i
bi = reciprocal of Langmuir Pressure, PLi, of
20
bi = reciprocal of Langmuir Pressure, PLi, of
component i
p = pressure
Calculate the saturation using the isotherm
of the mixture
Example mixture isotherm: 20 % CO2, 10 % N2
(The Extended Langmuir Isotherm is one model,
other models exist)
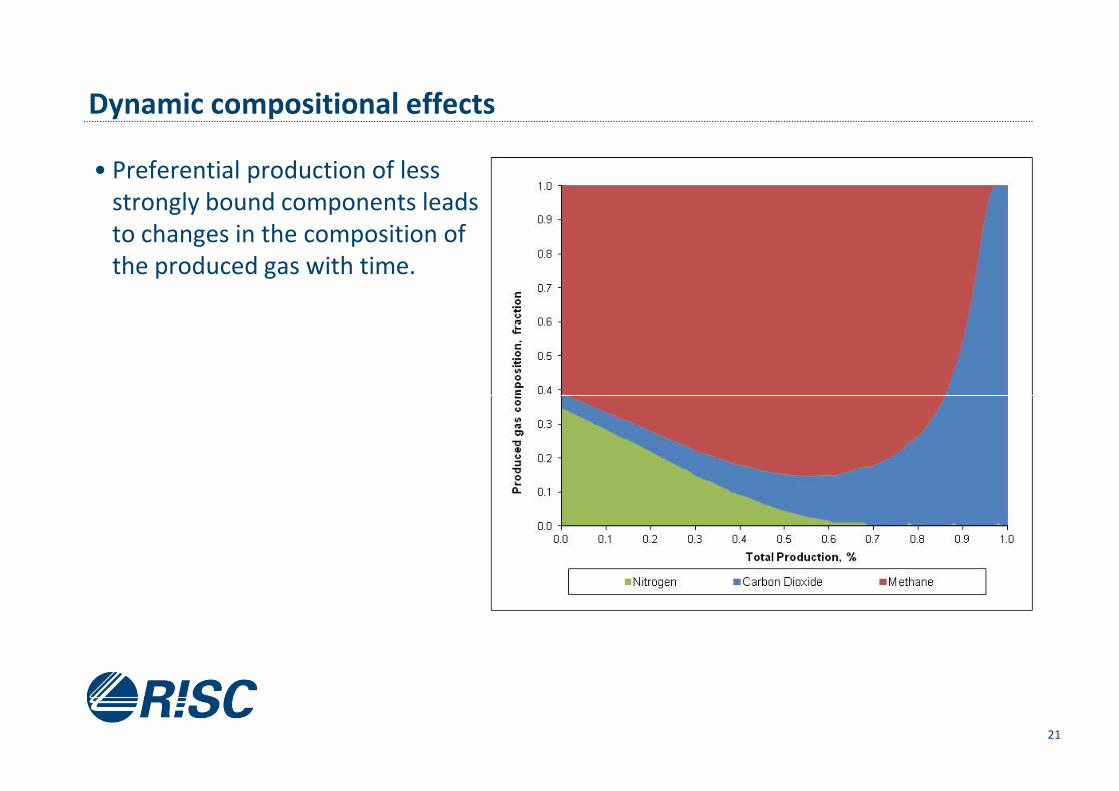
Dynamic compositional effects
• Preferential production of less
strongly bound components leads
to changes in the composition of
the produced gas with time.
21

Data Gathering &
Data Types
22
Data Types
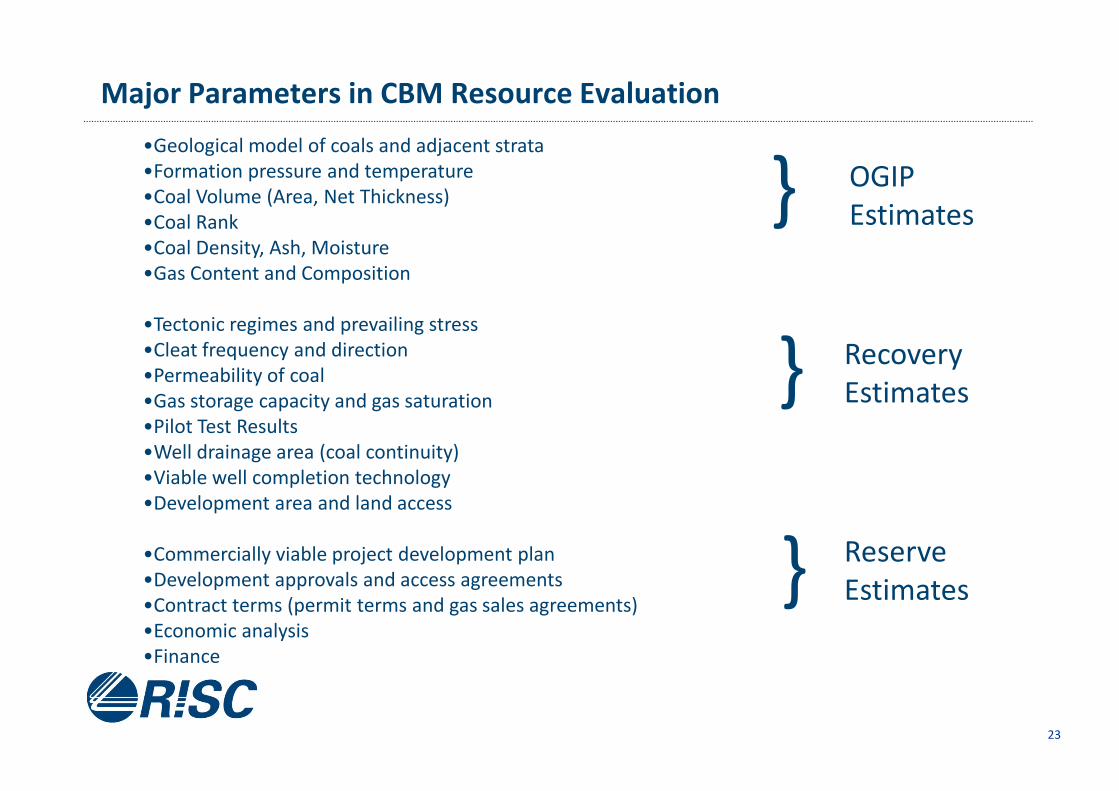
Major Parameters in CBM Resource Evaluation
}
}
OGIP
Estimates
Recovery
Estimates
•Geological model of coals and adjacent strata
•Formation pressure and temperature
•Coal Volume (Area, Net Thickness)
•Coal Rank
•Coal Density, Ash, Moisture
•Gas Content and Composition
•Tectonic regimes and prevailing stress
•Cleat frequency and direction
•Permeability of coal
•Gas storage capacity and gas saturation
23
} Estimates
Reserve
Estimates
•Gas storage capacity and gas saturation
•Pilot Test Results
•Well drainage area (coal continuity)
•Viable well completion technology
•Development area and land access
•Commercially viable project development plan
•Development approvals and access agreements
•Contract terms (permit terms and gas sales agreements)
•Economic analysis
•Finance
}
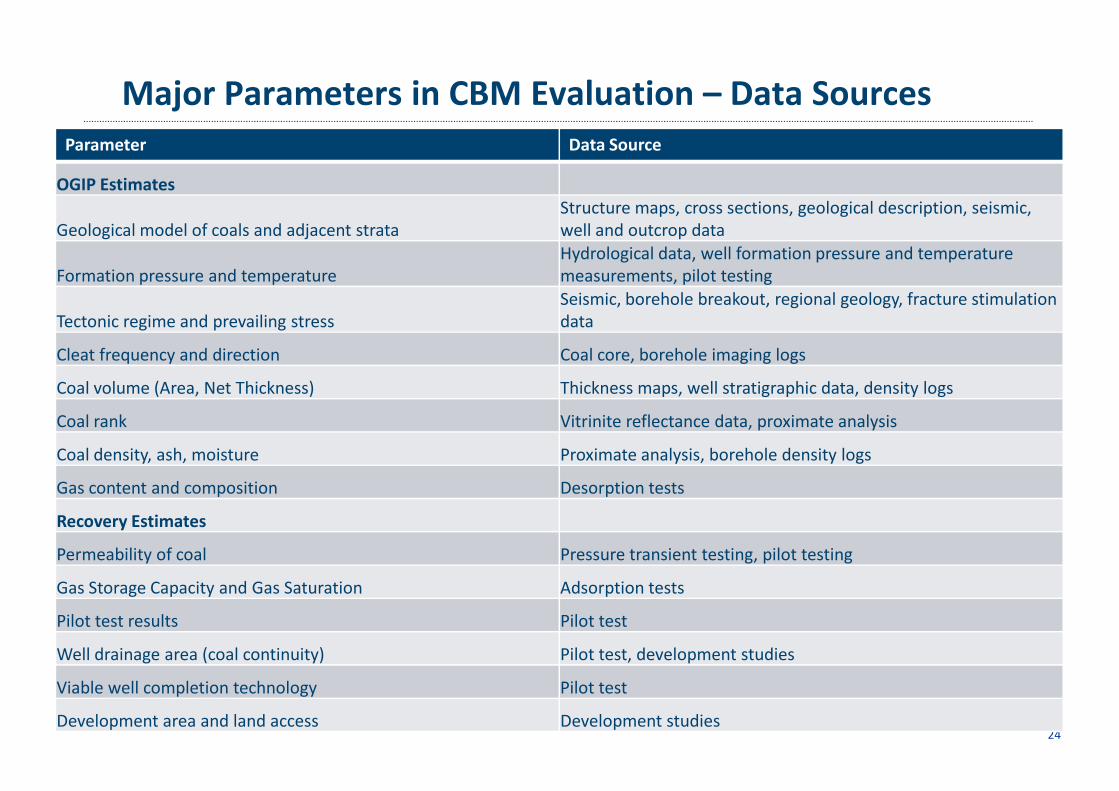
Major Parameters in CBM Evaluation – Data Sources
Parameter Data Source
OGIP Estimates
Geological model of coals and adjacent strata
Structure maps, cross sections, geological description, seismic,
well and outcrop data
Formation pressure and temperature
Hydrological data, well formation pressure and temperature
measurements, pilot testing
Tectonic regime and prevailing stress
Seismic, borehole breakout, regional geology, fracture stimulation
data
Cleat frequency and direction Coal core, borehole imaging logs
Coal volume (Area, Net Thickness) Thickness maps, well stratigraphic data, density logs
24
Coal volume (Area, Net Thickness) Thickness maps, well stratigraphic data, density logs
Coal rank Vitrinite reflectance data, proximate analysis
Coal density, ash, moisture Proximate analysis, borehole density logs
Gas content and composition Desorption tests
Recovery Estimates
Permeability of coal Pressure transient testing, pilot testing
Gas Storage Capacity and Gas Saturation Adsorption tests
Pilot test results Pilot test
Well drainage area (coal continuity) Pilot test, development studies
Viable well completion technology Pilot test
Development area and land access Development studies
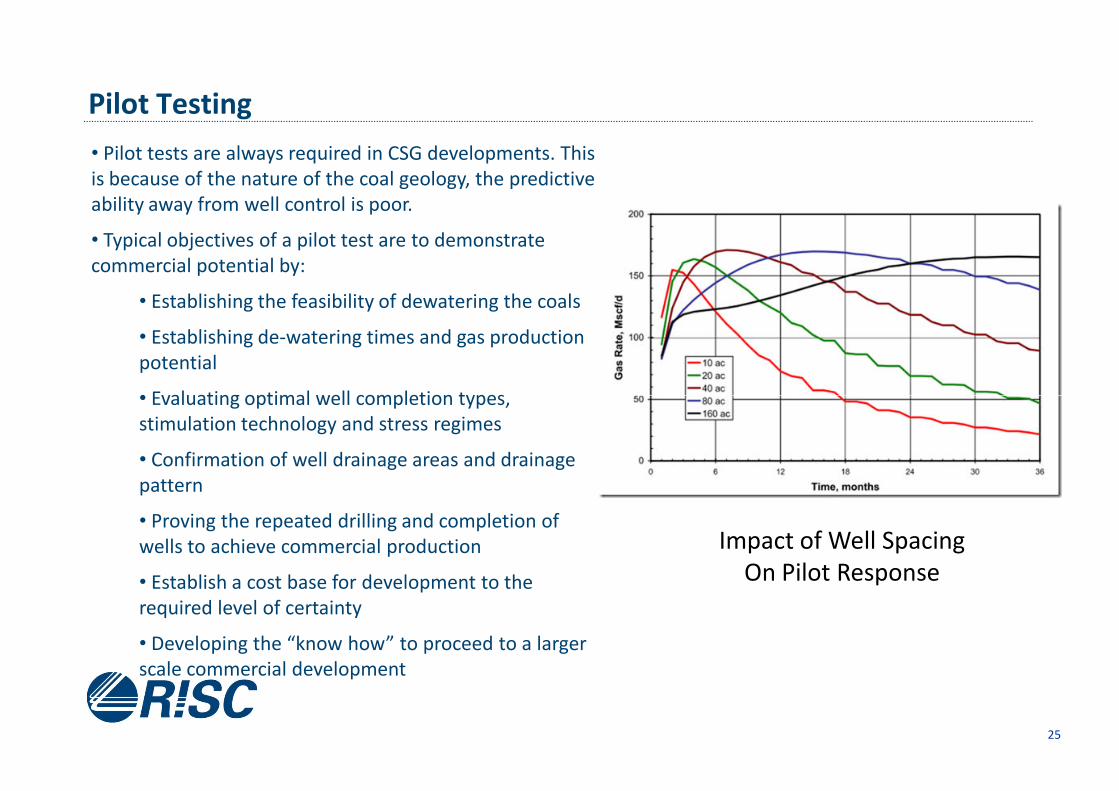
Pilot Testing
• Pilot tests are always required in CSG developments. This
is because of the nature of the coal geology, the predictive
ability away from well control is poor.
• Typical objectives of a pilot test are to demonstrate
commercial potential by:
• Establishing the feasibility of dewatering the coals
• Establishing de-watering times and gas production
potential
• Evaluating optimal well completion types,
25
• Evaluating optimal well completion types,
stimulation technology and stress regimes
• Confirmation of well drainage areas and drainage
pattern
• Proving the repeated drilling and completion of
wells to achieve commercial production
• Establish a cost base for development to the
required level of certainty
• Developing the “know how” to proceed to a larger
scale commercial development
Impact of Well Spacing
On Pilot Response
E&P Project Lifecycle – CSG Continuous Cycle Perspective
AppraiseExplore
ImplementManage
26
DevelopProduce
MonitorAdapt

Geomechanics
27
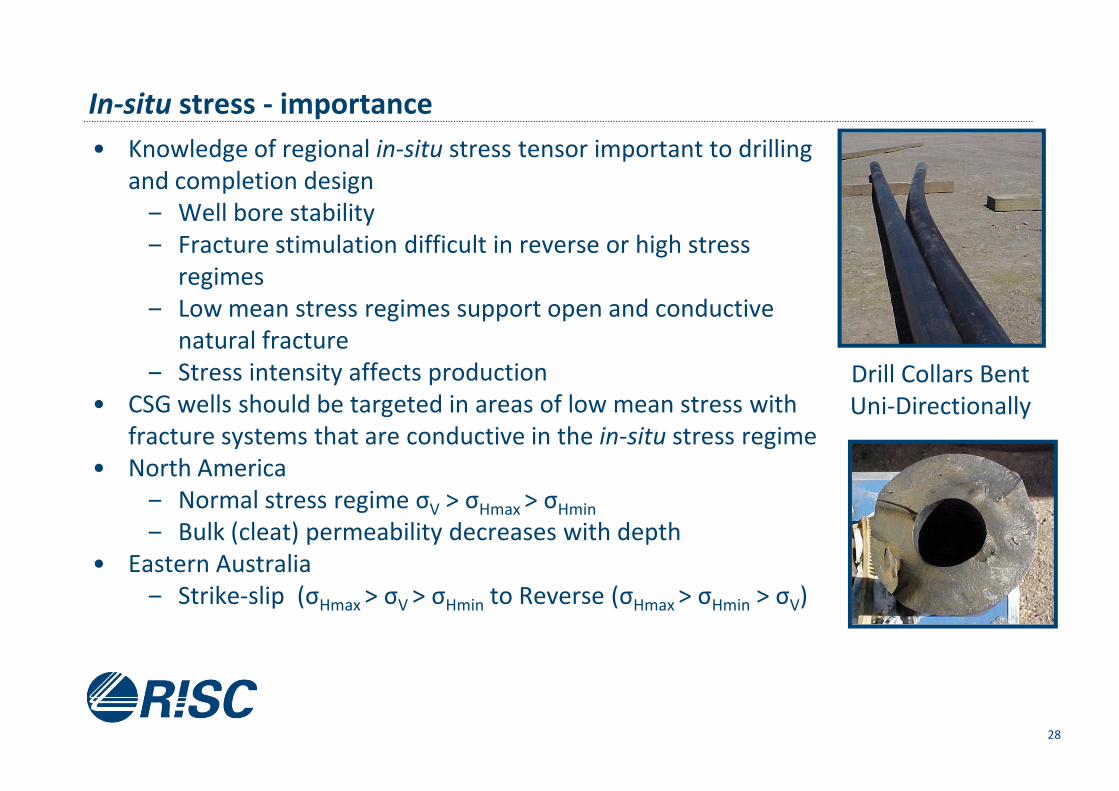
In-situ stress - importance
• Knowledge of regional in-situ stress tensor important to drilling
and completion design
‒ Well bore stability
‒ Fracture stimulation difficult in reverse or high stress
regimes
‒ Low mean stress regimes support open and conductive
natural fracture
‒ Stress intensity affects production
• CSG wells should be targeted in areas of low mean stress with Drill Collars Bent
Uni-Directionally
28
• CSG wells should be targeted in areas of low mean stress with
fracture systems that are conductive in the in-situ stress regime
• North America
‒ Normal stress regime σV > σHmax > σHmin
‒ Bulk (cleat) permeability decreases with depth
• Eastern Australia
‒ Strike-slip (σHmax > σV > σHmin to Reverse (σHmax > σHmin > σV)
Uni-Directionally
In-situ Stress Tensor Characterisation
• Can vary vertically and laterally depending upon rock strength and structural history
• Vertical stress variation characterised from well bore measurements
‒ Vertical stress magnitude from integration of density log to surface
‒ Maximum horizontal stress:– magnitude from rock strength tests and calibrated mechanical logs
– Orientation from image logs
‒ Minimum horizontal stress:– magnitude from leak off tests, mini-frac
– Orientation from image log
29
– Orientation from image log
• Areal stress variation from measurements in many well bores and structural
analysis (seismic)

Impact of Stress on Completions & Fracturing
Scotia 15 (high stress) fraccing difficulties, screenout, no flowback (H20frac)
• 3D stress geometry modelled using a boundary element algorithm
30
Scotia 14 (low stress) fracced successfully, strong flowback (H20frac), 3MMcf/d after snubbing
Scotia 10 (low stress) fracced successfully, 7.8 MMcf/d (N-frac)

• Natural fracture system orientation identified from image logs
• Structure restored to pre-deformational geometry and forward modelled to present stress state
• Strain associated with folding captured and used to develop natural fracture distributions
Natural Fracture Modelling
31
distributions
Coal Seam Fractures

Structural & Depth Effects
Structural effects on Permeability
32
Depth effects on Permeability
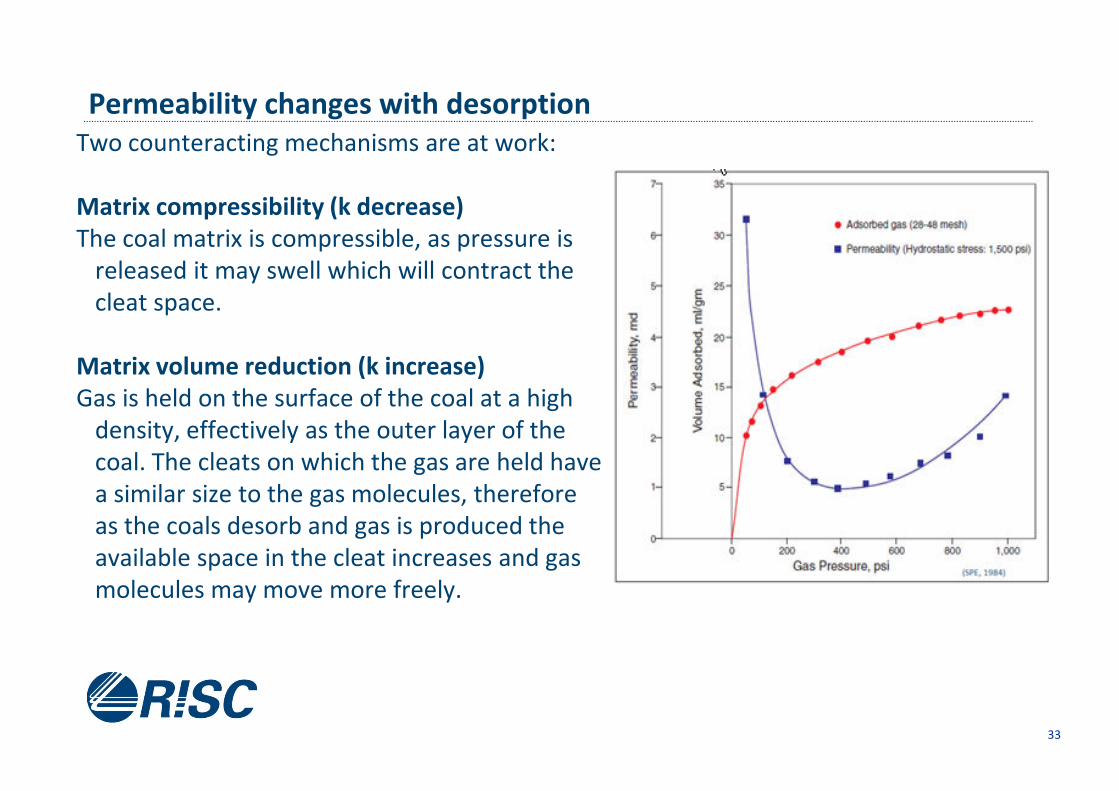
Permeability changes with desorption
Two counteracting mechanisms are at work:
Matrix compressibility (k decrease)
The coal matrix is compressible, as pressure is
released it may swell which will contract the
cleat space.
Matrix volume reduction (k increase)
Gas is held on the surface of the coal at a high
33
Gas is held on the surface of the coal at a high
density, effectively as the outer layer of the
coal. The cleats on which the gas are held have
a similar size to the gas molecules, therefore
as the coals desorb and gas is produced the
available space in the cleat increases and gas
molecules may move more freely.
Well Design & Recovery
34
Well Design & Recovery

Vertical Well Types
Cavitation
• compressed air is used to cavitate the coal seam
• increases the effective well bore radius and improves
inflow efficiency
• removes coal damaged by drilling fluids
Under-reaming
• uses specialised drilling but to open out borehole
diameter in coal to 0.3m diameter or greater
• increases the effective well bore radius and improves
inflow efficiency
35
inflow efficiency
• Can be used with gravel packed screens to eliminate
fines production
Fracture stimulation
• uses high pressure water with additives to fracture
the coal and proppants to keep the fracture open
• increases the effective well bore radius and improves
inflow efficiency, bypasses drilling damage
• connects up cleats and natural fractures to the
wellbore
Can be single seam or multi-seam

Horizontal Wells & Multi Laterals
Short, medium radius or surface to in-seam
• Used in lower permeability or thinner seams
• In short and medium radius wells, horizontal section
achieved by using direction drilling technology from
existing well bore
• In surface to in-seam wells, a “slant” rig is used to
drilled from the surface to the seam, building hole
angle as the well proceeds
• Horizontal sections of 1000m in-seam targeting
seams with a thickness as low as 2m have been
Ref D Matthew, CH4 Ltd 7/5/2005
36
seams with a thickness as low as 2m have been
achieved at depths of 1000m.
Single lateral
• one horizontal borehole
Multi-lateral
• two or more laterals in a seam
Multi-lateral stacked
• two or more laterals in separate seams
Source Eastern Star Gas
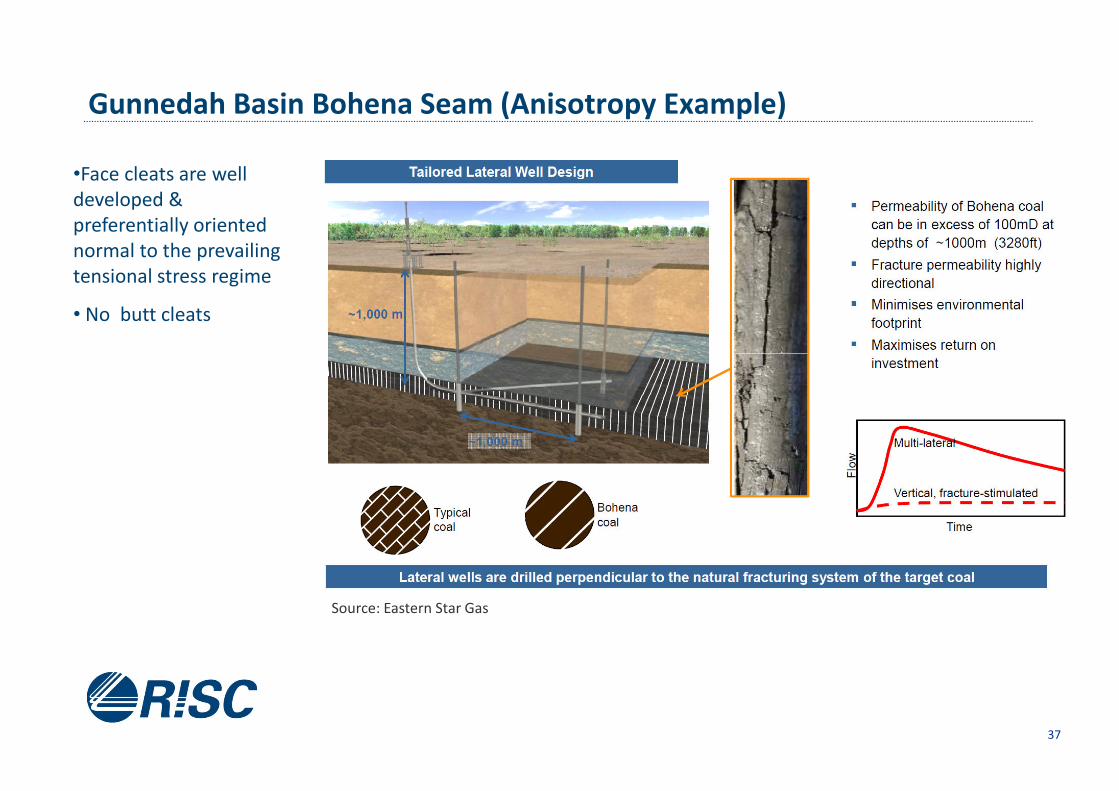
Gunnedah Basin Bohena Seam (Anisotropy Example)
•Face cleats are well
developed &
preferentially oriented
normal to the prevailing
tensional stress regime
• No butt cleats
37
Source: Eastern Star Gas
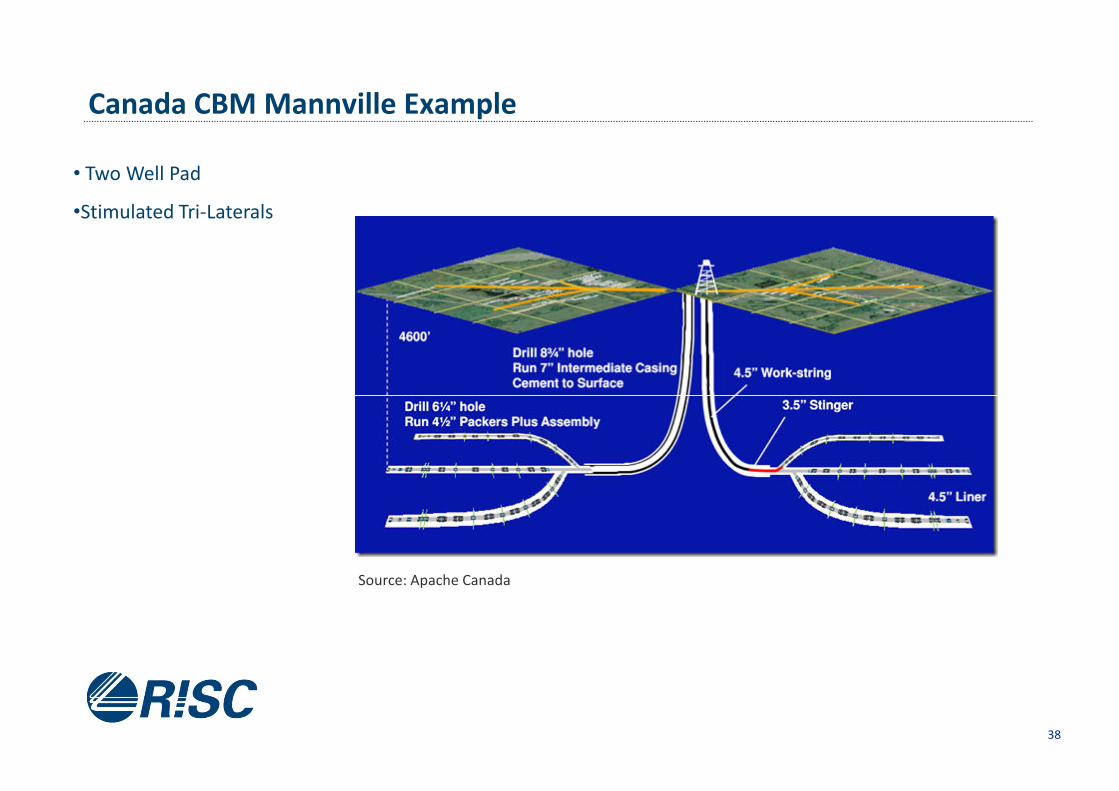
Canada CBM Mannville Example
• Two Well Pad
•Stimulated Tri-Laterals
38
Source: Apache Canada
Comments on CBM Drilling Technology
Fracture stimulation
• Fracture stimulation significantly increases costs (will probably need re-fraccing?)
• Needs competent coals (soft coal fracs won’t stay open); isolation from aquifers
• Horizontal Wells
•Much higher costs; suited to lower permeability coals or where land access is an issue
• Boreholes can become blocked with fines and / or borehole collapse increasing costs for clean
out or reducing efficiency
39
out or reducing efficiency
•Multi-lateral wells create a reservoir management issue – you may not know where the gas is
coming from therefore may not know where the remaining gas is if you need to drill infill wells.
•Geosteering technology no means that targeting seams +/2m thick with 1000m laterals now
feasible
Learning Curve
•Large well numbers in CBM developments make continuous improvement possible
•Santos Surat basin example 40% reduction in one year (see next page)
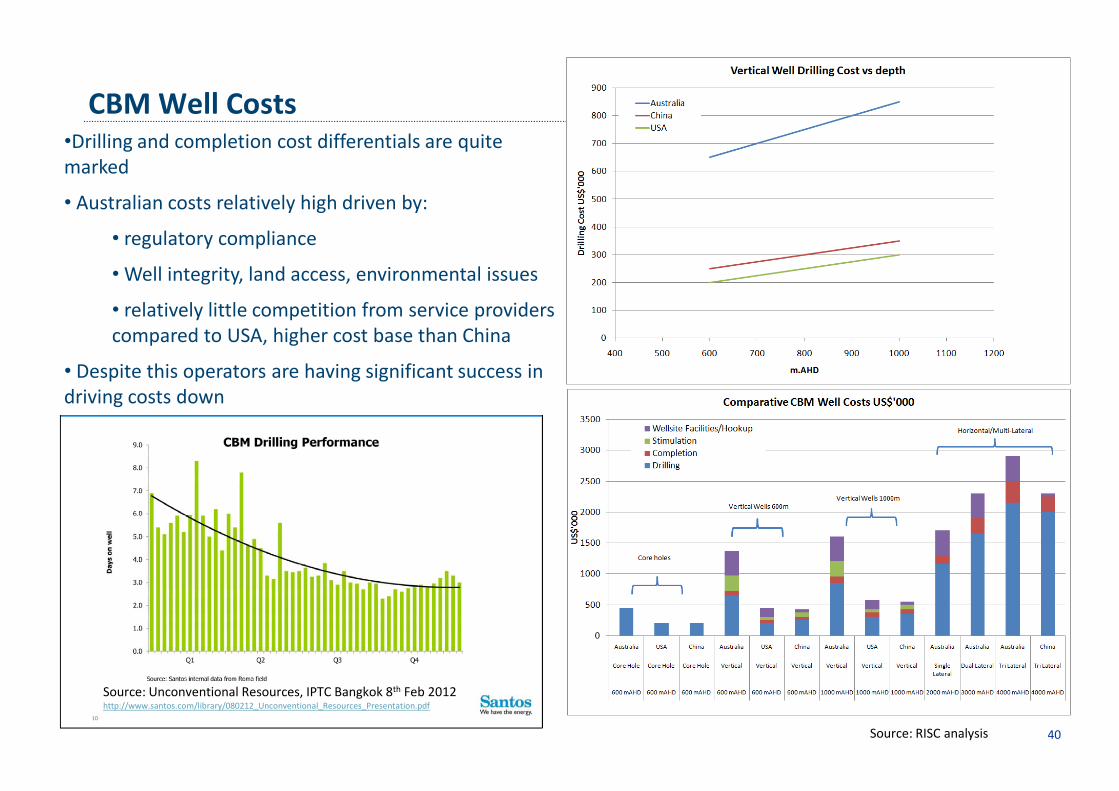
CBM Well Costs•Drilling and completion cost differentials are quite
marked
• Australian costs relatively high driven by:
• regulatory compliance
•Well integrity, land access, environmental issues
• relatively little competition from service providers
compared to USA, higher cost base than China
• Despite this operators are having significant success in
driving costs down
40
driving costs down
Source: Unconventional Resources, IPTC Bangkok 8th Feb 2012http://www.santos.com/library/080212_Unconventional_Resources_Presentation.pdf
Source: RISC analysis

Thank You
41
Any Questions?

L3 / 1138 Hay Street
WEST PERTH WA 6005
P. +61 8 9420 6660
F. +61 8 9420 6690
L2 / 147 Coronation Drive
MILTON QLD 4064
P. +61 7 3025 3369
F. +61 7 3025 3300
53 Chandos Place, Covent Garden
LONDON WC2N 4HS
P. +44 20 7484 8740
F. +44 20 7812 6677
w w w . r i s c a d v i s o r y . c o m
E. [email protected] E. [email protected] E. [email protected]


