Cav2.2 and Cav3.1 Calcium Channel Inhibitors from ...
30
Cav2.2 and Cav3.1 Calcium Channel Inhibitors from Valeriana jatamansi Jones He-Hai Jiang,P a,c, P† Fa-Wu Dong,P b,d, P† Jun Zhou,P b P Jiang-Miao Hu,P b,* P Jian-Yang,P a,* PYin NianP a,* P a PKey Laboratory of Bioactive Peptides of Yunnan Province/Key Laboratory of Animal Models and Human Disease Mechanisms of Chinese Academy of Sciences, and Ion Channel Research and Drug Development Center, Kunming Institute of Zoology, Chinese Academy of Sciences, Kunming 650223, P. R. China. P b PState Key Laboratory of Phytochemistry and Plant Resources in West China, Kunming Institute of Botany, Chinese Academy of Sciences, Kunming 650201, People’s Republic of China. P c PFaculty of Life Science and Technology, Kunming University of Science and Technology, Kunming, 650504, People’s Republic of China. P d PFaculty of Pharmacy, Yunnan University of Traditional Chinese Medicine, Kunming 650500, People’s Republic of China. 1 Electronic Supplementary Material (ESI) for RSC Advances. This journal is © The Royal Society of Chemistry 2017
Transcript of Cav2.2 and Cav3.1 Calcium Channel Inhibitors from ...

Cav2.2 and Cav3.1 Calcium Channel Inhibitors from Valeriana
jatamansi Jones
He-Hai Jiang,P
a,c,P† Fa-Wu Dong,P
b,d,P† Jun Zhou,P
bP Jiang-Miao Hu,P
b,*P Jian-Yang,P
a,* PYin
NianP
a,*
P
aPKey Laboratory of Bioactive Peptides of Yunnan Province/Key Laboratory of Animal
Models and Human Disease Mechanisms of Chinese Academy of Sciences, and Ion
Channel Research and Drug Development Center, Kunming Institute of Zoology,
Chinese Academy of Sciences, Kunming 650223, P. R. China.
P
bPState Key Laboratory of Phytochemistry and Plant Resources in West China,
Kunming Institute of Botany, Chinese Academy of Sciences, Kunming 650201,
People’s Republic of China.
P
cPFaculty of Life Science and Technology, Kunming University of Science and
Technology, Kunming, 650504, People’s Republic of China.
P
dPFaculty of Pharmacy, Yunnan University of Traditional Chinese Medicine, Kunming
650500, People’s Republic of China.
1
Electronic Supplementary Material (ESI) for RSC Advances.This journal is © The Royal Society of Chemistry 2017

Supporting Information List
Page 1, The structures of compounds 14 and 15.
Page 4-9, 1D and 2D NMR, ESIMS, HRESIMS, IR, UV and [a]RDR spectra of compound 1.
Page 10-15, 1D and 2D NMR, ESIMS, HRESIMS, IR, UV and [a]RDR spectra of compound 2.
Page 16-21, 1D and 2D NMR, ESIMS, HRESIMS, IR, UV and [a]RDR spectra of compound 3.
Page 22, Dose-related effects of compounds 1, 6, 7, 11, and 12 on peak currents of CaRvR2.2.
Page 23, Inhibitory effects of compounds 1-12 on CaRvR2.2 at 30 μM.
Page 24, Inhibitory effects of compounds 1, 4, 5, 6, 7, 9, 10, 11, and 12 on CaRvR3.1 at 30 μM.
Page 25, Normalized current-voltage (I-V) curves of CaRvR1.2 in the absence or presence of compounds 1-13.
Page 26, Normalized current-voltage (I-V) curves of CaRvR2.1 in the absence or presence of compounds 1-13.
Page 27, Normalized current-voltage (I-V) curves of CaRvR2.2 in the absence or presence of compounds 1-13.
Page 28, Normalized current-voltage (I-V) curves of CaRvR3.1 in the absence or presence of compounds 1-13.
Page 29, Normalized current-voltage (I-V) curves of KNCH2 in the absence or presence of compounds 1-13.
Page 30, The inhibitory effects of Mibefradil (the commercial T-type calcium channel inhibitor) and ω-Conotoxin MVIIA (the commercial N-type calcium channel inhibitor) on CaRvR3.1 and CaRvR2.2, respectively.
2

Figure S1 Structures of compounds 14 and 15
3

Figure S2. ESIMS of velerivaltrate A (1).
Figure S3. HRESIMS of velerivaltrate A (1).
4

Figure S4. P
1PH NMR (600 MHz, CDClR3R) of velerivaltrate A (1).
Figure S5. P
13PC NMR (100 MHz, CDClR3R) of velerivaltrate A (1).
5

Figure S6. HSQC (600 MHz, CDClR3R) of velerivaltrate A (1).
Figure S7. HMBC (600 MHz, CDClR3R) of velerivaltrate A (1).
6
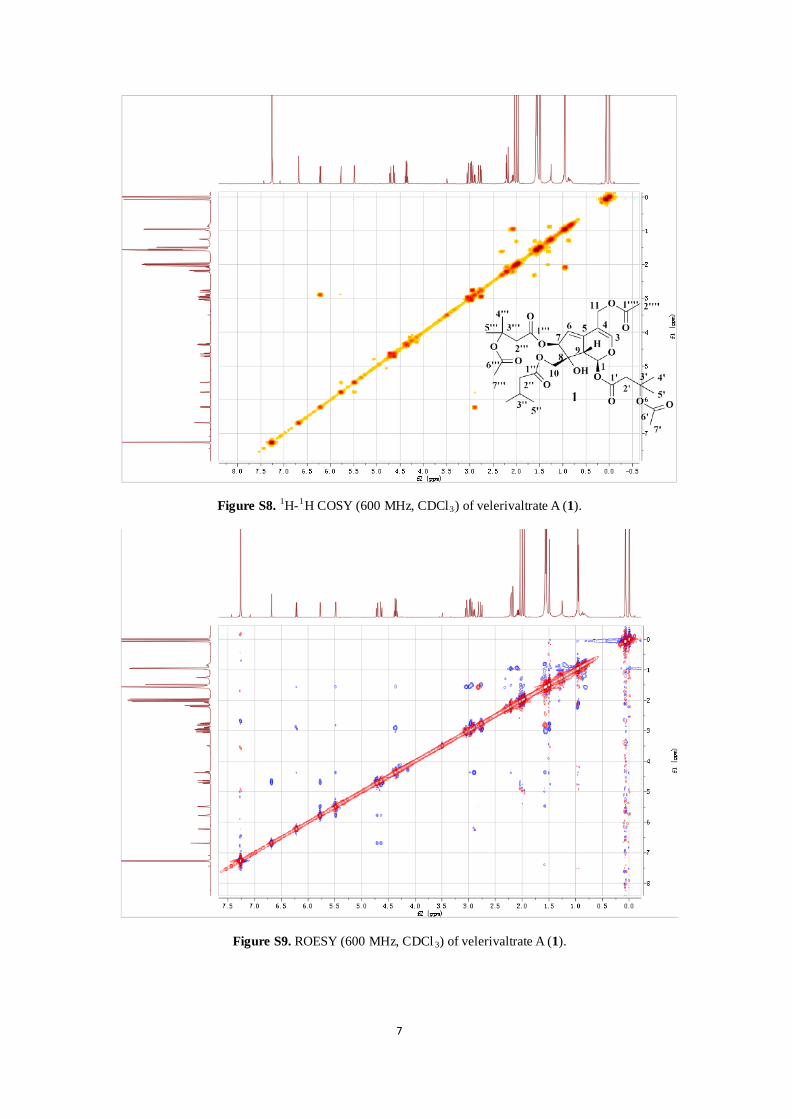
Figure S8. P
1PH-P
1PH COSY (600 MHz, CDClR3R) of velerivaltrate A (1).
Figure S9. ROESY (600 MHz, CDClR3R) of velerivaltrate A (1).
7

Figure S10. IR spectrum of velerivaltrate A (1).
Figure S11. UV spectrum of velerivaltrate A (1).
8

Figure S12. [a]RD Rspectrum of velerivaltrate A (1).
9

Figure S13. ESIMS of velerivaltrate B (2).
Figure S14. HRESIMS of velerivaltrate B (2). 10

Figure S15. P
1PH NMR (600 MHz, CDClR3R) of velerivaltrate B (2).
Figure S16. P
13PC NMR (100 MHz, CDClR3R) of velerivaltrate B (2).
11

Figure S17. HSQC (600 MHz, CDClR3R) of velerivaltrate B (2).
Figure S18. HMBC (600 MHz, CDClR3R) of velerivaltrate B (2).
12

Figure S19. P
1PH-P
1PH COSY (600 MHz, CDClR3R) of velerivaltrate B (2).
Figure S20. ROESY (600 MHz, CDClR3R) of velerivaltrate B (2).
13

Figure S21. IR spectrum of velerivaltrate B (2).
Figure S22. UV spectrum of velerivaltrate B (2).
14

Figure S23. [a]RD Rspectrum of velerivaltrate B (2).
15

Figure S24. ESIMS of velerivaltrate C (3).
Figure S25. HRESIMS of velerivaltrate C (3).
16

Figure S26. P
1PH NMR (600 MHz, CDClR3R) of velerivaltrate C (3).
Figure S27. P
13PC NMR (100 MHz, CDClR3R) of velerivaltrate C (3).
17

Figure S28. HSQC (600 MHz, CDClR3R) of velerivaltrate C (3).
Figure S29. HMBC (600 MHz, CDClR3R) of velerivaltrate C (3).
18

Figure S30. P
1PH-P
1PH COSY (600 MHz, CDClR3R) of velerivaltrate C (3).
Figure S31. ROESY (600 MHz, CDClR3R) of velerivaltrate C (3).
19

Figure S32. IR spectrum of velerivaltrate C (3).
Figure S33. UV spectrum of velerivaltrate C (3).
20

Figure S34. [a]RD Rspectrum of velerivaltrate C (3).
21

Table S1. Dose-related effects of compounds 1, 6, 7, 11, and 12 on peak currents of CaRvR2.2.
compounds concentration (μM) Inhibitory ratio (%)
Blank control 0.1% DMSO 1.2±0.8
1 1 7.3±3.1P
*
3 21.7±7.P
P3P
*
10 55.9±3.3P
*
30 59.9±5.2P
*
60 64.3±3.9P
**
6 0.6 9.5±2.5P
*
1 23.3±2.9P
**
3 38.2±2.8P
**
10 56.8±5.7P
**
30 61.1±7.8P
*
7 0.3 2.5±1.4
1 30.6±4.4P
**
3 51.4±8.4P
**
10 59.3±5.4P
*
30 57.2±7.1P
*
11 0.3 3.6±2.10
1 9.5±0.9P
*
3 36.1±1.9P
**
10 63.1±1.0P
**
30 63.9±3.9P
**
12 0.6 3.9±2.7
3 17.7±7.7P
*
10 37.0±6.9P
**
30 61.8±6.7P
**
60 47.9±1.7P
**
All the data were analyzed with two-tailed student T test and represented as mean ± SEM (n=3)
compared with the blank control, *P < 0.01, **P < 0.01.
22

Figure S35. Inhibitory effects of compounds 1-12 on CaRvR2.2 at 30 μM. Representative peak current of
CaRvR2.2 were evoked from a holding potential (HP) of -80 mV by 50 ms depolarization to + 20 mV at 3 s
intervals in the absence or presence of the indicated compounds.
23

Figure S36. Inhibitory effects of compounds 1, 4, 5, 6, 7, 9, 10, 11, and 12 on CaRvR3.1 at 30 μM.
Representative peak current of CaRvR3.1 were evoked from a holding potential (HP) of -80 mV by 50 ms
depolarization to -10 mV at 3 s intervals in the absence or presence of the indicated compounds.
24

S22
Figure S37. Normalized current-voltage (I-V) curves of CaRvR1.2 in the absence or presence of
compounds 1-13. CaRvR1.2 Currents were evoked from a holding potential (HP) of -80 mV by 50 ms
depolarization from -30 mV to + 70 mV at 3 s intervals. All the data were analyzed with two-tailed
student T test and represented as mean ± SEM (n=3). *P<0.05, compared with the absence of the
indicated compounds.
25

Figure S38. Normalized current-voltage (I-V) curves of CaRvR2.1 in the absence or presence of
compounds 1-13. CaRvR2.1 currents were evoked from a holding potential (HP) of -80 mV by 50 ms
depolarization from -30 mV to + 70 mV at 3 s intervals. All the data were analyzed with tow-tailed
student T test and represented as mean ± SEM (n=3). *P<0.05, compared with the absence of the
indicated compounds.
26
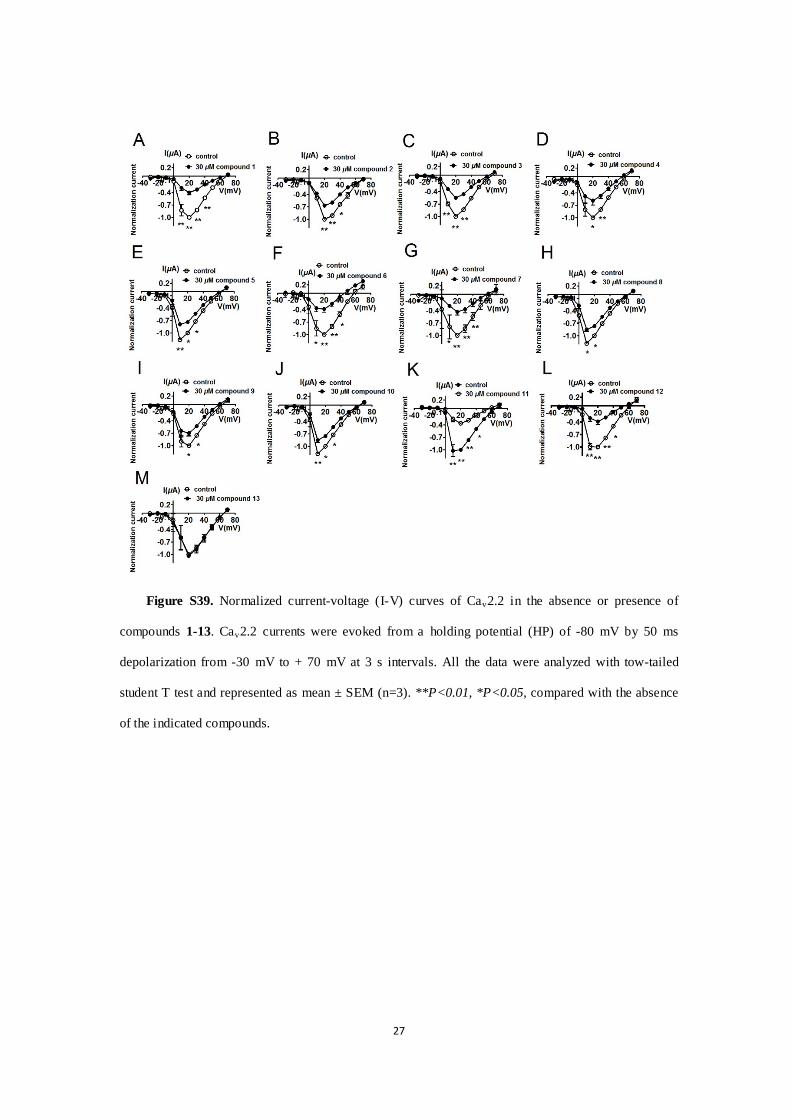
Figure S39. Normalized current-voltage (I-V) curves of CaRvR2.2 in the absence or presence of
compounds 1-13. CaRvR2.2 currents were evoked from a holding potential (HP) of -80 mV by 50 ms
depolarization from -30 mV to + 70 mV at 3 s intervals. All the data were analyzed with tow-tailed
student T test and represented as mean ± SEM (n=3). **P<0.01, *P<0.05, compared with the absence
of the indicated compounds.
27

Figure S40. Normalized current-voltage (I-V) curves of CaRvR3.1 in the absence or presence of
compounds 1-13. CaRvR3.1 currents were evoked from a holding potential (HP) of -80 mV by 50 ms
depolarization from -50 mV to + 60 mV at 3 s intervals. All the data were analyzed with tow-tailed
student T test and represented as mean ± SEM (n=3). **P<0.01, *P<0.05, compared with the absence
of the indicated compounds.
28

Figure S41. Normalized current-voltage (I-V) curves of KNCH2 in the absence or presence of
compounds 1-13. KCNH2 were pretreated by indicated compounds for 1 s and then currents were
evoked from a holding potential (HP) of -80 mV by 3 s depolarization from -120 mV to + 40 mV at 30 s
intervals. All the data were analyzed with tow-tailed student T test and represented as mean ± SEM
(n=3), compared with the absence of the indicated compounds.
29

Figure S42. The inhibitory effects of Mibefradil (the commercial T-type calcium channel inhibitor)
and ω-Conotoxin MVIIA (the commercial N-type calcium channel inhibitor) on CaRvR3.1 and CaRvR2.2,
respectively. (A) Representative CaRvR3.1 current trace evoked by 50-ms depolarizations to −10 mV at 3-s
intervals from a holding potential (HP) of −80 mV in the absence and presence of mibefradil. CaRvR3.1
was expressed in Xenopus oocytes; (B) Dose-response relationship of mibefradil inhibition of CaRvR3.1.
Data points represent mean±S.E.M. of three measurements at HP of −80 mV. Solid curve represents a fit
to the Hill equation with an ICR50Rvalue of 10.4µM and a Hill coefficient of 1.6; (C) Representative
CaRvR2.2 current trace evoked by 50-ms depolarizations to +20 mV at 3-s intervals from a holding
potential (HP) of −80 mV in the absence and presence of ω-Conotoxin MVIIA. CaRvR2.2 was expressed in
Xenopus oocytes; (D) Normalized current-voltage (I-V) curves of CaRvR2.2 in the absence or presence of
the indicated concentrations of ω-conotoxin MVIIA. Results were obtained in 3 cells.
30